在脚本中搜索"daily"

MY_CME eod OI vs CFTC eow OIDaily e-o-d Open Interest as published by CME.
As CFTC COT Open Interest relates to last Tuesday, here you can have an idea how things evolved day-by-day since then.
As CME total OI is not accessibl as data, here I sum OI of the next 9 outstanding contracts, which gives a fair idea of the trend in OI


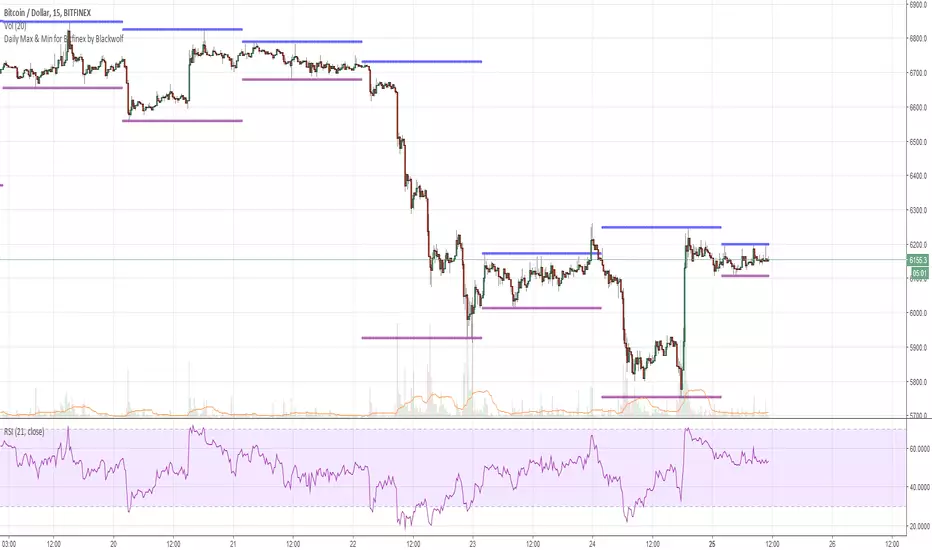
Daily Max & Min for Bitfinex by BlackwolfThis script shows the min and max price level of each day. It can be used also for support and resistance level.
Lo script mostra il prezzo massimo e minimo raggiunto nelle 24 ore. può essere utilizzato come idea per supporti e resistenze
MTF EMA Combo with Background ColorDaily/Weekly EMA combo for longer term trend direction, with combo background color for varying trend direction.

CMGB Pivot PointsDaily and weekly pivots.
Setting: specify how many candles are in a day (in the time frame you are using)
For example for 15m TF there are 91 (not 96) candles. When you get the number right, the lines will align nicely.


Daily SARThe image describes how to use the indicator fairly well, and I used 1 minute candles here, but it's best used on 1H candles.
There's a little bit of noise as the SAR updates, you can expect two movements before it settles. Ignore the first one, it is largely irrelevant except as a signal that the real movement is about to occur (and a hint at which direction).


Daily Average True Range OverlayPlots the upper and lower average true range away from the previous days close on all time frames.

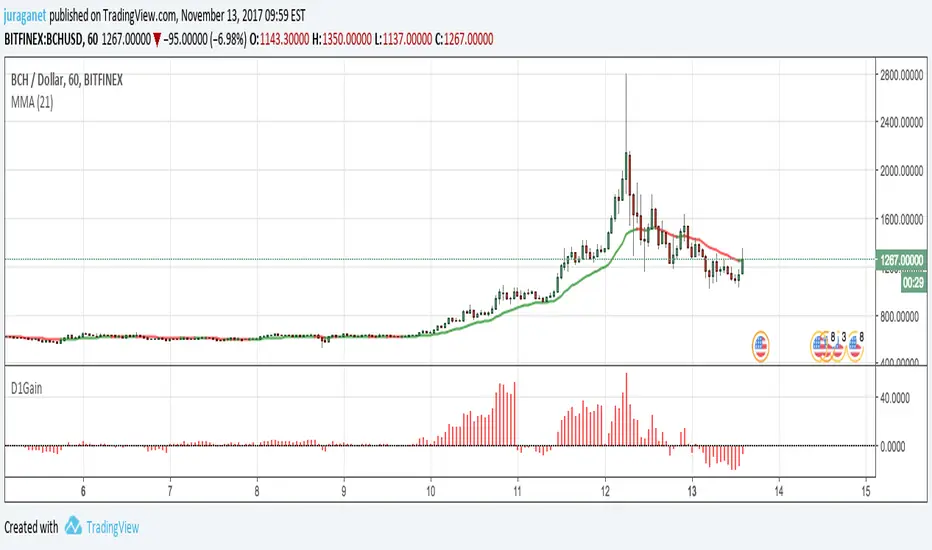
Daily GainPlot today's gain (%) of current security. It's a value of increase/decrease of current price compared to today's 00:00:00 candle open price.
I'm open for idea to improve this script. Drop me message or email to juraganet@gmail.com.
Daily one take and put toolthis script have two line
Each line acts as a line of support and resistance
판매용이 아닙니다. 댓글 남기시고 사용하세요~
사용법은 blog.naver.com

Daily Deviations (Lazy Edition)
Plots the standard deviation resistance/support lines.
Uses Previous days close and the VIX as the volatility factor.
credit to u/UberBotMan and u/Living_Granger for the idea and formulas

Daily Deviations (Self Input Version)
Plots the standard deviation resistance/support levels.
Input the previous settlement price and the implied volatility.
credit to u/UberBotMan and u/Living_Granger for the idea and formulas
(preview example is using settlement of 2420 and IV of 11)


Daily Returns & STDWhat happened last time when xx increased by xx%? - Start collecting some stats!
You can choose the ticker and the timeframe you're interested in

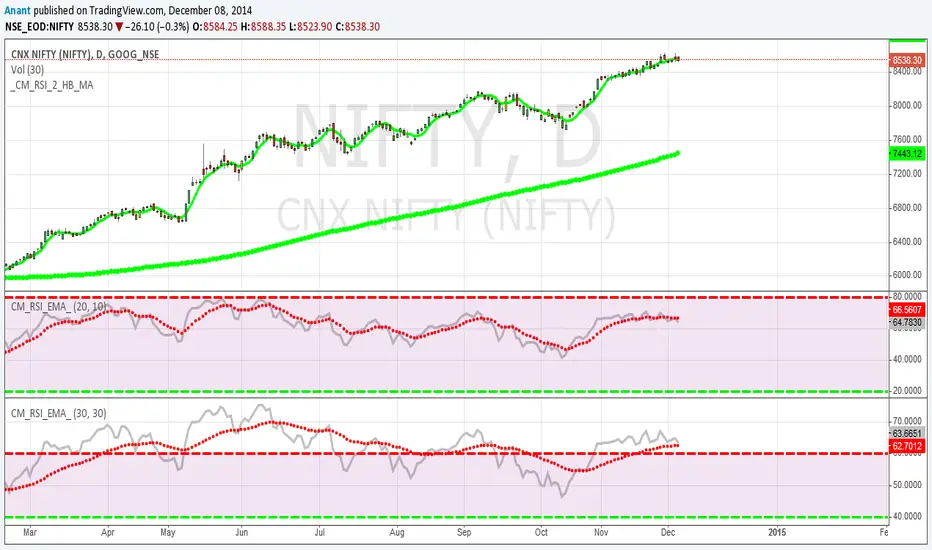
RSI Oversold/UndersoldThe study script will place GREEN BUY arrows BELOW oversold conditions and RED SHORT arrows ABOVE overbought conditions. You can configure the period
Most RSI(14) indicators use a 14-period, I prefer a 5-period. The period, overbought and oversold periods are settings that can easily be changed by adding this study to your chart and clicking the "gear" icon next to the study inside your chart.


Daily SMAThis pine script on intraday chart is exactly the same SMA as built-in MovingAverage on a 1Day chart (with the same lengths)


Quantum EdgeQuantum Edge
DESCRIPTION:
Time-based cycle alignment scanner using fractal cycle theory to detect when multiple timing cycles converge at mathematically significant zones.
█ OVERVIEW
Quantum Edge is a time-based cycle alignment scanner built on fractal cycle theory. Markets move in nested cycles across multiple timeframes. This indicator detects moments when several of these cycles simultaneously reach mathematically significant positions, creating potential turning points.
The core concept: when multiple independent timing cycles converge at key zones, the probability of a reaction increases. The more cycles aligned, the higher the probability score.
█ HOW IT WORKS
The indicator tracks multiple time-based cycles of varying lengths. Each cycle is analyzed for its current position within its phase. When a cycle reaches a statistically significant zone (based on cycle theory), it contributes points to a composite probability score.
Shorter cycles contribute fewer points (they align frequently).
Longer cycles contribute more points (they align rarely).
Additional weighting is applied for:
- Specific days of the week known for higher volatility
- Specific times of day associated with market structure shifts
The final score represents how many timing factors are currently aligned.
█ SIGNALS EXPLAINED
👑 Rare multi-cycle convergence — Several long-duration cycles aligned simultaneously. Occurs a few times per month.
💎 Strong convergence — Multiple mid-to-long duration cycles aligned. Occurs a few times per week.
🌅 Daily cycle alignment — Daily-length cycle at a key zone with supporting factors. Occurs 1-2 times per day.
🔥 Short cycle alignment — Shorter-duration cycles aligned. Occurs several times per day.
🔮 Prediction — The indicator scans ahead and displays where future alignments are likely to occur based on the deterministic nature of time cycles.
█ TRADING MODES
The indicator includes preset modes that adjust sensitivity:
SNIPER — Only displays the highest-scoring alignments. For patient traders waiting for the best setups.
DAILY — Displays daily-quality alignments and above. Recommended starting point for most traders.
ACTIVE — Displays more frequent setups. For traders who want more opportunities and can filter with price analysis.
SCALP — Displays all qualifying alignments. Highest frequency, requires additional confirmation.
█ WHAT MAKES THIS UNIQUE
This indicator uses a proprietary weighted scoring system based on fractal cycle mathematics. The specific cycle lengths, zone calculations, and weighting factors are the result of extensive research into cyclical market behavior.
The predictive feature is deterministic — because time cycles are mathematical, future alignments can be calculated in advance. This allows traders to plan entries before setups occur rather than reacting after the fact.
The source is protected because the specific parameters and scoring logic represent significant research and development.
█ INTENDED USE
This is a TIMING tool, not a directional signal generator.
It answers: "When are multiple cycles aligned?"
It does NOT answer: "Which direction should I trade?"
Combine with your own price analysis (support/resistance, order flow, market structure) to determine direction. Use this tool to identify WHEN those setups have higher probability.
█ LIMITATIONS
- No indicator predicts the future with certainty
- Cycle alignments indicate probability, not guaranteed outcomes
- Past alignment results do not guarantee future performance
- This tool requires combination with price-based analysis for best results
- Not all alignments result in tradeable moves
█ SETTINGS
- Mode Selection: Choose your preferred sensitivity level
- Show Score: Toggle probability scores on/off
- Show Predictions: Toggle future alignment predictions on/off
- Prediction Range: How far ahead to scan for alignments
- Colors: Customize signal colors to your preference
█ MARKETS AND TIMEFRAMES
Works on any liquid market: Futures, Forex, Crypto, Stocks, Indices.
Optimized for intraday timeframes (1-15 minute charts) but can be applied to higher timeframes for swing trading applications.
█ ACCESS
This is an invite-only script. If you have questions about the methodology or would like to discuss access, you may send me a direct message.

Adaptive Scaled LevelsThis indicator allows users to manually define a list of price levels (e.g., round or psychological numbers) and automatically scales them to fit any asset's current price range using an intelligent anchor point. It then plots dynamic horizontal zones ideal for identifying potential supply/demand or reaction areas.
How It Works (Technical Methodology)
Manual Price List Input
Users enter a comma-separated list of price levels via a text area input (default example: 50,100,...,1400). These act as a "template" grid – often round numbers, psychological levels, or custom targets.
Auto-Scaling Logic (Core Innovation)
When enabled:
Calculates the average of the input list.
Determines a smart anchor price:
Default (Lock = 0): Close price of the highest-volume bar in the last user-defined lookback period (default 200 bars), fetched from a selectable timeframe (default Daily) via request.security().
Override: User can manually lock the anchor to any fixed price.
Computes a scale factor = Anchor / List Average.
Multiplies every input level by this factor to adapt the entire grid to the current market (e.g., scales low-price templates to BTC's 60k+ range).
Zone Construction
For each scaled level:
Creates a horizontal box centered on the level.
Height = Level × user-defined percentage (default 0.5%) for volatility-adjusted thickness.
Zones extend infinitely to the right for continuous reference.
Supply/Demand Coloring
Levels above current close: Supply color (default light gray) – potential resistance/overhead supply.
Levels below current close: Demand color (default cyan) – potential support/underlying demand.
Visual Elements
Transparent filled boxes with borders.
Optional labels showing "S" (Supply) or "D" (Demand) plus exact price.
Clean, non-cluttering design – redraws only on last bar for performance.
How to Use
This tool is perfect for plotting adaptive psychological/round number grids across any asset without manual adjustment.
Common Template: Use evenly spaced round numbers (e.g., 100 increments) as input – the script handles scaling.
BTC/ETH/Crypto: Enable auto-scaling with Daily timeframe anchor for high-volume alignment (often near fair value).
Forex/Stocks: Lower zone height % for tighter zones; use shorter lookback or lock anchor for stability.
Trading Applications:
Anticipate reactions/bounces at scaled levels (confluence with price action, volume, or order blocks).
Supply zones (above price): Potential short entries or take-profit targets.
Demand zones (below price): Potential long entries or stop-loss placement below.
Override anchor for specific analysis (e.g., lock to all-time high).
Best Practices: Combine with trend direction, higher-timeframe structure, or liquidity concepts for higher-probability setups.
Highly versatile – works on any timeframe/asset, especially volatile ones like cryptocurrencies where fixed levels quickly become irrelevant.
Disclaimer
This indicator is a technical analysis tool and should be used in conjunction with other forms of analysis. Past performance does not guarantee future results. Always use proper risk management.
