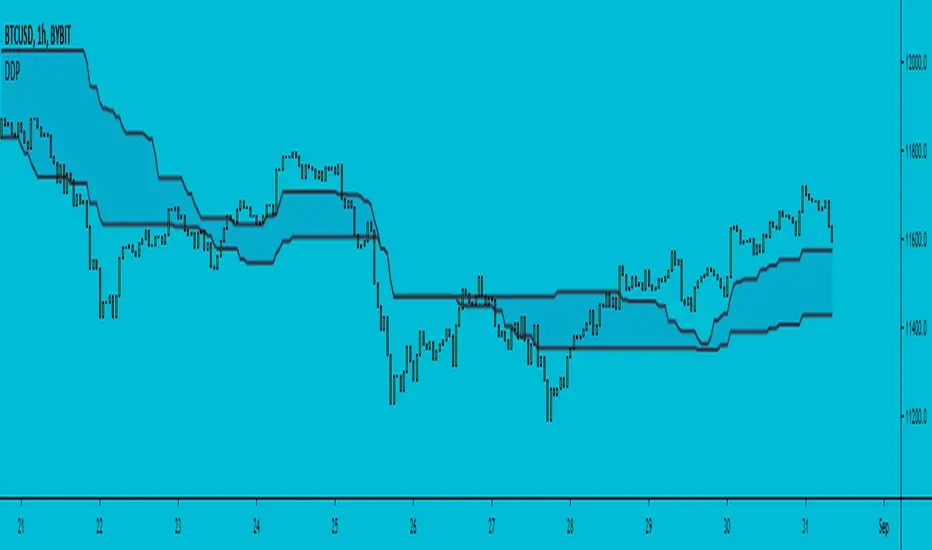
Different Donchian PeriodsHi!
This is a very simple script that I couldn't find on TradingView yet. Look at this indicator how you want (band, cloud, ma's) and create your own settings, I did not test it.
Normally, Donchian average calculates the average(middle) of the highest point of a given period and the lowest point of that same period.
Here I use two separate periods, one for highest, a different one for lowest. That's it :)
Let me know if it's useful to you, I appreciate your comments.
在脚本中搜索"donchian"
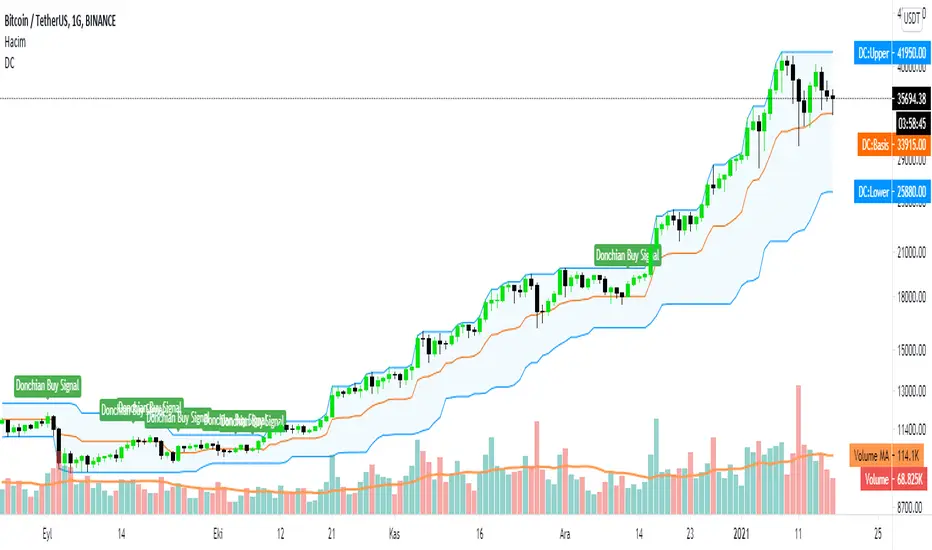
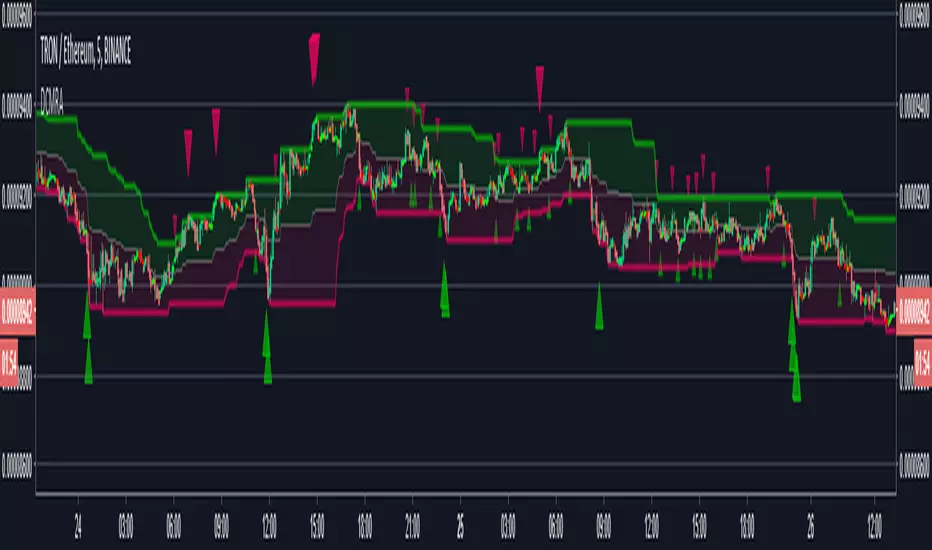
Trend Follower With Help of Donchian Channels - TFWHDCThis is a simple Day Trade indicator, but can be used for swing and long term trades.
It is based on Donchian Channels to detect trend and point out resistance or support breakouts using arrows.
The bars ared colored when a breakout occurs. When a resistance breakout occurs the current and the next bars are colored green (default) and when a support breakout occurs the current and the next bars are colored red (default). This way this indicator can show if its an uptrend or a downtrend.
I hope this indicator will be useful for many traders!
Thank you!

[f(x)] Bollinger Donchian RemixThis is my version of a mixture of Bollinger and Donchian (BB/DC Remix)
It is a modified fork of Dolchian/Bollinger Hybrid by Ricardo Santos ( DBH.V0)
this is the two pictures comparing it.
Made this Fork because Santos' code starts getting chopping with my type of settings.
His time input is 24, but mine varies between 13 and 21.
You really notice in scalping and sometimes intraday timeframes with my settings.
His also differ from mine based on the trendline, where he modifies his Simple Moving Average, which is default color is black, and I use the the default one, which the default color is red.
Also you can change the trendline type input (open,close,hl2,etc...) to tailor your preference.
Note: Default is close, Santos use hl2, I use ohlc4.

Bollinger/Donchian ChannelsProvides a blending of Bollinger Bands and Donchian Channels with shading criteria between.

MTF Donchian Quadrants [DW]This is a simple Donchian Channel variation that separates the the channels into quadrants, and enables MTF calculation.
Average open and close plots are included for additional confirmation of a trend.

B3 Donchian CloudsThis is the Donchian Channel expressed with a percentage cloud. Default 12.5% of the range will be filled at each edge, this helps to show reversal possibilities as price returns to the area between the clouds. This offers a usage to essentially fade the turtle trader system. That system is loosely based on the playing of the breakouts of the the channel... as you can see the that last turtle trade long in YM1! was and is off the charts awesome. I will look for the fall out of the cloud to short the market.


Donchian Trendline - Support Resistance Slope [UhoKang]// This is a strategy that draws a trend line in the form of a slope whenever the high point and low point are updated.
// The upper slope serves as a resistance line, and the lower slope serves as a support line.
// Buy when the of the candle crosses the slope

Donchian Channels with offset or Price ChannelКанал Дончиана с регулируемым сдвигом, он же Price Channel. Для тех кто любит стратегию черпах, черпаховый суп и для поклонников комплексного анализа фибоначчи Першикова.

Donchian Squeeze Oscillator# Donchian Squeeze Oscillator (DSO) - User Guide
## Overview
The Donchian Squeeze Oscillator is a technical indicator designed to identify periods of low volatility (squeeze) and high volatility (expansion) in financial markets by measuring the distance between Donchian Channel bands. The indicator normalizes this measurement to a 0-100 scale, making it easy to interpret across different timeframes and instruments.
## How It Works
The DSO calculates the width of Donchian Channels as a percentage of the middle line, smooths this data, and then normalizes it using historical highs and lows over a specified lookback period. The result is inverted so that:
- **High values (80+)** = Narrow channels = Low volatility = Squeeze
- **Low values (20-)** = Wide channels = High volatility = Expansion
## Key Parameters
### Core Settings
- **Donchian Channel Period (20)**: The number of bars used to calculate the highest high and lowest low for the Donchian Channels
- **Smoothing Period (5)**: Applies moving average smoothing to reduce noise in the oscillator
- **Normalization Lookback (200)**: Historical period used to normalize the oscillator between 0-100
### Threshold Levels
- **Over Squeeze (80)**: Values above this level indicate strong squeeze conditions
- **Over Expansion (20)**: Values below this level indicate strong expansion conditions
## Reading the Indicator
### Color Coding
- **Red Line**: Squeeze condition (above 80 threshold) - Markets are consolidating
- **Orange Line**: Neutral/trending condition with upward momentum
- **Green Line**: Expansion condition or downward momentum
### Visual Elements
- **Red Dashed Line (80)**: Squeeze threshold - potential breakout zone
- **Gray Dotted Line (50)**: Middle line - neutral zone
- **Green Dashed Line (20)**: Expansion threshold - high volatility zone
- **Red Background**: Highlights active squeeze periods
## Trading Applications
### 1. Breakout Trading
- **Setup**: Wait for DSO to reach 80+ (squeeze zone)
- **Entry**: Look for breakouts when DSO starts declining from squeeze levels
- **Logic**: Prolonged low volatility often precedes significant price movements
### 2. Volatility Cycle Trading
- **Squeeze Phase**: DSO > 80 - Prepare for potential breakout
- **Breakout Phase**: DSO declining from 80 - Trade the direction of breakout
- **Expansion Phase**: DSO < 20 - Expect trend continuation or reversal
### 3. Trend Confirmation
- **Orange Color**: Suggests bullish momentum during expansion
- **Green Color**: Suggests bearish momentum or consolidation
- Use in conjunction with price action for trend confirmation
## Best Practices
### Timeframe Selection
- **Higher Timeframes (Daily, 4H)**: More reliable signals, fewer false breakouts
- **Lower Timeframes (1H, 15M)**: More frequent signals but higher noise
- **Multi-timeframe Analysis**: Confirm squeeze on higher TF, enter on lower TF
### Parameter Optimization
- **Volatile Markets**: Increase Donchian period (25-30) and smoothing (7-10)
- **Range-bound Markets**: Decrease Donchian period (15-20) for more sensitivity
- **Trending Markets**: Use longer normalization lookback (300-400)
### Signal Confirmation
Always combine DSO signals with:
- **Price Action**: Support/resistance levels, chart patterns
- **Volume**: Confirm breakouts with increasing volume
- **Other Indicators**: RSI, MACD, or momentum oscillators
## Alert System
The indicator includes built-in alerts for:
- **Squeeze Started**: When DSO crosses above the squeeze threshold
- **Expansion Started**: When DSO crosses below the expansion threshold
## Common Pitfalls to Avoid
1. **False Breakouts**: Don't trade every squeeze - wait for confirmation
2. **Parameter Over-optimization**: Stick to default settings initially
3. **Ignoring Market Context**: Consider overall market conditions and news
4. **Single Indicator Reliance**: Always use additional confirmation tools
## Advanced Tips
- Monitor squeeze duration - longer squeezes often lead to bigger moves
- Look for squeeze patterns at key support/resistance levels
- Use DSO divergences with price for potential reversal signals
- Combine with Bollinger Band squeezes for enhanced accuracy
## Conclusion
The Donchian Squeeze Oscillator is a powerful tool for identifying volatility cycles and potential breakout opportunities. Like all technical indicators, it should be used as part of a comprehensive trading strategy rather than as a standalone signal generator. Practice with the indicator on historical data before implementing it in live trading to understand its behavior in different market conditions.

Donchian Channels with StrategyDonchian Channels are three lines generated by moving average calculations that comprise an indicator formed by upper and lower bands around a mid-range or median band. The upper band marks the highest price of a security over N periods while the lower band marks the lowest price of a security over N periods. The area between the upper and lower bands represents the Donchian Channel. Career futures trader Richard Donchian developed the indicator in the mid-twentieth century to help him identify trends. He would later be nicknamed "The Father of Trend Following."
How To Calculate Donchian Channels
Channel High:
Choose time period (N minutes/hours/days/weeks/months).
Compare the high print for each minute, hour, day, week or month over that period.
Choose the highest print.
Plot the result.
Channel Low:
Choose time period (N minutes/hours/days/weeks/months).
Compare the low print for each minute, hour, day, week or month over that period.
Choose the lowest print.
Plot the result.
Center Channel:
Choose time period (N minutes/hours/days/weeks/months).
Compare high and low prints for each minute, hour, day, week or month over that period.
Subtract the highest high print from lowest low print and divide by 2.
Plot the result.
This scripts gives you to alerts
If price above the center channel this means BUY and script tells you are at the BUY ZONE
Donchian 20/10 Screener + Alerts Donchian 20/10 Screener + Alerts identifies stocks breaking their 20-day high.
Includes ADX trend filter to confirm strong momentum.
Plots Donchian high/low lines and marks BUY/SELL signals on chart.
Screener output shows “PASS” for stocks meeting entry criteria.
Supports alerts for entry, exit, and screener signals for easy monitoring.

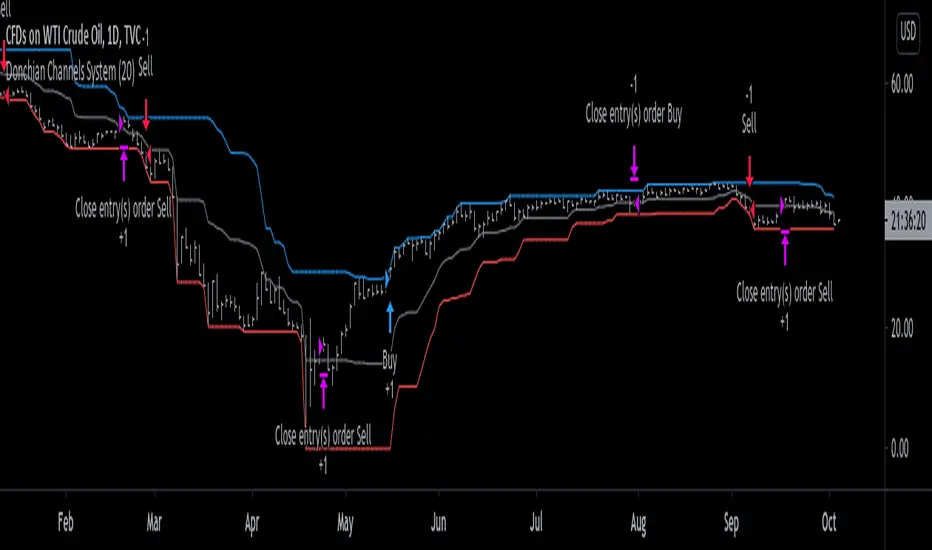
Donchian Channels System [racer8]Donchian Channels was developed by Richard Donchian in 1949. They have been used with great success by the Turtles, a group of traders in the 1980s who managed to obtain returns of 80% annually. Truly incredible story.
This particular indicator is a trend trading system I coded that shows you when to enter long or short and when to exit those longs or shorts.
In addition, this indicator shows the past performance results that are incredibly valuable information for backtesting this system.
The high, mid, and low lines have been plotted to show how this system works. The blue line is the high line. The gray line is the mid line. The red line is the low line.
Entry signals are generated when the current close closes above the highest price for a long trade or below the lowest price for a short trade over n periods.
Exit signals are generated when the current close crosses the mid-line (aka. baseline) and closes.
Baseline = (highest price + lowest price)/2
I encourage you to play around with the settings, although I reccomend avoiding any period below 14.
This system is no bullshit, it's the real deal.
Good luck traders, and enjoy ;)
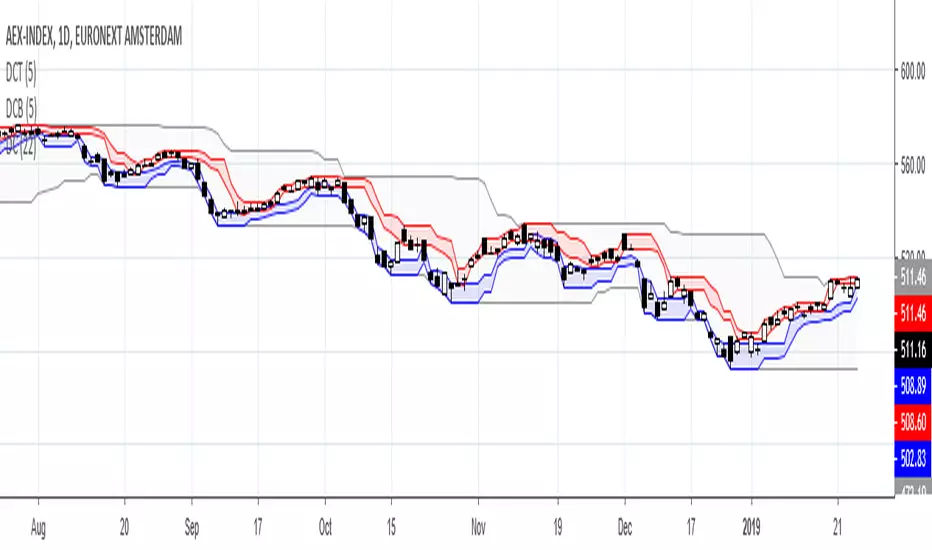
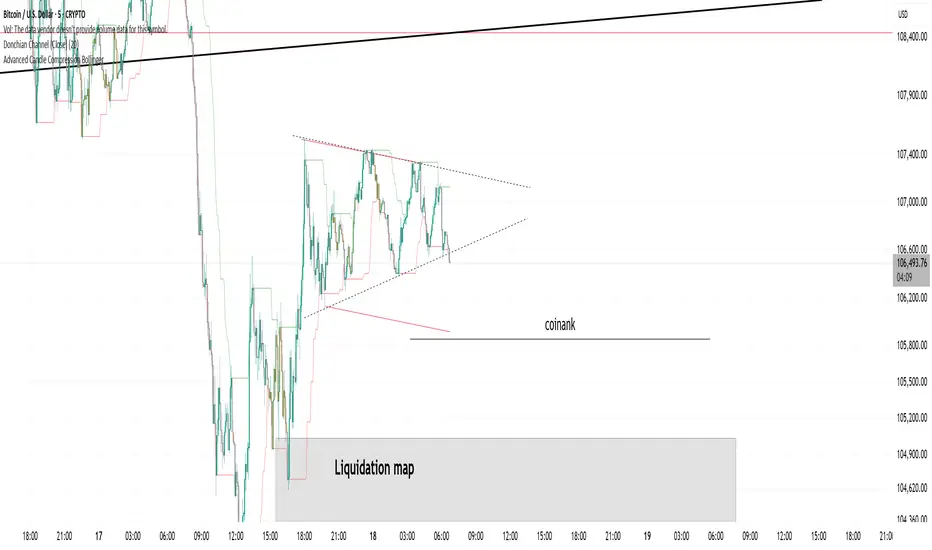
Donchian Channels BottomDonchian Channel trends the high/low over a periode. Donchian Channels Bottom trends the Low and the lowest High over same periode, indicating possible bottom range.

Donchian Channels TopDonchian Channel trends the high/low over a periode. Donchian Channel Top trends the high and the highest low over same periode, indicating possible top range.

Donchian Channel (Close)Donchian channel based on candle close. Allows you to avoid fake wicks and rely only on closing prices.
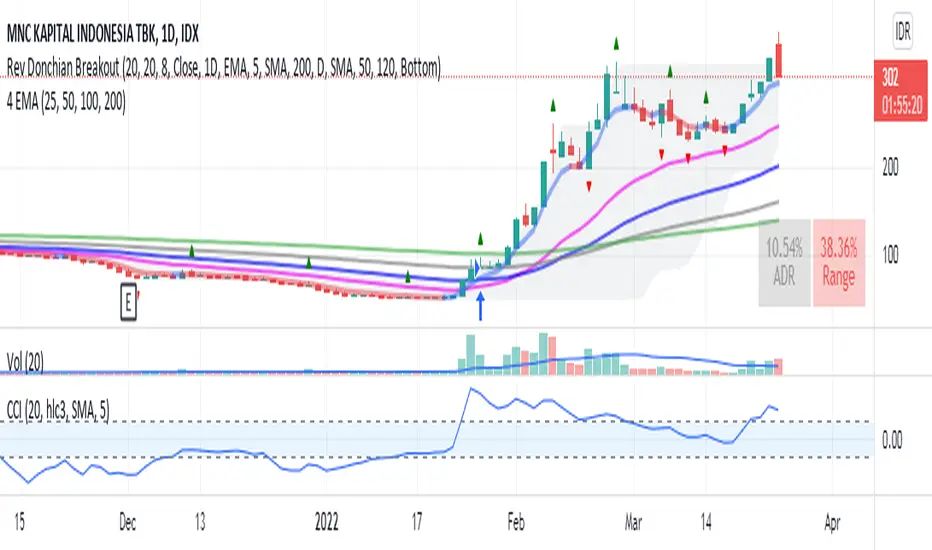
Donchian Breakout no repaintdonchian breakout strategy which i revise the script for no repaint signal

Donchian Channels top/bottomDonchian Channels with addition of highest low and lowest high per length. Thus creating a top and bottom channel. Cheers.

Donchian Mean Reversion AlertsDonchian Channels mean reversion signals/alerts with RSI filtering with signals applied to the mean, for strong trend situations.
Original Author: ChrisMoody
Modified Donchonian Channel with separate adjustments for upper and lower levels
Purpose is if you expect big move up, Use lower input example 3 or 4, and longer lower input, 40 - 100 and use lower input line as a stop out
Opposite if you expect big move down
Mid Line Rule in Long Example. If lower line is below entry take partial profits at Mid Line and move stop to Break even.
If Lower line moves above entry price before price retraces to midline use Lower line as Stop...Opposite if Shorting
Created by user ChrisMoody 1-30-2014
Updated 7-11-2018 by Dysrupt
Revamped for mean reversion strategy
Created midline alerts for strong trending upside buy signals/downside sell signals.
Added RSI Filtering
Added Alerts
Removed bar color change
Donchian Channels MomDonchian Channel Momentum helps to define trends.. Better use with 30 mnts and above timeframes
