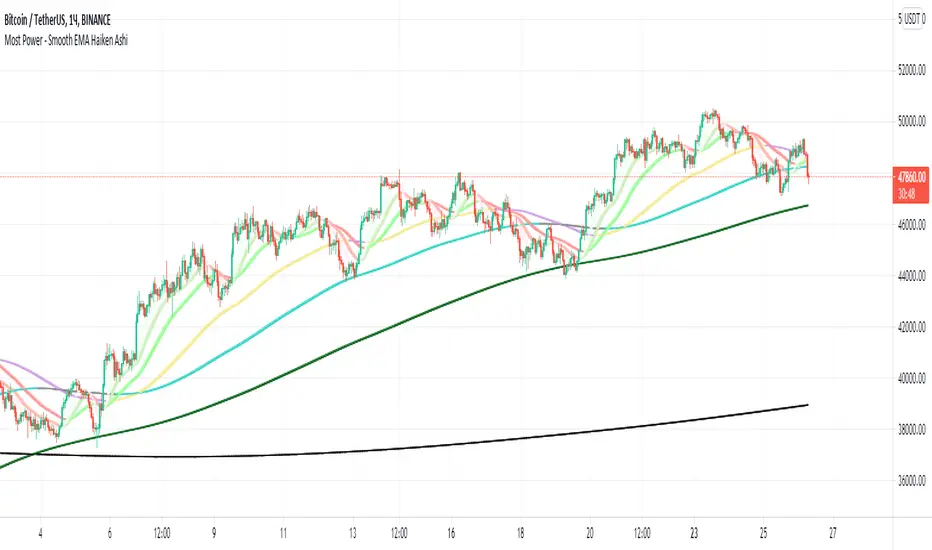
Most Power - Smooth EMA Haiken AshiMost Power - Smooth EMA Haiken Ashi
The indicator displays smoothed EMA (5, 10, 20, 50, 100, 200, 1000). Smoothing occurs through the use of Haiken AShi
在脚本中搜索"ema"
Know Sure Thing and EMA Strategy by JLXThis is a simple strategy based in Know Sure Thing indicator and an Exponential moving average,
Rules are as follow:
- You can go long when the KST cross signal bellow 0 and price closes above the target EMA
- You can go short when the KST cross signal above 0 and price closes bellow the target EMA
I include a trailing stop loss, default its 0.5%
Hope you enjoy it

MACD EMA - TradingRush StrategyHey there!
Today I present you a rather simple, but very profitable MACD strategy. Since I trade it with cryptocurrencies, the settings have been adjusted.
I discovered the strategy on a YouTube channel and tried to transfer it as a strategy into a script.
Tested with the crypto pair ETH/USDT in the 15 minute chart.
There is the possibility to switch between short and long positions.
-----------------------------------------------------------------------------------
How does the strategy work?
ENTRY
The MACD indicator must cross below the histogram. If it crosses when the price is below the EMA, only short positions are traded. Above the EMA - long.
EXIT
The Lowest Low (long) / highest high (short) serves as the stop loss. The TP is formed on the basis of a factor. (SL multiplied by factor 2.1 = TP).
The red lines are used to illustrate the SL. Above for short positions below for long positions.
The results of the strategy are without commissions and levers.
If you have any questions or feedback, please let me know in the comments.
If you need more information about the strategy and want to know exactly how to apply it, check out my profile.
I wish you good luck with the strategy!

3 EMA Stochastik RSI ATR SL TP only LONGHey there!
Here i will show you the 3 EMA RSI Stochastic Crossover strategy with an ATR SL and TP.
The strategy works as follows:
For long positions, the EMA's must be in the following order:
The 8 E M A must be above the 14 E M A and the 14 E M A must be above the 50 E M A.
The buy signal is given to us by the Stochastic RSI indicators.
The K line must cross the D line above. The following candle must then close above all E M A's.
The stop loss is determined by three times the value of the ATR.
The take profit is determined by two times the value of the ATR.
In this strategy only long positions are traded.

Three EMA and Stochastic RSI Signals with TP and SL AlertsThis is kind of similar to one of my other scripts but I figured people might be looking for this one in a simple wrapped up package. It takes 3 EMAs, a 50, 14 and an 8 and the trade signals come from crossovers of the Stochastic RSI lines and conditions that marry up with the EMAs lining up in an uptrend or downtrend condition. I used the TP and SL lines from one of my other scripts so you can see where the winners and losers are. Includes alerts so they can be used with webhooks to automate however you wish. I have added signal confirmation with Weiss Wave Volume on side with trend. Stop and TP Levels are configurable in the settings as well as the periods for the ATR used in these calculations.

Multi MA CloudsEMA Clouds are used for identifying trends. It helps to see moving averages as in a range especially when you look at them in Micro time frames like 1/5/10/15/30 mins. So these Clouds could be used for Intraday trading for identifying trends and pullbacks.
For example, on a 10min chart, once you see a parabolic move, don't take trade until the bar touches 5/13 or 8/9 EMA clouds.
There are other EMA cloud scripts available but this one gives you option to choose MA Type and Source in addition to providing all well known MA range in one script. You can modify the MA length as you wish. So you can disable one you don't want to see on the chart.
Please look at my other scripts at www.tradingview.com

Custom Moving Average (EMA & SMA)This script is a custom visualization tool to plot 4 Moving Averages (MA).
Each MA is customizable; you can:
enable (disable) the plot of MA;
select whether the MA is an EMA or an SMA;
the length;
the source (open, close, ...);
the offset value (default is 0).
Note:
The 1st MA is an EMA with length 50.
The others MAs are SMA with length 9, 30 and 100 respectively.

Bjorgum Triple EMA Strat-This script uses a triple EMA strategy to establish trend direction and reversal points
-Inputs are smoothed with Heiken Ashi values to reduce whipsaws, while providing timely execution
-Buy and sell indications are dictated by bar color
-Bar color is dictated by the candle close value in relation to the EMAs, specifically the faster of the 3
(If candle closes above or below the fast and intermediate averages, a buy or sell signal is indicated by bar color change)
-If the close falls between the two a cautionary signal is given. The viewer can hold, or take profit, or evaluate other indicators for clues
-Best results are obtained when coupled with Bjorgum TSI and Bjorgum RSI for confirmation of signals (see TradingView profile)
@Bjorgum on Stocktwits

Double BB & Double EMA by IKINThis is the combination of code to detect the cross over between EMA 7 & EMA 21.
By using the double Bollinger Bands will help traders to make the decision by exit the counter just incase buy at the highest price.
Create for FREE TRADING VIEW USER

Bollinger Band+ Multi EMA, SMAHello Everyone.
I make Bollinger band , 3 ema and 3 sma combined.
I think this indicator can use all timeframe.
--------------------------------------------------------------
Indicator will show you
1. Trend follow
2. Pullback catch
2. Market bounce.
1. Trend Follow
- Trend Follow for I used 3 terms. They are short, Mid and Long Trend.
2. Pullback Catch
- EMA for Save, take care, alert Zones.
- Mid Term Trend can be catch also.
3. Market Bounce
- Bollinger Band will show you market re-bounce point.
Final Notes
Indicator will show Trend, Pullback, Market bounce and some support and resistant level.

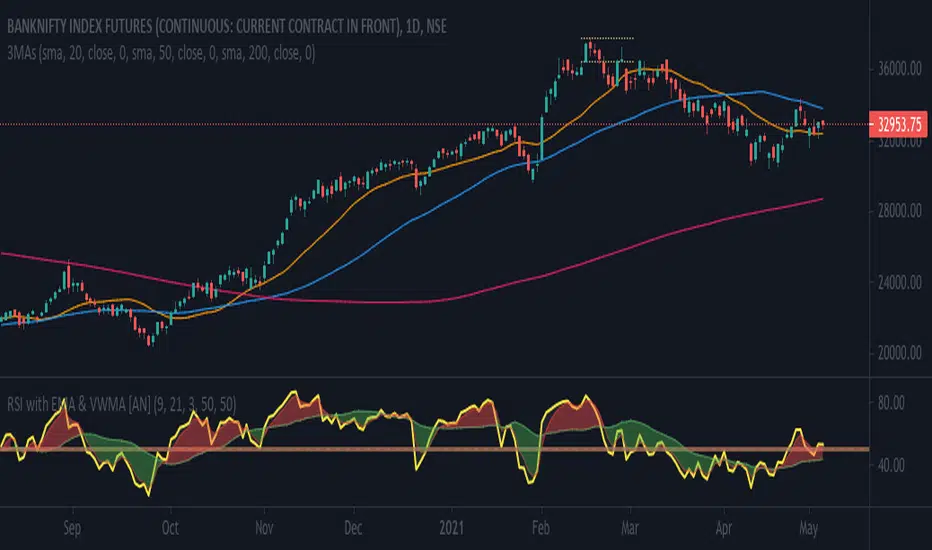
RSI with WMA & EMA [AN]Key Factors traced
- Price: EMA (Exponential Moving Average)
- Volume: WMA (Weighted Moving Avg.)
- Strength (Momentum): RSI (Relative Strength Indicator)
Default parameters
1. RSI at 9. Over brought & Under sold to 50 to be used as a median. This can be altered to the traditional 70:30 or 60:40
2. WMA at 21
3. EMA at 3, Exponential for Intraday trades
SMA 9/50/180 | EMA 20 | BUY/SELLAllows for 3 SMAs and One EMA, Combined with Buy/Sell Indicator
Defaults to following settings:
9 SMA - Red
50 SMA - Blue
180 SMA - White
20 EMA - Yellow
Input Values and Colors can be modified
Recommend changes to the Style default
-uncheck SMA2
-uncheck Buy/Sell Chart Line

All EMA & MA in onDas Script zeigt EMA sowie MA 21, 50 ,100, 200
Es sind alle Farben einstellbar sowie die bereiche zwischen EMA und MA als Zone einfärbbar.
TESLA: EMAS and Bollinger BandsThis script is supposed to be used as part of the "TESLA" strategy in which the default values for the EMAs will serve as a trend indicator and dynamic support and resistance. Moreover, the bollinger bands will signal an overbought or oversold condition stating statistically the price will go up or down. This script features are:
- 3 EMAs which will response quicker than SMA to the new prices and will serve as dynamic support and resistance as well as trend indicators.
- 1 Bollinger band which will signal overbought and oversold conditions.

Fibonacci EMA TrendlinesSimple EMAs based on the Fibs plus the 200 EMA - Default inputs are 8,13, 21, 55, 200. Inspired by Philakones EMAs.

ck - EMA Cross with AlertsDisplays 5 popular EMAs (you can hide any you don’t want to see from the “Styles” screen when editing the config).
Set the values for your EMAs by clicking the cog after adding this indicator to your chart.
A Long or Short signal is fired when EMA1 crosses EMA2 - a cross up is a Long signal, a cross down is a Short signal.
Connect to your Bots (3commas / 3C.exchange recommended) to automate buys and sells!


Bollinger Channels / EMA and SMAThis is written as a system to replace the BB strategy.
I think it will work well.
It looks pretty stylish.
Description / Usage:
Adjust the length and multiplier based on your location with Bollinger Bands.
The multiplier of 1 provides you with a basic channel with high and low-source EMA (or SMA).
And with the 8-day exponential moving average, you can observe short entries and exits.
I wish good luck to the friends who will use it.
You can support and track new indicators.
Bu, BB stratejisinin yerini alacak bir sistem olarak yazılmıştır.
Oldukça şık görünüyor.
Kullanım
Bollinger Bantları ile bulunduğunuz yere göre uzunluk ve çarpanı ayarlayın.
1 çarpanı size yüksek ve düşük kaynaklı EMA (veya SMA) içeren temel bir kanal sağlar.
Ve 8 günlük üstel hareketli ortalama ile kısa giriş ve çıkışları gözlemleyebilirsiniz.
Kullanacak arkadaşlara bol kazançlar diliyorum.
Yeni indikatör için destek olabilir ve takip edebilirsiniz.

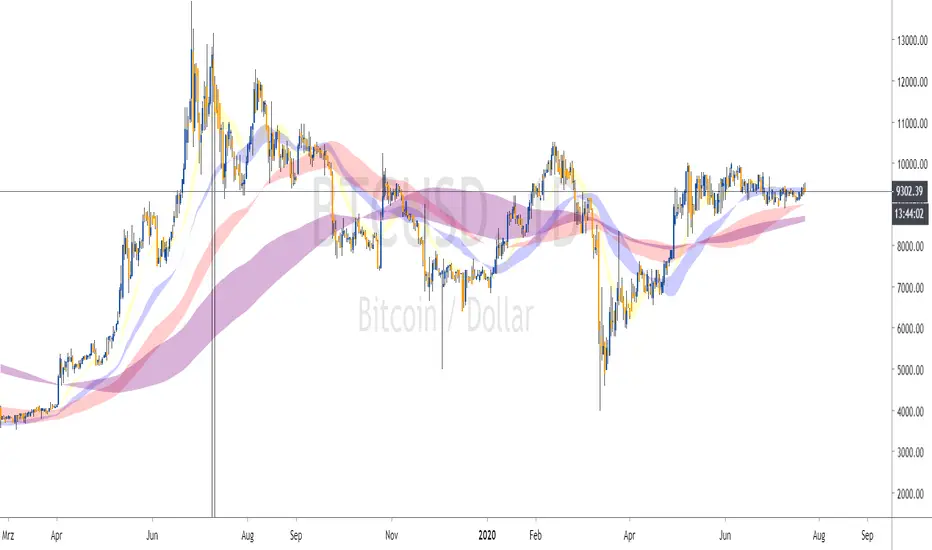
Triple SMA/EMAThis indicator displays the 50, 100 and 200 period SMA and EMA and shades the area between the corresponding SMAs and EMAs

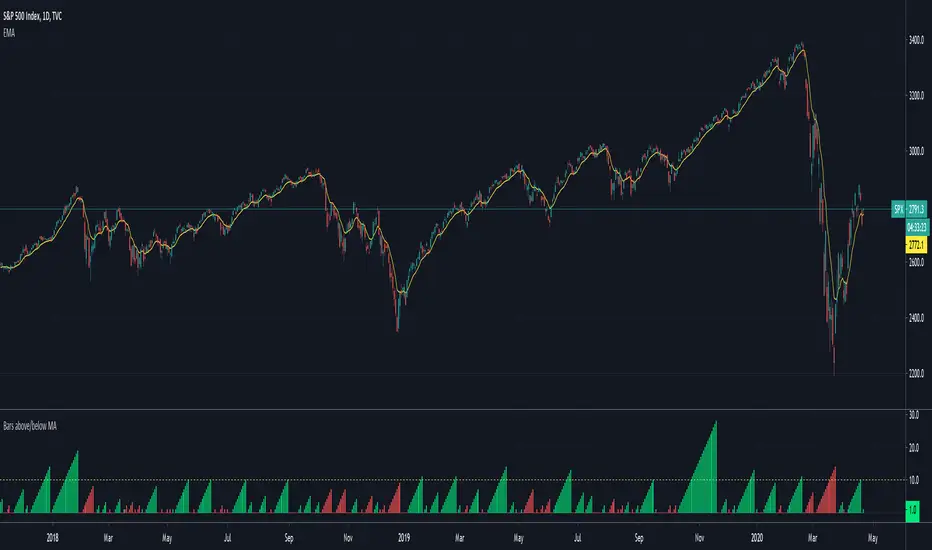
Bars above/below EMACount of previous bars above or below a chosen Exponential Moving Average. Typically price reconnects with well defined EMAs regularly. If the price has been above/below an EMA for too long, you can expect a reconnect in a short order and bet on mean reversion strategies.
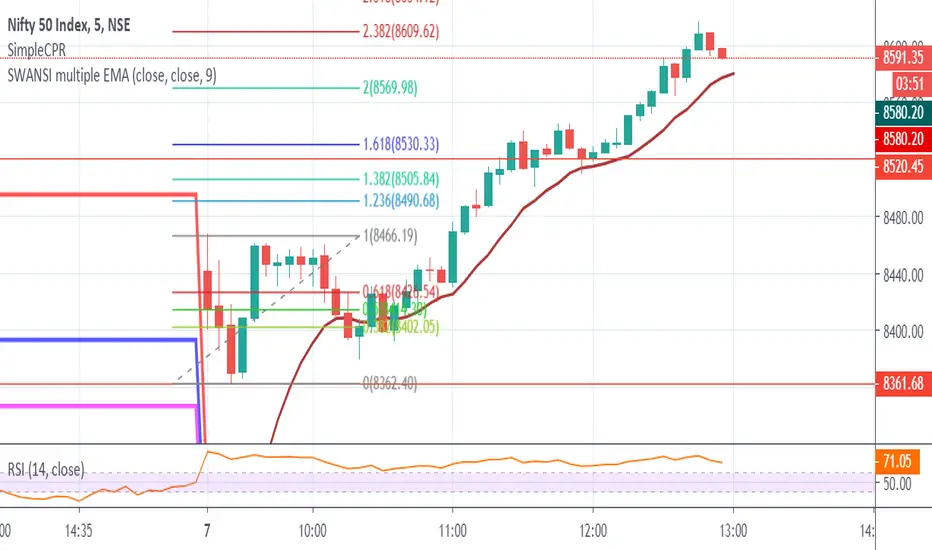
SWANSI multiple EMAI always wondered there should be an EMA (Exponential Moving Average) indicator for multiple periods.
Hence i have created an EMA channel default value of 48 period for High and low
Request you to all the trader and analysis to try it out! and give a feedback
Also more indicators coming in future from my end hence pls follow to get the updates
Thank you
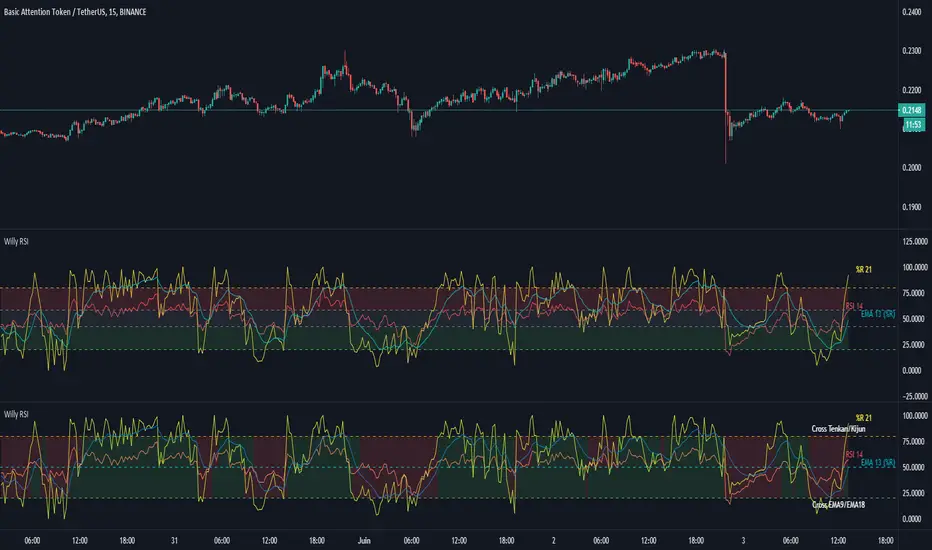
Williams %R + RSI + EMA - [Silver-Wong]
Williams %R + EMA + RSI
Un seul indicateur avec :
- William %R
- RSI
- EMA
- Une ligne médiane
- Les étiquettes des indicateurs
Hashem OBV+EMA/MAThe On Balance Volume indicator (OBV) is used to measure buying and selling pressure.
It is a cumulative indicator meaning that on days where price went up, that day's volume is added to the cumulative OBV total. If price went down, then that day's volume is subtracted from the OBV total.
The OBV value is then plotted as a line for easy interpretation. OBV is primarily used to confirm or identify overall price Trends or to anticipate price movements after Divergences .
In addition to OBV, EMA and SMA are included. the EMA is used for Support and Resistances for the OBV. and the SMA is used by its Slope (can be S/R as well).
