Renko 2-block entry, 1-block exit (signals EVERY block)Renko 2-block entry, 1-block exit (signals EVERY block)Pine Script®指标由oxanaanel22提供129
CM_MACD_Ult_MTF + Entry SignalsThis script is an enhanced and updated version of the classic CM_Ult_MacD_MTF originally created by ChrisMoody. It preserves the full functionality, look, and behavior of the original multi-timeframe MACD, including: Multi-timeframe MACD calculation 4-color histogram based on momentum direction Optional MACD and Signal line display Optional crossover dots Color-changing MACD line on signal cross Zero-line reference This upgraded version adds entry signals based on MACD/Signal crossovers: New Features Added LONG @ price label when MACD crosses above Signal SHORT @ price label when MACD crosses below Signal Labels appear directly at the crossover point Full support for Pine Script® v6, making it compatible with TradingView’s latest publishing requirements Why this version? The original script was written in an older Pine version and was no longer publishable. This version keeps the full visual identity and logic of the classic MACD while adding modern compatibility and helpful trading signals. Credits Original concept and visual framework: ChrisMoody Added features, Pine v6 migration, and enhancements: tgambinoxPine Script®指标由tgambinox提供53
Order Block Smart Entry (v6)very useful indicator, analyze multiframes to identify the trend, then find out the valid order block and after analyzing lower time frame entry gives the singal. Pine Script®指标由shanionline提供11226
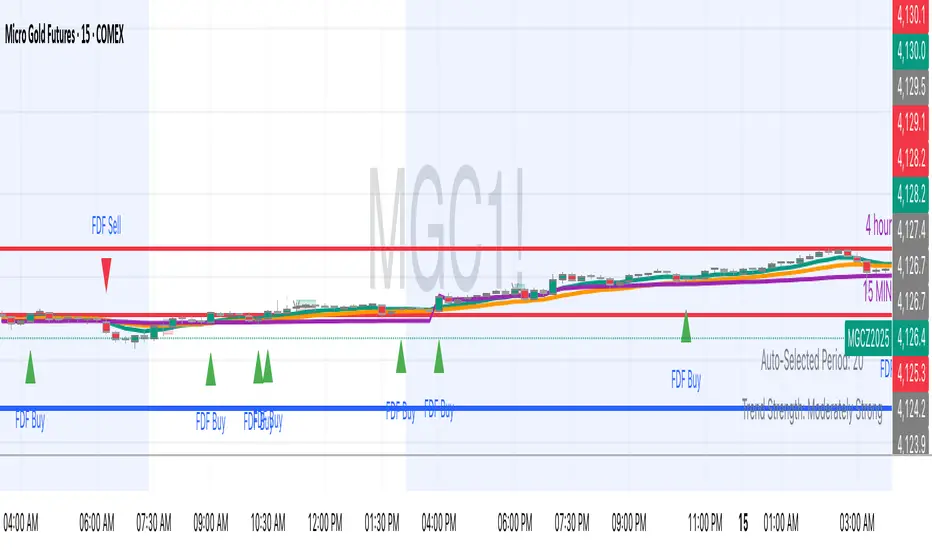
FDF — EMAs+VWAP with setup & entry (stable scale)the 9 and 21, vwap - and support an restianst, marking each entry when it pulling in our out to the 21. used 90% of the candle over the 21Pine Script®指标由BradleyDumont提供已更新 12
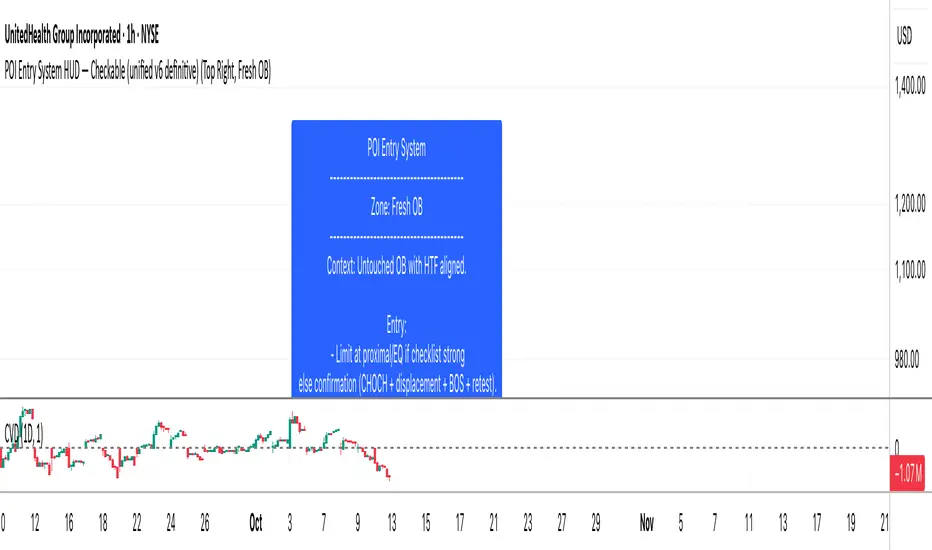
POI Entry System HUD - CheckableScript for checking off entry for OB, FLIPS, XTREMES, and HP ZonesPine Script®指标由Unrealreturns提供已更新 19
Magracia Entry-Exit 5 Min Time frame//------------------------------------------------------------------------------------------------------ // 🧭 Indicator Description //------------------------------------------------------------------------------------------------------ // 📘 Overview: // This indicator is a modified version of the LuxAlgo pattern logic designed to detect // high-probability **RBD (Rally–Base–Drop)** and **DBR (Drop–Base–Rally)** reversal structures // directly on the current candle. It automatically identifies potential BUY and SELL zones, // plots corresponding trade signals, and dynamically calculates **Take Profit (TP)** and **Stop Loss (SL)** levels. // // The goal of this tool is to give clear, visually guided trade entries and exits that // follow price structure and momentum changes without repainting historical data. // //------------------------------------------------------------------------------------------------------ // 🧩 How It Works: // • **RBD (Rally–Base–Drop)** → Indicates a bearish reversal (SELL signal) // • **DBR (Drop–Base–Rally)** → Indicates a bullish reversal (BUY signal) // • Optional **RBR / DBD** continuation patterns can be toggled on for trend continuation setups. // • When a signal is detected, the script automatically places: // ▫ A BUY or SELL marker at the candle // ▫ Dynamic TP (green dotted line) and SL (red dotted line) levels // ▫ An EXIT marker when either TP or SL is reached // //------------------------------------------------------------------------------------------------------ // ⚙️ Inputs: // • Enable or disable individual pattern types (RBD, RBR, DBD, DBR) // • Toggle continuation patterns (RBR/DBD) // • Customize Take Profit and Stop Loss percentages // • Adjust rally/drop bar colors for easier pattern visualization // //------------------------------------------------------------------------------------------------------ // 🧠 Usage Tips: // • Works best on volatile pairs and short–term timeframes (1m to 15m) // • Can be combined with volume or trend filters for stronger confirmation // • When used on higher timeframes (e.g., 4H+), increase TP/SL percentage range // //------------------------------------------------------------------------------------------------------ // ⚠️ Notes: // • Signals are plotted **in real-time on the current candle** (not delayed). // • This indicator is for visual and educational use only and does not guarantee profitability. // • For optimal results, combine it with proper risk management and confirmation indicators. // //------------------------------------------------------------------------------------------------------ // © Gideon (CC BY-NC-SA 4.0 Licensed) //------------------------------------------------------------------------------------------------------ Pine Script®指标由KentMcgrace提供33124
ARGT Possible entry and exit points:This is just an observation, and not any type of financial advice. ]To identify key entry and exit points. In addition, this is based on YTD and yearly charts. This is a work in progress. Pine Script®指标由undertow-USA提供已更新 23
EMA + MACD Entry Signals (Jason Wang)EMA9、20、200 + MACD(12、26、9) Entry Signals ,严格的设置出入场条件 1.做多的k棒: • EMA9 > EMA200 • EMA20 > EMA200 • EMA9 > EMA20 • MACD DIF > 0 且 DIF > DEM • 入场信号: • DIF 上穿 DEM • 或 EMA9 上穿 EMA20 2.做空的k棒: • EMA9 < EMA200 • EMA20 < EMA200 • EMA9 < EMA20 • MACD DIF < 0 且 DIF < DEM • 入场信号: • DIF 下穿 DEM • 或 EMA9 下穿 EMA20Pine Script®指标由jason823222提供25
Multi Asset Position Size Calculator (Extended with Entry ModeMulti Asset Position Size Calculator (Extended with Entry ModePine Script®指标由Thegogiver提供已更新 13
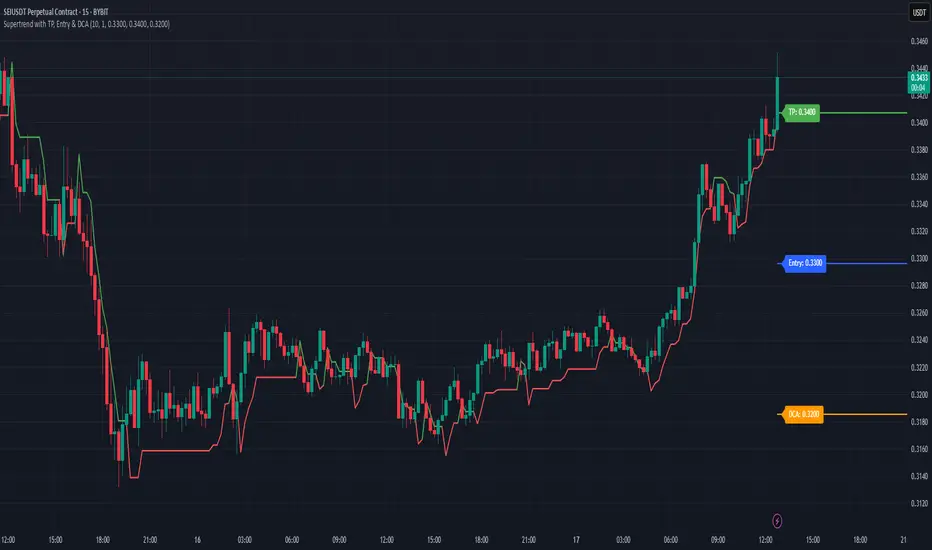
Supertrend with TP, Entry & DCAThis script is super trend plus, horizontal lines for Take Profit, Entry Price and DCA.Pine Script®指标由markb888提供62
EMA Pullback Entry SignalsEMA Pullback Entry Signals is a tool designed to help traders identify trend continuation opportunities by detecting price pullbacks toward a slow EMA (Exponential Moving Average) during trending conditions. This indicator combines moving average crossovers, price interaction with EMAs, and optional filtering to improve the timing and quality of trend entries. Core Features: Golden Cross / Death Cross Detection Golden Cross: Fast EMA crossing above Slow EMA Death Cross: Fast EMA crossing below Slow EMA Optional X-shaped markers for crossover visualization Pullback Signal on Slow EMA Green triangle: Price crosses up through the slow EMA during a bullish trend Red triangle: Price crosses down through the slow EMA during a bearish trend Designed to capture continuation entries after a trend pullback Optional Fast EMA Signals Green arrow: Price crosses above fast EMA in a bull trend Red arrow: Price crosses below fast EMA in a bear trend Helps confirm minor retracements or short-term momentum shifts Sideways Market Filter Suppresses signals when the fast and slow EMAs are too close Prevents entries during low-trend or choppy price action Cooldown Timer Enforces a minimum bar interval between signals to reduce overtrading Helps avoid multiple entries from clustered signals Custom Alerts Alerts available for all signal types Include ticker and timeframe in each alert message Configurable Settings: Fast and slow EMA lengths1 Toggle individual signal types (pullbacks, fast EMA crosses, crossovers) Enable/disable cooldown logic and set bar duration Sideways market detection sensitivity (EMA proximity threshold) Primary Use Case This script is most useful for trend-following traders seeking to enter pullbacks after a trend is established. When the price retraces to the slow EMA and then resumes in the trend direction, it can offer high-quality continuation setups. Works well across timeframes and markets.Pine Script®指标由wooanaz01提供已更新 3394
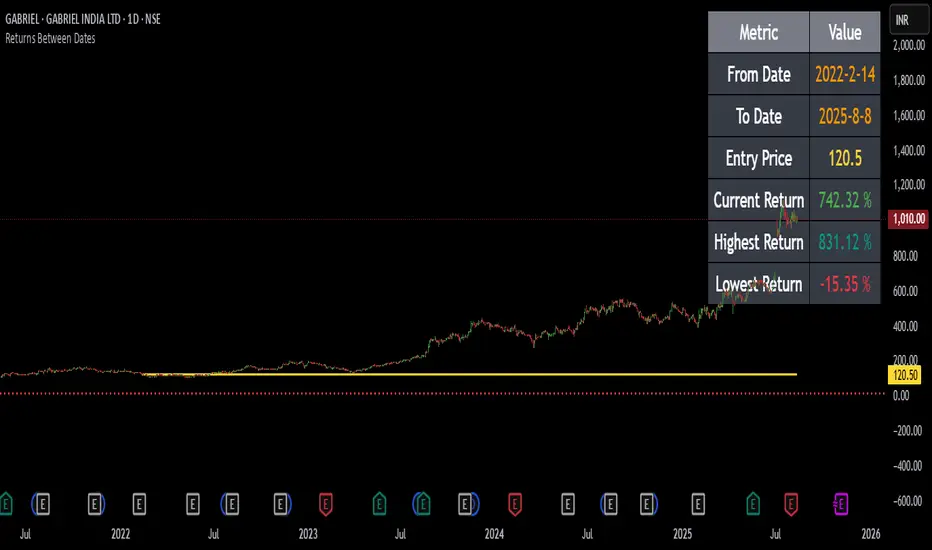
Returns Since Entry DateThis indicator shows the returns and max returns since entry date in a nice tabular format.Pine Script®指标由AlgoMars提供已更新 12
RSI Zones - Directional Entry Strict RSI Zones – Directional Entry Tool (Modified RSI) This is a simple modification of the standard RSI indicator. I’ve added two custom horizontal lines at the 60–65 and 35–40 zones to help spot momentum shifts and potential reversal points. 60–65 zone: When RSI returns here from above 65, it often signals weakening bullish momentum — useful for spotting short opportunities. 35–40 zone: When RSI returns here from below 35, it can indicate momentum loss on the downside — good for potential long setups. This version helps traders filter out weak signals and avoid chasing extreme moves. It works best when combined with price action, structure, or divergence. Only 2 lines were added to the default RSI for better zone awareness. Everything else remains unchanged.Pine Script®指标由TheAliZone提供74
Stop Order Entry with Filters and Line📌 名称: Stop Order Entry with Filters (挂单入场辅助工具) 🧠 作者: Kuixi Zhu 🛠️ 功能简介: 本指标用于识别高质量的 Bull/Bear bar,并在其上方(或下方)自动绘制挂单入场线,帮助你基于 Price Action 策略设置 **buy stop / sell stop** 挂单。 ✅ 特性: - Bull bar:收盘靠近 high,且 bar 波动大于平均(ABR) → 在 high+1tick 画绿线(buy stop) - Bear bar:收盘靠近 low,且 bar 波动大于平均 → 在 low-1tick 画红线(sell stop) - 支持自定义线条长度、ABR周期、强度过滤标准 🔍 核心逻辑: - `(close - low) / (high - low)` 衡量收盘靠近 high 的程度 - `barRange > avg(barRange)` 控制有效波动性 - 使用 `line.new` 动态画出可视化入场价格 📊 应用场景: - 趋势交易中的顺势挂单策略 - price action 高质量 bar 的识别辅助 - 多头突破、空头反转结构的自动提示 ⚙️ 参数可调: - 最低收盘位置比例(default: 0.9) - 最小 bar 波动倍数(相对 ABR) - 横线绘制长度(default: 5 bars) --- Pine Script®指标由Joo1897提供已更新 41
The Great Anchors: Dual AVWAP Powered by RSI The Great Anchors *Dual Anchored Volume Weighted Average Price Powered by RSI* --- 📌 Overview The Great Anchors is a dual AVWAP-based indicator that resets dynamically using RSI extremes — either from the current asset or a master symbol (e.g., BTCUSDT). It identifies meaningful shifts in price structure and momentum using these "anchored" levels. It’s designed to help traders spot trend continuations, momentum inflection points, and entry signals aligned with overbought/oversold conditions — but only when the market confirms through volume-weighted price direction. --- 🛠 Core Logic • AVWAP 1 (favwap): Anchored when RSI reaches overbought levels (top anchor) • AVWAP 2 (savwap): Anchored when RSI reaches oversold levels (bottom anchor) • AVWAPs are recalculated each time a new OB/OS condition is triggered — acting like "fresh anchors" at key market turning points. --- ⚙️ Key Features 🔁 Auto or Manual RSI Thresholds → Automatically determines dynamic RSI OB/OS levels based on past peaks and troughs, or lets you set fixed levels. 🧠 Master Symbol Control → Use the RSI of a separate asset (like BTCUSDT, ETHUSDT, SOLUSDT, BNBUSDT, SUPRAUSDT) or indices (like TOTAL, TOTAL2, BFR) to control resets — ideal for tracking how BTC/major coins impacts altcoins/others. 🔍 Trend-Filtering Signal Logic → Signals are filtered for less noise and are triggered when: - Both AVWAPs are rising (bullish) or falling (bearish) - Price action confirms the structure 🎯 Visual Markers & Alerts → "💥" for bullish signals and "🔥" for bearish ones. Alerts included for automation or push notifications. --- 🎯 How to Use It 1. Add the indicator to your chart. 2. Choose whether to use RSI from the current symbol or a master symbol (e.g., BTC). 3. Select auto-adjusted or manual OB/OS levels. 4. Watch for: - AVWAP(s) making a significant change (at this point it's one of the AVWAPs resetting) - Check if price flip it upwards or downwards - If price goes above both AVWAPs thats a likely bullish trend - If price can't go above both AVWAPs up and fall bellow both that's a likely bearish trend - Price retesting upper AVWAP and bounce - likely bullish continuation - Price retesting lower AVWAP and dip - likely bearish continuation - Signal icons on chart ("💥 - Bullish" or "🔥- Bearish") Best suited for: • Swing traders • Momentum traders • Traders timing altcoin entries using BTC/Major asset's RSI --- 🔔 Signal Explanation 💥 Bullish Signal = • Both AVWAPs rising • Higher lows in price structure • Bullish candle close • Triggered from overbought RSI reset 🔥 Bearish Signal = • Both AVWAPs falling • Lower highs in price structure • Bearish candle close • Triggered from oversold RSI reset Signals reset by opposite signals to prevent noise or overfitting. --- ⚠️ Tips & Notes • Use AVWAPs as dynamic support/resistance, even without signal triggers • Pair with volume or divergence tools for stronger confirmation --- 🧩 Credits & Philosophy This tool is built with a simple philosophy: "Anchor your trades to meaningful moments in price — not arbitrary time." The dual AVWAP concept helps you see how price reacts after momentum peaks, giving you a cleaner bias and more precise trade setups. ---Pine Script®指标由CharmyDexter提供32
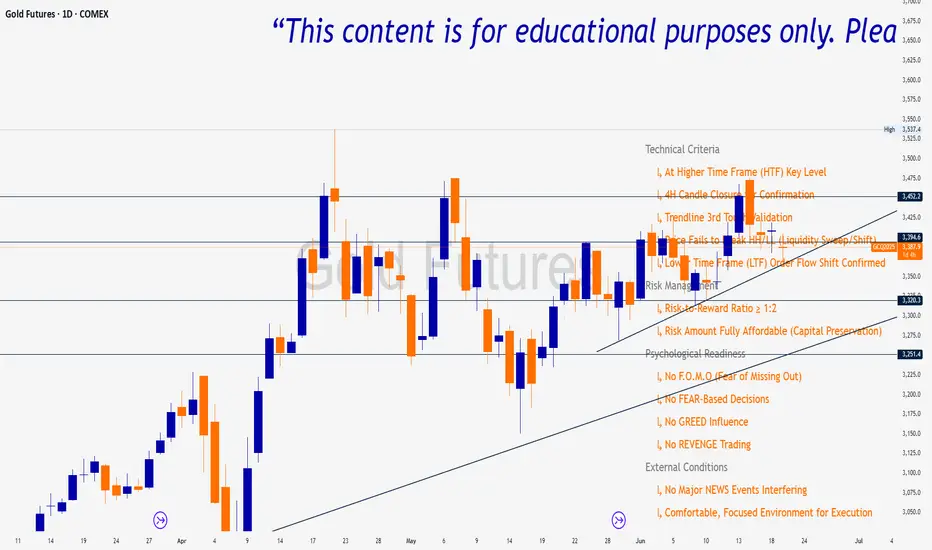
Trade Insight Entry Check List📌 Trade Insight™ Entry Checklist Indicator This indicator is designed for Smart Money Concepts (SMC) and Price Action traders who prioritize precision, patience, and psychological discipline. It helps you validate your trade setup across four essential categories before execution: 🔍 Technical Criteria ✅ Higher Time Frame (HTF) Key Level respected ✅ 4H Candle Closure Confirmation ✅ Trendline 3rd Touch Validation ✅ Liquidity Sweep or Shift (price fails to break HH/LL) ✅ Lower Time Frame (LTF) Order Flow Shift Confirmed 💰 Risk Management ✅ Risk-to-Reward Ratio ≥ 1:2 ✅ Risk Amount Fully Affordable (Capital Preservation mindset) 🧠 Psychological Readiness ✅ No F.O.M.O (Fear of Missing Out) ✅ No FEAR-based decisions ✅ No GREED influence ✅ No REVENGE trading Pine Script®指标由tensayadera80提供1140
NSE Index Strategy with Entry/Exit MarkersExplanation of the Code Trend Filter (200 SMA): The line trendSMA = ta.sma(close, smaPeriod) calculates the 200‑period simple moving average. By trading only when the current price is above this SMA (inUptrend = close > trendSMA), we aim to trade in the direction of the dominant trend. RSI Entry Signal: The RSI is calculated with rsiValue = ta.rsi(close, rsiPeriod). The script checks for an RSI crossover above the oversold threshold using ta.crossover(rsiValue, rsiOversold). This helps capture a potential reversal from a minor pullback in an uptrend. ATR-Based Exits: ATR is computed by atrValue = ta.atr(atrPeriod) and is used to set the stop loss and take profit levels: Stop Loss: stopLossPrice = close - atrMultiplier * atrValue Take Profit: takeProfitPrice = close + atrMultiplier * atrValue This dynamic approach allows the exit levels to adjust according to the current market volatility. Risk and Money Management: The strategy uses a fixed percentage of equity (10% by default) for each trade. The built‑in commission parameter helps simulate real-world trading costs.Pine Script®策略由NewTrader1123提供5
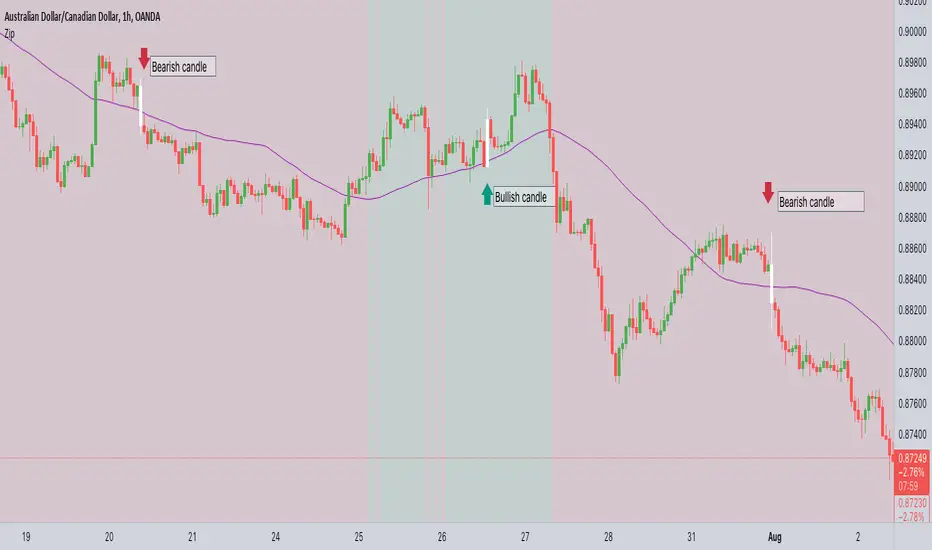
ZIP Entry Strategy( Using 50 SMA and 100 SMA)Description: This strategy uses only two simple moving averages, specifically the 50 SMA and the 100 SMA. Simple moving average : A simple moving average (SMA) calculates the average of a selected range of prices, usually closing prices, by the number of periods in that range. Here's how it works: Background color: The chart background is colored green when the price is above the 100 SMA. The chart background turns red when the price is below the 100 SMA. The greenback ground suggest the bullish momentum and the red background suggests the bearish momentum. We can use this long term trend to take the trades in alignment with the trend to increase our odds. We will use the 50 SMA to identify the spots when a new trend is starting. When the price crosses above the 50 SMA while the background is green, the candle/bar color changes to white indicating a new trend beginning. Conversely, when the price crosses below the 50 SMA while the background is red, the candle/bar color also changes to white indicating a new trend beginning. The occurrence of white candles indicates the start of a potential new trend in alignment with the long term trend. However, it's essential to remember that like any trading strategy, this one is not perfect. For more reliable results, it's advisable to combine it with a consideration of the overall price structure to minimize false entry signals. Originality and usefulness Even though it makes use of two moving averages, we don't use the moving average crossover. The moving average crossovers are either lagging or provide too many false signals. We have tried to address these issue with this strategy. While maintaining the long-term trend and ignoring false signals, it gives out signals early. You can choose the moving average that best suits your needs by changing these moving averages to a different moving average . The 50 SMA and 100 SMA appeared to be giving the better signals in my experience. I dont use any other indicators but i would like to check the price structure to make sure its moving along with the 50 SMA. Sometimes the choppy markets might give false signals. Its okay to see multiple white candles as long as the price structure holds. I have highlighted the white candles in the above chart. The color of the candle is always the same so the background decides whether its bearish or bullish crossPine Script®指标由narenderreddie提供33240
VWOP: Volume Weighted & Oscillated PriceWhile playing around with the standard "ta.vwap" I wondered why there was no length input, so I did some research on what the underlying calculation actually is, and did my best to augment it so as to allow for a variable length based on an oscillator value. Normal VWAP = (Number of Shares Bought x Typical Price) / Total Volume In my VWOP Calculation, typical price is replaced by selected moving average type or "matype" and then multiplied by the volume. Then a total value is calculated using math.sum with a length value that changes according to a selected oscillator's value. The total is then divided by the sum of just volume using the same oscillating length value. Result is then passed through the selected"matype" once more to give the final result. Indicator designed for use as a entry/exit indicator in conjunction with more traditional moving averages and/or signal filters. Useful for taking volume + an oscillator into account along with price, instead of just the price as with a simple moving average.Pine Script®指标由EsIstTurnt提供已更新 33133
OTE optimal trade entry (ICT); visible chart only: Dynamic-simple tool based on ICT free YouTube material of many years. -Highlights a box showing Optimal Trade Entry (OTE): 61.8% - 78.6% retracement -Auto shifts depending on Bull or Bear move on chart. --If visible chart is Bullish (low then high): shows OTE box 61.8-78.6% retracement down from the high --If visible chart is Bearish (high then low): shows OTE box 61.8-78.6% retracement up from the low -Thanks the use of PineCoders Visible Chart Library, and some of the example code there Pine Script®指标由twingall提供已更新 3737 2 K
BB-RSI-ADX Entry PointsThis is a combination of indicators used to find oversold and overbought entry points for possible reversion. A Green arrow will appear when all condition are met for an ENTER LONG position. A Red arow will appear when all condition are met for an ENTER SHORT position. You can modify all of these condition parameters from the indicator's settings. How does the indicator work The signals are using Bollinger Bands , BB %B , RSI and ADX indicators to try and find points of reversal Enter LONG Conditions Current candle low is below BB lower band. The BB %B is more than 0. RSI > 30 ADX > 25 Enter SHORT Conditions Current candle high is above BB upper band. The BB %B is less than 1. RSI < 70 ADX > 25 Those are the default settings that seem to work for me but you can customize all of these from the indicator settings. I find this strategy to best work on a 3 minute timeframe Note: The bb %B is calculated for stDev - 1. This will help you see a change happening faster.Pine Script®指标由frixou89提供已更新 22323
Stochastic RVIBased on the Stochastic RSI but uses RVI (Relative Volatility Index) as source. Another great tool for finding market lows and entry points. This oscillator is also good for finding accurate diversions.Pine Script®指标由veryfid提供11429