Slow Stochastic Multi-K&D Average StudyStudy that takes to average fib MA in stochastic format.
Provides LONG and SHORT alerts
Long = k crossover d
Short = k crossunder d
set alerts for conservative entries
When creating alerts
Set to "Crossing Up"
Value = anything between 0 and 1
I usually set to 0.5
Set to "Once per Bar" to give you the fastest response
在脚本中搜索"fib"

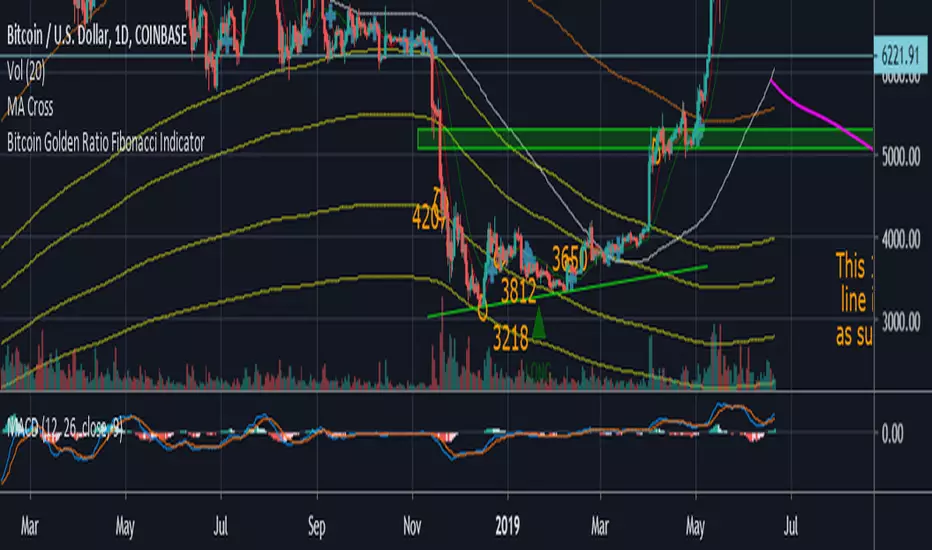
Bitcoin Golden Ratio Fibonacci IndicatorI didn't see this one already it isn't my original idea either. I pulled the formula's from an article on medium, I also added few bear market bottom fib indicators.
Credit to the article I pulled the formula from.
The Golden Ratio Multiplier
Unlocking the mathematically organic nature of Bitcoin adoption
Go to the profile of Philip Swift (@PositiveCrypto)
Philip Swift (@PositiveCrypto)
Jun 17, 2019
By Philip Swift
Release Notes: Fixed spelling error on title, added a couple long and short labels for the top and bottom indicator.
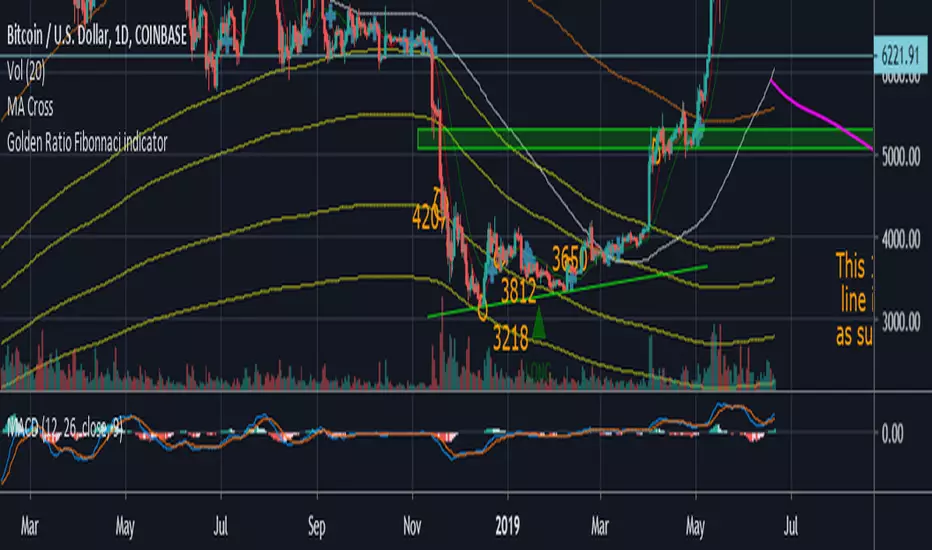
Golden Ratio Fibinnaci IndicatorI didn't see this one already it isn't my original idea either. I pulled the formula's from an article on medium, I also added few bear market bottom fib indicators.
Credit to the article I pulled the formula from.
The Golden Ratio Multiplier
Unlocking the mathematically organic nature of Bitcoin adoption
Go to the profile of Philip Swift (@PositiveCrypto)
Philip Swift (@PositiveCrypto)
Jun 17, 2019
By Philip Swift
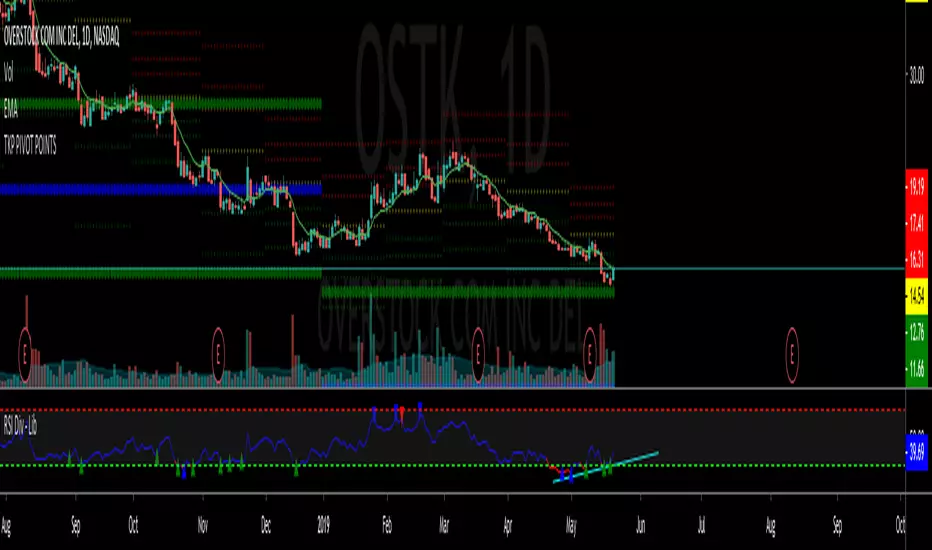
TKP Weekly, Monthly and Yearly Fib Pivot PointsThis script allows you to plot Weekly, Monthly and Yearly Fibonacci Pivot Points. I used templates from others I found on TradingView, special thanks given in the Script. I prefer Longer time frames, especially yearly Pivots, to predict reversals and places to trim risk, so this was tailored to my needs. Hope this helps!

FibonacciMatrix [AES]Draws Fibonacci levels up to "Moon"
you can use the script multiple times within a fib range to divide it into sub levels


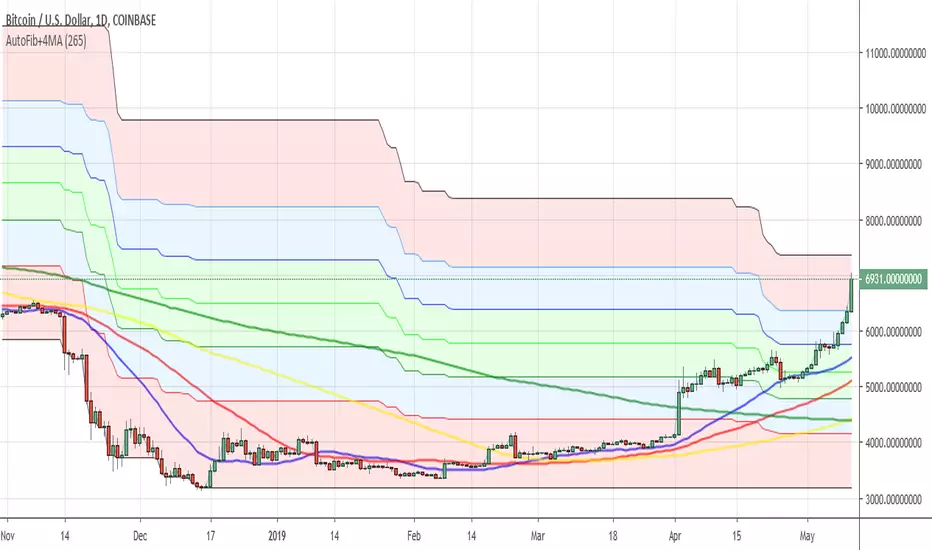
FibFib+4MA 26,50,100,200FibFib+4MA use indicator Auto Fib by TheYangGuizi and I add 4 MA 26,50,100,200
Rumpy's Volume Weighted Adaptive Dynamic Length Moving AverageA custom adaptive MA, much like many variable length MAs uses volatility to dynamically adjust the length. In low volatility it will use longer lengths up to the maximum limit and during high volatility will shorten the length accordingly.
Volume weighting is optional so it can be used on indices etc with no volume data.
It is an attempt to find a sweet spot between the various draw backs of different MAs. Smooth, responsive, tracks price well, minimal overshoot, fast/minimal lag and has significant price action and support/resistance interactions.
Background color is based on close(default) position relative to the MAs. Can be disabled in settings.
Unfortunately pine is a massive pain and until TV decide to fix it (don't hold your breath) there are some drawbacks to the script.
a) It takes a long AF time to load due to the ridiculous workaround to pull a non series integer from a series
b) Longer base lengths don't work. I don't know why, TV just refuses to render the longer length plots, with no error message. Which is a shame as I did some quick calcs and having even an additional 100 and 200 base length MAs look like they would interact really well with PA.
So this is why the upper limit to the variable length MAs is limited to 100. So you have some ability to modify the MAs, as long as the upper limit you want to use is 100 or less. You should also try to keep the base length equidistant from the upper and lower limits.
---------------------------------------
With the default settings I've set the upper/lower limits as a fib ratio from the base length (0.6185). Seems to work quite well.
---------------------------------------
If you find it useful please consider a tip/donation :
BTC - 3BMEXEDyWJ58eXUEALYPadbn1wwWKmf6sA

5 MA or EMA Fib - By Hanjo_CryptoYou can choose between MA and EMA - Adding the 8, 13, 21, 55, 144, 233 at same time

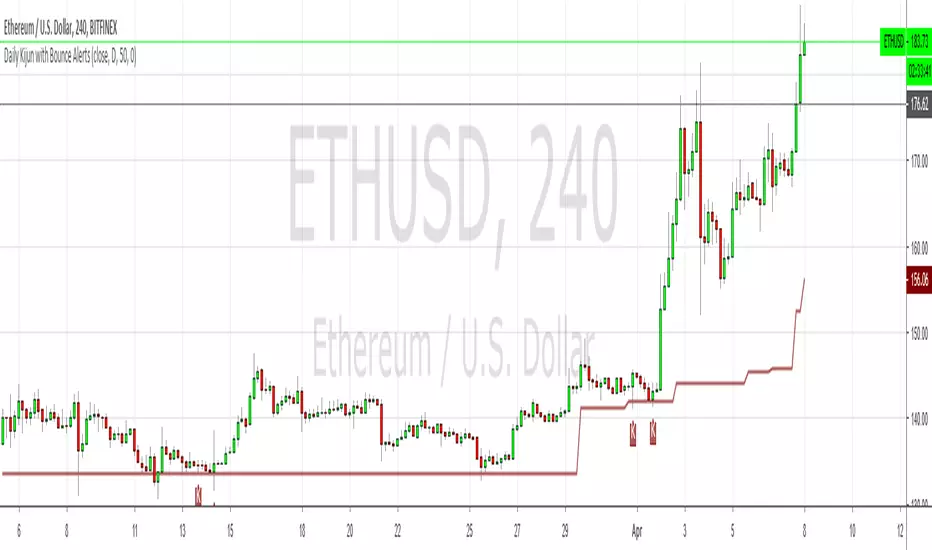
Daily Kijun with Bounce AlertsShows the daily Kijun on all timeframes using a period of 50, which makes it into a dynamic 50% fib of sorts, especially when it's flat. Also shows Kijun bounces labeled with Ks, and allows you to set alerts for bullish, bearish or bi-directional bounces.
It doesn't show any of the other Ichimoku components.
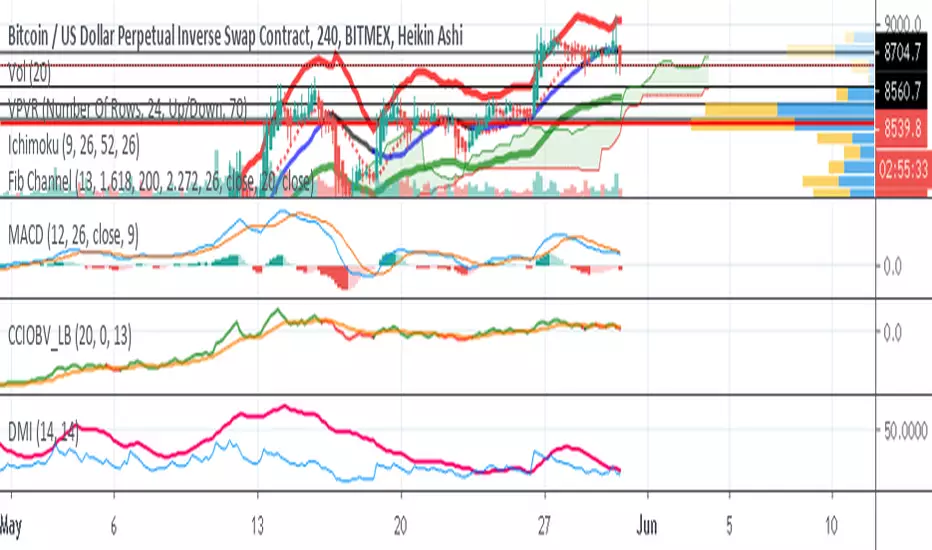
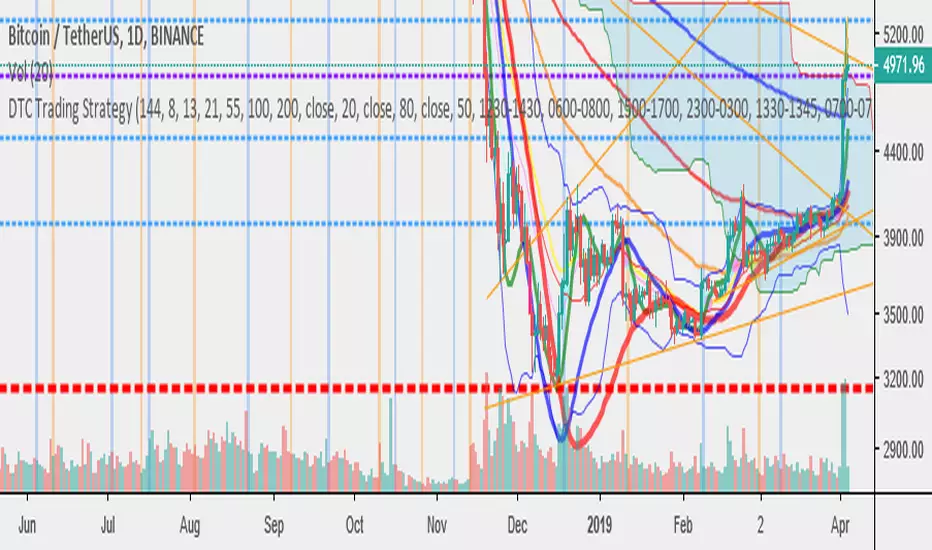
DTC Trading StrategyThe script contains various commonly used indicators, such as:
Bollingerbands
Ichi cloud
HMA
MA
FIB levels
EW Counthelp on Vol.Momentum [yoxxx] Here is a second Elliott Wave Count helper of mine, based on volume momentum this time.
I show it with the other one i just published because i suggest to use them together when counting gets rough. I chose AWR
as example cause i find it always somewhat difficult to identify the waves.
(It even took me a while to find 2h as a better frame than 1d.)
See how both helpers work together help to differ between 5 or an higher b of an expanded flat around the start of April 19.
Note: i locked parameters because they are essential.
(All fib numbers btw. , which indicates their relevance for EW.)


Multi SMA EMA WMA HMA BB (5x8 MAs Bollinger Bands) MAX MTF - RRBMulti SMA EMA WMA HMA 4x7 Moving Averages with Bollinger Bands MAX MTF by RagingRocketBull 2019
Version 1.0
All available MAX MTF versions are listed below (They are very similar and I don't want to publish them as separate indicators):
ver 1.0: 4x7 = 28 MTF MAs + 28 Levels + 3 BB = 59 < 64
ver 2.0: 5x6 = 30 MTF MAs + 30 Levels + 3 BB = 63 < 64
ver 3.0: 3x10 = 30 MTF MAs + 30 Levels + 3 BB = 63 < 64
ver 4.0: 5(4+1)x8 = 8 CurTF MAs + 32 MTF MAs + 20 Levels + 3 BB = 63 < 64
ver 5.0: 6(5+1)x6 = 6 CurTF MAs + 30 MTF MAs + 24 Levels + 3 BB = 63 < 64
ver 6.0: 4(3+1)x10 = 10 CurTF MAs + 30 MTF MAs + 20 Levels + 3 BB = 63 < 64
Fib numbers: 8, 13, 21, 34, 55, 89, 144, 233, 377
This indicator shows multiple MAs of any type SMA EMA WMA HMA etc with BB and MTF support, can show MAs as dynamically moving levels.
There are 4 MA groups + 1 BB group, a total of 4 TFs * 7 MAs = 28 MAs. You can assign any type/timeframe combo to a group, for example:
- EMAs 9,12,26,50,100,200,400 x H1, H4, D1, W1 (4 TFs x 7 MAs x 1 type)
- EMAs 8,13,21,30,34,50,55,89,100,144,200,233,377,400 x M15, H1 (2 TFs x 14 MAs x 1 type)
- D1 EMAs and SMAs 8,13,21,30,34,50,55,89,100,144,200,233,377,400 (1 TF x 14 MAs x 2 types)
- H1 WMAs 13,21,34,55,89,144,233; H4 HMAs 9,12,26,50,100,200,400; D1 EMAs 12,26,89,144,169,233,377; W1 SMAs 9,12,26,50,100,200,400 (4 TFs x 7 MAs x 4 types)
- +1 extra MA type/timeframe for BB
There are several versions: Simple, MTF, Pro MTF, Advanced MTF, MAX MTF and Ultimate MTF. This is the MAX MTF version. The Differences are listed below. All versions have BB
- Simple: you have 2 groups of MAs that can be assigned any type (5+5)
- MTF: +2 custom Timeframes for each group (2x5 MTF) +1 TF for BB, TF XY smoothing
- Pro MTF: 4 custom Timeframes for each group (4x3 MTF), 1 TF for BB, MA levels and show max bars back options
- Advanced MTF: +4 extra MAs/group (4x7 MTF), custom Ticker/Symbols, Timeframe <>= filter, Remove Duplicates Option
- MAX MTF: +2 subtypes/group, packed to the limit with max possible MAs/TFs: 4x7, 5x6, 3x10, 4(3+1)x10, 5(4+1)x8, 6(5+1)x6
- Ultimate MTF: +individual settings for each MA, custom Ticker/Symbols
MAX MTF version tests the limits of Pinescript trying to squeeze as many MAs/TFs as possible into a single indicator.
It's basically a maxed out Advanced version with subtypes allowing for mixed types within a group (i.e. both emas and smas in a single group/TF)
Pinescript has the following limits:
- max 40 security calls (6 calls are reserved for dupe checks and smoothing, 2 are used for BB, so only 32 calls are available)
- max 64 plot outputs (BB uses 3 outputs, so only 61 plot outputs are available)
- max 50000 (50kb) size of the compiled code
Based on those limits, you can only have the following MAs/TFs combos in a single script:
1. 4x7, 5x6, 3x10 - total number of MTF MAs must always be <= 32, and you can still have BB and Num Levels = total MAs, without any compromises
2. 5(4+1)x8, 6(5+1)x6, 4(3+1)x10 - you can use the Current Symbol/Timeframe as an extra (+1) fixed TF with the same number of MTF MAs
- you don't need to call security to display MAs on the Current Symbol/Timeframe, so the total number of MTF MAs remains the same and is still <= 32
- to fit that many MAs into the max 64 plot outputs limit you need to reduce the number of levels (not every MA Group will have corresponding levels)
Features:
- 4x7 = 28 MAs of any type
- 4x MTF groups with XY step line smoothing
- +1 extra TF/type for BB MAs
- 2 MA subtypes within each group/TF
- 4x7 = 28 MA levels with adjustable group offsets, indents and shift
- supports any existing type of MA: SMA, EMA, WMA, Hull Moving Average (HMA)
- custom tickers/symbols for each group
- show max bars back option
- show/hide both groups of MAs/levels/BB and individual MAs
- timeframe filter: show only MAs/Levels with TFs <>= Current TF
- hide MAs/Levels with duplicate TFs
- support for custom TFs that are not available in free accounts: 2D, 3D etc
- support for timeframes in H: H, 2H, 4H etc
Notes:
- Uses timeframe textbox instead of input resolution dropdown to allow for 240 120 and other custom TFs
- Uses symbol textbox instead of input symbol to avoid establishing multiple dummy security connections to the current ticker - otherwise empty symbols will prevent script from running
- Possible reasons for missing MAs on a chart:
- there may not be enough bars in history to start plotting it. For example, W1 EMA200 needs at least 200 bars on a weekly chart.
- for charts with low/fractional prices i.e. 0.00002 << 0.001 (default Y smoothing step) decrease Y smoothing as needed (set Y = 0.0000001) or disable it completely (set X,Y to 0,0)
- for charts with high price values i.e. 20000 >> 0.001 increase Y smoothing as needed (set Y = 10-20). Higher values exceeding MAs point density will cause it to disappear as there will be no points to plot. Different TFs may require diff adjustments
- TradingView Replay Mode UI and Pinescript security calls are limited to TFs >= D (D,2D,W,MN...) for free accounts
- attempting to plot any TF < D1 in Replay Mode will only result in straight lines, but all TFs will work properly in history and real-time modes. This is not a bug.
- Max Bars Back (num_bars) is limited to 5000 for free accounts (10000 for paid), will show error when exceeded. To plot on all available history set to 0 (default)
- Slow load/redraw times. This indicator becomes slower, its UI less responsive when:
- Pinescript Node.js graphics library is too slow and inefficient at plotting bars/objects in a browser window. Code optimization doesn't help much - the graphics engine is the main reason for general slowness.
- the chart has a long history (10000+ bars) in a browser's cache (you have scrolled back a couple of screens in a max zoom mode).
- Reload the page/Load a fresh chart and then apply the indicator or
- Switch to another Timeframe (old TF history will still remain in cache and that TF will be slow)
- in max possible zoom mode around 4500 bars can fit on 1 screen - this also slows down responsiveness. Reset Zoom level
- initial load and redraw times after a param change in UI also depend on TF. For example: D1/W1 - 2 sec, H1/H4 - 5-6 sec, M30 - 10 sec, M15/M5 - 4 sec, M1 - 5 sec. M30 usually has the longest history (up to 16000 bars) and W1 - the shortest (1000 bars).
- when indicator uses more MAs (plots) and timeframes it will redraw slower. Seems that up to 5 Timeframes is acceptable, but 6+ Timeframes can become very slow.
- show_last=last_bars plot limit doesn't affect load/redraw times, so it was removed from MA plot
- Max Bars Back (num_bars) default/custom set UI value doesn't seem to affect load/redraw times
- In max zoom mode all dynamic levels disappear (they behave like text)
- Dupe check includes symbol: symbol, tf, both subtypes - all must match for a duplicate group
- For the dupe check to work correctly a custom symbol must always include an exchange prefix. BB is not checked for dupes
Good Luck! Feel free to learn from/reuse the code to build your own indicators.

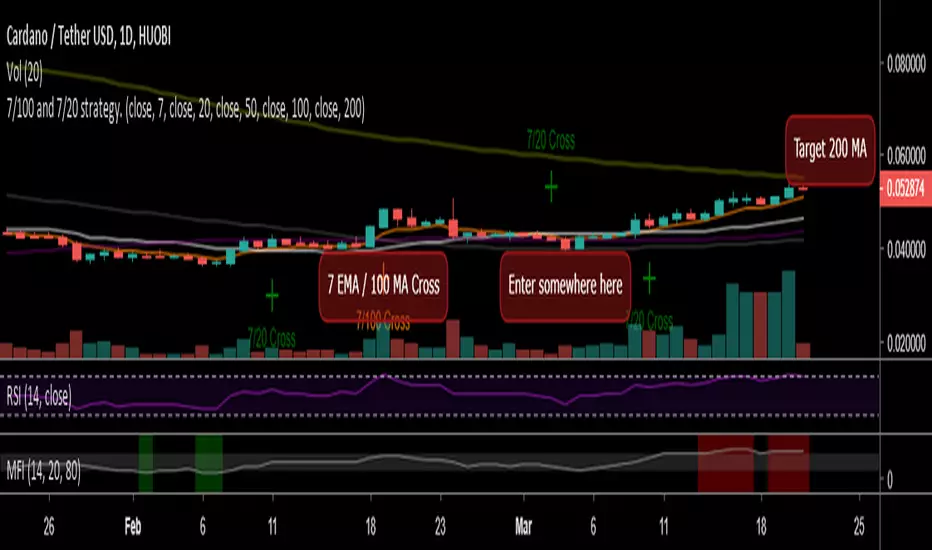
7/100 and 7/20 strategyBased on TradingRoomApp 100/7 Crossover Strategy.
Strategy (Daily TF):
🔹Wait for 7 EMA to cross over 100 MA.
🔹Wait for 2 confirmation candles above.
🔹Enter on pullback near 20 MA.
🔹Target 200 MA / 70.6% Fib from highest high to lowest low.
🔹Average returns 50-150% in 4-8 weeks for good volume ALTs.
This is a seasonal strategy which is relevant for trading between October 2018 and next few months.
**** 4 Alerts in One! ****
For all crossovers and crossunders you will get an alarm with just one alert set.
Instructions to set an alert:
- Right click in the chart and choose 'Add alert...' or ALT + A.
- Choose '7/100 and 7/20 strategy' in 'Condition' dropdown menu'
- In second dropdown 'fastEMA' is selected automatically, you can leave it as it is
- In third dropdown '7/100 and 7/20 strategy' is already selected also and you can leave it as it is
- After that choose your other options and save the Alert.
Multiple Fib MAsMultiple Fibonacci based EMA's. Toggle SMA's input parameter. Use for short/long term as you wish. Colors Hard Coded, sorry, change them if you want.

True Range AutoFibAutomatic Adjusting Fib Support and Resistance
Adjustable Candle Length Average True Range centered on the 34 MA Fibonacci Support and Resistance lines for all timescales on all instruments.
**These lines do move as candles print adjusting slowly to the changing ATR. This generally should indicate the realistic expected move for the current time frame.
EMA Fib 6 A simple collection of 6 Fibonacci brackets.
Includes cross over/under indicators
Includes white average line
Includes the ability to use alternate timeframes

Gnome Momentum TraderMomentum Strategy Script
Lowest: Horizontal line (green), showing the lowest price within the range of bars
Vertical Lowest: Vertical line (green), showing the lowest bar within the range of bars
3.618: Horizontal line (lime), showing Fibonacci extension above highest price
2.618: Horizontal line (lime), showing Fibonacci extension above highest price
1.618: Horizontal line (lime), showing Fibonacci extension above highest price
0.786: Horizontal line (aqua), showing Fibonacci retracement above lowest price
0.618: Horizontal line (orange), showing Fibonacci retracement above lowest price
0.5: Horizontal line (yellow), showing Fibonacci retracement above lowest price
0.382: Horizontal line (orange), showing Fibonacci retracement above lowest price
0.236: Horizontal line (aqua), showing Fibonacci retracement above lowest price
1.618: Horizontal line (fuchsia), showing Fibonacci extension below lowest price
2.618: Horizontal line (fuchsia), showing Fibonacci extension below lowest price
3.618: Horizontal line (fuchsia), showing Fibonacci extension below lowest price
This is written for new traders, to help build Trading Strategy & learn the basics of Risk Managment, MA's, & Fib Levels.
Learn more on our website in my bio under Resources for Free Access.

Moving Averages & Bollinger Bands with ForecastsMoving Averages & Bollinger Bands with Forecasts
11 Moving Averages
SMA, EMA, WMA
Highly Customizable
Linear Regression Forecast
Bollonger Bands
Personal Setup: Add indicator twice
1st indicator = SMA using #4, 7, 10, 11 (20, 50, 100, 200 SMAs) with bollonger bands on 20.
2nd indicator = EMA using #1, 2, 3, 5, 6, 8, 9 (5, 8, 13, 21 ,34, 55, 89 EMAs).
This allows easy toggling between SMAs/Bolls and Fib EMAs
Thank you to yatrader2 for the forecast code
