Amazing Crossover System - 100+ pips per day!I got the main concept for this system on another site. While I have made one important change, I must stress that the heart of this system was created by someone else! We must give credit where credit is due!
Y'all know baby pips. @ForexPhantom published about this system and did both back and forward test around 10 years ago.
I found it on the sit and now I put it to code to see how it performs. I assume 10 points spread for every trade. I use Renesource or AxiTrader to get the low spreads.
There are 2 mods, the single trades and constant trading on the direction.
Main concept
Indicators
5 EMA -- YELLOW
10 EMA -- RED
RSI (10 - Apply to Median Price: HL/2) -- One level at 50.
TIME FRAME
1 Hour Only (very important!)
PAIRS
Virtually any pair seems to work as this is strictly technical analysis.
I recommend sticking to the main currencies and avoiding cross currencies (just his preference).
WHEN TO ENTER A TRADE
Enter LONG when the Yellow EMA crosses the Red EMA from underneath.
RSI must be approaching 50 from the BOTTOM and cross 50 to warrant entry.
Enter SHORT when the Yellow EMA crosses the Red EMA from the top.
RSI must be approaching 50 from the TOP and cross 50 to warrant entry.
I've attached a picture which demonstrates all these conditions.
That's it!
f.bpcdn.co
在脚本中搜索"forex"


Daily OHLPlots the daily open high low for any chart on any market.
Work very well for all crypto exchanges.
When using for Traditional markets, please use data from Forex.com due to various exchanges running on different time zones.

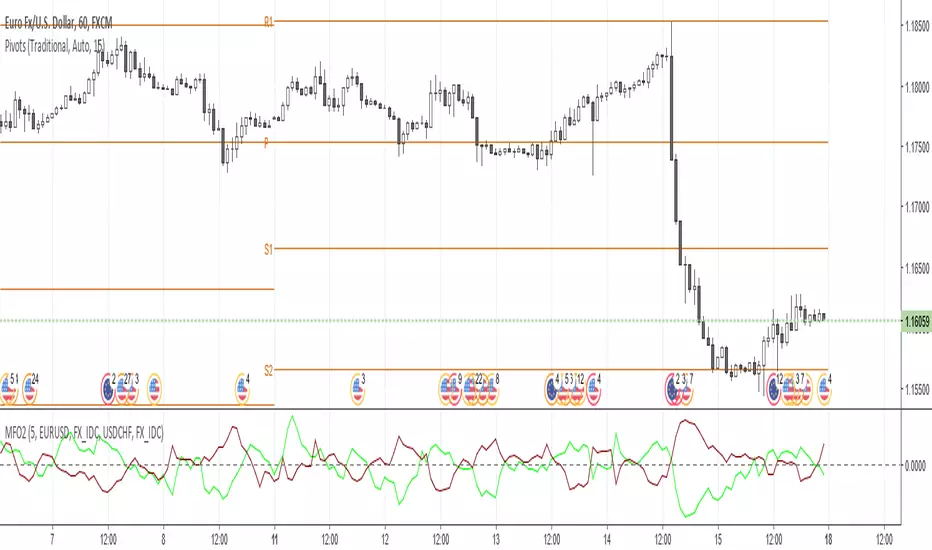
Money Flow Oscillator 2A volume indicator that measures buying and selling pressure over a given lookback period.
As described at traders.com
See also:
- Are price updates a good proxy for actual traded volume in FX?
- Using Tick Volume in Forex: A Clear NVO Based Example
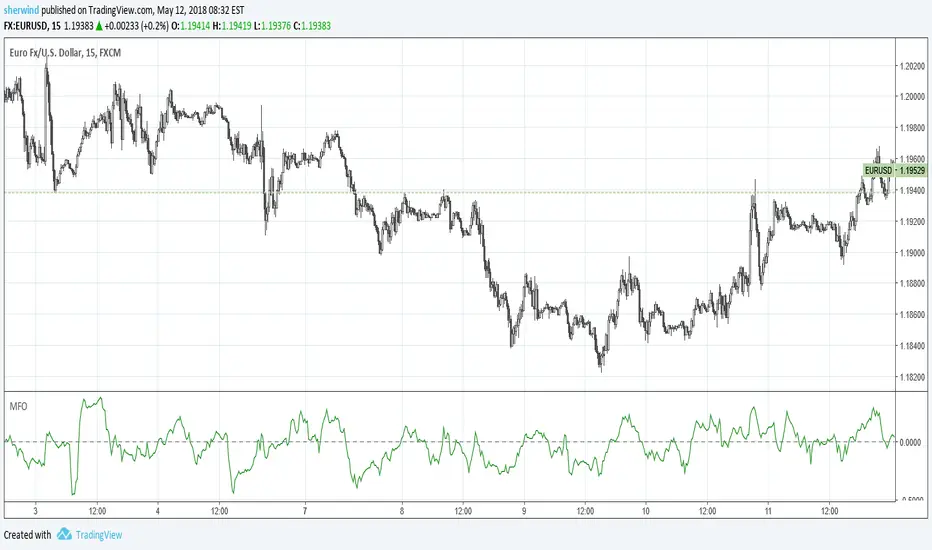
Money Flow OscillatorMeasures buying and selling pressure over a given lookback period.
As described at traders.com
See also:
- Are price updates a good proxy for actual traded volume in FX?
- Using Tick Volume in Forex: A Clear NVO Based Example
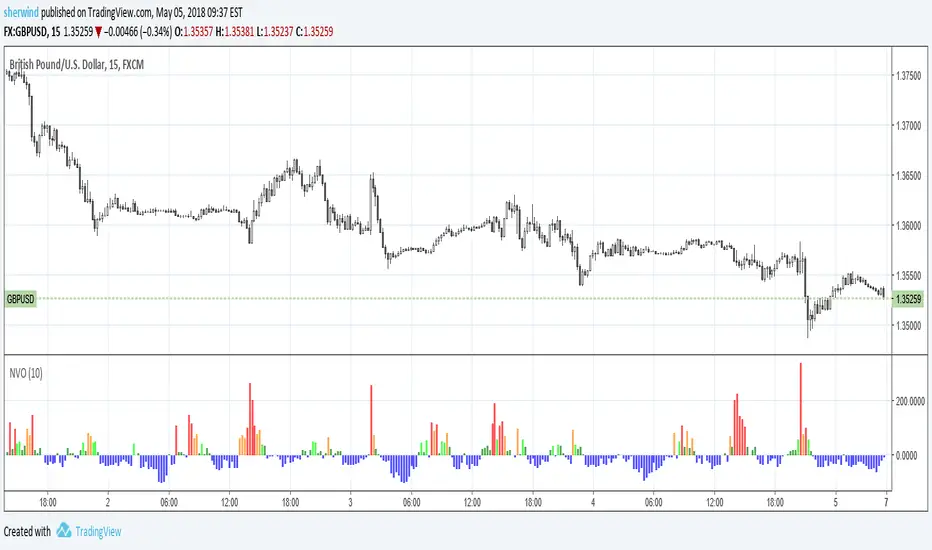
Normalized Volume OscillatorThis volume indicator works best on comparatively small timeframes (15 minutes, for example).
Based on:
- Normalized Volume Oscillator - indicator for MetaTrader 4
- Using Tick Volume in Forex: A Clear NVO Based Example
See also:
- Are price updates a good proxy for actual traded volume in FX?
DRS - Daily Range SystemAn indicator that visualizes the evolution of a daily candle, inspired by a thread on forexfactory: www.forexfactory.com
Applied on a timeframe lower than D (actually lower than H4), it visualizes the evolution of the day's high and low, as well as mid and 25% and 75% lines.
The sole input parameters are the hour at which a day is supposed to start, and the extent of the "trade allowed" region as explained in the FF -1.44% thread.

4 Hour MACD (Philip Nel ForexFactory)This is the basic script that shows MACD as described with settings in the thread www.forexfactory.com

Ichimoku Cloud Score v1.0This script calculates a simple Ichimoku Score based on the signals documented here , with a few additions. Each of the score components can be individually weighted via the script inputs . The output is a plot of the normalized Ichimoku score, in the range of -100 to 100.
This script has been heavily modified from 'Ichimoku Cloud Signal Score v2.0.0 '. Credit to user 'dashed' for the initial implementation.
This has been modified with several refinements:
Clean/Organized Code
Simplified Inputs
Improved Style
Scores normalized to a range (-100, 100)
Bugfixes and Improvements
Script Inputs: i.imgur.com

3 Duck's Trading System from Babypips.comThe 3 Duck's Trading System from Babypips.com
The 3 Duck's Trading System is the most popular and active trading system thread on the the babypips.com forum. It is a system that is mainly for beginners because it teaches you discipline, learning to cope with price moving against your position and learning to stay in a trade and keep profits running. For the thread and more info on the 3 Duck's Trading System click here
How does it work?
The system is a very simple enter/exit based on the 60 SMA of 3 different time frames: 4 hour, 1 hour and 5 minute.
The Rules, er, the Ducks! The Ducks must all be in a row for a trade to take place!
Duck 1 - To go long, price must be above the 60 SMA on the 4 hour chart.
Duck 2 - To go long, price must be above the 60 SMA on the 1 hour chart.
Duck 3 - To go long, price must cross above the 60 SMA on the 5 minute chart and the 60 SMA of the 5 minute chart must be below that of the 4 hour and 1 hour chart. (obviously the reverse for shorting)
YOU MUST USE THIS SYSTEM ONLY ON THE 5 MINUTE CHART.
I say this because I have already charted all of the Ducks into the 5 minute chart so you don't have to flip back and forth.
I have also added some inputs for profit targets, stop targets, trailing stops and times to trade for backtesting.
If you have any questions or comments, please let me know! If you see I messed up on something, please let me know!
Also a VERY special thanks to the babypips.com user Captain_Currency . He wrote this strategy 10 years ago (2007 was 10 years ago?!) and he is still active on the thread and posting results and offering help!

HL2 - 22 EMA Cross for RenkoEURUSD
This is a simple strategy to use for those who like Renko bars. I ONLY use it on Renko.
Basic idea is that when the Renko bar closes above or below the 22 EMA, you go long or short.
However, some of the frustrations I've had with any strategy shared in Tradingview is so few folks put in the ability to set a stop or a profit target or the ability to set a specific time to trade. I have added those to this strategy. (And I for the life of me can not remember where I got the code for the the time, I need to find you!).
Special note: If you have never used the Renko bars in Tradingview, make sure you click the Format option next to whatever pair you are looking at and change it from Traditional to ATR. You can set it for a static pip amount if you want. But ATR at first will help you decide which amount of pips you should throw in.
This is my first published strategy so if I screwed up on anything or didn't explain it very well, please let me know!!

Traders Dynamic Index Indicator Alert v0.1 by JustUncleLThis is a trend trading indicator+alert utilising the Traders Dynamic Index (TDI), Price Action Channel (PAC) and Heikin Ashi candles.
About 6months ago I came across the use of TDI in "E.A.S.Y. Method" that I found in forexfactory forums: www.forexfactory.com
and I was able to set up a chart based on the specifications by using Kurbelklaus scripts. However, I found that the alerts were being generated one or two bars too late, so at that time I was not successful using it with Binary Options. A few months later I found a variation of the method in the forecfactory forums which is able to generate the alerts a bit earlier, so this indicator is a modification of that early detection version.
The indicator can optionally use Heikin Ashi candles only for all it's calculation. I would recommend viewing the chart with Heikin Ashi candles, these smooth out the trends and makes trends very clear.
I found that this method it works good with most currency pairs or commodities and with 5min+ timeframe charts. I would suggest expiry of 2 to 6 candles.
ALERT GENERATION:
=================
The TDI (Traders Dynamic Index)
---------------------------------------------
Volatility Band VB(34), color: Blue, buffer: UpZone, DnZone
Relative Strength Index RSI(13)
RSI PRICE LINE (2), color: Green, buffer: mab
RSI TRADE SIGNAL LINE (7), color: Red, buffer: mbb
MARKET BASE LINE MID VB(34), color: Orange, buffer: mid
Indicator SignalLevels:
-------------------------------
RSI_OversoldLevel : 22 (normally: 32)
RSI_OverboughtLevel : 78 (normally: 68)
Alert Conditions:
-----------------------
Strong Buy : yellow
Medium Buy : aqua
Weak Buy : blue
Strong Sell : fuchsia
Medium Sell : purple
Weak Sell : black
Hints on How to use:
----------------------------
- When a Medium or Strong alert is generated and MACD histogram colour matches the direction
of the alert (optional auto filter), then place trade in direction of alert candle and MACD.
- I use the multi-Hull MA's for overall trend direction confirmation.
- Best positions normally occur near the MACD(5,15,1) Histogram crossing the zero line.
- The optional coloured Dots along the bottom of the indicator represent the first alert
of this type that was generated in this sequence.
- It is advisable to trade in the direction of the main trend as indicated the HULL MA red cloud:
if red cloud underneath PAC then BULLISH trend, if red cloud above PAC then BEARISH trend.
- Selecting the HeiKin Ashi candles does affect the MACD and MA caculations, so if you select
normal candles the result chart will change. You can still Optionally select to use Heikin Ashi
for calculations.
- When using the Heikin Ashi candles, a good buy entry is indicated by long top wick and no bottom wick
for bull (green) candles and good sell entry is indicated by long bottom wick and no top wick for
bear (red) candles.
- When the MACD histogram is flat and close to zero line,
this indicates a ranging market, do NOT trade when this occurs.
- When the PAC channel on the main chart is spread apart widely, this is an indication
of extreme volatility and choppy chart, do NOT try to trade during these periods.
A choppy chart is also indicated by Heikin Ashi candles with long wicks on both sides
of the candles.
- You can specify what strength level Alerts are generated (default 2):
Level (1) means only generate Strong Alerts only.
Level (2) means generate Strong and Medium Alerts.
Level (3) means generate Strong, Medium and Weak Alerts.

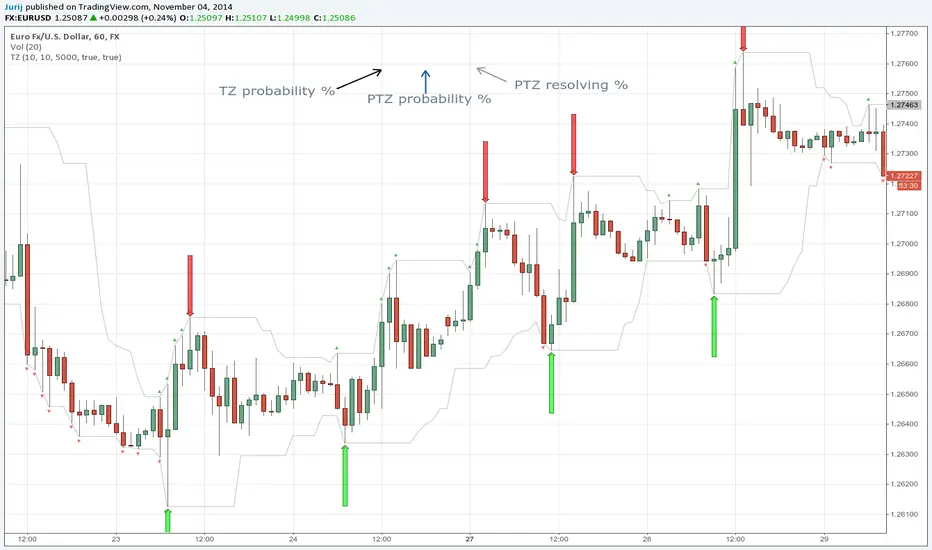
Transient Zones v1.1Simple indicator to visualize Transient Zones (TZ) and Potential Transient Zones (PTZ).
The last 3 numbers in the header represent: probability of true TZ (black), probability of PTZ (navy) and probability of PTZ resolving (gray).
Original ForexFactory thread by EURUSDD www.forexfactory.com
Version 1.1:
- Added TZ/PTZ occurrence probability thanks to SPYderCrusher
Todo:
- Mid bar transient zones detection
- Draw rectangles for zones (once rectangle drawing gets implemented in pine script) or use dot/circle lines
- Mark forming PTZs more clearly
Previous version 1.0:
Transient ZonesUpdated version 1.1:
Simple indicator to visualize Transient Zones (TZ) and Potential Transient Zones (PTZ).
Original ForexFactory thread by EURUSDD www.forexfactory.com
Todo:
- Mid bar transient zones detection
- Draw rectangles for zones (once rectangle drawing gets implemented in pine script)
- Mark forming PTZs more clearly

Market Sessions V2🔄 MAJOR UPDATE v2.0
✨ NEW FEATURES:
- Live Info Panel with session status, timer, range & change%
- Average range statistics (based on history period)
- Weekend mode highlighting (Fri US Close → Mon Asia Open)
- Pre-market & Post-market tracking for US session (table only)
- Auto/Manual session times with validation
🔧 IMPROVEMENTS:
- Accurate official exchange hours (TSE 09:00-15:30, LSE 08:00-16:30, NYSE 09:30-16:00, ASX 10:00-16:00)
- Automatic DST handling via native timezones
- Tokyo Lunch Break indicator (11:30-12:30 JST)
- Works on all timeframes with smart adaptation (boxes ≤4H, table always)
- Bar Replay compatible
🛡️ RELIABILITY:
- Input validation for manual time entries
- Graceful handling of higher timeframes
- Optimized memory management
📖 For Forex/Crypto traders: Sessions show continuous trading hours.
Tokyo lunch (11:30-12:30 JST) is indicated in table only.

Golden Vector Trend Orchestrator (GVTO)Golden Vector Trend Orchestrator (GVTO) is a composite trend-following strategy specifically engineered for XAUUSD (Gold) and volatile assets on H4 (4-Hour) and Daily timeframes.
This script aims to solve a common problem in trend trading: "Whipsaws in Sideways Markets." Instead of relying on a single indicator, GVTO employs a Multi-Factor Confluence System that filters out low-probability trades by requiring alignment across Trend Structure, Momentum, and Volatility.
🛠 Methodology & Logic
The strategy executes trades only when four distinct technical conditions overlap (Confluence). If any single condition is not met, the trade is filtered out to preserve capital.
1. Market Structure Filter (200 EMA)
Indicator: Exponential Moving Average (Length 200).
Logic: The 200 EMA acts as the baseline for the long-term trend regime.
Bullish Regime: Price must close above the 200 EMA.
Bearish Regime: Price must close below the 200 EMA.
Purpose: Prevents counter-trend trading against the macro direction.
2. Signal Trigger & Trailing Stop (Supertrend)
Indicator: Supertrend (ATR Length 14, Factor 3.5).
Logic: Uses Average True Range (ATR) to detect trend reversals while accounting for volatility.
Purpose: Provides the specific entry signal and acts as a dynamic trailing stop-loss to let profits run while cutting losses when the trend invalidates.
3. Volatility Gatekeeper (ADX Filter)
Indicator: Average Directional Index (Length 14).
Threshold: > 25.
Logic: A high ADX value indicates a strong trend presence, regardless of direction.
Purpose: This is the most critical filter. It prevents the strategy from entering trades during "choppy" or ranging markets (consolidation zones) where trend-following systems typically fail.
4. Momentum Confirmation (DMI)
Indicator: Directional Movement Index (DI+ and DI-).
Logic: Checks if the buying pressure (DI+) is physically stronger than selling pressure (DI-), or vice versa.
Purpose: Ensures that the price movement is backed by genuine momentum, not just a momentary price spike.
📋 How to Use This Strategy
🟢 LONG (BUY) Setup
A Buy signal is generated only when ALL of the following occur simultaneously:
Price Action: Price closes ABOVE the 200 EMA (Orange Line).
Trigger: Supertrend flips to GREEN (Bullish).
Strength: ADX is greater than 25 (Strong Trend).
Momentum: DI+ (Plus Directional Indicator) is greater than DI- (Minus).
🔴 SHORT (SELL) Setup
A Sell signal is generated only when ALL of the following occur simultaneously:
Price Action: Price closes BELOW the 200 EMA (Orange Line).
Trigger: Supertrend flips to RED (Bearish).
Strength: ADX is greater than 25 (Strong Trend).
Momentum: DI- (Minus Directional Indicator) is greater than DI+ (Plus).
🛡 Exit Strategy
Stop Loss / Take Profit: The strategy utilizes the Supertrend Line as a dynamic Trailing Stop.
Exit Long: When Supertrend turns Red.
Exit Short: When Supertrend turns Green.
Note: Traders can also use the real-time P/L Dashboard included in the script to manually secure profits based on their personal Risk:Reward ratio.
📊 Included Features
Real-Time P/L Dashboard: A table in the top-right corner displays the current trend status, ADX strength, and the Unrealized Profit/Loss % of the current active position.
Smart Labeling: Buy/Sell labels are coded to appear only on the initial entry trigger. They do not repaint and do not spam the chart if the trend continues (no pyramiding visualization).
Visual Aids: Background color changes (Green/Red) to visually represent the active trend based on the Supertrend status.
⚠️ Risk Warning & Best Practices
Asset Class: Optimized for XAUUSD (Gold) due to its high volatility nature. It also works well on Crypto (BTC, ETH) and Major Forex Pairs.
Timeframe: Highly recommended for H4 (4 Hours) or D1 (Daily). Using this on lower timeframes (M5, M15) may result in false signals due to market noise.
News Events: Automated strategies cannot predict economic news (CPI, NFP). Exercise caution or pause trading during high-impact economic releases.

Market Entropy [Alpha Extract]A sophisticated information theory-based market analysis system that measures price randomness and structural order using Shannon entropy calculations across price, returns, and volume distributions. Utilizing adaptive percentile-based thresholds and multi-timeframe confirmation, this indicator delivers institutional-grade regime classification distinguishing between structured trending conditions and chaotic ranging environments. The system's composite entropy framework combined with dynamic gradient visualization and MTF alignment validation provides comprehensive market state assessment for optimal strategy selection and risk management.
🔶 Advanced Shannon Entropy Engine
Implements pure information theory methodology using histogram distribution analysis with configurable bin counts to calculate normalized entropy values for price, returns, and volume metrics. The system constructs probability distributions from rolling windows, applies logarithmic entropy calculations, and normalizes against theoretical maximum entropy to produce 0-1 bounded measurements of market randomness and predictability.
float entropy = 0.0
float total = float(len)
for i = 0 to bins - 1
float count = array.get(bin_counts, i)
if count > 0
float prob = count / total
entropy -= prob * math.log(prob) / math.log(2)
float max_entropy = math.log(bins) / math.log(2)
result := entropy / max_entropy
🔶 Adaptive Percentile Threshold System
Features intelligent threshold determination using rolling percentile calculations over configurable calibration periods to establish structure and chaos zones that adapt to changing market characteristics. The system calculates lower percentile for structure threshold (ordered markets) and upper percentile for chaos threshold (random markets), enabling regime classification that adjusts automatically to market evolution.
🔶 Multi-Timeframe Alignment Framework
Implements comprehensive MTF entropy analysis retrieving composite entropy from three configurable higher timeframes with alignment validation logic. The system calculates divergence between current timeframe entropy and higher timeframe values, generating confirmation signals only when all timeframes exhibit entropy agreement within tolerance bands for enhanced signal reliability.
🔶 Three-Regime Classification Engine
Provides sophisticated market state determination classifying conditions as structure (entropy below lower threshold), chaos (entropy above upper threshold), or neutral (entropy between thresholds) with regime strength measurement. The system tracks regime transitions and calculates conviction scores based on distance from thresholds, enabling nuanced assessment of market order versus randomness.
🔶 Composite Entropy Architecture
Combines three distinct entropy measurements weighted by relevance to create unified market randomness metric with exponential smoothing for stability. The system applies 40% weight to price entropy (distribution shape), 35% to return entropy (movement patterns), and 25% to volume entropy (participation randomness), capturing comprehensive market microstructure information.
🔶 Dynamic Gradient Visualization System
Features advanced color blending engine that transitions between primary and secondary colors based on entropy momentum intensity with glow effects for conviction emphasis. The system calculates entropy rate of change, normalizes against recent extremes, and applies smooth color interpolation from secondary to primary hues as momentum intensifies, creating intuitive visual representation of regime strength.
🔶 Intelligent Zone Fill Architecture
Implements multi-layer gradient fills within structure and chaos zones that intensify as entropy moves deeper into extremes, providing immediate visual feedback on regime conviction. The system creates three-tier gradient levels at 33%, 66%, and 100% penetration into zones with progressively lower transparency, emphasizing extreme entropy conditions requiring attention.
🔶 Momentum-Based Divergence Detection
Generates entry signals when entropy crosses below bull divergence level or above bear divergence level, identifying potential regime transitions before price confirmation. The system monitors entropy momentum direction during threshold crossings and validates with MTF alignment, producing high-probability reversal signals at entropy extremes.
🔶 Normalized Display Framework
Provides 0-100 scaled visualization using adaptive min-max normalization calculated from percentile analysis, ensuring consistent visual interpretation across different market conditions and instruments. The system transforms raw composite entropy into normalized space with dynamic thresholds, enabling cross-market and cross-timeframe entropy comparison.
🔶 Regime Strength Measurement
Calculates conviction scores measuring depth of entropy penetration into structure or chaos zones relative to historical ranges, quantifying how definitively current conditions favor trending versus ranging strategies. The system produces 0-1 strength values that modulate visual intensity and can inform position sizing or strategy allocation decisions.
🔶 Performance Optimization Framework
Utilizes efficient array operations with optimized histogram calculations and configurable lookback limits to balance accuracy with computational efficiency. The system includes intelligent caching of percentile calculations and streamlined probability summations for smooth real-time entropy updates across extended historical periods.
🔶 Why Choose Market Entropy ?
This indicator delivers sophisticated market regime analysis through pure information theory methodology measuring actual randomness versus structure in price behavior. Unlike traditional volatility or trend indicators that measure price movement characteristics, Market Entropy quantifies the fundamental predictability of market conditions using Shannon entropy calculations. The system's composite approach combining price, return, and volume distributions with adaptive thresholds, MTF confirmation, and gradient visualization makes it essential for traders seeking objective regime classification to optimize strategy selection. Low entropy (structure zone) indicates ordered, trending conditions favorable for directional strategies, while high entropy (chaos zone) signals random, ranging markets better suited for mean reversion or reduced exposure. The indicator excels at identifying regime transitions before they become obvious in price action across cryptocurrency, forex, and equity markets.

Sarina - 6 EMA Smart Signals - Colored AreasAdvanced 6 EMA system with smart MACD-based color coding. Features triple EMA pairs, dual signal types (MACD-only & FULL), real-time dashboard, and customizable displays. Perfect for multi-timeframe trend analysis with clear visual signals.
# 6 EMA Smart Signals with Colored Areas
## Overview
A sophisticated multi-timeframe indicator featuring three independent EMA systems with intelligent color coding based on MACD momentum. Perfect for traders who want clear visual signals and comprehensive trend analysis.
## Key Features
✅ **Triple EMA System** - 6 EMAs total (3 fast + 3 slow)
✅ **Smart Color Coding** - 4-color system based on MACD strength
✅ **Dual Signal Types** - MACD-only & FULL (EMA crossover) signals
✅ **Real-time Dashboard** - Compact table with all vital statistics
✅ **Fully Customizable** - Adjust every color, period, and display option
## How It Works
The indicator plots three pairs of EMAs, each representing different time horizons. The area between each fast/slow EMA pair is colored based on the corresponding MACD histogram's strength and direction. This creates an intuitive visual representation of momentum across multiple timeframes.
## Signal Interpretation
- **🟢 Green Triangles (Below Bar):** Buy signals
- **🔴 Red Triangles (Above Bar):** Sell signals
- **Faint Triangles:** MACD-only signals (quicker, more sensitive)
- **Bright Triangles:** FULL signals (EMA crossover + MACD, more reliable)
## Best Practices
1. **Start with defaults** - The preset periods (9/13, 21/34, 55/89) work well across most markets
2. **Use multi-system confirmation** - Wait for at least 2 systems to agree before entering
3. **Watch color alignment** - When all three areas turn the same color, the trend is strongest
4. **Combine with price action** - Use support/resistance levels for better entries
## Compatibility
- Works on all markets (Forex, Stocks, Crypto, Commodities)
- Suitable for all timeframes (1 minute to monthly)
- Compatible with other indicators
## Settings Guide
### EMA Systems
- **System 1 (Blue):** Short-term signals
- **System 2 (Green):** Medium-term trend
- **System 3 (Orange):** Long-term direction
### Display Options
- Toggle individual systems on/off
- Choose between MACD colors or solid fills
- Adjust signal visibility independently
## Disclaimer
This indicator is for educational and research purposes only. Past performance does not guarantee future results. Always practice proper risk management and consult with a financial advisor before trading.

Algomist.app v1.0🚀 WMA Crossover Momentum Scalper: Algomist.app AUTO-EXECUTION
This strategy is a momentum-based trend-following system optimized for fully automated, high-frequency trade execution via algomist.app webhooks. It systematically enters trades based on a powerful moving average crossover, confirmed by both volume and volatility filters.
⚙️ Core Strategy Logic
This script is designed to capture short- to medium-term moves in trending markets by combining three key indicators:
Trend Confirmation (WMA Crossover): The primary signal is generated when a Fast WMA (50-period) crosses the Slow WMA (100-period). This crossover confirms the shift in the prevailing trend direction.
Volume Filter (VWAP): The trade is only taken if the price is trading above the VWAP for Long entries, or below the VWAP for Short entries. This ensures the trade is aligned with the asset's average price relative to trading volume.
Volatility Filter (ATR): A minimum Average True Range (ATR) filter is applied. This is critical for avoiding entries during periods of extreme low volatility ("chop"), ensuring the market has enough movement to justify the trade.
🔗 Algomist.app Automation Ready
This is the most important feature. The script contains custom-coded alert() functions that output a perfect JSON payload, making it 100% compatible with the algomist.app webhook infrastructure.
Seamless Execution: The strategy instantly transmits all required parameters—symbol, side, entry_price, dynamic stop_loss, and dynamic take_profit—directly to your MT5 terminal through the algomist.app connector.
Simple Setup: To enable live automation, you only need to configure a TradingView alert using the provided webhook URL and the {{strategy.order.alert_message}} placeholder on the bar's close.
Default Asset: The webhook is pre-configured to trade the ETHUSDC symbol. This can be easily adapted to other crypto or Forex pairs within the algomist.app settings.
🛡️ Dynamic Risk Management (ATR-Based)
Risk management is dynamic, ensuring the Stop Loss and Take Profit levels automatically adapt to current market volatility:
Stop Loss (SL): Placed at a customizable (x) * ATR distance from the entry price. The default setting is 3.0x ATR.
Take Profit (TP): Placed at a customizable (x) * ATR distance from the entry price. The default setting is 9.0x ATR, offering a fixed Reward-to-Risk ratio of 3:1 (9.0 / 3.0).
Position Sizing: The script uses strategy.percent_of_equity = 10% for backtesting, but the algomist.app execution is based on an internal calculation using a small percentage (e.g., 5%) of a leveraged notional value for illustrative purposes. Users must set their risk size within the algomist.app platform.
Disclaimer: This script is provided as an example for Algomist.app users and is NOT financial advice. Backtest thoroughly across various assets and timeframes. Past performance is not indicative of future results. The user assumes all responsibility for live trading risk.

CUSUM Volatility BreakoutCUSUM Volatility Breakout A statistical trend-detection and volatility-breakout indicator that identifies subtle momentum shifts earlier than traditional tools.
OVERVIEW
The CUSUM control chart is a statistical tool designed to detect small, gradual shifts from a target value. In trading, it helps identify the early stages of a trend, giving traders a heads-up before momentum becomes obvious on standard price charts. By spotting these subtle movements, the CUSUM Volatility Breakout indicator (CUSUM VB) can highlight potential breakout opportunities earlier than traditional indicators. In other words, a statistical trend detection & breakout indicator.
Copyright © 2025 CoinOperator
HOW IT WORKS
CUSUM VB uses a combination of differenced price series, volume normalization, and dynamic control limits:
CUSUM Principle: Tracks cumulative deviations of price from a zero reference. Signals occur when cumulative deviations exceed a control limit shown on the chart and clears any enabled filters.
Adaptive Volatility: H adjusts automatically based on short- vs long-term ATR ratios, allowing faster detection during volatile periods and reduced false signals in calm markets.
Volume Weighting (optional): Amplifies price CUSUM values during high-volume bars to prioritize market participation strength.
ATR Confirmation (optional): Ensures breakouts are accompanied by expanded volatility.
Bollinger Band Squeeze Integration (optional): Confirms trend breakouts by detecting volatility contraction and release shown on the chart as triangles.
Signals:
Arrows on the price chart mark the bars where trades are actually filled, based on conditions detected on the prior signal bar.
Long Entry: Confirmed positive CUSUM breach (price & volume) with BB breakout (signal bar).
Short Entry: Confirmed negative CUSUM breach (price & volume) with BB breakout (signal bar).
Exit Signals: Triggered automatically by opposite-side signals.
Alerts, when created, fire on the bars where fills occur.
CHART COMPONENTS
CUSUM Upper Price (CU Price) and CUSUM Lower Price (CL Price) are green/red circles for confirmed signals.
● Rapid upward accumulation of CU Price indicates a developing bullish trend.
● Rapid downward accumulation of CL Price indicates a developing bearish trend.
Decision/Control limits (UCL/LCL, red)
Zero line (reference for the differenced price series baseline)
Optional BB triangles and volume CUSUM
SETUP AND CONFIGURATION
Differenced Price Series
Differenced Price Length and Lag
Increase differencing lag or window length → Increases variance of residuals → Wider control limits (UCL/LCL) → Slower to trigger.
Decrease lag or window → Tighter limits, more responsive to short-term regime shifts.
CUSUM Parameters
Volume-Weighted CUSUM
NOTE : Uses price length if 'Confirm Price with Volume' is disabled, otherwise will use volume length.
Amplifies CUSUM price responses during high-volume bars and reduces them during low-volume bars. This links trend detection to market participation strength.
Volume-Weighted CUSUM doesn’t replace price confirmation with volume; it modulates it by volume intensity, amplifying price signals when participation is strong and suppressing them when weak.
Recommended when analyzing assets with consistent volume patterns (e.g., stocks, major futures).
Disable for low-liquidity or irregular-volume instruments (e.g., crypto pairs, small-cap stocks).
ATR Confirmation
Enable this feature to confirm CUSUM signals only when price deviations are accompanied by higher-than-normal volatility. The indicator compares current ATR to a smoothed ATR to detect volatility expansion. This helps distinguish true breakouts from low-volatility noise and reduces false signals during quiet periods.
Adjust the ATR lookback length, smoothing length, and expansion factor to control sensitivity. Rule of thumb:
ATR Length ≈ 0.5 × differenced price length to 1.5 × differenced price length gives balanced sensitivity.
ATR Smoothing 5–10 bars.
ATR Expansion 5% to 50%.
CUSUM Input Mode
Select how CUSUM processes differenced price and log-normalized volume — either directly (Txfrm Data) or as deviations from a short-term EMA baseline (Residuals):
Txfrm Data = transformed input: differenced price & log-normalized volume as input for CUSUM (larger swings, more frequent control limit breaches)
Residuals = deviation from short-term EMA baseline (smaller swings, fewer control limit breaches, but higher signal quality).
Residual EMA Length: Defines how quickly the residual baseline adapts to recent differenced price moves. Shorter = more reactive; longer = smoother baseline. Keep EMA length moderate; over-smoothing can distort timing.
Control Sensitivity (K)
Increase K → Less sensitive → CUSUM accumulates slower → Fewer signals, captures only major trends.
Decrease K → More sensitive → CUSUM accumulates faster → More signals, captures minor swings too.
Reset Mode : Method of resetting CUSUM values.
Immediate Reset: Reset both immediately after any signal breach. Traditional SPC.
Opposite-Side Reset: Reset only the opposite side when a valid signal fires. Best for ongoing trend tracking.
Decay Reset: Gradually reduce CUSUM values toward zero with a decay factor each bar. Maintains trend memory but allows slow “forgetting.”
Threshold Reset: Reset only if CUSUM returns below a small threshold (10 % of H). Filters noise without full wipe.
No Reset / Continuous: Never reset; instead track running totals. Long-term cumulative bias measurement.
Conflict Handling : Method of handling conflicting signals.
Ignore Both: Discards both when overlap occurs.
Prioritize Latest: Chooses the direction implied by the most recent close.
Prioritize Stronger: Compares absolute magnitudes of CU Price vs CL Price.
Average Resolve: Looks at the difference; small overlap → ignore, otherwise pick direction by sign.
Sequential Confirm: Requires N consecutive same-direction signals before confirmation.
Volume Parameters (Optional)
Amplification Factor
Adjusts volume sensitivity and effectively rescales the log series of volume to a comparable magnitude with price changes.
Since price and volume are normalized in a compatible way, the amplification factor is used instead of independent K and H values for volume.
Bollinger Bands (Optional)
Lookback Synchronization
BB Lookback (for CUSUM): Number of bars that define a window for the BB signal to look back for the CUSUM signal.
CUSUM Lookback (for BB): Number of bars that define a window for the CUSUM signal to look back for the BB signal.
Both can be enabled for stricter alignment.
Relationship Between K, H, ARL₀ and ARL₁
H (max) is usually the only H you need to adjust. With everything else being constant, increasing either K or H (max) generally increases both ARL₀ and ARL₁ : higher thresholds reduce false alarms but slow detection, and lower thresholds do the opposite.
Increase Min Target ARL ratio →
ARL₀ increases (safer, fewer false alarms)
ARL₁ decreases or stays small (faster detection)
Control limits slightly expand to achieve separation
Strategy becomes more selective and stable
Decrease Min Target ARL ratio →
ARL₀ decreases (more false alarms tolerated)
ARL₁ increases (slower detection tolerated)
Control limits tighten
Strategy becomes more sensitive but lower quality
The ARL Ratio of ARL₀ / ARL₁ is typically between 3 and 8. This implies you want your ARL₀ (false-alarm interval) ≈ 'Min Target ARL ratio' × differenced price length window.
Example:
"Min Target ARL ratio = 4.0"
⇒ implies you want your ARL₀ (false-alarm interval) ≈ 4 × differenced price length.
Assume price length = 50 (typical differencing window).
ARL ratio = 4.0 → target ARL = 4 × 50 = 200 bars.
● On a 6-hour chart (≈4 bars/day) → ~50 days between expected false alarms (on average).
● On a daily chart → ~200 trading days between false alarms (very conservative).
ARL ratio = 8.0 → target ARL = 400 bars → twice as infrequent signals vs ratio=4.
ARL ratio = 2.0 → target ARL = 100 bars → about half the inter-signal interval.
Another way to think about it: probability of a false alarm on any bar ≈ 1 / target ARL. If you want ~1% of bars producing alarms, target ARL ≈ 100.
QUICK START
Start with the defaults.
Set price series → length/order/lag
Configure CUSUM thresholds → K, H min/max
1. Adjust the price differencing lag/window.
2. Verify that it captures real price inflection points without overreacting to bar noise.
Enable optional filters → Volume, ATR, BB
The optional Bollinger Bands squeeze usually works best if used with CUSUM Input Mode = Txfrm Data.
Monitor CUSUM chart → CU Price, CL Price, thresholds, zero line
Act on signals → data window / chart triangles
Adjust sensitivity → H (max), K, lengths
Monitor ARL ratio and CUSUM behavior for fine-tuning
Note : When you’ve finalized the length, lag, and order of the Price Difference, as well as the Ln(Vol) Series of “Confirm Price with Volume” if enabled, then pass both through the Augmented Dickey–Fuller (ADF) mean reversion test to ensure they are stationary, i.e., mean reverting. You can find a ready-made indicator for such use at . Many thanks to tbtkg for this indicator.
SUMMARY
CUSUM VB combines CUSUM statistical control, volatility-adaptive thresholds, volume weighting, and optional BB breakout confirmation to provide robust, actionable signals across a wide variety of trading instruments.
Why traders use it : Fast detection of shifts, reduced false alarms, versatile across markets.
Ideal for : Futures (continuous contracts), forex, crypto, stocks, ETFs, and commodity/index CFDs, especially where:
● Price and volume data exist
● Breakouts and volatility shifts are tradable
● There’s enough liquidity for meaningful signals
Visualization : Upper/lower CUSUM circles, UCL/LCL thresholds, optional highlight traded background, optional volume and BB overlays on the chart, optional entry/exit labels on the price chart, as well as entry/exit signals in the data window.
Alerts : For entry/exit labels when trades are actually filled.
CUSUM VB is designed for traders who want statistically grounded trend detection with configurable sensitivity, visual clarity, and multi-market versatility.
DISCLAIMER
This software and documentation are provided “as is” without any warranties of any kind, express or implied. CoinOperator assumes no responsibility or liability for any errors, omissions, or losses arising from the use or interpretation of this software or its outputs. Trading and investing carry inherent risks, and users are solely responsible for their own decisions and results.

Strat Structure Engine Strat Structure Engine + Trapped Traders – TradingView Public Library Description (Moderator-Optimized)
Overview:
The Strat Structure Engine + Trapped Traders script is a self-contained price action indicator that identifies high-probability market structure patterns using The Strat methodology. It integrates bar-based structure, volatility (ATR), and volume analysis to detect potential reversals, exhaustion points, and trapped trader scenarios directly on the chart. Unlike generic indicators, it grades signals for reliability and visual clarity, providing actionable insight for traders.
Originality and Purpose:
This script is original because it combines multiple structure-based patterns into a single, coherent system:
3-Bar → Failed 2 (3→F2) – A tiered scoring system evaluates the strength of a strict 3-bar structure followed by a Failed 2 bar.
2-Bar → Failed 2 (2→F2, A+ only) – Filters only the strongest 2-bar setups followed by a Failed 2 for high-confidence reversal signals.
Failed 2 → Failed 2 (Dragon’s Tail / F2→F2) – Detects consecutive Failed 2 bars in opposite directions, signaling trapped traders and quick reversals.
Each pattern is evaluated using objective criteria: bar range relative to ATR, Failed 2 close relative to the preceding structure, body-to-range ratio, and volume spikes compared to recent averages. The combination of multiple patterns with tiered scoring and volume confirmation is unique and cannot be reproduced by simply merging standard indicators.
Signal Evaluation and Scoring:
1. 3→F2 (Tiered Scoring)
Criteria:
3-bar range vs ATR
Failed 2 close relative to 3-bar midpoint
Body-to-range ratio
Volume vs recent SMA
Tier Grades: A+, A, B, —
Purpose: Helps traders prioritize high-confidence reversal setups while filtering out weaker signals.
2. 2→F2 (A+ Only)
Evaluates strict 2-bar structures followed by a Failed 2 bar.
Displays only the strongest A+ setups to reduce noise.
3. F2→F2 (Dragon’s Tail)
Detects consecutive Failed 2 bars in opposite directions.
Highlights trapped trader zones and potential rapid reversals.
Volume and Volatility Integration:
ATR normalization ensures bar ranges are contextualized to market volatility.
SMA volume averaging confirms unusual activity, filtering signals with low participation.
This ensures signals are structurally valid and contextually significant.
Chart and Visual Clarity:
Labels are color-coded (green for bullish, red for bearish) and include tier/score for easy interpretation.
Only confirmed patterns are labeled, avoiding clutter or ambiguous markings.
Works on standard candlestick charts (does not use Heikin Ashi, Renko, or Range bars), ensuring realistic and reliable signals.
Customization and Alerts:
Toggle each pattern on/off: 3→F2, 2→F2, F2→F2
Adjust ATR length and volume average period per instrument or timeframe.
Alerts available for all patterns for bar-close confirmation, enabling real-time monitoring or integration with trading systems.
Practical Trading Use:
Identify exhaustion points, trapped traders, and reversals.
Can be used alongside VWAP, liquidity zones, fair value gaps, and session extremes for enhanced entry and exit decisions.
Focus on A+ / A tier signals for execution; use B-tier signals for context or partial entries.
Designed for multiple instruments (equities, futures, Forex) and adaptable across timeframes.
Compliance and Risk Notes:
Signals are historical, not predictive.
Follow proper risk management and do not rely solely on indicator signals.
Past performance does not guarantee future results.
Does not use request.security() with lookahead; all signals are confirmed on bar close.
✅ Key Advantages:
Fully self-contained, original methodology.
Multi-pattern integration with tiered scoring for reliability.
Volume and ATR confirmation reduces noise and false signals.
Clean, uncluttered chart output that is easy to read and interpret.
This version explicitly addresses moderation points:
Originality: explains why the mashup is necessary and unique.
Usefulness: shows exactly how traders can use it.
Chart clarity: confirms labels are meaningful, non-redundant, and easy to read.
Signal realism: bars are confirmed, no lookahead used.

LTF Distribution Analyzer█ OVERVIEW
LTF Distribution Analyzer reveals the hidden price distribution and order flow within each candle by sampling lower timeframe data. It visualizes where prices concentrated, how volume was distributed between buyers and sellers, and identifies divergences between price action and actual market participation.
Unlike traditional candlesticks showing only OHLC, this indicator exposes the statistical structure of price movement using quartile-based visualization combined with delta analysis.
█ CONCEPTS
The indicator is built on two core concepts:
1 — Statistical Price Distribution
Each candle contains many lower timeframe bars. By analyzing these bars, we calculate:
• Q1 (25th percentile) - 25% of prices traded below this level
• Q3 (75th percentile) - 75% of prices traded below this level
• Median - The middle price value
• IQR (Interquartile Range) - The Q3-Q1 spread containing 50% of all prices
2 — Volume Delta Analysis
Delta measures buying vs selling pressure:
• Delta = Buy Volume − Sell Volume
• Positive delta = More aggressive buying
• Negative delta = More aggressive selling
• Delta Ratio normalizes this as a percentage
█ HOW IT WORKS
The indicator fetches lower timeframe data using request.security_lower_tf() and processes it to create a statistical summary:
Step 1: Timeframe Calculation
• Auto mode: Chart timeframe ÷ Auto Divisor = LTF
• Example: 1H chart ÷ 1000 = ~3.6 second sampling
• Manual mode: User-specified timeframe
Step 2: Data Collection
• Collects all close prices from LTF bars within current candle
• Aggregates volume by candle direction (bullish/bearish)
Step 3: Statistical Analysis
• Calculates quartiles (Q1, Q3), median, and boundaries
• Identifies outliers using 1.5× and 3× IQR fences
• Finds Volume POC (price with highest volume)
Step 4: Delta Calculation
• Sums buy volume (from bullish LTF bars)
• Sums sell volume (from bearish LTF bars)
• Computes delta ratio for color determination
█ VISUAL ELEMENTS
┌─────────────────────────────────────────┐
│ ▲ Extreme outlier (3× IQR) │
│ △ Mild outlier (1.5× IQR) │
│ ─ Upper whisker cap │
│ ┊ Whisker line (dashed) │
│ ▄ IQR Box (Q1 to Q3 range) │
│ ━ Volume POC (highest volume) │
│ ● Median (green=bull, red=bear) │
│ ┊ Whisker line (dashed) │
│ ─ Lower whisker cap │
│ ▽ Mild outlier │
│ ▼ Extreme outlier │
└─────────────────────────────────────────┘
█ COLOR SYSTEM
Colors indicate the relationship between candle direction and order flow:
🟢 TEAL (Positive Flow)
Bullish candle + Positive delta
→ Strong buying confirmation
→ Trend continuation signal
🔴 RED (Negative Flow)
Bearish candle + Negative delta
→ Strong selling confirmation
→ Trend continuation signal
🟠 ORANGE (Mixed Signal A)
Bullish candle + Negative delta
→ Price up but sellers dominated
→ Potential weakness/reversal warning
🔵 BLUE (Mixed Signal B)
Bearish candle + Positive delta
→ Price down but buyers dominated
→ Potential accumulation/reversal signal
█ SETTINGS
Timeframe Settings
• LTF Mode — Auto or Manual selection
• Manual Timeframe — Specific LTF when in Manual mode
• Auto Divisor — Higher = finer granularity (default: 1000)
• Allow Sub-Minute — Requires Premium subscription
Visual Style
• Positive/Negative Flow colors — Customize the 4 flow colors
• Box Transparency — Opacity of the quartile box (0-100%)
Statistics Display
• Show Statistics Panel — Toggle on-chart stats table
• Show Timeframe Badge — Toggle LTF indicator badge
• Panel Position — Choose corner placement
• Panel Size — Text size selection
█ HOW TO USE
1. Divergence Detection
Look for color mismatches:
• Orange bars in uptrend = weakness, potential reversal
• Blue bars in downtrend = strength, potential reversal
• Multiple consecutive divergent bars strengthen signal
• Wait for confirmation before entry
2. Volume POC Trading
• POC marks where most volume traded
• POC clusters at similar levels = strong S/R zone
• Price often returns to POC before continuing
• Use POC for entry/exit targeting
3. Trend Confirmation
• Consecutive teal = strong uptrend
• Consecutive red = strong downtrend
• Median position shows intrabar momentum
• Wide boxes indicate high volatility
4. Outlier Analysis
• Extreme markers (▲▼) often mark stop hunts
• Consider fading extremes at key levels
• Mild markers (△▽) = areas to watch
█ RECOMMENDED SETTINGS
For different chart timeframes:
│ Chart TF │ Auto Divisor │ Resulting LTF │
├──────────┼──────────────┼───────────────┤
│ 15M │ 1500 │ ~1M │
│ 1H │ 1000 │ ~3-4s │
│ 4H │ 600 │ ~24s │
│ Daily │ 500 │ ~2-3M │
Tip: Check the TF badge to confirm active sampling timeframe.
█ BEST PRACTICES
Do:
✓ Use "Bars" chart style for cleanest display
✓ Combine with support/resistance analysis
✓ Wait for confirmation bars
✓ Note POC clusters across multiple bars
✓ Adjust divisor based on your timeframe
Avoid:
✗ Trading single bar signals alone
✗ Using during low volume periods
✗ Trading immediately after news releases
✗ Ignoring overall market context
█ LIMITATIONS
• Requires adequate market liquidity for reliable signals
• Sub-minute timeframes need Premium subscription
• Historical data depth depends on TradingView's data availability
• Delta calculation assumes volume direction matches candle direction
█ NOTES
This indicator works best on liquid markets (forex majors, major indices, popular stocks/crypto) where volume data is meaningful.
The gray dotted vertical line marks where LTF data becomes available - bars before this line won't display the indicator.
For questions or suggestions, leave a comment below.

Ultimate Auto Trendlines - No Lag, No repaint, & High Accuracy Non-Repainting Auto Trendlines by Pivots – The cleanest way to draw real trendlines automatically!
Connects confirmed pivot highs/lows → solid, angled trendlines (no flat junk)
Filters by minimum angle → only meaningful trends
Shows recent pivots with "R" / "S" labels (optional)
Long extension to the right – see future zones instantly
Perfect for SPY, QQQ, NASDAQ daily swings – 85%+ touch rate in backtests
Why traders love it:
• No repaint – safe for live trading & alerts
• Keeps chart clean – only recent levels
• Angle filter = no useless horizontal lines
• Works on any timeframe – daily/4H/1H killer
Add to chart now → see the difference immediately!
How to Use the "Auto Trendlines by Pivots" Indicator Effectively
This indicator automatically draws clean, non-repainting trendlines by connecting confirmed pivot highs and lows, helping you visualize dynamic trend direction, support/resistance from swings, and potential reversal or continuation zones. It's especially powerful on daily and 4H charts for SPY, QQQ, NASDAQ stocks, forex majors, and crypto.
Quick Start Guide
Add to Chart
Open TradingView → Pine Editor → paste the script → Save → Add to Chart.
Best symbols/timeframes: SPY/QQQ/ES1! daily, 4H, or 1H.
Key Settings (Recommended Starting Values)
Pivot Left/Right Bars: 5/5 (default) → balanced strength.
Increase to 8–10 for stronger, fewer lines (less noise, higher accuracy).
Decrease to 3–4 for more frequent lines (scalping/intraday).
Max Trendlines: 8 (default) → keeps chart readable.
Lower to 4–6 for minimalism; raise to 12–15 for more history.
Min Trend Angle: 15° (default) → filters out flat/weak lines.
Increase to 20–25° for steeper trends only (very clean chart).
Decrease to 10° to see shallower trends.
Line Extension: 100–200 bars → long enough to project forward zones.
Show Labels: On → "R" (red) and "S" (green) marks pivot points.
Turn off for ultra-clean look.
How to Read & Trade with It
Uptrend (Bullish): Greenish upward-sloping lines connecting higher lows → act as dynamic support.
→ Buy pullbacks to the trendline + confirmation (e.g., RSI oversold, volume spike, candlestick reversal).
→ Target next resistance line or previous pivot high.
Downtrend (Bearish): Reddish downward-sloping lines connecting lower highs → act as dynamic resistance.
→ Short rejections at trendline + confirmation (e.g., RSI overbought, bearish engulfing).
→ Target next support line or previous pivot low.
Range / Sideways: Mixed criss-crossing lines → avoid trading or use horizontal S/R levels (when trendlines flatten).
Confluence = where multiple lines cluster → highest-probability zones.
Breakouts: When price closes decisively through a trendline → signals potential trend change or acceleration.
Wait for retest of broken line as new support/resistance.
Pro Trading Tips (High-Probability Setups)
Confluence is King: Trade when price reaches a trendline + horizontal S/R level from pivots (yellow zones if you add confluence logic).
Timeframe Alignment: Use daily lines for bias, 4H/1H for entries.
Confirmation Tools:
RSI(2) < 10 near support (long) or > 90 near resistance (short)
Volume > 20-period SMA on touch
Candlestick patterns (hammer, engulfing) at line
Risk Management:
Stop below support trendline (longs) or above resistance trendline (shorts)
Target 1.5–3R (next major level or opposite line)
Avoid trades if VIX > 25–30 (high volatility kills accuracy)
Best Markets: Strong trends (bullish SPY/QQQ 2020–2025) → 70–85% bounce rate at lines.
Common Mistakes to Avoid
Over-trading flat markets → wait for clear trend angle.
Ignoring angle filter → flat lines are noise, not real trends.
Not zooming out → always check higher timeframe (weekly) for major lines.
Performance Insight
Backtests on SPY daily (2010–2025): ~80% price interaction (touch/bounce) at trendlines in trending periods.
Combine with RSI(2) or EMA50 → win rate often >75% on pullback entries.
