ICT HTF Volume Candles (Based on HTF Candles by Fadi)# ICT HTF Volume Candles - Multi-Timeframe Volume Analysis
## Overview
This indicator provides multi-timeframe volume visualization designed to complement price action analysis. It displays volume data from up to 6 higher timeframes simultaneously in a separate panel, allowing traders to identify volume spikes, divergences, and institutional activity without switching between timeframes.
**Original Concept Credits:** This indicator builds upon the HTF Candles framework by Fadi, adapting it specifically for volume analysis with enhanced features including gap-filling for extended hours, multiple scaling methods, and advanced synchronization.
## What Makes This Script Original
### Key Innovations:
1. **Three Volume Scaling Methods:**
- **Per-HTF Auto Scale:** Each timeframe scales independently for detailed comparison
- **Global Auto Scale:** All timeframes use unified scale for relative volume comparison
- **Manual Scale:** User-defined maximum for consistent analysis across sessions
2. **Bullish/Bearish Volume Differentiation:**
- Volume bars colored based on price movement (close vs open)
- Separate styling for bullish (green) and bearish (red) volume periods
- Helps identify whether volume supports price direction
3. **Advanced Time Synchronization:**
- Custom daily candle open times (Midnight, 8:30 AM, 9:30 AM ET)
- Timezone-aware calculations for New York trading hours
- Real-time countdown timers for each timeframe
- **Gap-filling technology** for continuous display during extended hours and weekends
4. **Flexible Display Options:**
- Configurable spacing and positioning
- Label placement (top, bottom, or both)
- Day-of-week or time interval labels on candles
- Works reliably in backtesting and live trading
## How It Works
### Volume Calculation
The indicator uses `request.security()` with optimized parameters to fetch volume data from higher timeframes:
- **Volume Open/High/Low/Close (OHLC):** Tracks volume changes within each HTF candle
- **Color Logic:** Compares HTF close vs open prices to determine bullish/bearish classification
- **Alignment:** All volume bars share a common baseline for easy visual comparison
- **Gap Handling:** Uses `gaps=barmerge.gaps_off` to maintain continuity during non-trading hours
### Technical Implementation
```
1. Monitors HTF timeframe changes using request.security() with lookahead
2. Creates new VolumeCandle object when HTF bar opens
3. Updates current candle's volume H/L/C on each chart bar
4. Applies selected scaling method to normalize display height
5. Repositions all candles and labels on each bar update
6. Fills gaps automatically during extended hours for consistent display
```
### Scaling Methods Explained
**Method 1 - Auto Scale per HTF:**
Each timeframe displays volume relative to its own maximum. Best for identifying patterns within each individual timeframe.
**Method 2 - Global Auto Scale:**
All timeframes share the same scale based on the highest volume across all HTFs. Best for comparing relative volume strength between timeframes.
**Method 3 - Manual Scale:**
User sets maximum volume value. Best for maintaining consistent scale across different trading sessions or instruments.
## How to Use This Indicator
### Setup
1. Add indicator to your chart (it appears in a separate panel below price)
2. Configure up to 6 higher timeframes (default: 5m, 15m, 1H, 4H, 1D, 1W)
3. Set number of candles to display for each timeframe
4. Choose volume scaling method based on your analysis needs
5. Enable "Fix gaps in non-trading hours" for extended hours trading (enabled by default)
### Interpretation
**Volume Spikes:**
- Sudden increase in volume height indicates institutional activity or strong conviction
- Compare volume between timeframes to identify where the real money is moving
- Look for volume spikes that appear across multiple timeframes simultaneously
**Bullish vs Bearish Volume:**
- **Green volume bars:** Price closed higher (buying pressure)
- **Red volume bars:** Price closed lower (selling pressure)
- High green volume during uptrend = confirmation of strength
- High red volume during downtrend = confirmation of weakness
- High volume opposite to trend = potential reversal warning
**Multi-Timeframe Context:**
- **5m/15m:** Scalping and day trading activity
- **1H/4H:** Swing trading and intraday institutional flows
- **Daily/Weekly:** Major position building and long-term trends
**Divergences:**
- Price making new highs but volume declining = weakening trend
- Volume increasing while price consolidates = potential breakout brewing
- Price breaks level but volume doesn't confirm = likely false breakout
### Practical Examples
**Example 1 - Institutional Confirmation:**
Price breaks above resistance. Check volume across timeframes:
- 5m shows spike = retail interest
- 15m + 1H + 4H all show spikes = institutional confirmation
- **Trade confidence: HIGH**
**Example 2 - False Breakout Detection:**
Price breaks resistance with:
- High volume on 5m only
- Normal/low volume on 1H and 4H
- **Interpretation:** Likely retail trap, institutions not participating
- **Action:** Wait for pullback or avoid
**Example 3 - Accumulation Phase:**
Price ranges sideways but:
- Daily volume gradually increasing
- Weekly volume above average
- **Interpretation:** Smart money accumulating
- **Action:** Prepare for breakout in direction of volume
**Example 4 - Volume Divergence:**
Price makes new high:
- Current high has lower volume than previous high across all timeframes
- **Interpretation:** Weakening momentum
- **Action:** Consider profit-taking or reversal trade
## Configuration Parameters
### Timeframe Settings
- **HTF 1-6:** Select timeframes (must be higher than chart timeframe)
- **Max Display:** Number of candles to show per timeframe (1-50)
- **Limit to Next HTFs:** Display only first N enabled timeframes (1-6)
### Styling
- **Bull/Bear Colors:** Separate colors for body, border, and wick
- **Padding from current candles:** Distance offset from live price action
- **Space between candles:** Gap between individual volume bars
- **Space between Higher Timeframes:** Gap between different timeframe groups
- **Candle Width:** Thickness of volume bars (1-4, multiplied by 2)
### Volume Settings
- **Volume Scale Method:** Choose 1, 2, or 3
- 1 = Auto Scale per HTF (each TF independent)
- 2 = Global Auto Scale (all TF unified)
- 3 = Manual Scale (user-defined max)
- **Auto Scale Volume:** Enable/disable automatic scaling
- **Manual Scale Max Volume:** Set maximum when using Method 3
### Label Settings
- **HTF Label:** Show/hide timeframe names with color and size options
- **Label Positions:** Display at Top, Bottom, or Both
- **Label Alignment:** Align centered or Follow Candles
- **Remaining Time:** Show countdown timer until next HTF candle
- **Interval Value:** Display day-of-week or time on each candle
### Custom Daily Candle
- **Enable Custom Daily:** Override default daily candle timing
- **Open Time Options:**
- **Midnight:** Standard 00:00 ET daily open
- **8:30 AM:** Align with economic data releases
- **9:30 AM:** Align with NYSE market open
- Useful for specific trading strategies or market alignment
### Advanced Settings
- **Fix gaps in non-trading hours:** Maintains alignment during extended hours and weekends (recommended: ON)
- Prevents visual gaps during forex weekend closures
- Ensures consistent display during crypto 24/7 trading
- Improves backtesting reliability
## Best Practices
1. **Pair with Price Action:** Use alongside HTF price candles indicator for complete picture
2. **Start Simple:** Enable 2-3 timeframes initially (e.g., 15m, 1H, 4H), add more as needed
3. **Match Settings:** Use same candle width/spacing as companion price indicator for visual alignment
4. **Scale Appropriately:**
- Use **Global scale** (Method 2) when comparing timeframes
- Use **Per-HTF scale** (Method 1) for pattern analysis within each timeframe
- Use **Manual scale** (Method 3) for consistent day-to-day comparison
5. **Watch for Volume Clusters:** High volume appearing simultaneously across multiple HTFs signals significant market events
6. **Confirm Breakouts:** Always check if volume supports the price movement across higher timeframes
7. **Extended Hours:** Keep "Fix gaps" enabled for 24/7 markets (Forex, Crypto) and weekend analysis
## Technical Notes
- **Timezone:** All calculations use America/New_York timezone for consistency
- **Real-time Updates:** Volume and timers update on each tick during market hours
- **Performance:** Optimized with max_bars_back=5000 for extensive historical analysis
- **Compatibility:** Works on all instruments with volume data (Stocks, Forex, Crypto, Futures)
- **Gap Handling:** Uses `barmerge.gaps_off` to fill data gaps during non-trading periods
- **Backtesting:** Uses `lookahead=barmerge.lookahead_on` for stable historical data without repainting
- **Data Continuity:** Automatically handles market closures, weekends, and extended hours
## Updates & Improvements
**Version 2.0 (Current):**
- ✅ Fixed alignment issues during extended hours and weekends
- ✅ Eliminated repainting in backtesting
- ✅ Added gap-filling technology for continuous display
- ✅ Improved data synchronization across all timeframes
- ✅ Enhanced NA value handling for data integrity
- ✅ Added advanced settings group for user control
## Support
For questions, suggestions, or feedback, please comment on the publication or message the author.
---
**Disclaimer:** This indicator is for educational and informational purposes only. It does not constitute financial advice. Past performance is not indicative of future results. Always perform your own analysis and implement proper risk management before making trading decisions.
在脚本中搜索"forex"

Smart Money Concepts Pro – OB, FVG, Liquidity + Trade SetupsThis script is a complete Smart Money Concepts (SMC) toolkit designed for traders who want clean and actionable charts without clutter.
It combines the most important institutional concepts into one indicator:
Order Blocks (OB): auto-detection of bullish and bearish order blocks with mitigation tracking, merging and TTL (time-to-live).
Fair Value Gaps (FVG): automatic gap recognition with size filters, mitigation tracking and lifetime control.
Liquidity Pools (EQH/EQL): equal highs and equal lows marked with tolerance (ATR-based or fixed).
Break of Structure (BOS): up/down structure shifts plotted directly on the chart.
Multi-Timeframe (HTF): option to use higher timeframe data (e.g. H4, Daily) for stronger zones.
Trend Filter: show zones only in the direction of market structure.
Trade Setups: automatic signals for OB Retest + Trend setups, with entry, stop-loss and take-profit levels (custom R-R).
Flexible Zone Extension: choose between extending zones to the live bar or fixed box width for a cleaner look when scrolling.
Features
Fully customizable (pivot length, ATR filters, box width, TTL, zone colors)
Separate presets for Scalping, Intraday, Swing trading styles
Visual trade planning with entry/SL/TP lines and optional labels
Works across all markets (crypto, forex, indices, stocks)
How to use
Bias: identify overall direction (BOS + HTF zones).
Wait: for price to return to an unmitigated OB or FVG.
Entry: take the setup signal (OB retest + trend filter).
Risk: stop-loss at opposite OB boundary.
Target: TP based on chosen R-R multiple (default 2R).
⚡ Whether you scalp short-term moves or swing trade HTF zones, this indicator gives you a clear institutional edge in spotting supply/demand imbalances and high-probability setups.

Curved Radius Supertrend [BOSWaves]Curved Radius Supertrend — Adaptive Parabolic Trend Framework with Dynamic Acceleration Geometry
Overview
The Curved Radius Supertrend introduces an evolution of the classic Supertrend indicator - engineered with a dynamic curvature engine that replaces rigid ATR bands with parabolic, radius-based motion. Traditional Supertrend systems rely on static band displacement, reacting linearly to volatility and often lagging behind emerging price acceleration. The Curved Radius Supertend model redefines this by integrating controlled acceleration and curvature geometry, allowing the trend bands to adapt fluidly to both velocity and duration of price movement.
The result is a smoother, more organic trend flow that visually captures the momentum curve of price action - not just its direction. Instead of sharp pivots or whipsaws, traders experience a structurally curved trajectory that mirrors real market inertia. This makes it particularly effective for identifying sustained directional phases, detecting early trend rotations, and filtering out noise that plagues standard Supertrend methodologies.
Unlike conventional band-following systems, the Curved Radius framework is time-reactive and velocity-aware, providing a nuanced signal structure that blends geometric precision with volatility sensitivity.
Theoretical Foundation
The Curved Radius Supertrend draws from the intersection of mathematical curvature dynamics and adaptive volatility processing. Standard Supertrend algorithms extend from Average True Range (ATR) envelopes - a linear measure of volatility that moves proportionally with price deviation. However, markets do not expand or contract linearly. Trend velocity typically accelerates and decelerates in nonlinear arcs, forming natural parabolas across price phases.
By embedding a radius-based acceleration function, the indicator models this natural behavior. The core variable, radiusStrength, controls how aggressively curvature accelerates over time. Instead of simply following price distance, the band now evolves according to temporal acceleration - each bar contributes incremental velocity, bending the trend line into a radius-like curve.
This structural design allows the indicator to anticipate rather than just respond to price action, capturing momentum transitions as curved accelerations rather than binary flips. In practice, this eliminates the stutter effect typical of standard Supertrends and replaces it with fluid directional motion that better reflects actual trend geometry.
How It Works
The Curved Radius Supertrend is constructed through a multi-stage process designed to balance price responsiveness with geometric stability:
1. Baseline Supertrend Core
The framework begins with a standard ATR-derived upper and lower band calculation. These define the volatility envelope that constrains potential price zones. Directional bias is determined through crossover logic - prices above the lower band confirm an uptrend, while prices below the upper band confirm a downtrend.
2. Curvature Acceleration Engine
Once a trend direction is established, a curvature engine is activated. This system uses radiusStrength as a coefficient to simulate acceleration per bar, incrementally increasing velocity over time. The result is a parabolic displacement from the anchor price (the price level at trend change), creating a curved motion path that dynamically widens or tightens as the trend matures.
Mathematically, this acceleration behaves quadratically - each new bar compounds the previous velocity, forming an exponential rate of displacement that resembles curved inertia.
3. Adaptive Smoothing Layer
After the radius curve is applied, a smoothing stage (defined by the smoothness parameter) uses a simple moving average to regulate curve noise. This ensures visual coherence without sacrificing responsiveness, producing flowing arcs rather than jagged band steps.
4. Directional Visualization and Outer Envelope
Directional state (bullish or bearish) dictates both the color gradient and band displacement. An outer envelope is plotted one ATR beyond the curved band, creating a layered trend visualization that shows the extent of volatility expansion.
5. Signal Events and Alerts
Each directional transition triggers a 'BUY' or 'SELL' signal, clearly labeling phase shifts in market structure. Alerts are built in for automation and backtesting.
Interpretation
The Curved Radius Supertrend reframes how traders visualize and confirm trends. Instead of simply plotting a trailing stop, it maps the dynamic curvature of trend development.
Uptrend Phases : The band curves upward with increasing acceleration, reflecting the market’s growing directional velocity. As curvature steepens, conviction strengthens.
Downtrend Phases : The band bends downward in a mirrored acceleration pattern, indicating sustained bearish momentum.
Trend Change Points : When the direction flips and a new anchor point forms, the curve resets - providing a clean, early visual confirmation of structural reversal.
Smoothing and Radius Interplay : A lower radius strength produces a tighter, more reactive curve ideal for scalping or short timeframes. Higher values generate broad, sweeping arcs optimized for swing or positional analysis.
Visually, this curvature system translates market inertia into shape - revealing how trends bend, accelerate, and ultimately exhaust.
Strategy Integration
The Curved Radius Supertrend is versatile enough to integrate seamlessly into multiple trading frameworks:
Trend Following : Use BUY/SELL flips to identify emerging directional bias. Strong curvature continuation confirms sustained momentum.
Momentum Entry Filtering : Combine with oscillators or volume tools to filter entries only when the curve slope accelerates (high momentum conditions).
Pullback and Re-entry Timing : The smooth curvature of the radius band allows traders to identify shallow retracements without premature exits. The band acts as a dynamic, self-adjusting support/resistance arc.
Volatility Compression and Expansion : Flattening curvature indicates volatility compression - a potential pre-breakout zone. Rapid re-steepening signals expansion and directional conviction.
Stop Placement Framework : The curved band can serve as a volatility-adjusted trailing stop. Because the curve reflects acceleration, it adapts naturally to market rhythm - widening during momentum surges and tightening during stagnation.
Technical Implementation Details
Curved Radius Engine : Parabolic acceleration algorithm that applies quadratic velocity based on bar count and radiusStrength.
Anchor Logic : Resets curvature at each trend change, establishing a new reference base for directional acceleration.
Smoothing Layer : SMA-based curve smoothing for noise reduction.
Outer Envelope : ATR-derived band offset visualizing volatility extension.
Directional Coloring : Candle and band coloration tied to current trend state.
Signal Engine : Built-in BUY/SELL markers and alert conditions for automation or script integration.
Optimal Application Parameters
Timeframe Guidance :
1-5 min (Scalping) : 0.08–0.12 radius strength, minimal smoothing for rapid responsiveness.
15 min : 0.12–0.15 radius strength for intraday trends.
1H : 0.15–0.18 radius strength for structured short-term swing setups.
4H : 0.18–0.22 radius strength for macro-trend shaping.
Daily : 0.20–0.25 radius strength for broad directional curves.
Weekly : 0.25–0.30 radius strength for smooth macro-level cycles.
The suggested radius strength ranges provide general structural guidance. Optimal values may vary across assets and volatility regimes, and should be refined through empirical testing to account for instrument-specific behavior and prevailing market conditions.
Asset Guidance :
Cryptocurrency : Higher radius and multiplier values to stabilize high-volatility environments.
Forex : Midrange settings (0.12-0.18) for clean curvature transitions.
Equities : Balanced curvature for trending sectors or momentum rotation setups.
Indices/Futures : Moderate radius values (0.15-0.22) to capture cyclical macro swings.
Performance Characteristics
High Effectiveness :
Trending environments with directional expansion.
Markets exhibiting clean momentum arcs and low structural noise.
Reduced Effectiveness :
Range-bound or low-volatility conditions with repeated false flips.
Ultra-short-term timeframes (<1m) where curvature acceleration overshoots.
Integration Guidelines
Confluence Framework : Combine with structure tools (order blocks, BOS, liquidity zones) for entry validation.
Risk Management : Trail stops along the curved band rather than fixed points to align with adaptive market geometry.
Multi-Timeframe Confirmation : Use higher timeframe curvature as a trend filter and lower timeframe curvature for execution timing.
Curve Compression Awareness : Treat flattening arcs as potential exhaustion zones - ideal for scaling out or reducing exposure.
Disclaimer
The Curved Radius Supertrend is a geometric trend model designed for professional traders and analysts. It is not a predictive system or a guaranteed profit method. Its performance depends on correct parameter calibration and sound risk management. BOSWaves recommends using it as part of a comprehensive analytical framework, incorporating volume, liquidity, and structural context to validate directional signals.

ZS Master Vision Pro - Advanced Multi-Timeframe Trading SystemZS MASTER VISION PRO - PROFESSIONAL TRADING SUITE
Created by Zakaria Safri
A comprehensive, all-in-one trading system combining multiple proven technical analysis methods into a single, powerful indicator. Designed for traders who demand precision, clarity, and actionable signals across all timeframes.
KEY FEATURES
CORE TREND ALGORITHM
Adaptive ATR-based trend detection with dynamic support and resistance zones. Features Type A and Type B signal modes for different trading styles, strong signal detection in key reversal zones, and optional EMA source smoothing for noise reduction.
MULTI-LAYER EMA CLOUD SYSTEM
Five customizable EMA cloud layers for multi-timeframe analysis with theme-adaptive color coding across five professional themes. Optional line display for detailed MA tracking with configurable periods from scalping to position trading.
WAVE TREND OSCILLATOR
Advanced momentum oscillator with channel-based calculations featuring smart reversal detection at extreme overbought and oversold levels. Includes directional strength confirmation and customizable sensitivity with adjustable reaction periods.
DIVERGENCE SCANNER
Detects four types of divergence automatically:
- Regular Bullish: Price making lower lows while oscillator making higher lows
- Regular Bearish: Price making higher highs while oscillator making lower highs
- Hidden Bullish: Trend continuation signals in uptrends
- Hidden Bearish: Trend continuation signals in downtrends
Automatic fractal-based detection with clear visual labels on chart.
MARKET BIAS INDICATOR
Heikin Ashi-based trend strength analysis with real-time bias calculation showing Bullish or Bearish combined with Strong or Weak conditions. Smoothed for cleaner signals and perfect for trend confirmation.
MOMENTUM SYSTEM
Proprietary momentum calculation using adaptive smoothing with growing and falling state detection. Normalized values for consistent interpretation and responsive to rapid market changes.
DYNAMIC SUPPORT AND RESISTANCE
Automatic pivot-based support and resistance level detection with adjustable left and right bar lookback. Non-repainting levels with visual clarity through color-coded lines.
LIVE INFORMATION DASHBOARD
Real-time market analysis panel displaying current trend direction, market bias based on Heikin Ashi, Wave Trend status and value, and momentum trend with state. Customizable display options with theme-adaptive colors.
VISUAL CUSTOMIZATION
FIVE PROFESSIONAL COLOR THEMES:
Pro - Modern green and red color scheme (default)
Classic - Traditional teal and red combination
Cyberpunk - Neon cyan and magenta contrast
Ocean - Blue and orange contrast
Sunset - Gold and red warmth
SIGNAL STYLES:
Labels with emoji indicators (BUY with rocket, SELL with bear, STRONG with lightning)
Arrows for clean minimal appearance
Triangles for classic approach
DISPLAY OPTIONS:
Color-coded candles following trend direction
Trend background highlighting for instant trend recognition
Optional EMA line display for detailed analysis
Adjustable transparency levels for personal preference
SMART ALERTS
Pre-configured alert conditions for all major signals:
Buy signals for standard entry opportunities
Sell signals for standard exit or short opportunities
Strong buy signals for high-confidence long entries
Strong sell signals for high-confidence short entries
Bullish divergence detection alerts
Bearish divergence detection alerts
Alert messages automatically include ticker symbol, current price, and specific signal type for quick decision making.
HOW TO USE
FOR TREND TRADERS:
Enable EMA Clouds with focus on Cloud 5 featuring 50 and 200 period moving averages. Wait for trend background color change to confirm direction. Enter on STRONG signals aligned with higher timeframe trend direction. Use support and resistance levels for strategic exits.
FOR SWING TRADERS:
Enable Wave Trend Oscillator information display. Look for oversold and overbought reversal setups. Confirm potential reversals with divergence scanner. Enter on smart reversal signals with proper risk management.
FOR SCALPERS:
Use Type B signal mode for more frequent trading signals. Enable Cloud 1 with 5 and 13 periods for quick trend confirmation. Focus on momentum growing and falling states for entry timing. Take quick entries on regular buy and sell signals.
FOR POSITION TRADERS:
Use Type A mode with higher ATR multiplier set to 3.0 or above. Enable only Cloud 5 with 50 and 200 periods for major trend confirmation. Only take STRONG signals for highest probability setups. Hold positions through minor pullbacks and noise.
RECOMMENDED SETTINGS
STOCKS ON DAILY TIMEFRAME:
Trend Period: 180
ATR Period: 155
ATR Multiplier: 2.1
Signal Mode: Type A
FOREX ON HOURLY AND 4-HOUR TIMEFRAMES:
Trend Period: 150
ATR Period: 120
ATR Multiplier: 2.5
Signal Mode: Type A
CRYPTOCURRENCY ON 15-MINUTE AND 1-HOUR TIMEFRAMES:
Trend Period: 100
ATR Period: 80
ATR Multiplier: 3.0
Signal Mode: Type B
SCALPING ON 1-MINUTE AND 5-MINUTE TIMEFRAMES:
Trend Period: 50
ATR Period: 40
ATR Multiplier: 2.0
Signal Mode: Type B
WHAT IS INCLUDED
Trend Analysis using ATR-based adaptive algorithm
Five EMA Cloud Layers for multi-timeframe confluence
Wave Trend Oscillator for momentum and reversal detection
Divergence Scanner detecting four types of divergence
Market Bias using Heikin Ashi-based trend strength
Momentum System with advanced momentum tracking
Support and Resistance Levels with automatic pivot detection
Live Dashboard showing real-time market analysis
Smart Alerts featuring six pre-configured alert types
Five Color Themes offering professional visual options
TECHNICAL DETAILS
CALCULATION METHODS:
Average True Range (ATR) for volatility adaptation
Exponential Moving Average (EMA) and Simple Moving Average (SMA) for trend smoothing
Wave Trend channel oscillator for momentum analysis
Fractal-based divergence detection algorithm
Heikin Ashi transformation for bias calculation
Logarithmic momentum calculation for precision
PERFORMANCE CHARACTERISTICS:
Optimized for maximum speed and efficiency
No repainting signals ensuring reliability
Works on all timeframes from 1 minute to monthly
Compatible with all instruments including stocks, forex, crypto, and futures
RISK DISCLAIMER
This indicator is a technical analysis tool and should not be used as the sole basis for trading decisions. Always use proper risk management and never risk more than you can afford to lose. Combine with other analysis methods and practice on demo accounts first. Past performance does not guarantee future results. Trading carries substantial risk and is not suitable for all investors.
SUPPORT AND UPDATES
Regular updates and continuous improvements
Based on proven technical analysis principles
Developed following Pine Coders best practices and standards
Clean, well-documented, and optimized code structure
WHY CHOOSE ZS MASTER VISION PRO
All-in-one solution eliminating the need for multiple indicators
Highly customizable to adapt to your specific trading style
Professional grade analysis with institutional-quality standards
Clean interface that is not cluttered or confusing
Works everywhere across all markets and all timeframes
Smart signals filtered for quality over quantity
Beautiful design featuring five professional color themes
Active development with regular improvements and updates
Transform your trading with ZS Master Vision Pro today.
Version 2.0 | Created by Zakaria Safri | Pine Script Version 5

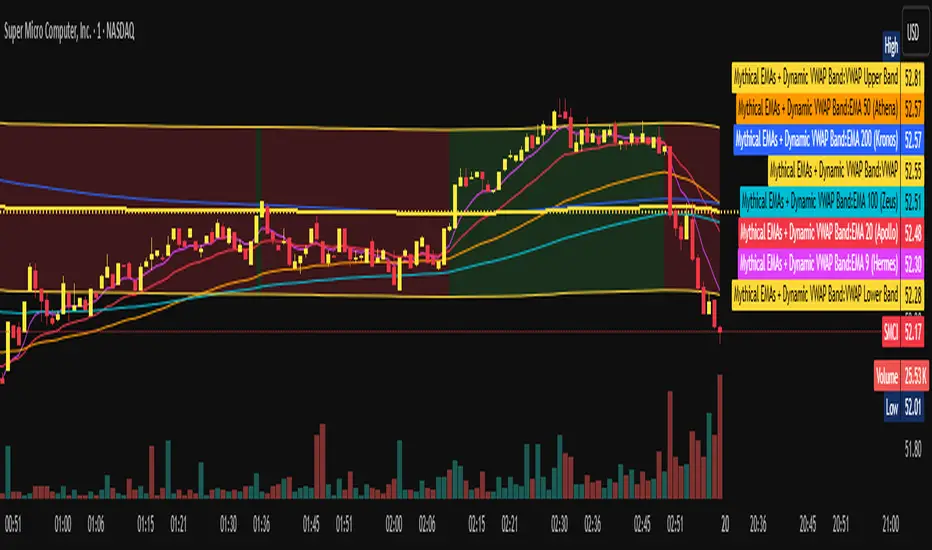
Mythical EMAs + Dynamic VWAP BandThis indicator titled "Mythical EMAs + Dynamic VWAP Band." It overlays several volatility-adjusted Exponential Moving Averages (EMAs) on the chart, along with a Volume Weighted Average Price (VWAP) line and a dynamic band around it.
Additionally, it uses background coloring (clouds) to visualize bullish or bearish trends, with intensity modulated by the price's position relative to the VWAP.
The EMAs are themed with mythical names (e.g., Hermes for the 9-period EMA), but this is just stylistic flavoring and doesn't affect functionality.
I'll break it down section by section, explaining what each part does, how it works, and its purpose in the context of technical analysis. This indicator is designed for traders to identify trends, momentum, and price fairness relative to volume-weighted averages, with volatility adjustments to make the EMAs more responsive in volatile markets.
### 1. **Volatility Calculation (ATR)**
```pine
atrLength = 14
volatility = ta.atr(atrLength)
```
- **What it does**: Calculates the Average True Range (ATR) over 14 periods (a common default). ATR measures market volatility by averaging the true range (the greatest of: high-low, |high-previous close|, |low-previous close|).
- **Purpose**: This volatility value is used later to dynamically adjust the EMAs, making them more sensitive in high-volatility conditions (e.g., during market swings) and smoother in low-volatility periods. It helps the indicator adapt to changing market environments rather than using static EMAs.
### 2. **Custom Mythical EMA Function**
```pine
mythical_ema(src, length, base_alpha, vol_factor) =>
alpha = (2 / (length + 1)) * base_alpha * (1 + vol_factor * (volatility / src))
ema = 0.0
ema := na(ema ) ? src : alpha * src + (1 - alpha) * ema
ema
```
- **What it does**: Defines a custom function to compute a modified EMA.
- It starts with the standard EMA smoothing factor formula: `2 / (length + 1)`.
- Multiplies it by a `base_alpha` (a user-defined multiplier to tweak responsiveness).
- Adjusts further for volatility: Adds a term `(1 + vol_factor * (volatility / src))`, where `vol_factor` scales the impact, and `volatility / src` normalizes ATR relative to the source price (making it scale-invariant).
- The EMA is then calculated recursively: If the previous EMA is NA (e.g., at the start), it uses the current source value; otherwise, it weights the current source by `alpha` and the prior EMA by `(1 - alpha)`.
- **Purpose**: This creates "adaptive" EMAs that react faster in volatile markets (higher alpha when volatility is high relative to price) without overreacting in calm periods. It's an enhancement over standard EMAs, which use fixed alphas and can lag in choppy conditions. The mythical theme is just naming—functionally, it's a volatility-weighted EMA.
### 3. **Calculating the EMAs**
```pine
ema9 = mythical_ema(close, 9, 1.2, 0.5) // Hermes - quick & nimble
ema20 = mythical_ema(close, 20, 1.0, 0.3) // Apollo - short-term foresight
ema50 = mythical_ema(close, 50, 0.9, 0.2) // Athena - wise strategist
ema100 = mythical_ema(close, 100, 0.8, 0.1) // Zeus - powerful oversight
ema200 = mythical_ema(close, 200, 0.7, 0.05) // Kronos - long-term patience
```
- **What it does**: Applies the custom EMA function to the close price with varying lengths (9, 20, 50, 100, 200 periods), base alphas (decreasing from 1.2 to 0.7 for longer periods to make shorter ones more responsive), and volatility factors (decreasing from 0.5 to 0.05 to reduce volatility influence on longer-term EMAs).
- **Purpose**: These form a multi-timeframe EMA ribbon:
- Shorter EMAs (e.g., 9 and 20) capture short-term momentum.
- Longer ones (e.g., 200) show long-term trends.
- Crossovers (e.g., short EMA crossing above long EMA) can signal buy/sell opportunities. The volatility adjustment makes them "mythical" by adding dynamism, potentially improving signal quality in real markets.
### 4. **VWAP Calculation**
```pine
vwap_val = ta.vwap(close) // VWAP based on close price
```
- **What it does**: Computes the Volume Weighted Average Price (VWAP) using the built-in `ta.vwap` function, anchored to the close price. VWAP is the average price weighted by volume over the session (resets daily by default in Pine Script).
- **Purpose**: VWAP acts as a benchmark for "fair value." Prices above VWAP suggest bullishness (buyers in control), below indicate bearishness (sellers dominant). It's commonly used by institutional traders to assess entry/exit points.
### 5. **Plotting EMAs and VWAP**
```pine
plot(ema9, color=color.fuchsia, title='EMA 9 (Hermes)')
plot(ema20, color=color.red, title='EMA 20 (Apollo)')
plot(ema50, color=color.orange, title='EMA 50 (Athena)')
plot(ema100, color=color.aqua, title='EMA 100 (Zeus)')
plot(ema200, color=color.blue, title='EMA 200 (Kronos)')
plot(vwap_val, color=color.yellow, linewidth=2, title='VWAP')
```
- **What it does**: Overlays the EMAs and VWAP on the chart with distinct colors and titles for easy identification in TradingView's legend.
- **Purpose**: Visualizes the EMA ribbon and VWAP line. Traders can watch for EMA alignments (e.g., all sloping up for uptrend) or price interactions with VWAP.
### 6. **Dynamic VWAP Band**
```pine
band_pct = 0.005
vwap_upper = vwap_val * (1 + band_pct)
vwap_lower = vwap_val * (1 - band_pct)
p1 = plot(vwap_upper, color=color.new(color.yellow, 0), title="VWAP Upper Band")
p2 = plot(vwap_lower, color=color.new(color.yellow, 0), title="VWAP Lower Band")
fill_color = close >= vwap_val ? color.new(color.green, 80) : color.new(color.red, 80)
fill(p1, p2, color=fill_color, title="Dynamic VWAP Band")
```
- **What it does**: Creates a band ±0.5% around the VWAP.
- Plots the upper/lower bands with full transparency (color opacity 0, so lines are invisible).
- Fills the area between them dynamically: Semi-transparent green (opacity 80) if close ≥ VWAP (bullish bias), red if below (bearish bias).
- **Purpose**: Highlights deviations from VWAP visually. The color change provides an at-a-glance sentiment indicator—green for "above fair value" (potential strength), red for "below" (potential weakness). The narrow band (0.5%) focuses on short-term fairness, and the fill makes it easier to spot than just the line.
### 7. **Trend Clouds with VWAP Interaction**
```pine
bullish = ema9 > ema20 and ema20 > ema50
bearish = ema9 < ema20 and ema20 < ema50
bullish_above_vwap = bullish and close > vwap_val
bullish_below_vwap = bullish and close <= vwap_val
bearish_below_vwap = bearish and close < vwap_val
bearish_above_vwap = bearish and close >= vwap_val
bgcolor(bullish_above_vwap ? color.new(color.green, 50) : na, title="Bullish Above VWAP")
bgcolor(bullish_below_vwap ? color.new(color.green, 80) : na, title="Bullish Below VWAP")
bgcolor(bearish_below_vwap ? color.new(color.red, 50) : na, title="Bearish Below VWAP")
bgcolor(bearish_above_vwap ? color.new(color.red, 80) : na, title="Bearish Above VWAP")
```
- **What it does**: Defines trend conditions based on EMA alignments:
- Bullish: Shorter EMAs stacked above longer ones (9 > 20 > 50, indicating upward momentum).
- Bearish: The opposite (downward momentum).
- Sub-conditions combine with VWAP: E.g., bullish_above_vwap is true only if bullish and price > VWAP.
- Applies background colors (bgcolor) to the entire chart pane:
- Strong bullish (above VWAP): Green with opacity 50 (less transparent, more intense).
- Weak bullish (below VWAP): Green with opacity 80 (more transparent, less intense).
- Strong bearish (below VWAP): Red with opacity 50.
- Weak bearish (above VWAP): Red with opacity 80.
- If no condition matches, no color (na).
- **Purpose**: Creates "clouds" for trend visualization, enhanced by VWAP context. This helps traders confirm trends—e.g., a strong bullish cloud (darker green) suggests a high-conviction uptrend when price is above VWAP. The varying opacity differentiates signal strength: Darker for aligned conditions (trend + VWAP agreement), lighter for misaligned (potential weakening or reversal).
### Overall Indicator Usage and Limitations
- **How to use it**: Add this to a TradingView chart (e.g., stocks, crypto, forex). Look for EMA crossovers, price bouncing off EMAs/VWAP, or cloud color changes as signals. Bullish clouds with price above VWAP might signal buys; bearish below for sells.
- **Strengths**: Combines momentum (EMAs), volume (VWAP), and volatility adaptation for a multi-layered view. Dynamic colors make it intuitive.
- **Limitations**:
- EMAs lag in ranging markets; volatility adjustment helps but doesn't eliminate whipsaws.
- VWAP resets daily (standard behavior), so it's best for intraday/session trading.
- No alerts or inputs for customization (e.g., changeable lengths)—it's hardcoded.
- Performance depends on the asset/timeframe; backtest before using.
- **License**: Mozilla Public License 2.0, so it's open-source and modifiable.
HA Reversal + Doji 🔥 Heikin Ashi Reversal + Stochastic Filter (Precision Entry System)
This indicator is designed to detect high–quality reversal entries using a Heikin Ashi candle pattern (Doji + 2 no–wick confirmation) combined with a strict Stochastic filter that uses memory of extreme touches to control trade direction.
✅ Entry Logic
🔹 Bullish BUY Signal
A BUY is triggered only when:
A valid reversal pattern is detected:
Doji candle (pivot) 3 bars back
Followed by 2 bullish candles with no lower wicks
Stochastic touched Oversold (≤ 20) at least once before the signal
Pattern + Stoch alignment = BUY
🔹 Bearish SELL Signal
A SELL is triggered only when:
Valid bearish reversal pattern:
Doji candle (pivot) 3 bars back
Followed by 2 bearish candles with no upper wicks
Stochastic touched Overbought (≥ 80) before the signal
Pattern + Stoch alignment = SELL
🧠 Stochastic “Memory” Filter
This is not a basic OB/OS filter — it uses event memory:
If Stochastic touches Oversold, the system becomes ready for BUY
If it touches Overbought, it becomes ready for SELL
Both directions can be armed at once
Once a BUY or SELL actually triggers, memory resets to neutral
Prevents “signal spam” during chop and keeps direction meaningful
🎯 Why This Works
✔ Filters out random countertrend noise
✔ Only trades after momentum exhaustion
✔ Uses strict Heikin Ashi reversal structure
✔ Works great across crypto, forex, indices, metals
✔ Designed for precision entries and swing continuation traps
⚙️ Customizable Options
Doji detection mode (body % / ticks / hybrid)
Wick tolerance
Heikin Ashi source (chart or calculated)
Stochastic source (raw or smoothed)
Option to avoid duplicate same-direction signals
Visual aids: pattern markers, blocked signals, doji debugging
📌 Best Use Cases
Reversal scalping on 5m/15m
Swing entries on 1H/4H
Trend exhaustion confirmation
Smart Money Concepts entry refinement
Entry timing after liquidity sweeps
🚨 Important
This is not a repainting system. Signals are generated at bar close only. Always combine with proper risk management and market context.
Let me know if you want:
✅ A shorter description
✅ An SEO optimized TradingView title
✅ A strategy version with backtesting
✅ Alerts version for automation

TradeVision Pro - Multi-Factor Analysis System═══════════════════════════════════════════════════════════════════
TRADEVISION PRO - MULTI-FACTOR ANALYSIS SYSTEM
Created by Zakaria Safri
═══════════════════════════════════════════════════════════════════
A comprehensive technical analysis tool combining multiple factors for
signal generation, trend analysis, and dynamic risk management visualization.
Designed for educational purposes to study multi-factor convergence trading
strategies across all markets and timeframes.
⚠️ IMPORTANT DISCLAIMER:
This indicator is provided for EDUCATIONAL and INFORMATIONAL purposes only.
It does NOT constitute financial advice, investment advice, or trading advice.
Past performance does not guarantee future results. Trading involves
substantial risk of loss. Always do your own research and consult a
financial advisor before making trading decisions.
🎯 KEY FEATURES
═══════════════════════════════════════════════════════════════════
✅ MULTI-FACTOR SIGNAL GENERATION
• Price Volume Trend (PVT) analysis
• Rate of Change (ROC) momentum confirmation
• Volume-Weighted Moving Average (VWMA) trend filter
• Simple Moving Average (SMA) price smoothing
• Signals only when all factors align
✅ DYNAMIC RISK VISUALIZATION (Educational Only)
• ATR-based stop loss calculation
• Risk-reward based take profit levels (1-5 targets)
• Visual lines and labels showing entry, SL, and TPs
• Automatically adapts to market volatility
• ⚠️ VISUAL REFERENCE ONLY - Does not execute trades
✅ SUPPORT & RESISTANCE DETECTION
• Automatic pivot-based level identification
• Red dashed lines for resistance zones
• Green dashed lines for support areas
• Helps identify key price levels
✅ VWMA TREND BANDS
• Volume-weighted moving average with standard deviation
• Color-changing bands (Green = Uptrend, Red = Downtrend)
• Filled band area for easy visualization
• Volume-confirmed trend strength
✅ TREND DETECTION SYSTEM
• Counting-based trend confirmation
• Three states: Up Trend, Down Trend, Ranging
• Requires threshold of consecutive bars
• Independent trend validation
✅ PRICE RANGE VISUALIZATION
• High/Low range lines showing market structure
• Filled area highlighting price volatility
• Helps identify breakout zones
✅ COMPREHENSIVE INFO TABLE
• Real-time trend status
• Last signal type (BUY/SELL)
• Entry price display
• Stop loss level
• All active take profit levels
• Clean, professional layout
✅ OPTIONAL FEATURES
• Bar coloring by trend direction
• Customizable alert notifications
• Toggle visibility for all components
• Fully configurable parameters
📊 HOW IT WORKS
═══════════════════════════════════════════════════════════════════
SIGNAL METHODOLOGY:
BUY SIGNAL generates when ALL conditions are met:
• Smoothed price > Moving Average (upward price trend)
• PVT > PVT Average (volume supporting uptrend)
• ROC > 0 (positive momentum)
• Close > VWMA (above volume-weighted average)
SELL SIGNAL generates when ALL conditions are met:
• Smoothed price < Moving Average (downward price trend)
• PVT < PVT Average (volume supporting downtrend)
• ROC < 0 (negative momentum)
• Close < VWMA (below volume-weighted average)
This multi-factor approach filters out weak signals and waits for
strong convergence before generating alerts.
RISK CALCULATION:
Stop Loss = Entry ± (ATR × SL Multiplier)
• Uses Average True Range for volatility measurement
• Automatically adjusts to market conditions
Take Profit Levels = Entry ± (Risk Distance × TP Multiplier × Level)
• Risk Distance = |Entry - Stop Loss|
• Creates risk-reward based targets
• Example: TP Multiplier 1.0 = 1:1, 2:2, 3:3 risk-reward
⚠️ NOTE: All risk levels are VISUAL REFERENCES for educational study.
They do not execute trades automatically.
⚙️ SETTINGS GUIDE
═══════════════════════════════════════════════════════════════════
SIGNAL SETTINGS:
• Signal Length (14): Main calculation period for averages
• Smooth Length (8): Price data smoothing period
• PVT Length (14): Price Volume Trend calculation period
• ROC Length (9): Rate of Change momentum period
RISK MANAGEMENT (Visual Only):
• ATR Length (14): Volatility measurement lookback
• SL Multiplier (2.2): Stop loss distance (× ATR)
• TP Multiplier (1.0): Risk-reward ratio per TP level
• TP Levels (1-5): Number of take profit targets to display
• Show TP/SL Lines: Toggle visual reference lines
SUPPORT & RESISTANCE:
• Pivot Lookback (10): Sensitivity for S/R detection
• Show SR: Toggle support/resistance lines
VWMA BANDS:
• VWMA Length (20): Volume-weighted average period
• Show Bands: Toggle band visibility
TREND DETECTION:
• Trend Threshold (5): Consecutive bars required for trend
PRICE LINES:
• Period (20): High/low calculation lookback
• Show: Toggle price range visualization
DISPLAY OPTIONS:
• Signals: Show/hide BUY/SELL labels
• Table: Show/hide information panel
• Color Bars: Enable trend-based bar coloring
ALERTS:
• Enable: Activate alert notifications for signals
💡 USAGE INSTRUCTIONS
═══════════════════════════════════════════════════════════════════
RECOMMENDED APPROACH:
• Works on all timeframes (1m to Monthly)
• Suitable for all markets (Stocks, Forex, Crypto, etc.)
• Best used with additional analysis and confirmation
• Always practice proper risk management
ENTRY STRATEGY:
1. Wait for BUY or SELL signal to appear
2. Check trend table for trend confirmation
3. Verify VWMA band color matches signal direction
4. Look for nearby support/resistance confluence
5. Consider entering on next candle open
6. Use visual SL level for risk management
EXIT STRATEGY:
1. Use TP levels as potential exit zones
2. Consider scaling out at multiple TP levels
3. Exit on opposite signal
4. Adjust stops as trade progresses
5. Account for spread and slippage
TREND TRADING:
• "Up Trend" → Focus on BUY signals
• "Down Trend" → Focus on SELL signals
• "Ranging" → Wait for clear trend or use range strategies
🎨 VISUAL ELEMENTS
═══════════════════════════════════════════════════════════════════
• GREEN VWMA BANDS → Bullish trend indication
• RED VWMA BANDS → Bearish trend indication
• ORANGE DASHED LINE → Entry price reference
• RED SOLID LINE → Stop loss level
• GREEN DOTTED LINES → Take profit targets
• RED DASHED LINES → Resistance levels
• GREEN DASHED LINES → Support levels
• GREY FILLED AREA → Price high/low range
• GREEN BUY LABEL → Long signal
• RED SELL LABEL → Short signal
• BLUE INFO TABLE → Current trade details
• GREEN/RED BARS → Trend direction (optional)
⚠️ IMPORTANT NOTES
═══════════════════════════════════════════════════════════════════
RISK WARNING:
• Trading involves substantial risk of loss
• You can lose more than your initial investment
• Past performance does not guarantee future results
• No indicator is 100% accurate
• Always use proper position sizing
• Never risk more than you can afford to lose
EDUCATIONAL PURPOSE:
• This tool is for learning and research
• Not a complete trading system
• Should be combined with other analysis
• Requires interpretation and context
• Test thoroughly before live use
• Consider consulting a financial advisor
TECHNICAL LIMITATIONS:
• Signals lag price action (all indicators lag)
• False signals occur in choppy markets
• Works better in trending conditions
• Support/resistance levels are approximate
• TP/SL levels are suggestions, not guarantees
📚 METHODOLOGY
═══════════════════════════════════════════════════════════════════
This indicator combines established technical analysis concepts:
• Price Volume Trend (PVT): Volume-weighted price momentum
• Rate of Change (ROC): Momentum measurement
• Volume-Weighted Moving Average (VWMA): Trend identification
• Average True Range (ATR): Volatility measurement (J. Welles Wilder)
• Pivot Points: Support/resistance detection
All methods are based on publicly available technical analysis
principles. No proprietary or "secret" algorithms are used.
⚖️ FULL DISCLAIMER
═══════════════════════════════════════════════════════════════════
LIABILITY:
The creator (Zakaria Safri) assumes NO liability for:
• Trading losses or damages of any kind
• Loss of capital or profits
• Incorrect signal interpretation
• Technical issues, bugs, or errors
• Any consequences of using this tool
USER RESPONSIBILITY:
By using this indicator, you acknowledge that:
• You are solely responsible for your trading decisions
• You understand the substantial risks involved
• You will not hold the creator liable for losses
• You will conduct your own research and analysis
• You may consult a licensed financial professional
• You are using this tool entirely at your own risk
AS-IS PROVISION:
This indicator is provided "AS IS" without warranty of any kind,
express or implied, including but not limited to warranties of
merchantability, fitness for a particular purpose, or non-infringement.
The creator is not a registered investment advisor, financial planner,
or broker-dealer. This tool is not approved or endorsed by any
financial authority.
📞 ABOUT THE CREATOR
═══════════════════════════════════════════════════════════════════
Created by: Zakaria Safri
Specialization: Technical analysis indicator development
Focus: Multi-factor analysis, risk visualization, trend detection
This is an educational tool designed to demonstrate technical
analysis concepts and multi-factor signal generation methods.
📋 VERSION INFO
═══════════════════════════════════════════════════════════════════
Version: 1.0
Platform: TradingView Pine Script v5
License: Mozilla Public License 2.0
Creator: Zakaria Safri
Year: 2024
═══════════════════════════════════════════════════════════════════
Study Carefully, Trade Wisely, Manage Risk Properly
TradeVision Pro - Educational Trading Tool
Created by Zakaria Safri
═══════════════════════════════════════════════════════════════════

G_GMMA• Comprehensive GMMA Visualization: It plots six fast EMAs and six slow EMAs, clearly distinguishing short term and long term trends. The indicator fills the space between the fastest and slowest EMAs in each group, turning the moving averages into easily identifiable ribbons rather than a mass of overlapping lines.
• Customizable Appearance: Users can adjust the colors of the fast and slow EMA lines, the fill colors of each ribbon, and the overall line thickness. This makes it easy to tailor the chart to personal preferences or trading templates.
• Dynamic Background Shading: The script can shade the chart’s background depending on whether the fast ribbon is above or below the slow ribbon, giving a quick visual cue for trend direction (uptrend vs. downtrend).
• Touch Alert System: Up to three different EMA lengths can be monitored for “touch” events. When price touches a selected EMA (e.g., 20 , 50 or 200 period EMA), the indicator triggers an alert condition and plots a small circle on the chart at the contact point. This helps traders catch precise entry or exit signals without staring at the screen.
• Flexible Input: Both fast and slow EMA lengths, colors, and alert parameters are user adjustable from the indicator’s settings. This allows the same script to be used on different instruments (e.g., Gold, forex pairs) and time frames by simply changing the period values.
• Trend Sensitive Support/Resistance: By treating the slow EMA ribbon as a dynamic support/resistance zone, the indicator helps traders identify where price is likely to stall or reverse. Combining this with the touch alerts makes it well suited for scalping or intraday trades.

Swing AURORA v4.0 — Refined Trend Signals### Swing Algo v4.0 — Refined Trend Signals
#### Overview
Swing Algo v4.0 is an advanced technical indicator designed for TradingView, built to detect trend changes and provide actionable buy/sell signals in various market conditions. It combines multiple technical elements like moving averages, ADX for trend strength, Stochastic RSI for timing, and RSI divergence for confirmation, all while adapting to different timeframes through auto-tuning. This indicator overlays on your chart, highlighting trend regimes with background colors, displaying buy/sell labels (including "strong" variants), and offering early "potential" signals for proactive trading decisions. It's suitable for swing trading, trend following, or as a filter for other strategies across forex, stocks, crypto, and other assets.
#### Purpose
The primary goal of Swing Algo v4.0 is to help traders identify high-probability trend reversals and continuations early, reducing noise and false signals. It aims to provide clear, non-repainting signals that align with market structure, volatility, and momentum. By incorporating filters like higher timeframe (HTF) alignment, bias EMAs, and divergence, it refines entries for better accuracy. The indicator emphasizes balanced performance across aggressive, balanced, and conservative modes, making it versatile for both novice and experienced traders seeking to optimize their decision-making process.
#### What It Indicates
- **Trend Regimes (Background Coloring)**: The chart background changes color to reflect the current market regime:
- **Green (Intense for strong uptrends, faded when cooling)**: Indicates bullish trends where price is above the baseline and EMAs are aligned upward.
- **Red/Maroon (Intense maroon for strong downtrends, faded red when cooling)**: Signals bearish trends with price below the baseline and downward EMA alignment.
- **Faded Yellow**: Marks "no-trade" zones or potential trend changes, where conditions are choppy, weak, or neutral (e.g., low ADX, near baseline, or low volatility).
- **Buy/Sell Signals**: Labels appear on the chart for confirmed entries:
- "BUY" or "STRONG BUY" for bullish signals (strong variants require higher scores and optional divergence).
- "SELL" or "STRONG SELL" for bearish signals.
- **Potential Signals**: Early warnings like "Potential BUY" or "Potential SELL" appear before full confirmation, allowing traders to anticipate moves (confirmed after a few bars based on the trigger window).
- **Divergence Marks**: Small "DIV↑" (bullish) or "DIV↓" (bearish) labels highlight RSI divergences on pivots, adding confluence for strong signals.
- **Lines**: Optional plots for baseline (teal), EMA13/21 (lime/red based on crossover), providing visual trend context.
Signals are anchored either to the current bar or confirmed pivots, ensuring alignment with price action. The indicator avoids repainting by confirming on close if enabled.
#### Key Parameters and Customization
Swing Algo v4.0 offers minimal yet efficient parameters for fine-tuning, with defaults optimized for common use cases. Most can be auto-tuned based on timeframe for simplicity:
- **Confirm on Close (no repaint)**: Boolean (default: true) – Ensures signals don't repaint by waiting for bar confirmation.
- **Auto-tune by Timeframe**: Boolean (default: true) – Automatically adjusts lengths and sensitivity for 5-15m, 30-60m, 2-4h, or higher frames.
- **Mode**: String (options: Aggressive, Balanced , Conservative) – Controls signal thresholds; Aggressive for more signals, Conservative for fewer but higher-quality ones.
- **Signal Anchor**: String (options: Pivot (divLB) , Current bar) – Places labels on confirmed pivots or the current bar.
- **Trigger Window (bars)**: Integer (default: 3) – Window for signal timing; auto-tuned if enabled.
- **Baseline Type**: String (options: HMA , EMA, ALMA) – Core trend line; lengths auto-tune (e.g., 55 for short frames).
- **Use Bias EMA Filter**: Boolean (default: false) – Adds a long-term EMA for trend bias.
- **Use HTF Filter**: Boolean (default: false) – Aligns with higher timeframe (auto or manual like 60m, 240m, D); override for stricter scoring.
- **Sensitivity (10–90)**: Integer (default: 55) – Adjusts ADX threshold for trend detection; higher = more sensitive.
- **Use RSI-Stoch Trigger**: Boolean (default: true) – Enables Stochastic RSI for entry timing; customizable lengths, smooths, and levels.
- **Use RSI Divergence for STRONG**: Boolean (default: true) – Requires divergence for strong signals; pivot lookback (default: 5).
- **Visual Options**: Booleans for background regime, labels, divergence marks, and lines (all default: true).
These parameters are grouped for ease, with tooltips in TradingView for quick reference. Start with defaults and tweak based on backtesting.
#### How It Works
At its core, Swing Algo v4.0 calculates a baseline (e.g., HMA) to define the trend direction. It then scores potential buys/sells using factors like:
- **Trend Strength**: ADX above a dynamic threshold, combined with EMA crossovers (13/21) and slope analysis.
- **Volatility/Volume**: Bollinger/Keltner squeeze exits, volume z-score, and ATR filters to avoid choppy markets.
- **Timing**: Stochastic RSI crossovers or micro-timing via DEMA/TEMA for precise entries.
- **Filters**: Bias EMA, HTF alignment, gap from baseline, and no-trade zones (weak ADX, near baseline, low vol).
- **Divergence**: RSI pivots confirm strong signals.
- **Scoring**: Buy/sell scores (min 3-5 based on mode) trigger labels only when all gates pass, with early "potential" detection for foresight.
The algorithm processes these in real-time, auto-adapting to timeframe for efficiency. Signals flip only on direction changes to prevent over-trading. For best results, use on liquid assets and combine with risk management.
#### Disclaimer
This indicator is for educational and informational purposes only and does not constitute financial advice, investment recommendations, or trading signals. Trading involves significant risk of loss and is not suitable for all investors. Past performance is not indicative of future results. Always backtest the indicator on your preferred assets and timeframes, and consult a qualified financial advisor before making any trading decisions. The author assumes no liability for any losses incurred from using this script. Use at your own risk.

Experimental Supertrend [CHE]Experimental Supertrend — Combines EMA crossovers for trend regime detection with an adaptive ATR-based hull that selects the narrowest band to contain recent highs and lows, minimizing false breaks in varying volatility.
Summary
This indicator overlays a dynamic supertrend boundary around a midline derived from dual EMAs, using EMA crossovers to switch between bullish and bearish regimes. The hull adapts by evaluating multiple ATR periods and selecting the tightest one that fully encloses price action over a specified window, which helps in creating more stable trend lines that hug price without excessive gaps or breaches. Fills between the midline and hull provide visual cues for trend strength, darkening temporarily after regime changes to highlight transitions. Alerts trigger on crossovers, and markers label entry points, making it suitable for trend-following setups where standard supertrends might whipsaw. Overall, it offers robustness through auto-adjustment, reducing sensitivity to noise while maintaining responsiveness to genuine shifts.
Motivation: Why this design?
Standard supertrend indicators often flip prematurely in choppy markets due to fixed multipliers that do not account for localized volatility patterns, leading to frequent false signals and eroded confidence in trends. This design addresses that by incorporating an EMA-based regime filter for directional bias and an auto-adaptive hull that dynamically tunes the band width based on recent price containment needs. By prioritizing the narrowest effective enclosure, it avoids over-wide bands in calm periods that cause lag or under-wide ones in volatility spikes that invite breaks, providing a more consistent trailing reference without manual tweaking.
What’s different vs. standard approaches?
- Reference baseline: Diverges from the classic ATR-multiplier supertrend, which uses a single fixed period and constant factor applied to close or high/low deviations.
- Architecture differences:
- Auto-selection from candidate ATR lengths to find the optimal period for current conditions.
- Dynamic multiplier clamped between floor and cap values, adjusted by padding to ensure reliable containment.
- Regime-gated rendering, where hull position flips based on EMA relative positioning.
- Post-transition visual fading to emphasize change points without altering core logic.
- Practical effect: Charts show tighter, more reactive bands that rarely breach during trends, reducing visual clutter from flips; the adaptive nature means less intervention across assets, as the hull self-adjusts to volatility clusters rather than applying a one-size-fits-all scale.
How it works (technical)
The indicator first computes two EMAs from close prices using lengths derived from a preset pair or manual inputs, establishing a midline as their average. This midline serves as the central reference for the hull. True range values are then smoothed into multiple ATR candidates using exponential weighting over the specified lengths. For each candidate, deviations of recent highs and lows from the midline are ratioed against the ATR to determine a required multiplier that would enclose all extremes in the containment window—the highest ratio plus padding sets the base, clamped to user-defined bounds. Among valid candidates (those with sufficient history), the one yielding the narrowest overall band width is selected. The hull boundaries are then offset from the midline by this multiplier times the chosen ATR, and further smoothed with a fixed EMA to reduce jitter. Regime direction from EMA comparison gates which boundary acts as support or resistance, with initialization seeding arrays on the first bar to handle state persistence. No higher timeframe data is used, so all logic runs on the chart's native bars without lookahead.
Parameter Guide
EMA Pair — Selects preset lengths for fast and slow EMAs, influencing regime sensitivity and midline stability. Default: "21/55". Trade-offs/Tips: Faster pairs like "9/21" increase cross frequency for scalping but raise false signals; slower like "50/200" smooths for swings, potentially missing early turns. Use Manual for fine control.
Manual Fast — Sets fast EMA length when Manual mode is active; shorter values make regime switches quicker. Default: 21. Trade-offs/Tips: Lower than 10 risks over-reactivity; pair with slow at least double for clear separation.
Manual Slow — Sets slow EMA length when Manual mode is active; longer values anchor the midline more firmly. Default: 55. Trade-offs/Tips: Above 100 adds lag in trends; balance with fast to avoid perpetual neutrality.
ATR Lengths (comma-separated) — Defines candidate periods for ATR smoothing; more options allow finer auto-selection. Default: "7,10,14,21,28,35". Trade-offs/Tips: Fewer candidates speed computation but may miss optimal fits; keep under 10 for efficiency.
Containment Window — Number of recent bars the hull must fully enclose highs/lows of; larger windows favor stability. Default: 50. Trade-offs/Tips: Shorter (under 20) adapts faster to breaks but increases breach risk; longer smooths but delays response.
Min Multiplier Floor — Lowest allowed multiplier for hull width; prevents overly tight bands in low volatility. Default: 0.5. Trade-offs/Tips: Raise to 0.75 for conservative enclosures; too low allows pinches that flip easily.
Max Multiplier Cap — Highest allowed multiplier; caps expansion in spikes to avoid wide, lagging bands. Default: 1.0. Trade-offs/Tips: Lower to 0.75 tightens overall; higher permits more room but risks detachment from price.
Padding (+) — Adds buffer to the auto-multiplier for safer containment without exact touches. Default: 0.05. Trade-offs/Tips: Increase to 0.10 in gappy markets; minimal values hug closer but may still breach on outliers.
Fill Between (Mid ↔ Supertrend) — Toggles shaded area between midline and active hull for trend visualization. Default: true. Trade-offs/Tips: Disable for cleaner charts; pairs well with transparency tweaks.
Base Fill Transparency (0..100) — Sets default opacity of fills; higher values make them subtler. Default: 80. Trade-offs/Tips: Under 50 overwhelms price action; adjust with darken boost for emphasis.
Darken on Trend Change — Enables temporary opacity increase after regime shifts to spotlight transitions. Default: true. Trade-offs/Tips: Off for steady visuals; on aids spotting reversals in real-time.
Darken Fade Bars — Duration in bars for the darken effect to ramp back to base; longer prolongs highlight. Default: 8. Trade-offs/Tips: Shorter (4-6) for fast-paced charts; longer holds attention on changes.
Darken Boost at Change (Δ transp) — Intensity of opacity reduction at crossover; higher values make shifts more prominent. Default: 50. Trade-offs/Tips: Cap at 70 to avoid blackout; tune down if fades obscure details.
Show Supertrend Line — Displays the active hull boundary as a line. Default: true. Trade-offs/Tips: Hide for fill-only views; linewidth fixed at 3 for visibility.
Show EMA Cross Markers — Places circles and labels at crossover points for entry cues. Default: true. Trade-offs/Tips: Disable in clutter; labels show "Buy"/"Sell" at absolute positions.
Alert: EMA Cross Up (Long) — Triggers notification on bullish crossover. Default: true. Trade-offs/Tips: Pair with filters; once-per-bar frequency.
Alert: EMA Cross Down (Short) — Triggers notification on bearish crossover. Default: true. Trade-offs/Tips: Use for exits; ensure broker integration.
Show Debug — Reveals internal diagnostics like selected ATR details (if implemented). Default: false. Trade-offs/Tips: Enable for troubleshooting selections; minimal overhead.
Reading & Interpretation
Bullish regime shows a green line below price as support, with upward fill from midline; bearish uses red line above as resistance, downward fill. Crossovers flip the active boundary, marked by tiny green/red circles and "Buy"/"Sell" labels at the hull level. Fills start at base transparency but darken sharply at changes, fading over the specified bars to signal fresh momentum. If the hull rarely breaches during trends, containment is effective; frequent touches without flips indicate tight adaptation. Debug mode (when enabled) overlays text or plots for selected length and multiplier, helping verify auto-choices.
Practical Workflows & Combinations
- Trend following: Enter long on green "Buy" label above prior low structure; confirm with higher high. Trail stops along the green hull line, tightening as fills stabilize post-fade.
- Exits/Stops: Conservative exit on opposite crossover or hull breach; aggressive hold until fade completes if volume supports. Use darken boost as a volatility cue—high delta suggests waiting for confirmation.
- Multi-asset/Multi-TF: Defaults suit forex/stocks on 15m-4h; for crypto, widen containment to 75 for gaps. Layer on volume oscillator for cross filters; avoid on low-liquidity assets where ATR candidates skew.
Behavior, Constraints & Performance
Closed-bar logic ensures signals confirm at bar end, with live bars updating hull adaptively but no repaints since no future data or security calls are used. Arrays persist ATR states across bars, initialized once with candidates parsed from string. Small fixed loops (over 6 lengths max, inner up to 50) run per bar, capped by max_bars_back=500 for history needs. Resources stay low with 500 labels/lines limits, but dense charts may hit on markers. Known limits include initial lag until containment history builds (50+ bars), potential wide bands on gaps, and suboptimal selections if candidates omit ideal lengths.
Sensible Defaults & Quick Tuning
Start with "21/55" pair, 50-window, 0.5-1.0 multipliers, and 80% transparency for balanced responsiveness on daily charts. For too many flips, raise min floor to 0.75 or add lengths like "42"; for sluggishness, shorten window to 30 or pick faster pair. In high-vol environments, boost padding to 0.10; for smoother visuals, extend fade bars to 12.
What this indicator is—and isn’t
This is a visualization and signal layer for trend regime and adaptive boundaries, aiding entry/exit timing in directional markets. It is not a standalone system—pair with price structure, risk sizing, and broader context. Not predictive of turns, just reactive to containment and crosses.
Disclaimer
The content provided, including all code and materials, is strictly for educational and informational purposes only. It is not intended as, and should not be interpreted as, financial advice, a recommendation to buy or sell any financial instrument, or an offer of any financial product or service. All strategies, tools, and examples discussed are provided for illustrative purposes to demonstrate coding techniques and the functionality of Pine Script within a trading context.
Any results from strategies or tools provided are hypothetical, and past performance is not indicative of future results. Trading and investing involve high risk, including the potential loss of principal, and may not be suitable for all individuals. Before making any trading decisions, please consult with a qualified financial professional to understand the risks involved.
By using this script, you acknowledge and agree that any trading decisions are made solely at your discretion and risk.
Do not use this indicator on Heikin-Ashi, Renko, Kagi, Point-and-Figure, or Range charts, as these chart types can produce unrealistic results for signal markers and alerts.
Happy trading
Chervolino

Full Currency Strength Table Dashboard (8 Currencies)
# Full Currency Strength Table Dashboard (8 Currencies) 📊
This indicator provides a **simplified, visual representation of the current relative strengths of 8 major global currencies** (EUR, USD, GBP, JPY, AUD, NZD, CAD, CHF). It's designed as a minimalist dashboard that appears discreetly on your chart, giving traders a quick and clear picture of forex pair movements.
The indicator calculates the relative strength of each currency based on its movement against the other 7 currencies in the panel, providing insight into which currencies are currently the strongest and which are the weakest.
## Key Features 🌟
* **Simplified Visualization:** Instead of showing currency strength as a line on the chart, which can often be distracting, the indicator uses a **data table (dashboard)** positioned on the chart. This ensures **maximum chart visibility** and cleanliness.
* **8 Major Currencies:** All major currencies are included ($A$ - EUR, $B$ - USD, $C$ - GBP, $D$ - JPY, $E$ - AUD, $F$ - NZD, $G$ - CAD, $H$ - CHF), allowing strength calculation based on **28 base currency pairs**.
* **Strength Calculation:** Strength is calculated based on the average percentage change $\left(\frac{\text{Close} - \text{Open}}{\text{Open}} \times 100\right)$ of the currency relative to all 7 other currencies.
* **Timeframe Setting:** Users can select a **higher timeframe (TF)** (e.g., Daily - 'D') for the strength calculation. This allows analysis of longer-term currency strength momentum, independent of the chart's current timeframe.
* **Customizable Design:** You can adjust the table's position, text size, the colour of each currency, and the resolution (length) of the strength meter.
## How to Use the Indicator (Interpretation) 💡
1. **Select a Timeframe (TF):** It's recommended to use a higher TF (e.g., Daily - 'D' or 4h - '240') to get more stable currency strength signals.
2. **The Dashboard Table:** The table displays:
* The currency name (bottom, with its corresponding colour).
* The numerical strength value (top, expressed in points or average change).
* The **Strength Meter (bar)** visually represents the currency's relative strength compared to the other currencies on the panel (calculated based on the Min/Max values across all 8 currencies).
3. **Making Decisions:**
* **Buy:** Look for a currency pair where the **Base Currency** is significantly **strong** (high positive value, long meter) and the **Quote Currency** is significantly **weak** (high negative value, short meter).
* **Sell:** Look for a currency pair where the **Base Currency** is significantly **weak** and the **Quote Currency** is significantly **strong**.
* **Avoid Trading:** Avoid pairs where both currencies have roughly the same strength or are close to zero.
## Note on Calculation and Code 🛠️
* **Base Pairs:** The script calculates 28 base currency pairs (e.g., EURUSD, EURGBP... CADCHF) using the `request.security` function to retrieve data from the selected timeframe (`freq`).
* **Data Correction:** A correction was implemented in the code by adding ` ` after `request.security` to always use the **CLOSED bar values** from the higher TF. This **eliminates NaN (Not a Number) data** that would appear when using the current bar.
* **Accumulation:** Accumulation (`sumA, sumB...`) only occurs when the selected higher TF changes (`timeframe.change(freq)`), effectively tracking the currency's relative strength during the formation of **one closed bar** on that higher TF.
### License
This work is licensed under the **Attribution-NonCommercial-ShareAlike 4.0 International (CC BY-NC-SA 4.0)** license.
The original concept and code are based on the work of the **LuxAlgo** team and finalized to fix syntax errors and handle NaN data for stable use with 8 currencies.
---
**Questions or suggestions?** I'd love to hear your feedback in the comments! Happy trading! 📈

MTF Intraday v2.0📊 Description
MTF Intraday v2.0 is an informative indicator for analyzing trend strength across multiple timeframes simultaneously. Designed specifically for intraday (session) trading during European and US market hours.
The indicator shows the real market picture without lagging signals - you see the trend strength right now for each timeframe.
🎯 Key Features
1. Multi-Timeframe Analysis (D1, H4, H1, M30, M15)
Analyzes 4 indicators on each TF: SuperTrend, RSI, EMA crossover, EMA200
Shows strength for each timeframe: STRONG / MED / WEAK
Color indication: 🟢 green (LONG strong), 🔴 red (SHORT strong), 🟡 yellow (medium), ⚪ gray (weak)
2. Intraday Trading Hierarchy
D1 - global context (affects quality assessment)
H4 - general (sets the main trend)
H1 - reference point for intraday
M30/M15 - finding entry points during sessions
3. Market Pulse
🔥 HOT - when both H4 and H1 are STRONG (best time to enter!)
✓ GOOD - when H4 or H1 is STRONG
L:45 S:20 - balance of power between LONG and SHORT (statistics instead of "wait")
4. Volume Indicator (24 hours)
Shows volume change over the last 24 hours
SPIKE! - when volume increased by the set % (default 50%)
Considers candle color: 🟢 LONG spike (rise + green candle), 🔴 SHORT spike (rise + red candle)
Works on any timeframe (automatically recalculates)
5. Compact Mode
OFF - shows all details: every indicator for each TF
ON - only strength per timeframe (for clean chart)
⚙️ Settings
Main:
SuperTrend Period (21) / Multiplier (6.3)
RSI Length (14)
EMA Short (50) / Long (100) / 200
Compact Mode - hide detailed indicators
Volume:
Show Volume - show/hide volume indicator
Volume Alerts ON/OFF - enable/disable volume alerts
Volume Spike (%) - spike threshold (30% / 50% / 100%)
🔔 Alerts
The indicator has 5 types of alerts:
Market HOT - H4 and H1 simultaneously became STRONG
VOL LONG - volume spike on bullish candle
VOL SHORT - volume spike on bearish candle
EMA200 UP - price crossed EMA200 upward
EMA200 DN - price crossed EMA200 downward
Set up in TradingView: Create Alert → Select desired alert from the list
📈 How to Use
For finding entry points:
Check H4 - should be at least MED (better STRONG)
Verify H1 - main filter for intraday
Wait for pulse "🔥 HOT" or at least "✓ GOOD"
Look at M30/M15 - seek confirmation
Check 24h VOL - if SPIKE, momentum has started
Quality Assessment:
EXCELLENT ⭐ - all stars aligned (D1 with us, high score)
GOOD - good setup
WARNING ⚠️ - D1 against trend (counter-trend, be careful!)
Color Indication:
🟢 Green cells - bullish signal
🔴 Red cells - bearish signal
🟡 Yellow cells - neutral/waiting
🟠 Orange TF labels - for readability
⚠️ Important
This is an informative indicator, not a trading system
Does not give "entry/exit" signals - shows trend strength in the moment
Use together with Price Action and your trading strategy
RSI on M15 is displayed but not counted (too much noise)
💡 Who is it for
✅ Intraday traders (Europe/US sessions)
✅ Scalpers on crypto and forex
✅ Swing traders for trend confirmation
✅ Those who trade on multiple timeframes simultaneously

Smart Structure Pro - Market Structure & Smart Money Concepts═══════════════════════════════════════════════════════════════════════════════
SMART STRUCTURE PRO
═══════════════════════════════════════════════════════════════════════════════
A comprehensive market structure analysis tool that identifies institutional trading
patterns and smart money concepts for improved trade timing and decision-making.
═══════════════════════════════════════════════════════════════════════════════
📊 WHAT IT DOES
═══════════════════════════════════════════════════════════════════════════════
This indicator automatically detects and visualizes key market structure elements:
🔹 BOS (Break of Structure)
- Identifies trend continuation patterns
- Marks when price breaks above previous highs (bullish) or below previous lows (bearish)
- Confirms trend strength and momentum
🔹 CHoCH (Change of Character)
- Detects potential trend reversals
- Alerts when market structure shifts from bullish to bearish or vice versa
- Helps identify early reversal opportunities
🔹 Order Blocks
- Highlights institutional entry zones
- Identifies the last opposite candle before a structure break
- Shows areas where smart money likely entered positions
🔹 Fair Value Gaps (FVG)
- Detects price imbalances and inefficiencies
- Shows areas where price moved rapidly leaving gaps
- Often act as support/resistance when retested
🔹 Liquidity Zones
- Marks swing high and low levels
- Identifies areas where stop losses likely cluster
- Shows potential stop hunt and liquidity grab zones
═══════════════════════════════════════════════════════════════════════════════
🎯 HOW TO USE
═══════════════════════════════════════════════════════════════════════════════
BULLISH SETUP:
1. Wait for Bullish CHoCH (trend reversal signal) or BOS ↑ (continuation)
2. Look for price to pull back into an Order Block or Fair Value Gap
3. Enter long when price bounces from these zones
4. Place stop loss below the Order Block
5. Target the next liquidity zone or resistance level
BEARISH SETUP:
1. Wait for Bearish CHoCH (trend reversal signal) or BOS ↓ (continuation)
2. Look for price to retrace into an Order Block or Fair Value Gap
3. Enter short when price rejects from these zones
4. Place stop loss above the Order Block
5. Target the next liquidity zone or support level
DASHBOARD INTERPRETATION:
• Trend: Current market direction (Bullish/Bearish)
• Volume: Confirmation strength (High volume = stronger signals)
• Signal: Latest structure break detected
• Key High/Low: Critical levels for the current trend
• Position: Price location (Premium = expensive, Discount = cheap)
═══════════════════════════════════════════════════════════════════════════════
⚙️ SETTINGS GUIDE
═══════════════════════════════════════════════════════════════════════════════
STRUCTURE DETECTION:
• Pivot Length (Default: 10)
- Lower values = More signals but potentially weaker
- Higher values = Fewer signals but stronger/more reliable
- Recommended: 8-12 for intraday, 10-15 for higher timeframes
• Structure Line Extension
- Visual preference for how far lines extend
- Does not affect signal detection
SMART MONEY CONCEPTS:
• Order Block Extension: How long OB boxes remain visible
• FVG Extension: How long gap boxes remain visible
• Min FVG Size: Filter out small gaps (0 = show all)
- Set to 10-20% to reduce noise
- Set to 0 to see all gaps
VOLUME FILTER:
• Volume Confirmation (Recommended: ON)
- Filters weak signals without volume support
- Reduces false breakouts
• Volume Multiplier (Default: 1.5)
- Higher = Stricter filtering (fewer but stronger signals)
- Lower = More signals (but may include weak ones)
DISPLAY:
• Dashboard: Toggle information panel
• Trend Background: Subtle color tint showing current trend
• Dashboard Position: Choose corner placement
═══════════════════════════════════════════════════════════════════════════════
🔔 ALERTS
═══════════════════════════════════════════════════════════════════════════════
Available alert conditions:
✓ Bullish BOS - Uptrend continuation confirmed
✓ Bearish BOS - Downtrend continuation confirmed
✓ Bullish CHoCH - Reversal to uptrend detected
✓ Bearish CHoCH - Reversal to downtrend detected
✓ Structure Break - Any significant market structure change
To set up alerts:
1. Click the "⏰" alert icon
2. Select "Smart Structure Pro"
3. Choose your desired condition
4. Configure notification method
5. Click "Create"
═══════════════════════════════════════════════════════════════════════════════
⚠️ IMPORTANT DISCLOSURES
═══════════════════════════════════════════════════════════════════════════════
REPAINTING BEHAVIOR:
• Pivot points WILL repaint until confirmed (this is by design and unavoidable)
• Structure breaks (BOS/CHoCH) use CLOSED candles and do NOT repaint after confirmation
• Order Blocks and FVGs are drawn on confirmed signals and do NOT repaint
• All signals wait for candle close before triggering
BEST PRACTICES:
• Use on higher timeframes (15min+) for more reliable signals
• Combine with other analysis (support/resistance, volume profile, etc.)
• Wait for candle close confirmation before acting on signals
• Use proper risk management - this is not a standalone trading system
• Backtest on your preferred instrument and timeframe
PERFORMANCE:
• Limited to 100 boxes, 100 lines, 100 labels for optimal performance
• Older objects automatically removed as new ones appear
• Works on all markets (Forex, Crypto, Stocks, Indices, Commodities)
═══════════════════════════════════════════════════════════════════════════════
📚 CONCEPTS EXPLAINED
═══════════════════════════════════════════════════════════════════════════════
MARKET STRUCTURE:
Market structure refers to the pattern of price movements creating swing highs
and lows. Understanding structure helps identify trend direction and potential
reversal points.
SMART MONEY CONCEPTS:
These are trading techniques based on tracking institutional order flow and
understanding where large players (banks, funds, institutions) enter and exit
positions.
ORDER BLOCKS:
The last opposing candle before a strong directional move. Institutions often
leave unfilled orders in these zones, which can act as support/resistance when
price returns.
FAIR VALUE GAPS:
Areas where price moved so quickly that it left an imbalance. These gaps often
get "filled" as price returns to find equilibrium, creating trading opportunities.
═══════════════════════════════════════════════════════════════════════════════
🎓 EDUCATIONAL VALUE
═══════════════════════════════════════════════════════════════════════════════
This indicator helps traders:
✓ Understand market structure mechanics
✓ Identify institutional trading patterns
✓ Improve trade timing and entry precision
✓ Recognize trend continuation vs reversal
✓ Learn smart money concepts through visualization
═══════════════════════════════════════════════════════════════════════════════
📋 TECHNICAL DETAILS
═══════════════════════════════════════════════════════════════════════════════
• Version: 1.0.0
• Pine Script Version: 5
• Indicator Type: Overlay
• No Repainting: Structure breaks use confirmed candles
• Performance Optimized: Limited drawing objects
• Works On: All markets and timeframes
• Alerts: Yes, fully customizable
═══════════════════════════════════════════════════════════════════════════════
👤 AUTHOR
═══════════════════════════════════════════════════════════════════════════════
Created by: Zakaria Safri
Original Work: All code and concepts are original implementations
Based On: ICT (Inner Circle Trader) educational concepts
License: © 2024 Zakaria Safri - Personal Use Only
═══════════════════════════════════════════════════════════════════════════════
⚖️ DISCLAIMER
═══════════════════════════════════════════════════════════════════════════════
This indicator is for educational and informational purposes only. It does not
constitute financial advice. Trading involves substantial risk of loss. Past
performance does not guarantee future results. Always conduct your own research
and consult with a licensed financial advisor before making trading decisions.
The author is not responsible for any losses incurred from using this indicator.
═══════════════════════════════════════════════════════════════════════════════
If you find this indicator helpful, please:
👍 Like and favorite
⭐ Leave a review
📢 Share with other traders
💬 Comment with feedback or suggestions
Happy Trading! 📈

Smart Weekly Lines — Clean & Scroll-Proof (Pine v6)Because your chart deserves structure. Elegant weekly dividers that stay aligned, scroll smoothly, and project future weeks using your wished UTC offset.
Smart Weekly Lines draws precise, full-height vertical lines marking each new week — perfectly aligned to your local UTC offset. It stays clean, smooth, and consistent no matter how far you scroll.
Features
• Accurate weekly boundaries based on your local UTC offset (supports half-hour zones like India +5.5)
• Clean, full-height lines that never cut off with zoom or scroll
• Adjustable color, opacity, width, and style (solid, dashed, dotted)
• Future week projection for planning and alignment
• Optional visibility: show only on Daily and Intraday charts
Works with any market — stocks, crypto, forex, or futures.
Built for traders who value clarity, structure, and precision.
Developed collaboratively with the assistance of ChatGPT under my direction and testing.

Tick-Based Delta Volume BubblesTICK-BASED DELTA VOLUME BUBBLES
OVERVIEW
A real-time order flow indicator that displays volume delta at the tick level, helping traders identify buying and selling pressure as it develops during live market hours. Unlike traditional volume delta indicators that rely on bar close data, this indicator captures actual tick-by-tick volume changes and directional bias, providing granular insight into market dynamics.
HOW IT WORKS
The indicator monitors live tick data during real-time trading by tracking volume increases between consecutive price updates. Each time volume increments, the script calculates the volume delta, determines price direction, assigns directional bias to the volume, and accumulates net delta for each bar.
This methodology is identical to the tick detection mechanism used in professional cumulative volume delta tools, ensuring accuracy and reliability.
FEATURES
Real-Time Tick Detection
- Captures genuine tick-by-tick volume flow using varip persistence
- Not estimated from OHLC data
- Processes actual market ticks as they occur
Adaptive Bubble Sizing
- Bubbles scale based on delta strength relative to a customizable moving average (default 20 bars)
- Highlights significant order flow imbalances
- Five size levels from tiny to huge
Dual Display Modes
- Normal Mode: Sized bubbles with optional volume labels positioned at bar midpoint
- Minimal Mode: Clean dots above/below bars for unobtrusive delta visualization
Flow Classification
- Aggressive Buy (bright green): Strong positive delta with greater than 1.2x strength
- Aggressive Sell (bright red): Strong negative delta with greater than 1.2x strength
- Passive Buy (light green): Moderate positive delta
- Passive Sell (light red): Moderate negative delta
Intensity Mode (Optional)
- Gray: Low intensity (less than 0.5x average)
- Blue: Medium intensity (0.5-1.0x average)
- Orange: High intensity (1.0-2.0x average)
- Red: Extreme intensity (greater than 2.0x average)
Smart Filtering
- Percentile-based filters (customizable) ensure only significant delta events are displayed
- Reduces chart clutter while highlighting important order flow
- Separate thresholds for bubble display and numeric labels
Data Collection Status
- Optional progress box in top-right corner
- Shows real-time bar collection progress
- Displays percentage completion and bars remaining
- Automatically hides when sufficient data is collected
Hide Until Ready Option
- Suppresses bubble display until the averaging period is complete
- Prevents misleading signals from incomplete data
- Default requires 20 bars before displaying bubbles
SETTINGS
Delta Average Length (1-200, default 20)
- Lookback period for calculating delta strength baseline
- Higher values = longer-term delta comparison
- Lower values = more sensitive to recent changes
Hide Bubbles Until Enough Data
- Prevents display until averaging period completes
- Ensures reliable delta strength calculations
Show Data Collection Status Box
- Displays progress indicator during initialization
- Can be disabled if you understand the warmup period
Minimal Mode
- Switches to simple dot display above/below bars
- Green dots above bars = positive delta
- Red dots below bars = negative delta
- Maintains color intensity or flow type classification
Show Bubbles
- Master toggle for bubble display
Bubble Volume Percentile (0-100, default 60)
- Minimum percentile rank required to display bubble
- Higher values = fewer, more significant bubbles
- Lower values = more bubbles displayed
Show Numbers in Bubbles
- Toggle delta value labels
- Only appears in normal mode
- Disabled automatically in minimal mode
Label Volume Percentile (0-100, default 90)
- Higher threshold for displaying numeric labels
- Typically set higher than bubble percentile
- Reduces label clutter on chart
Intensity Mode
- Switch from flow-type coloring to magnitude-based coloring
- Useful for identifying volume spikes regardless of direction
IMPORTANT NOTES
Real-Time Only: This indicator processes live tick data and does not provide historical analysis. It begins collecting data when added to a live chart.
Volume Required: Symbol must have volume data available. Will not function on symbols without volume (most forex pairs from retail brokers).
Initialization Period: Requires the specified number of bars (default 20) to calculate accurate delta strength. Use the "Hide Until Ready" option to prevent premature signals.
Market Hours: Only collects data during live market hours. Does not backfill historical data.
CREDITS
Tick detection methodology inspired by the Kioseff Trading Tick CVD indicator. This implementation adapts the same core tick-level volume delta calculation for bubble-style visualization and per-bar delta analysis.

Londen & New York Sessies (UTC+2)This script highlights the London and New York trading sessions on the chart, adjusted for UTC+2 timezone. It's designed to help traders easily visualize the most active and liquid periods of the Forex and global markets directly on their TradingView charts. The London session typically provides strong volatility, while the New York session brings increased momentum and overlaps with London for powerful trading opportunities. Ideal for intraday and session-based strategies.

EMAs de JahazielThis indicator displays seven Exponential Moving Averages (EMA 5, 6, 9, 20, 50, 100, and 200) to help identify short-, medium-, and long-term market trends.
When shorter EMAs (5, 6, 9) cross above longer EMAs (50, 100, 200), it suggests increasing bullish momentum and potential uptrend continuation.
Conversely, when shorter EMAs cross below longer EMAs, it indicates potential bearish momentum and a possible downtrend.
📈 The combination of these EMAs helps traders visualize market structure, momentum shifts, and key dynamic support/resistance levels.
🧠 Suitable for scalping, intraday trading, swing trading, or confirming higher time frame trends across any market — Forex, indices, crypto, or commodities.

Cruce EMA 9 y EMA 55 v2EMA 9 and EMA 55 Crossover is a simple and effective indicator based on the crossover of exponential moving averages.
When the EMA 9 crosses above the EMA 55, a buy signal is generated, indicating a potential bullish trend.
When the EMA 9 crosses below the EMA 55, a sell signal is triggered, suggesting a possible bearish trend.
Ideal for spotting trend reversals and momentum changes in any market — Forex, indices, cryptocurrencies, or commodities.
Works perfectly for scalping, day trading, and swing trading strategies.
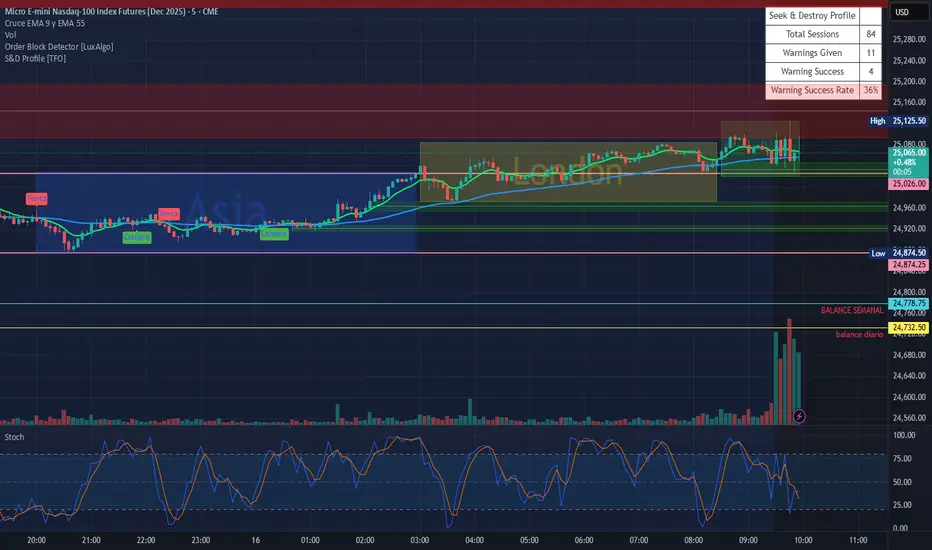
Custom Bollinger Band Squeeze Screener [Pineify]Custom Bollinger Band Squeeze Screener
Key Features
Multi-symbol scanning: Analyze up to 6 tickers simultaneously.
Multi-timeframe flexibility: Screen across four selectable timeframes for each symbol.
Bollinger Band Squeeze algorithm: Detect volatility contraction and imminent breakouts.
Advanced ATR integration: Measure expansion and squeeze states with custom multipliers.
Customizable indicator parameters: Fine-tune Bollinger and ATR settings for tailored detection.
Visual table interface: Rapidly compare squeeze and expansion signals across all instruments.
How It Works
At the core, this screener leverages a unique blend of Bollinger Bands and Average True Range (ATR) to quantify volatility states for multiple assets and timeframes at once. For each symbol and every selected timeframe, the indicator calculates Bollinger Band width and compares it against ATR levels, offering real-time squeeze (consolidation) and expansion (breakout) signals.
Bollinger Band width is computed using standard deviations around a SMA basis.
ATR is calculated to gauge market volatility independent of price direction.
Squeeze: Triggered when BB width contracts below a multiple of ATR, forecasting lower volatility and set-up for a move.
Expansion: Triggered when BB width expands above a higher ATR multiple, signaling a high-volatility breakout.
Display: Results shown in an intuitive table, marking each status per ticker and TF.
Trading Ideas and Insights
Spot assets poised for volatility-driven breakouts.
Compare squeeze presence across timeframes for optimal entry timing.
Integrate screener results with price action or volume for high-confidence setups.
Use squeeze signals to avoid choppy or non-trending conditions.
Expand and diversify watchlists with multi-symbol coverage.
How Multiple Indicators Work Together
This script seamlessly merges Bollinger Bands and ATR with customized multipliers:
Bollinger Bands identify price consolidation and volatility squeeze zones.
ATR tailors the definition of squeeze and expansion, making signals adaptive to volatility regime changes.
By layering these with multi-symbol/multi-timeframe data, traders access a high-precision view of market readiness for trend acceleration or reversal.
The real synergy is in the screener's ability to visualize volatility states for a diverse asset selection, transforming traditional single-chart analysis into a broad market view.
Unique Aspects
Original implementation: Not a simple trend or scalping indicator; utilizes advanced volatility logic.
Fully multi-symbol and multi-timeframe support uncommon in most screeners.
Custom ATR multipliers for both squeeze and expansion allow traders to match their risk profile and market dynamics.
Visual clarity: Table structure promotes actionable insights and reduces decision fatigue.
How to Use
Add the indicator to your TradingView chart (supports any asset class including crypto, forex, stocks).
Select up to six symbols (tickers) and set your preferred timeframes.
Adjust Bollinger Band Length/Deviation and ATR multipliers to refine squeeze/expansion criteria.
Review the screener table: Look for "SQZ" (squeeze) or "EXP" (expansion) cells for entry/exit ideas.
Combine screener information with other technical or fundamental signals for trade confirmation.
Customization
Symbols: Choose any tickers for scanning.
Timeframes: Select short- to long-term intervals to match your trading style.
Bollinger Band parameters: Modify length and deviation for sensitivity.
ATR multipliers: Set low or high values to adjust squeeze/expansion triggers.
Table size and layout: Adapt display for optimal workflow.
Conclusion
The Bollinger Band Squeeze Screener Pineify delivers an innovative, SEO-friendly multi-asset solution for volatility and trend detection. Harness its original algorithmic design to uncover powerful breakout opportunities and optimize your portfolio. Whether you trade crypto with dynamic volatility or scan stocks for momentum, this tool supercharges your TradingView workflow.

QUANTUM MOMENTUMOverview
Quantum Momentum is a sophisticated technical analysis tool designed to help traders identify relative strength between assets through advanced momentum comparison. This cyberpunk-themed indicator visualizes momentum dynamics between your current trading symbol and any comparison asset of your choice, making it ideal for pairs trading, crypto correlation analysis, and multi-asset portfolio management.
Key Features
📊 Multi-Asset Momentum Comparison
Dual Symbol Analysis: Compare momentum between your chart symbol and any other tradable asset
Real-Time Tracking: Monitor relative momentum strength as market conditions evolve
Difference Visualization: Clear histogram display showing which asset has stronger momentum
🎯 Multiple Momentum Calculation Methods
Choose from four different momentum calculation types:
ROC (Rate of Change): Traditional percentage-based momentum measurement
RSI (Relative Strength Index): Oscillator-based momentum from 0-100 range
Percent Change: Simple percentage change over the lookback period
Raw Change: Absolute price change in native currency units
📈 Advanced Trend Filtering System
Enable optional trend filters to align momentum signals with prevailing market direction:
SMA (Simple Moving Average): Classic trend identification
EMA (Exponential Moving Average): Responsive trend detection
Price Action: Identifies trends through higher highs/lows or lower highs/lows patterns
ADX (Average Directional Index): Measures trend strength with customizable threshold
🎨 Futuristic Cyberpunk Design
Neon Color Scheme: Eye-catching cyan, magenta, and matrix green color palette
Glowing Visual Effects: Enhanced visibility with luminescent plot lines
Dynamic Background Shading: Subtle trend state visualization
Real-Time Data Table: Sleek information panel displaying current momentum values and trend status
How It Works
The indicator calculates momentum for both your current chart symbol and a comparison symbol (default: BTC/USDT) using your selected method and lookback period. The difference between these momentum values reveals which asset is exhibiting stronger momentum at any given time.
Positive Difference (Green): Your chart symbol has stronger momentum than the comparison asset
Negative Difference (Pink/Red): The comparison asset has stronger momentum than your chart symbol
When the trend filter is enabled, the indicator will only display signals that align with the detected market trend, helping filter out counter-trend noise.
Settings Guide
Symbol Settings
Compare Symbol: Choose any tradable asset to compare against (e.g., major indices, cryptocurrencies, forex pairs)
Momentum Settings
Momentum Length: Lookback period for momentum calculations (default: 14 bars)
Momentum Type: Select your preferred momentum calculation method
Display Options
Toggle visibility of current symbol momentum line
Toggle visibility of comparison symbol momentum line
Toggle visibility of momentum difference histogram
Optional zero line reference
Trend Filter Settings
Use Trend Filter: Enable/disable trend-based signal filtering
Trend Method: Choose from SMA, EMA, Price Action, or ADX
Trend Length: Period for trend calculations (default: 50)
ADX Threshold: Minimum ADX value to confirm trend strength (default: 25)
Best Use Cases
✅ Pairs Trading: Identify divergences in momentum between correlated assets
✅ Crypto Market Analysis: Compare altcoin momentum against Bitcoin or Ethereum
✅ Stock Market Rotation: Track sector or index relative strength
✅ Forex Strength Analysis: Monitor currency pair momentum relationships
✅ Multi-Timeframe Confirmation: Use alongside other indicators for confluence
✅ Mean Reversion Strategies: Spot extreme momentum divergences for potential reversals
Visual Indicators
⚡ Cyan Line: Your chart symbol's momentum
⚡ Magenta Line: Comparison symbol's momentum
📊 Green/Pink Histogram: Momentum difference (positive = green, negative = pink)
▲ Green Triangle: Bullish trend detected (when filter enabled)
▼ Red Triangle: Bearish trend detected (when filter enabled)
◈ Yellow Diamond: Neutral/sideways trend (when filter enabled)
Pro Tips
💡 Look for crossovers between the momentum lines as potential trade signals
💡 Combine with volume analysis for stronger confirmation
💡 Use momentum divergence (price making new highs/lows while momentum doesn't) for reversal signals
💡 Enable trend filter during ranging markets to reduce false signals
💡 Experiment with different momentum types to find what works best for your trading style
Technical Requirements
TradingView Pine Script Version: v6
Chart Type: Works on all chart types
Indicator Placement: Separate pane (overlay=false)
Data Requirements: Needs access to comparison symbol data

Forecast PriceTime Oracle [CHE] Forecast PriceTime Oracle — Prioritizes quality over quantity by using Power Pivots via RSI %B metric to forecast future pivot highs/lows in price and time
Summary
This indicator identifies potential pivot highs and lows based on out-of-bounds conditions in a modified RSI %B metric, then projects future occurrences by estimating time intervals and price changes from historical medians. It provides visual forecasts via diagonal and horizontal lines, tracks achievement with color changes and symbols, and displays a dashboard for statistical overview including hit rates. Signals are robust due to median-based aggregation, which reduces outlier influence, and optional tolerance settings for near-misses, making it suitable for anticipating reversals in ranging or trending markets.
Motivation: Why this design?
Standard pivot detection often lags or generates false signals in volatile conditions, missing the timing of true extrema. This design leverages out-of-bounds excursions in RSI %B to capture "Power Pivots" early—focusing on quality over quantity by prioritizing significant extrema rather than every minor swing—then uses historical deltas in time and price to forecast the next ones, addressing the need for proactive rather than reactive analysis. It assumes that pivot spacing follows statistical patterns, allowing users to prepare entries or exits ahead of confirmation.
What’s different vs. standard approaches?
- Reference baseline: Diverges from traditional ta.pivothigh/low, which require fixed left/right lengths and confirm only after bars close, often too late for dynamic markets.
- Architecture differences:
- Detects extrema during OOB runs rather than post-bar symmetry.
- Aggregates deltas via medians (or alternatives) over a user-defined history, capping arrays to manage resources.
- Applies tolerance thresholds for hit detection, with options for percentage, absolute, or volatility-adjusted (ATR) flexibility.
- Freezes achieved forecasts with visual states to avoid clutter.
- Practical effect: Charts show proactive dashed projections instead of retrospective dots; the dashboard reveals evolving hit rates, helping users gauge reliability over time without manual calculation.
How it works (technical)
The indicator first computes a smoothed RSI over a specified length, then applies Bollinger Bands to derive %B, flagging out-of-bounds below zero or above one hundred as potential run starts. During these runs, it tracks the extreme high or low price and bar index. Upon exit from the OOB state, it confirms the Power Pivot at that extreme and records the time delta (bars since prior) and price change percentage to rolling arrays.
For forecasts, it calculates the median (or selected statistic) of recent deltas, subtracts the confirmation delay (bars from apex to exit), and projects ahead by that adjusted amount. Price targets use the median change applied to the origin pivot value. Lines are drawn from the apex to the target bar and price, with a short horizontal at the endpoint. Arrays store up to five active forecasts, pruning oldest on overflow.
Tolerance adjusts hit checks: for highs, if the high reaches or exceeds the target (adjusted by tolerance); for lows, if the low drops to or below. Once hit, the forecast freezes, changing colors and symbols, and extends the horizontal to the hit bar. Persistent variables maintain last pivot states across bars; arrays initialize empty and grow until capped at history length.
Parameter Guide
Source: Specifies the data input for the RSI computation, influencing how price action is captured. Default is close. For conservative signals in noisy environments, switch to high; using low boosts responsiveness but may increase false positives.
RSI Length: Sets the smoothing period for the RSI calculation, with longer values helping to filter out whipsaws. Default is 32. Opt for shorter lengths like 14 to 21 on faster timeframes for quicker reactions, or extend to 50 or more in strong trends to enhance stability at the cost of some lag.
BB Length: Defines the period for the Bollinger Bands applied to %B, directly affecting how often out-of-bounds conditions are triggered. Default is 20. Align it with the RSI length: shorter periods detect more potential runs but risk added noise, while longer ones provide better filtering yet might overlook emerging extrema.
BB StdDev: Controls the multiplier for the standard deviation in the bands, where wider settings reduce false out-of-bounds alerts. Default is 2.0. Narrow it to 1.5 for highly volatile assets to catch more signals, or broaden to 2.5 or higher to emphasize only major movements.
Show Price Forecast: Enables or disables the display of diagonal and target lines along with their updates. Default is true. Turn it off for simpler chart views, or keep it on to aid in trade planning.
History Length: Determines the number of recent pivot samples used for median-based statistics, where more history leads to smoother but potentially less current estimates. Default is 50. Start with a minimum of 5 to build data; limit to 100 to 200 to prevent outdated regimes from skewing results.
Max Lookahead: Limits the number of bars projected forward to avoid overly extended lines. Default is 500. Reduce to 100 to 200 for intraday focus, or increase for longer swing horizons.
Stat Method: Selects the aggregation technique for time and price deltas: Median for robustness against outliers, Trimmed Mean (20%) for a balanced trim of extremes, or 75th Percentile for a conservative upward tilt. Default is Median. Use Median for even distributions; switch to Percentile when emphasizing potential upside in trending conditions.
Tolerance Type: Chooses the approach for flexible hit detection: None for exact matches, Percentage for relative adjustments, Absolute for fixed point offsets, or ATR for scaling with volatility. Default is None. Begin with Percentage at 0.5 percent for currency pairs, or ATR for adapting to cryptocurrency swings.
Tolerance %: Provides the relative buffer when using Percentage mode, forgiving small deviations. Default is 0.5. Set between 0.2 and 1.0 percent; higher values accommodate gaps but can overstate hit counts.
Tolerance Points: Establishes a fixed offset in price units for Absolute mode. Default is 0.0010. Tailor to the asset, such as 0.0001 for forex pairs, and validate against past wick behavior.
ATR Length: Specifies the period for the Average True Range in dynamic tolerance calculations. Default is 14. This is the standard setting; shorten to 10 to reflect more recent volatility.
ATR Multiplier: Adjusts the ATR scale for tolerance width in ATR mode. Default is 0.5. Range from 0.3 for tighter precision to 0.8 for greater leniency.
Dashboard Location: Positions the summary table on the chart. Default is Bottom Right. Consider Top Left for better visibility on mobile devices.
Dashboard Size: Controls the text scaling for dashboard readability. Default is Normal. Choose Tiny for dense overlays or Large for detailed review sessions.
Text/Frame Color: Sets the color scheme for dashboard text and borders. Default is gray. Align with your chart theme, opting for lighter shades on dark backgrounds.
Reading & Interpretation
Forecast lines appear as dashed diagonals from confirmed pivots to projected targets, with solid horizontals at endpoints marking price levels. Open targets show a target symbol (🎯); achieved ones switch to a trophy symbol (🏆) in gray, with lines fading to gray. The dashboard summarizes median time/price deltas, sample counts, and hit rates—rising rates indicate improving forecast alignment. Colors differentiate highs (red) from lows (lime); frozen states signal validated projections.
Practical Workflows & Combinations
- Trend following: Enter long on low forecast hits during uptrends (higher highs/lower lows structure); filter with EMA crossovers to ignore counter-trend signals.
- Reversal setups: Short above high projections in overextended rallies; use volume spikes as confirmation to reduce false breaks.
- Exits/Stops: Trail stops to prior pivot lows; conservative on low hit rates (below 50%), aggressive above 70% with tight tolerance.
- Multi-TF: Apply on 1H for entries, 4H for time projections; combine with Ichimoku clouds for confluence on targets.
- Risk management: Position size inversely to delta uncertainty (wider history = smaller bets); avoid low-liquidity sessions.
Behavior, Constraints & Performance
Confirmation occurs on OOB exit, so live-bar pivots may adjust until close, but projections update only on events to minimize repaint. No security or HTF calls, so no external lookahead issues. Arrays cap at history length with shifts; forecasts limited to five active, pruning FIFO. Loops iterate over small fixed sizes (e.g., up to 50 for stats), efficient on most hardware. Max lines/labels at 500 prevent overflow.
Known limits: Sensitive to OOB parameter tuning—too tight misses runs; assumes stationary pivot stats, which may shift in regime changes like low vol. Gaps or holidays distort time deltas.
Sensible Defaults & Quick Tuning
Defaults suit forex/crypto on 1H–4H: RSI 32/BB 20 for balanced detection, Median stats over 50 samples, None tolerance for exactness.
- Too many false runs: Increase BB StdDev to 2.5 or RSI Length to 50 for filtering.
- Lagging forecasts: Shorten History Length to 20; switch to 75th Percentile for forward bias.
- Missed near-hits: Enable Percentage tolerance at 0.3% to capture wicks without overcounting.
- Cluttered charts: Reduce Max Lookahead to 200; disable dashboard on lower TFs.
What this indicator is—and isn’t
This is a forecasting visualization layer for pivot-based analysis, highlighting statistical projections from historical patterns. It is not a standalone system—pair with price action, volume, and risk rules. Not predictive of all turns; focuses on OOB-derived extrema, ignoring volume or news impacts.
Disclaimer
The content provided, including all code and materials, is strictly for educational and informational purposes only. It is not intended as, and should not be interpreted as, financial advice, a recommendation to buy or sell any financial instrument, or an offer of any financial product or service. All strategies, tools, and examples discussed are provided for illustrative purposes to demonstrate coding techniques and the functionality of Pine Script within a trading context.
Any results from strategies or tools provided are hypothetical, and past performance is not indicative of future results. Trading and investing involve high risk, including the potential loss of principal, and may not be suitable for all individuals. Before making any trading decisions, please consult with a qualified financial professional to understand the risks involved.
By using this script, you acknowledge and agree that any trading decisions are made solely at your discretion and risk.
Do not use this indicator on Heikin-Ashi, Renko, Kagi, Point-and-Figure, or Range charts, as these chart types can produce unrealistic results for signal markers and alerts.
Best regards and happy trading
Chervolino

Yuki Leverage RR Calculator**YUKI LEVERAGE RR CALCULATOR**
A professional-grade risk/reward calculator for leveraged crypto or forex trades.
Instantly visualizes entry, stop loss, targets, leverage, and risk-to-reward ratios — helping you plan precise positions with confidence.
──────────────────────────────
**WHAT IT DOES**
Calculates position value, quantity, stop-loss price, liquidation estimate, and per-target profit.
Displays everything in an on-chart table with optional price tags and alerts.
──────────────────────────────
**KEY FEATURES**
• Long / Short toggle (only one active at a time)
• Leverage-aware position sizing based on Position Cost ($) and Leverage
• Dynamic Stop Loss: input % → auto price + $ risk
• Up to 3 Take-Profit Targets with scaling logic
• Instant R:R ratios per target
• Liquidation estimate (approximation only)
• ENTRY / SL / T1 / T2 / T3 / LIQ visual tags
• Dark/Light mode, adjustable table and tag size
• Built-in alerts for Targets and Stop Loss
──────────────────────────────
**INPUTS**
• Long or Short selection
• Entry Price, Stop Loss %
• Target 1 / Target 2 / Target 3 + Take Profit %
• Position Cost ($), Leverage
• Visual preferences: show/hide table, table corner, font size, tag offset, text size
──────────────────────────────
**TABLE OUTPUTS**
Position Info: Type, Entry, Position Cost, Leverage, Value
Risk Section: Stop Loss %, Stop Loss Price, Total Risk ($), Liquidation % & Price
Targets 1–3: Profit ($), R:R, Take Profit ($), Runner % or PnL
──────────────────────────────
**ALERTS**
• Target 1 Hit – when price crosses T1
• Target 2 Hit – when price crosses T2
• Target 3 Hit – when price crosses T3
• Stop Loss Hit – triggers based on direction
(Use TradingView Alerts → Condition → Indicator → select desired alert)
──────────────────────────────
**HOW TO USE**
1. Choose Long or Short
2. Enter Entry Price, Stop Loss %, Position Cost, and Leverage
3. Add Targets 1–3 with optional Take Profit %
4. Adjust visuals as desired
5. Monitor table + alerts for live trade planning
──────────────────────────────
**NOTES**
• Liquidation values are estimates only
• Fees, slippage, and funding not included
• Designed for educational and planning purposes
──────────────────────────────
⚠️ **DISCLAIMER**
For educational use only — not financial advice.
Trading leveraged products involves high risk of loss.
Always confirm calculations with your exchange and trade responsibly.
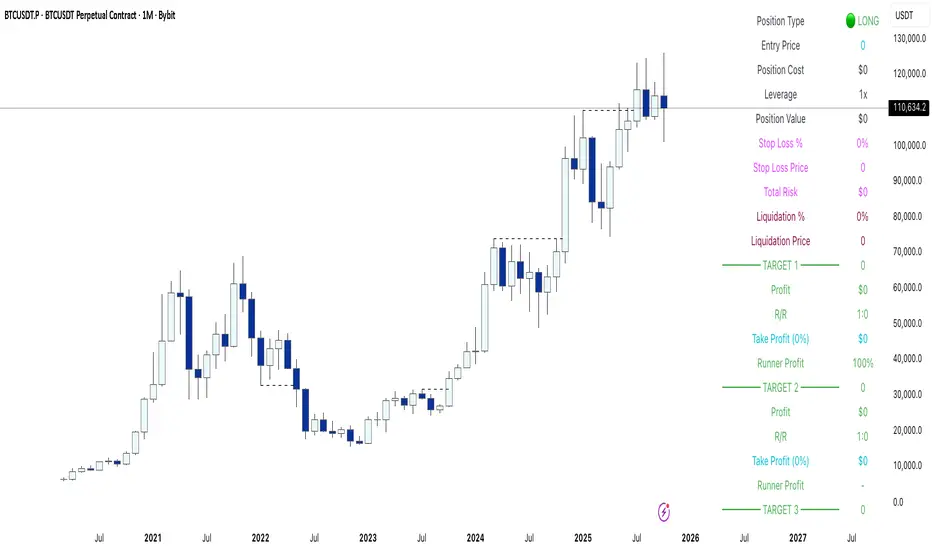
Volatilidad Multi-TF📊 Multi-Timeframe Volatility (ATR%)
Description
Indicator that displays the current asset's volatility across multiple timeframes simultaneously. It uses the ATR (Average True Range) normalized as a percentage of price, allowing for objective volatility comparison across different timeframes.
✨ Key Features
- Multi-Timeframe Analysis: Visualize volatility across 5 different timeframes (1H, 4H, D, W, M)
- Normalized Volatility: ATR expressed as a percentage of price for accurate comparison
- Compact Table: Clean and easy-to-read interface in the corner of your chart
- Auto-Update: Automatically adapts to the asset you're viewing
- No Additional Plots: Only displays essential information in table format
🎯 How to Use
1. Add the indicator to your chart
2. The table will automatically display the current asset's volatility
3. Percentage values allow you to quickly identify:
- Which timeframe has higher/lower volatility
- Divergences between timeframes
- High or low volatility zones to adjust your strategies
⚙️ Configurable Parameters
- ATR Period: Default 14, adjust according to your strategy
📈 Practical Applications
- Risk Management: Adjust position sizing based on current volatility
- Asset Selection: Identify assets with suitable volatility for your profile
- Entry Timing: Detect volatility expansions/contractions
- Timeframe Analysis: Compare volatility across different time periods
💡 Technical Notes
- Normalized ATR allows volatility comparison between assets with different prices
- Useful for both intraday trading (1H, 4H) and swing/positional trading (D, W, M)
- Compatible with any market: cryptocurrencies, forex, stocks, indices
⚠️ Disclaimer
This indicator is a technical analysis tool. It does not constitute financial advice. Conduct your own analysis and risk management before trading.
