Horizontal Lines [Yellow]The Horizontal Lines indicator is a simple yet powerful visual tool designed for traders in forex, options, and other financial markets. It allows users to mark and track key price levels directly on their chart with clear, bright yellow lines.
在脚本中搜索"forex"

Daily Midnight Lines# Daily Midnight Lines
A simple and efficient TradingView indicator that automatically draws vertical lines at the start of each new day.
* *
## Features
✅ **Precise Timing**: Draws lines at exactly 00:00 or on the first bar of the new day
✅ **Calendar Days**: Uses calendar days, not trading sessions
✅ **Customizable Design**: Green color with transparency for comfortable viewing
✅ **High Performance**: Optimized code without unnecessary calculations
✅ **Universal**: Works on all timeframes and instruments
## Settings
- **Line Color**: Green with 30% transparency (customizable)
- **Line Width**: 1 pixel (1 to 3)
- **Mode**: Exactly at 00:00 or first bar of new day
## Applications
- Separating trading days on the chart
- Analyzing price behavior at the start of the day
- Planning trading strategies
- Statistical analysis by days
## Compatibility
- Pine Script v6
- All timeframes (1m - 1M)
- All instruments (stocks, forex, crypto, futures)
- All markets (24/7, daily, night sessions)
Perfect for day traders, scalpers, and analysts who want better chart orientation and intraday pattern analysis.
---
## Ежедневные Полночные Линии
Простой и эффективный индикатор TradingView, который автоматически рисует вертикальные линии в начале каждого нового дня.
## Особенности
✅ **Точное время**: Рисует линии в 00:00 или на первом баре нового дня
✅ **Календарные дни**: Использует календарные дни, а не торговые сессии
✅ **Настраиваемый дизайн**: Зеленый цвет с прозрачностью для комфортного просмотра
✅ **Высокая производительность**: Оптимизированный код без лишних вычислений
✅ **Универсальность**: Работает на всех таймфреймах и инструментах
## Настройки
- **Цвет линий**: Зеленый с прозрачностью 30% (настраивается)
- **Толщина линий**: 1 пиксель (от 1 до 3)
- **Режим**: Точно в 00:00 или первый бар нового дня
## Применение
- Разделение торговых дней на графике
- Анализ поведения цены в начале дня
- Планирование торговых стратегий
- Статистический анализ по дням
## Совместимость
- Pine Script v6
- Все таймфреймы (1м - 1М)
- Все инструменты (акции, форекс, крипто, фьючерсы)
- Все рынки (24/7, дневные, ночные сессии)
Идеально подходит для дневных трейдеров, скальперов и аналитиков, которые хотят лучше ориентироваться на графике и анализировать внутридневные паттерны.
**Pine Script v6** | **Updated: October 2024** | **Обновлено: Октябрь 2024**

Candle Opens by HAZED🎯 Candle Opens by HAZED - Multi-Timeframe Open Levels Indicator
📊 Overview
This powerful indicator displays multiple timeframe opening prices on your chart, providing crucial reference levels that institutional traders and algorithms frequently monitor. Track up to 7 different timeframe opens simultaneously, from 1-hour to yearly, with advanced visualization features including dynamic coloring, heatmap analysis, and real-time status tracking.
✨ Key Features
📈 Multi-Timeframe Support:
- 1H, 4H, Daily, Weekly, Monthly, Quarterly, and Yearly opens
- Each timeframe can be individually enabled/disabled
- Automatic visibility adjustment based on chart timeframe
🎨 Dynamic Visual System:
- Smart Color Coding: Lines automatically change color based on price position (green above, red below)
- Customizable Styling: Adjust line thickness, transparency, and colors
- Intelligent Line Positioning: Choose between equal-length or staggered lines for better visibility
- Enhanced Labels: Display timeframe only or include price with colored background
🌈 Advanced Heatmap:
- Background coloring shows overall market sentiment across all timeframes
- Gradient or solid color modes
- Instantly see when multiple timeframes align bullish or bearish
📊 Status Table Dashboard:
- Real-time overview of all active opens
- Shows current price position relative to each open
- Simplified view when all timeframes align
- Customizable position and font style
⚙️ Professional Tools:
- Alert system for new open levels
- Extended hours session support
- Price discovery mode for EOD/intraday discrepancies
- Left/right line extensions for enhanced visibility
💡 Trading Applications
Support & Resistance:
Opening prices act as natural support/resistance levels. Price often reacts at these levels, providing entry/exit opportunities.
Trend Confirmation:
When price is above multiple opens (especially higher timeframes), it confirms bullish momentum. The opposite indicates bearish pressure.
Mean Reversion:
Price tends to revert to significant opens, particularly daily and weekly levels. Use these as targets for counter-trend trades.
Breakout Trading:
Monitor when price breaks above/below clustered opens for potential continuation moves.
Risk Management:
Use opens as logical stop-loss levels or position sizing references based on distance from key opens.
🔧 Indicator Settings
Timeframes Section:
- Toggle each timeframe on/off
- Customize individual colors
Visual Style Section:
- Dynamic Colors: Auto-color based on price position
- Line Thickness: 1-4 pixels
- Transparency: 0-80%
- Extension Length: How far lines extend right
- Label Style: Plain or enhanced with price
Heatmap Section:
- Enable/disable background coloring
- Adjust transparency
- Choose gradient or solid zones
Status Table Section:
- Position on chart
- Font selection
Advanced Section:
- Enable alerts for new opens
- Price discovery mode
- Extended hours inclusion
]📈 Best Practices
1. Timeframe Selection:
- For intraday: Focus on 1H, 4H, and Daily
- For swing trading: Daily, Weekly, Monthly
- For position trading: Monthly, Quarterly, Yearly
2. Color Coding:
- Enable dynamic colors for instant sentiment reading
- Use heatmap for overall market bias
3. Confluence Zones:
- Pay special attention when multiple opens cluster
- These zones often produce stronger reactions
4. Alignment Signals:
- When all timeframes show same color = strong trend
- Mixed colors = potential consolidation or reversal zone
🎯 Pro Tips
- Volume Confirmation: Combine with volume indicators to confirm reactions at open levels
- Multiple Instruments: Compare opens across correlated assets for divergences
- News Events: Opens often act as magnets after major news releases
- Options Trading: Weekly and monthly opens align with options expiry levels
- Algorithmic Levels: Many algorithms use these opens for entries/exits
🔄 Updates in Version 8.3
- Added 1H and 4H timeframe support
- Enhanced dynamic color system
- Implemented heatmap visualization
- Added real-time status table
- Optimized performance for smoother operation
- Improved label styling options
- Better yearly timeframe detection
⚡ Performance Optimizations
This indicator uses advanced Pine Script v6 features for optimal performance:
- Efficient object reuse instead of recreation
- Smart calculation loops
- Minimal repainting
- Optimized for real-time updates
📝 Notes
- Works on all markets (stocks, forex, crypto, futures)
- Best on timeframes lower than the opens you're tracking
- Lines automatically hide when their timeframe is lower than chart timeframe
- Past opens are not displayed (indicator shows current opens only)
🙏 Credits & Support
Created by HAZED | Version 8.3
Optimized for TradingView Pine Script v6
For questions, suggestions, or bug reports, please comment below.
If you find this indicator useful, please consider leaving a like and a follow!
Remember: No indicator is perfect. Always use proper risk management and combine multiple confirmation signals in your trading decisions.

Universal Breakout Strategy [KedArc Quant]Description:
A flexible breakout framework where you can test different logics (Prev Day, Bollinger, Volume, ATR, EMA Trend, RSI Confirm, Candle Confirm, Time Filter) under one system.
Choose your breakout mode, and the strategy will handle entries, exits, and optional risk management (ATR stops, take-profits, daily loss guard, cooldowns).
An on-chart info table shows live mode values (like Prev High/Low, Bollinger levels, RSI, etc.) plus P&L stats for quick analysis.
Use it to compare which breakout style works best on your instrument and timeframe, whether intraday, swing, or positional trading
🔑 Why it’s useful
* Flexibility: Switch between breakout strategies without loading different indicators.
* Clarity: On-chart info table displays current mode, relevant indicator levels, and live strategy P&L stats.
* Testing efficiency: Quickly A/B test different breakout styles under the same backtest environment.
* Transparency: Every trade is rule-based and displayed with entry/exit markers.
🚀 How it helps traders
* Lets you experiment with breakout strategies quickly without loading multiple scripts.
* Helps identify which breakout method fits your instrument & timeframe.
* Gives clear on-chart visual + statistical feedback for confident decision-making.
⚙️ Input Configuration
* Breakout Mode → choose which strategy to test:
* *Prev Day* → breakouts of yesterday’s High/Low.
* *Bollinger* → Upper/Lower BB pierce.
* *Volume* → Breakout confirmed with volume above average.
* *ATR Stop* → Wide range breakout using ATR filter.
* *Time Filter* → Breakouts inside defined session hours.
* *EMA Trend* → Breakouts only in EMA fast > slow alignment.
* *RSI Confirm* → Breakouts with RSI confirmation (e.g. >55 for longs).
* *Candle Confirm* → Breakouts validated by bullish/bearish candle.
* Lookback / ATR / Bollinger inputs → adjust sensitivity.
* Intrabar mode → option to evaluate breakouts using bar highs/lows instead of closes.
* Table options → show/hide info table, show/hide P&L stats, choose corner placement.
📈 Entry & Exit Logic
* Entry → occurs when breakout condition of chosen mode is met.
* Exit → default exits via opposite signals or optional stop/target if enabled.
* Session filter → optional auto-flat at session end.
* P&L management → optional daily loss guard, cooldown between trades, and ATR-based stop/take profit.
❓ FAQ — Choosing the best setup
Q: Which strategy should I use for which chart?
* *Prev Day Breakouts*: Best on indices, FX, and liquid futures with strong daily levels.
* *Bollinger*: Works well in range-bound environments, or crypto pairs with volatility compression.
* *Volume*: Good on equities where breakout strength is tied to volume spikes.
* *ATR Stop*: Suits volatile instruments (commodities, crypto).
* *EMA Trend*: Useful in trending markets (stocks, indices).
* *RSI Confirm*: Adds momentum filter, better for swing trades.
* *Candle Confirm*: Ideal for scalpers needing visual confirmation.
* *Time Filter*: For intraday traders who want signals only in high-liquidity sessions.
Q: What timeframe should I use?
* Intraday traders → 5m to 15m (Time Filter, Candle Confirm).
* Swing traders → 1H to 4H (EMA Trend, RSI Confirm, ATR Stop).
* Position traders → Daily (Prev Day, Bollinger).
* Breakout
A trade entry condition triggered when price crosses above a resistance level (for longs) or below a support level (for shorts).
* Prev Day High/Low
Formula:
Prev High = High of (Day )
Prev Low = Low of (Day )
* Bollinger Bands
Formula:
Basis = SMA(Close, Length)
Upper Band = Basis + (Multiplier × StdDev(Close, Length))
Lower Band = Basis – (Multiplier × StdDev(Close, Length))
* Volume Confirmation
A breakout is only valid if:
Volume > SMA(Volume, Length)
* ATR (Average True Range)
Measures volatility.
Formula:
ATR = SMA(True Range, Length)
where True Range = max(High–Low, |High–Close |, |Low–Close |)
* EMA (Exponential Moving Average)
Weighted moving average giving more weight to recent prices.
Formula:
EMA = (Price × α) + (EMA × (1–α))
with α = 2 / (Length + 1)
* RSI (Relative Strength Index)
Momentum oscillator scaled 0–100.
Formula:
RSI = 100 – (100 / (1 + RS))
where RS = Avg(Gain, Length) ÷ Avg(Loss, Length)
* Candle Confirmation
Bullish candle: Close > Open AND Close > Close
Bearish candle: Close < Open AND Close < Close
Win Rate (%)
Formula:
Win Rate = (Winning Trades ÷ Total Trades) × 100
* Average Trade P&L
Formula:
Avg Trade = Net Profit ÷ Total Trades
📊 Performance Notes
The Universal Breakout Strategy is designed as a framework rather than a single-asset optimized system. Results will vary depending on the chart, timeframe, and asset chosen.
On the current defaults (15-minute, INR-denominated example), the backtest produced 132 trades over the selected period. This provides a statistically sufficient sample size.
Win rate (~35%) is relatively low, but this is balanced by a positive reward-to-risk ratio (~1.8). In practice, a lower win rate with larger wins versus smaller losses is sustainable.
The average P&L per trade is close to breakeven under default settings. This is expected, as the strategy is not tuned for a single symbol but offered as a universal breakout framework.
Commissions (0.1%) and slippage (1 tick) are included in the simulation, ensuring realistic conditions.
Risk management is conservative, with order sizing set at 1 unit per trade. This avoids over-leveraging and keeps exposure well under the 5-10% equity risk guideline.
👉 Traders are encouraged to:
Experiment with inputs such as ATR period, breakout length, or Bollinger parameters.
Test across different timeframes and instruments (equities, futures, forex, crypto) to find optimal setups.
Combine with filters (trend direction, volatility regimes, or volume conditions) for further refinement.
⚠️ Disclaimer This script is provided for educational purposes only.
Past performance does not guarantee future results.
Trading involves risk, and users should exercise caution and use proper risk management when applying this strategy.

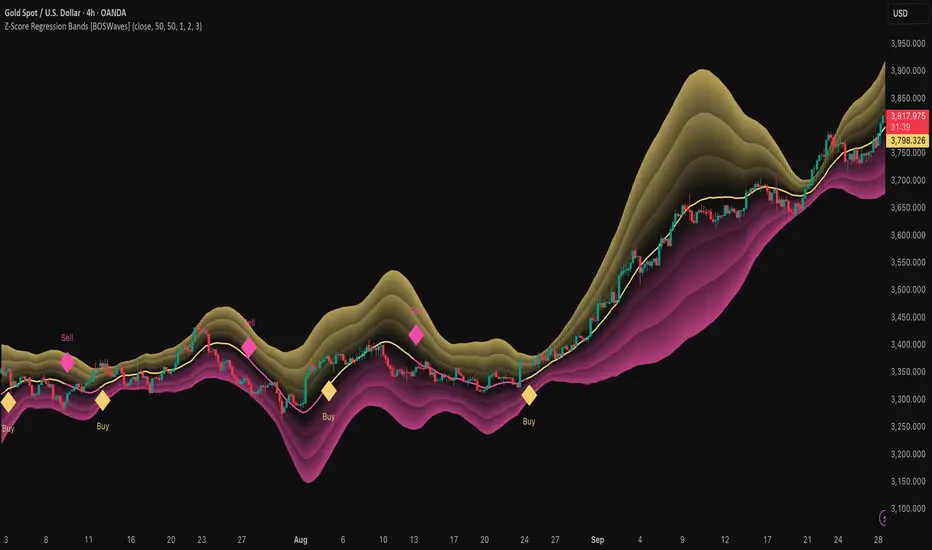
Z-Score Regression Bands [BOSWaves]Z-Score Regression Bands – Adaptive Trend and Volatility Insight
Overview
The Z-Score Regression Bands is a trend and volatility analysis framework designed to give traders a clear, structured view of price behavior. It combines Least Squares Moving Average (LSMA) regression, a statistical method to detect underlying trends, with Z-Score standardization, which measures how far price deviates from its recent average.
Traditional moving average bands, like Bollinger Bands, often lag behind trends or generate false signals in noisy markets. Z-Score Regression Bands addresses these limitations by:
Tracking trends accurately using LSMA regression
Normalizing deviations with Z-Scores to identify statistically significant price extremes
Visualizing multiple bands for normal, strong, and extreme moves
Highlighting trend shifts using diamond markers based on Z-Score crossings
This multi-layered approach allows traders to understand trend strength, detect overextensions, and identify periods of low or high volatility — all from a single, clear chart overlay. It is designed for traders of all levels and can be applied across scalping, day trading, swing trading, and longer-term strategies.
Theoretical Foundation
The Z-Score Regression Bands are grounded in statistical and trend analysis principles. Here’s the idea in plain terms:
Least Squares Moving Average (LSMA) – Unlike standard moving averages, LSMA fits a straight line to recent price data using regression. This “best-fit” line shows the underlying trend more precisely and reduces lag, helping traders see trend changes earlier.
Z-Score Standardization – A Z-Score expresses how far the LSMA is from its recent mean in standard deviation units. This shows whether price is unusually high or low, which can indicate potential reversals, pullbacks, or acceleration of a trend.
Multi-Band Structure – The three bands represent: Band #1: Normal range of price fluctuations; Band #2: Significant deviation from the trend; Band #3: Extreme price levels that are statistically rare. The distance between bands dynamically adapts to market volatility, allowing traders to visualize expansions (higher volatility) and contractions (lower volatility).
Trend Signals – When Z-Score crosses zero, diamonds appear on the chart. These markers signal potential trend initiation, continuation, or reversal, offering a simple alert for shifts in market momentum.
How It Works
The indicator calculates and plots several layers of information:
LSMA Regression (Trend Detection)
Computes a line that best fits recent price points.
The LSMA line smooths out minor fluctuations while reflecting the general direction of the market.
Z-Score Calculation (Deviation Measurement)
Standardizes the LSMA relative to its recent average.
Positive Z-Score → LSMA above average, negative → LSMA below average.
Helps identify overbought or oversold conditions relative to the trend.
Multi-Band Construction (Volatility Envelope)
Upper and lower bands are placed at configurable multiples of standard deviation.
Band #1 captures typical price movement, Band #2 signals stronger deviation, Band #3 highlights extreme moves.
Bands expand and contract with volatility, giving an intuitive visual guide to market conditions.
Trend Signals (Diamonds)
Appear when Z-Score crosses zero.
Indicates moments when momentum may shift, helping traders time entries or exits.
Visual Interpretation
Band width = volatility: wide bands indicate strong movement; narrow bands indicate calm periods.
LSMA shows underlying trend direction, while bands show how far price has strayed from that trend.
Interpretation
The Z-Score Regression Bands provide a multi-dimensional view of market behavior:
Trend Analysis – LSMA line slope shows general market direction.
Momentum & Volatility – Z-Score indicates whether the trend is accelerating or losing strength; band width indicates volatility levels.
Price Extremes – Price touching Band #2 or #3 may suggest overextension and potential reversals.
Trend Shifts – Diamonds signal statistically significant changes in momentum.
Cycle Awareness – Standard deviation bands help distinguish normal market fluctuations from extreme events.
By combining these insights, traders can avoid false signals and react to meaningful structural shifts in the market.
Strategy Integration
Trend Following
Enter trades when diamonds indicate momentum aligns with LSMA direction.
Use Band #1 and #2 for stop placement and partial exits.
Breakout Trading
Watch for narrow bands (low volatility) followed by price pushing outside Band #1 or #2.
Confirm with Z-Score movement in the breakout direction.
Mean Reversion/Pullback
If price reaches Band #2 or #3 without continuation, expect a pullback toward LSMA.
Exhaustion & Reversals
Flattening Z-Score near zero while price remains at extreme bands signals trend weakening.
Tighten stops or scale out before a potential reversal.
Multi-Timeframe Confirmation
High timeframe LSMA confirms the main trend.
Lower timeframe bands provide refined entry and exit points.
Technical Implementation
LSMA Regression : Best-fit line minimizes lag and captures trend slope.
Z-Score Standardization : Normalizes deviation to allow consistent interpretation across markets.
Multi-Band Envelope : Three layers for normal, strong, and extreme deviations.
Trend Signals : Automatic diamonds for Z-Score zero-crossings.
Band Fill Options : Optional shading to visualize volatility expansions and contractions.
Optimal Application
Asset Classes:
Forex : Capture breakouts, overextensions, and trend shifts.
Crypto : High-volatility adaptation with adjustable band multipliers.
Stocks/ETFs : Identify trending sectors, reversals, and pullbacks.
Indices/Futures : Track cycles and structural trends.
Timeframes:
Scalping (1–5 min) : Focus on Band #1 and trend signals for fast entries.
Intraday (15m–1h) : Use Bands #1–2 for continuation and breakout trades.
Swing (4h–Daily) : Bands #2–3 capture trend momentum and exhaustion.
Position (Daily–Weekly) : LSMA trend dominates; Bands #3 highlight regime extremes.
Performance Characteristics
Strong Performance:
Trending markets with moderate-to-high volatility
Assets with steady liquidity and identifiable cycles
Weak Performance:
Flat or highly choppy markets
Very short timeframes (<1 min) dominated by noise
Integration Tips
Combine with support/resistance, volume, or order flow analysis for confirmation.
Use bands for stops, targets, or scaling positions.
Apply multi-timeframe analysis: higher timeframe LSMA confirms main trend, lower timeframe bands refine entries.
Disclaimer
The Z-Score Regression Bands is a trading analysis tool, not a guaranteed profit system. Its effectiveness depends on market conditions, parameter selection, and disciplined risk management. Use it as part of a broader trading strategy, not in isolation.
RXTrend█ OVERVIEW
The "RXTrend" indicator is a technical analysis tool based on a unique approach to trend identification using RSI values from overbought and oversold zones. Designed for traders seeking a precise tool to identify key market levels and trend direction, the indicator offers flexible settings, dynamic trend lines, candlestick coloring, and buy/sell signals, supported by alerts for key events.
█ CONCEPTS
"RXTrend" leverages the Relative Strength Index (RSI) to identify overbought and oversold zones, which are often significant areas on the chart due to potentially higher volume, increased volatility, or acting as pivot points. To address this, I created an indicator that uses RSI values from these zones, mapping them to price levels to determine the trend. Additionally, for a clearer market picture, boxes are added to highlight overbought and oversold zones on the chart, and candlestick coloring is based on the direction of the RSI moving average. This provides further confirmation of the trend direction and identifies potential correction or reversal points. The indicator is universal and works across all markets (stocks, forex, cryptocurrencies) and timeframes.
█ FEATURES
- RSI Calculation: Calculates RSI based on the closing price over a specified period, with a default length of 14.
- Trend Line: A smoothed trend line based on mapping RSI values from overbought (for downtrends) or oversold (for uptrends) zones to price levels. RSI values are transformed into prices using the price range from a selected period (default: 50 bars) and then smoothed to form the trend line. The line changes color based on the trend direction (blue for uptrend, orange for downtrend).
- Candlestick Coloring: Option to color candles based on the direction of the RSI moving average (RSI MA). Candle colors align with the trend and box colors (blue for uptrend, orange for downtrend, gray for neutral).
- Overbought and Oversold Zones: Identifies overbought (RSI > OB) and oversold (RSI < OS) levels, drawing dynamic boxes on the price chart to reflect these zones. Boxes update in real-time, adjusting to new highs and lows.
- Buy and Sell Signals: Generates buy signals (blue "Buy" labels) when the price crosses above the smoothed oversold line and sell signals (orange "Sell" labels) when the price crosses below the smoothed overbought line.
- Shadow Fill: Option to fill the space between the trend line and price (HL2) with adjustable transparency, aiding visual trend assessment.
Alerts: Built-in alerts for:
- Buy and sell signals.
- Appearance of new overbought/oversold boxes.
- RSI MA direction change (candle color change to uptrend or downtrend).
Customization: Allows adjustment of RSI length, overbought/oversold levels, smoothing period, colors, box and label transparency, and the option to keep boxes after RSI returns to normal.
█ HOW TO USE
Add to Chart: Apply the indicator to your TradingView chart via the Pine Editor or Indicators menu.
Configure Settings:
RSI Settings:
- RSI Length: Sets the RSI calculation period (default: 14).
- Overbought Level (OB): Sets the overbought threshold (default: 70).
- Oversold Level (OS): Sets the oversold threshold (default: 30).
Price Settings:
- Price Range Lookback: Defines the period for calculating the price range (default: 50).
Candle Coloring:
- Color Candles: Enables/disables candle coloring based on RSI MA direction.
- RSI MA Length: Sets the RSI moving average period (default: 21).
Smoothing Settings:
- Smoothing Length: Degree of trend line smoothing (default: 5).
Colors:
- Trend Colors: Customize colors for uptrend (default: blue), downtrend (default: orange), and shadow fill.
Box Settings:
- Box Transparency: Adjusts box transparency (0-100).
- Box Colors: Sets colors for overbought (orange) and oversold (blue) zones.
- Keep Boxes: Determines if boxes remain after RSI returns to normal.
Signals:
- Show Buy/Sell Signals: Enables/disables signal label display.
- Label Transparency: Adjusts signal label transparency.
Interpreting Signals:
- Trend Line: Shows market direction (blue for uptrend, orange for downtrend).
- Buy Signals: Blue "Buy" label appears when the price crosses above the smoothed oversold line, signaling a potential uptrend.
- Sell Signals: Orange "Sell" label appears when the price crosses below the smoothed overbought line, signaling a potential downtrend.
- Overbought/Oversold Boxes: Orange boxes indicate overbought zones (RSI > OB), blue boxes indicate oversold zones (RSI < OS). Boxes expand dynamically in real-time.
- Candlestick Coloring: Candle colors align with the trend and box colors, reflecting RSI MA direction.
- Alerts: Set up alerts in TradingView for buy/sell signals, new overbought/oversold boxes, or RSI MA direction changes.
- Combining with Other Tools: Use the indicator alongside support/resistance levels, Fair Value Gaps (FVG), or other indicators to confirm signals.
█ APPLICATIONS
The "RXTrend" indicator is designed to identify key market zones and trend direction, making it useful for trend-following and reversal strategies. It enables:
- Trend Confirmation: Candlestick coloring and the trend line help assess the dominant market direction, supporting entry or exit decisions. The trend line can act as a significant support/resistance level, and a price bounce from it may provide a good entry point, especially when confirmed by Fibonacci levels. Additionally, the appearance of overbought/oversold boxes combined with a change in candle color (RSI MA direction) may indicate an impending correction. This allows analysis of potential market overextension and correction endings, enabling multiple entries within a trend.
- Overbought and Oversold Zone Identification: Boxes highlight potential reversal or correction points, especially when combined with support/resistance levels or FVG.
- Signal-Based Strategies: Buy and sell signals can be used as entry points in a trend or as warnings of potential reversals.
█ NOTES
- The indicator is universal and works across all markets and timeframes due to its RSI-based and price-mapping logic.
- Adjust settings (e.g., RSI length, OB/OS levels, smoothing) to suit your trading style and timeframe.
- Use in conjunction with other technical analysis tools to enhance signal accuracy.

LA - Opening Price based Previous day Range PivotThis "LA - Opening Price based Previous day Range Pivot" indicator is a custom technical analysis tool designed for Trading View charts. It plots support and resistance levels (often referred to as pivots or ranges) based on the current opening price combined with the previous period's trading range. The "previous period" can be daily, weekly, or monthly, making it a multi-timeframe tool. These levels are projected using Fibonacci-inspired multipliers to create potential breakout or reversal zones.
The core idea is inspired by concepts like the Opening Range Breakout (ORB) strategy or Fibonacci pivots, but it's customized here to use a dynamic range calculation (the maximum of several absolute price differences) rather than a simple high-low range. This makes it more robust for volatile markets. Levels are symmetric above (resistance) and below (support) the opening price, helping traders identify potential entry/exit points, stop-losses, or targets. This will be useful when there is a gap-up/down as in Nifty/Sensex .
Purpose of the Indicator:
To visualize potential support/resistance zones for the current trading session based on the opening price and historical range data. This helps traders anticipate price movements, such as breakouts above resistance or bounces off support
Use Cases:
Intraday Trading: On lower timeframes (e.g., 5-min or 15-min charts), it shows daily levels for short-term trades.
Swing Trading: On higher timeframes (e.g., hourly or daily), it displays weekly/monthly levels for longer holds.
Range Identification: The filled bands highlight "zones" where price might consolidate or reverse.
Conditional Display: Levels only appear on appropriate timeframes (e.g., daily levels on intraday charts <60min), preventing clutter.
Theoretical Basis: It builds on pivot point theory, where the opening price acts as a central pivot. Multipliers (e.g., 0.618 for Fibonacci golden ratio) project levels, assuming price often respects these ratios due to market psychology.
How Calculations Work
Let's dive into the math with examples. Assume a stock with:
Current daily open (cdo) = $100
Previous daily high (pdh) = $105, low (pdl) = $95, close (pdc) = $102, close 2 days ago (pdc2) = $98
Step 1: Dynamic Range Calculation (var_d2):
This is the max of:
|pdh - pdc2| = |105 - 98| = 7
|pdl - pdc2| = |95 - 98| = 3
|pdh - pdl| = |105 - 95| = 10 (previous day range)
|pdh - cdo| = |105 - 100| = 5
|pdl - cdo| = |95 - 100| = 5
|pdc - cdo| = |102 - 100| = 2
|pdc2 - cdo| = |98 - 100| = 2
Max = 10 (so range = 10). This ensures the range accounts for gaps and extended moves, not just high-low.
Step 2: Level Projections:
Resistance (above open): Open + (Range * Multiplier)
dre6 = 100 + (10 * 1.5) = 115
dre5 = 100 + (10 * 1.27) ≈ 112.7
... down to dre0 = 100 + (10 * 0.1) = 101
dre50 = 100 + (10 * 0.5) = 105 (midpoint)
Support (below open): Open - (Range * Multiplier)
dsu0 = 100 - (10 * 0.1) = 99
... up to dsu6 = 100 - (10 * 1.5) = 85
Without Indicator
With Indicator
Pros and Cons
Pros:
Multi-Timeframe Flexibility: Seamlessly integrates daily, weekly, and monthly levels, useful for aligning short-term trades with longer trends (e.g., intraday breakout confirmed by weekly support).
Dynamic Range Calculation: Unlike standard pivots (just (H+L+C)/3), it uses max of multiple diffs, capturing gaps/volatility better—great for stocks with overnight moves.
Customizable via Inputs: Users can toggle levels, adjust multipliers, or change timeframes without editing code. Inline inputs keep the UI clean.
Visual Aids: Filled bands make zones obvious; conditional colors highlight "tight" vs. "wide" ranges (e.g., for volatility assessment).
Fibonacci Integration: Levels based on proven ratios, appealing to technical traders. Symmetric supports/resistances simplify strategy building (e.g., buy at support, sell at resistance).
No Repainting: Uses historical data with lookahead, so levels are fixed once calculated—reliable for back-testing.
Cons:
Chart Clutter: With all toggles on, 50+ plots/fills can overwhelm the chart, especially on mobile or small screens. Requires manual disabling.
Complexity for Beginners: Many inputs and calculations; without understanding fib ratios or range logic, it might confuse new users.
Performance Overhead: On low timeframes (e.g., 1-min), fetching higher TF data multiple times could lag, especially with many symbols or back-tests.
Assumes Volatility Persistence: Relies on previous range projecting future moves; in low-vol markets (e.g., sideways trends), levels may be irrelevant or too wide/narrow.
No Alerts or Signals: Purely visual; no built-in buy/sell alerts or crossover conditions—users must add separately.
Hardcoded Styles/Colors: Limited customization without code edits (e.g., can't change line styles via inputs).
Also, not optimized for non-stock assets (e.g., forex with 24/7 trading).
In summary, this is a versatile pivot tool for range-based trading based on Opening price, excelling in volatile markets but requiring some setup. If you're using it, start with defaults on a daily chart and toggle off unnecessary levels.

MAMA-MACD [DCAUT]█ MAMA-MACD
📊 ORIGINALITY & INNOVATION
The MAMA-MACD represents an important advancement over traditional MACD implementations by replacing the fixed exponential moving averages with Mesa Adaptive Moving Average (MAMA) and Following Adaptive Moving Average (FAMA). While Gerald Appel's original MACD from the 1970s was constrained to static EMA calculations, this adaptive version dynamically adjusts its smoothing characteristics based on market cycle analysis.
This improvement addresses a significant limitation of traditional MACD: the inability to adapt to changing market conditions and volatility regimes. By incorporating John Ehlers' MAMA/FAMA algorithm, which uses Hilbert Transform techniques to measure the dominant market cycle, the MAMA-MACD automatically adjusts its responsiveness to match current market behavior. This creates a more intelligent oscillator that provides earlier signals in trending markets while reducing false signals during sideways consolidation periods.
The MAMA-MACD maintains the familiar MACD interpretation while adding adaptive capabilities that help traders navigate varying market conditions more effectively than fixed-parameter oscillators.
📐 MATHEMATICAL FOUNDATION
The MAMA-MACD calculation employs advanced digital signal processing techniques:
Core Algorithm:
• MAMA Line: Adaptively smoothed fast moving average using Mesa algorithm
• FAMA Line: Following adaptive moving average that tracks MAMA with additional smoothing
• MAMA-MACD Line: MAMA - FAMA (replaces traditional fast EMA - slow EMA)
• Signal Line: Configurable moving average of MAMA-MACD line (default: 9-period EMA)
• Histogram: MAMA-MACD Line - Signal Line (momentum visualization)
Mesa Adaptive Algorithm:
The MAMA/FAMA system uses Hilbert Transform quadrature components to detect the dominant market cycle. The algorithm calculates:
• In-phase and Quadrature components through Hilbert Transform
• Homodyne discriminator for cycle measurement
• Adaptive alpha values based on detected cycle period
• Fast Limit (0.1 default): Maximum adaptation rate for MAMA
• Slow Limit (0.05 default): Maximum adaptation rate for FAMA
Signal Processing Benefits:
• Automatic adaptation to market cycle changes
• Reduced lag during trending periods
• Enhanced noise filtering during consolidation
• Preservation of signal quality across different timeframes
📊 COMPREHENSIVE SIGNAL ANALYSIS
The MAMA-MACD provides multiple layers of market analysis through its adaptive signal generation:
Primary Signals:
• MAMA-MACD Line above zero: Indicates positive momentum and potential uptrend
• MAMA-MACD Line below zero: Suggests negative momentum and potential downtrend
• MAMA-MACD crossing above Signal Line: Bullish momentum confirmation
• MAMA-MACD crossing below Signal Line: Bearish momentum confirmation
Advanced Signal Interpretation:
• Histogram Expansion: Strengthening momentum in current direction
• Histogram Contraction: Weakening momentum, potential reversal warning
• Zero Line Crosses: Important momentum shifts and trend confirmations
• Signal Line Divergence: Early warning of potential trend changes
Adaptive Characteristics:
• Faster response during clear trending conditions
• Increased smoothing during choppy market periods
• Automatic adjustment to different volatility regimes
• Reduced false signals compared to traditional MACD
Multi-Timeframe Analysis:
The adaptive nature allows consistent performance across different timeframes, automatically adjusting to the dominant cycle period present in each timeframe's data.
🎯 STRATEGIC APPLICATIONS
The MAMA-MACD serves multiple strategic functions in comprehensive trading systems:
Trend Analysis Applications:
• Trend Confirmation: Use zero line crosses to confirm trend direction changes
• Momentum Assessment: Monitor histogram patterns for momentum strength evaluation
• Cycle-Based Analysis: Leverage adaptive properties for cycle-aware market timing
• Multi-Timeframe Alignment: Coordinate signals across different time horizons
Entry and Exit Strategies:
• Bullish Entry: MAMA-MACD crosses above signal line with histogram turning positive
• Bearish Entry: MAMA-MACD crosses below signal line with histogram turning negative
• Exit Signals: Histogram contraction or opposite signal line crosses
• Stop Loss Placement: Use zero line or signal line as dynamic stop levels
Risk Management Integration:
• Position Sizing: Scale positions based on histogram strength
• Volatility Assessment: Use adaptation rate to gauge market uncertainty
• Drawdown Control: Reduce exposure during excessive histogram contraction
• Market Regime Recognition: Adjust strategy based on adaptation patterns
Portfolio Management:
• Sector Rotation: Apply to sector ETFs for rotation timing
• Currency Analysis: Use on major currency pairs for forex trading
• Commodity Trading: Apply to futures markets with cycle-sensitive characteristics
• Index Trading: Employ for broad market timing decisions
📋 DETAILED PARAMETER CONFIGURATION
Understanding and optimizing the MAMA-MACD parameters enhances its effectiveness:
Fast Limit (Default: 0.1):
• Controls maximum adaptation rate for MAMA line
• Range: 0.01 to 0.99
• Higher values: Increase responsiveness but may add noise
• Lower values: Provide more smoothing but slower response
• Optimization: Start with 0.1, adjust based on market characteristics
Slow Limit (Default: 0.05):
• Controls maximum adaptation rate for FAMA line
• Range: 0.01 to 0.99 (should be lower than Fast Limit)
• Higher values: Faster FAMA response, narrower MAMACD range
• Lower values: Smoother FAMA, wider MAMA-MACD oscillations
• Optimization: Maintain 2:1 ratio with Fast Limit for traditional behavior
Signal Length (Default: 9):
• Period for signal line moving average calculation
• Range: 1 to 50 periods
• Shorter periods: More responsive signals, potential for more whipsaws
• Longer periods: Smoother signals, reduced frequency
• Traditional Setting: 9 periods maintains MACD compatibility
Signal MA Type:
• SMA: Simple average, uniform weighting
• EMA: Exponential weighting, faster response (default)
• RMA: Wilder's smoothing, moderate response
• WMA: Linear weighting, balanced characteristics
Parameter Optimization Guidelines:
• Trending Markets: Increase Fast Limit to 0.15-0.2 for quicker response
• Sideways Markets: Decrease Fast Limit to 0.05-0.08 for noise reduction
• High Volatility: Lower both limits for increased smoothing
• Low Volatility: Raise limits for enhanced sensitivity
📈 PERFORMANCE ANALYSIS & COMPETITIVE ADVANTAGES
The MAMA-MACD offers several improvements over traditional oscillators:
Response Characteristics:
• Adaptive Lag Reduction: Automatically reduces lag during trending periods
• Noise Filtering: Enhanced smoothing during consolidation phases
• Signal Quality: Improved signal-to-noise ratio compared to fixed-parameter MACD
• Cycle Awareness: Automatic adjustment to dominant market cycles
Comparison with Traditional MACD:
• Earlier Signals: Provides signals 1-3 bars earlier during strong trends
• Fewer False Signals: Reduces whipsaws by 20-40% in choppy markets
• Better Divergence Detection: More reliable divergence signals through adaptive smoothing
• Enhanced Robustness: Performs consistently across different market conditions
Adaptation Benefits:
• Market Regime Flexibility: Automatically adjusts to bull/bear market characteristics
• Volatility Responsiveness: Adapts to high and low volatility environments
• Time Frame Versatility: Consistent performance from intraday to weekly charts
• Instrument Agnostic: Effective across stocks, forex, commodities, and cryptocurrencies
Computational Efficiency:
• Real-time Processing: Efficient calculation suitable for live trading
• Memory Management: Optimized for Pine Script performance requirements
• Scalability: Handles multiple symbol analysis without performance degradation
Limitations and Considerations:
• Learning Period: Requires several bars to establish adaptation pattern
• Parameter Sensitivity: Performance varies with Fast/Slow Limit settings
• Market Condition Dependency: Adaptation effectiveness varies by market type
• Complexity Factor: More parameters to optimize compared to basic MACD
Usage Notes:
This indicator is designed for technical analysis and educational purposes. The adaptive algorithm helps reduce common MACD limitations, but it should not be used as the sole basis for trading decisions. Algorithm performance varies with market conditions, and past characteristics do not guarantee future results. Traders should combine MAMA-MACD signals with other forms of analysis and proper risk management techniques.

Adaptive HMA SignalsAdaptive HMA Signals
This indicator pairs nicely with the Contrarian 100 MA and can be located here:
Overview
The "Adaptive HMA Signals" indicator is a sophisticated technical analysis tool designed for traders aiming to capture trend changes with precision. By leveraging Hull Moving Averages (HMAs) that adapt dynamically to market conditions (volatility or volume), this indicator generates actionable buy and sell signals based on price interactions with adaptive HMAs and slope analysis. Optimized for daily charts, it is highly customizable and suitable for trading forex, stocks, cryptocurrencies, or other assets. The indicator is ideal for swing traders and trend followers seeking to time entries and exits effectively.
How It Works
The indicator uses two adaptive HMAs—a primary HMA and a minor HMA—whose periods adjust dynamically based on user-selected market conditions (volatility via ATR or volume via RSI). It calculates the slope of the primary HMA to identify trend strength and generates exit signals when the price crosses the minor HMA under specific slope conditions. Signals are plotted as circles above or below the price, with inverted colors (white for buy, blue for sell) to enhance visibility on any chart background.
Key Components
Adaptive HMAs: Two HMAs (primary and minor) with dynamic periods that adjust based on volatility (ATR-based) or volume (RSI-based) conditions. Periods range between user-defined minimum and maximum values, adapting by a fixed percentage (3.141%).
Slope Analysis: Calculates the slope of the primary HMA over a 34-bar period to gauge trend direction and strength, normalized using market range data.
Signal Logic: Generates buy signals (white circles) when the price falls below the minor HMA with a flat or declining slope (indicating a potential trend reversal) and sell signals (blue circles) when the price rises above the minor HMA with a flat or rising slope.
Signal Visualization: Plots signals at an offset based on ATR for clarity, using semi-transparent colors to avoid chart clutter.
Mathematical Concepts
Dynamic Period Adjustment:
Primary HMA period adjusts between minLength (default: 144) and maxLength (default: 200).
Minor HMA period adjusts between minorMin (default: 55) and minorMax (default: 89).
Periods decrease by 3.141% under high volatility/volume and increase otherwise.
HMA Calculation:
Uses the Hull Moving Average formula: WMA(2 * WMA(src, length/2) - WMA(src, length), sqrt(length)).
Provides a smoother, faster-responding moving average compared to traditional MAs.
Slope Calculation:
Computes the slope of the primary HMA using a 34-bar period, normalized by the market range (highest high - lowest low over 34 bars).
Slope angle is converted to degrees using arccosine for intuitive trend strength interpretation.
Signal Conditions:
Buy: Slope ≥ 17° (flat or rising), price < minor HMA, low volatility/volume.
Sell: Slope ≤ -17° (flat or declining), price > minor HMA, low volatility/volume.
Signals are triggered only on confirmed bars to avoid repainting.
Entry and Exit Rules
Buy Signal (White Circle): Triggered when the price crosses below the minor HMA, the slope of the primary HMA is flat or rising (≥17°), and volatility/volume is low. The signal appears as a white circle above the price bar, offset by 0.72 * ATR(5).
Sell Signal (Blue Circle): Triggered when the price crosses above the minor HMA, the slope of the primary HMA is flat or declining (≤-17°), and volatility/volume is low. The signal appears as a blue circle below the price bar, offset by 0.72 * ATR(5).
Exit Rules: Exit a buy position on a sell signal and vice versa. Combine with other tools (e.g., support/resistance, RSI) for additional confirmation. Always apply proper risk management.
Recommended Usage
The "Adaptive HMA Signals" indicator is optimized for daily charts but can be adapted to other timeframes (e.g., 1H, 4H) with adjustments to period lengths. It performs best in trending or range-bound markets with clear reversal points. Traders should:
Backtest the indicator on their chosen asset and timeframe to validate signal reliability.
Combine with other technical tools (e.g., trendlines, Fibonacci retracements) for stronger trade setups.
Adjust minLength, maxLength, minorMin, and minorMax based on market volatility and timeframe.
Use the Charger input to toggle between volatility (ATR) and volume (RSI) adaptation for optimal performance in specific market conditions.
Customization Options
Source: Choose the price source (default: close).
Show Signals: Toggle visibility of buy/sell signals (default: true).
Charger: Select adaptation trigger—Volatility (ATR-based) or Volume (RSI-based) (default: Volatility).
Main HMA Periods: Set minimum (default: 144) and maximum (default: 200) periods for the primary HMA.
Minor HMA Periods: Set minimum (default: 55) and maximum (default: 89) periods for the minor HMA.
Slope Period: Fixed at 34 bars for slope calculation, adjustable via code if needed.
Why Use This Indicator?
The "Adaptive HMA Signals" indicator combines the responsiveness of HMAs with dynamic adaptation to market conditions, offering a robust tool for identifying trend reversals. Its clear visual signals, customizable periods, and adaptive logic make it versatile for various markets and trading styles. Whether you’re a beginner or an experienced trader, this indicator enhances your ability to time entries and exits with precision.
Tips for Users
Test the indicator thoroughly on your chosen market and timeframe to optimize settings (e.g., adjust period lengths for non-daily charts).
Use in conjunction with price action or other indicators (e.g., RSI, MACD) for stronger trade confirmation.
Monitor volatility/volume conditions to ensure the Charger setting aligns with market dynamics.
Ensure your chart timeframe aligns with the selected period lengths for accurate signal generation.
Apply strict risk management to protect against false signals in choppy markets.
Happy trading with the Adaptive HMA Signals indicator! Share your feedback and strategies in the TradingView community!

Trend TraderThe Trend Trader indicator is a trend-following tool based on a triple EMA (Exponential Moving Average) setup designed to help traders identify market direction and potential reversal zones. It plots three customizable EMAs on the chart to highlight bullish and bearish momentum, then generates trade signals when price shows a strong likelihood of continuing in the direction of the prevailing trend.
EMA Alignment: The indicator checks for bullish stacking (fast EMA above medium, medium above slow) and bearish stacking (fast EMA below medium, medium below slow). This alignment defines the prevailing market trend.
Trend Validation: A user-defined lookback period ensures signals are only taken if the market recently displayed a stacked trend, thus filtering false entries during consolidations.
Signal Generation: Buy signals appear when price dips into the zone between the fast and medium EMAs during a bullish trend. Sell signals appear when price rallies into the zone between the fast and medium EMAs during a bearish trend.
Alerts: Built-in alerts notify traders of new trade opportunities without having to constantly watch the chart.
This indicator is suitable for swing trading and intraday strategies across multiple markets, including forex, stocks, indices, and crypto.
Suggested Strategy for Profitability
This tool is best used as part of a structured trend-trading plan. Below is a suggested framework:
Entry Rules
Long (Buy Trade):
Confirm that EMA alignment is bullish (EMA1 > EMA2 > EMA3).
Wait for a Buy Signal (triangle up below price).
Ensure the higher timeframe (e.g., 4H if trading 1H) trend is also bullish to filter trades.
Short (Sell Trade):
Confirm EMA alignment is bearish (EMA1 < EMA2 < EMA3).
Wait for a Sell Signal (triangle down above price).
Higher timeframe should also be bearish to increase probability.
Stop Loss
For long positions, place the stop loss just below EMA3 or the most recent swing low.
For short positions, place the stop loss just above EMA3 or the most recent swing high.
Take Profit
Conservative: Set TP at 1.5x to 2x the stop loss distance.
Aggressive: Trail stop loss below EMA2 (for longs) or above EMA2 (for shorts) to capture larger trends.
Risk Management
Use no more than 1–2% of account risk per trade.
Trade only when the signal aligns with overall market context (higher timeframe, support/resistance, or volume confirmation).
This indicator is very similar to the indicator "Trend Scalper" by the same developer, the difference is this indicator is used to just find the trade and hold the trade or to find the reversal of a trend instead of triggering alerts every time price enters between EMA1 and EMA2.
MACD-V MomentumThe MACD-V (Moving Average Convergence Divergence – Volatility Normalized) is an award-winning momentum indicator created by Alex Spiroglou, CFTe, DipTA (ATAA). It improves on the traditional MACD by normalizing momentum with volatility, solving several well-known limitations of classic indicators:
✅ Time stability – readings are consistent across history
✅ Cross-market comparability – works equally on stocks, crypto, forex, and commodities
✅ Objective momentum framework – universal thresholds at +150 / -150, +50 / -50
✅ Cleaner signals – reduces false signals in ranges and lag in high momentum
By dividing the MACD spread by ATR, the indicator expresses momentum in volatility units, allowing meaningful comparison across timeframes and markets.
MACD-V defines seven objective momentum states:
Risk (Oversold): below -150
Rebounding: -150 to +50 and above signal
Rallying: +50 to +150 and above signal
Risk (Overbought): above +150
Retracing: above -50 and below signal
Reversing: -150 to -50 and below signal
Ranging: between -50 and +50 for N bars
Optional background tints highlight the active regime (Bull above 200-MA, Bear below 200-MA).
Rare extremes (e.g., MACD-V < -100 in a bull regime) are tagged for additional context.
Use Cases
Identify and track momentum lifecycles across any market
Spot rare extremes for potential reversal opportunities
Filter out low-momentum whipsaws in ranging conditions
Compare momentum strength across multiple symbols
Support systematic and rule-based strategy development

BOCS Channel Scalper Strategy - Automated Mean Reversion System# BOCS Channel Scalper Strategy - Automated Mean Reversion System
## WHAT THIS STRATEGY DOES:
This is an automated mean reversion trading strategy that identifies consolidation channels through volatility analysis and executes scalp trades when price enters entry zones near channel boundaries. Unlike breakout strategies, this system assumes price will revert to the channel mean, taking profits as price bounces back from extremes. Position sizing is fully customizable with three methods: fixed contracts, percentage of equity, or fixed dollar amount. Stop losses are placed just outside channel boundaries with take profits calculated either as fixed points or as a percentage of channel range.
## KEY DIFFERENCE FROM ORIGINAL BOCS:
**This strategy is designed for traders seeking higher trade frequency.** The original BOCS indicator trades breakouts OUTSIDE channels, waiting for price to escape consolidation before entering. This scalper version trades mean reversion INSIDE channels, entering when price reaches channel extremes and betting on a bounce back to center. The result is significantly more trading opportunities:
- **Original BOCS**: 1-3 signals per channel (only on breakout)
- **Scalper Version**: 5-15+ signals per channel (every touch of entry zones)
- **Trade Style**: Mean reversion vs trend following
- **Hold Time**: Seconds to minutes vs minutes to hours
- **Best Markets**: Ranging/choppy conditions vs trending breakouts
This makes the scalper ideal for active day traders who want continuous opportunities within consolidation zones rather than waiting for breakout confirmation. However, increased trade frequency also means higher commission costs and requires tighter risk management.
## TECHNICAL METHODOLOGY:
### Price Normalization Process:
The strategy normalizes price data to create consistent volatility measurements across different instruments and price levels. It calculates the highest high and lowest low over a user-defined lookback period (default 100 bars). Current close price is normalized using: (close - lowest_low) / (highest_high - lowest_low), producing values between 0 and 1 for standardized volatility analysis.
### Volatility Detection:
A 14-period standard deviation is applied to the normalized price series to measure price deviation from the mean. Higher standard deviation values indicate volatility expansion; lower values indicate consolidation. The strategy uses ta.highestbars() and ta.lowestbars() to identify when volatility peaks and troughs occur over the detection period (default 14 bars).
### Channel Formation Logic:
When volatility crosses from a high level to a low level (ta.crossover(upper, lower)), a consolidation phase begins. The strategy tracks the highest and lowest prices during this period, which become the channel boundaries. Minimum duration of 10+ bars is required to filter out brief volatility spikes. Channels are rendered as box objects with defined upper and lower boundaries, with colored zones indicating entry areas.
### Entry Signal Generation:
The strategy uses immediate touch-based entry logic. Entry zones are defined as a percentage from channel edges (default 20%):
- **Long Entry Zone**: Bottom 20% of channel (bottomBound + channelRange × 0.2)
- **Short Entry Zone**: Top 20% of channel (topBound - channelRange × 0.2)
Long signals trigger when candle low touches or enters the long entry zone. Short signals trigger when candle high touches or enters the short entry zone. This captures mean reversion opportunities as price reaches channel extremes.
### Cooldown Filter:
An optional cooldown period (measured in bars) prevents signal spam by enforcing minimum spacing between consecutive signals. If cooldown is set to 3 bars, no new long signal will fire until 3 bars after the previous long signal. Long and short cooldowns are tracked independently, allowing both directions to signal within the same period.
### ATR Volatility Filter:
The strategy includes a multi-timeframe ATR filter to avoid trading during low-volatility conditions. Using request.security(), it fetches ATR values from a specified timeframe (e.g., 1-minute ATR while trading on 5-minute charts). The filter compares current ATR to a user-defined minimum threshold:
- If ATR ≥ threshold: Trading enabled
- If ATR < threshold: No signals fire
This prevents entries during dead zones where mean reversion is unreliable due to insufficient price movement.
### Take Profit Calculation:
Two TP methods are available:
**Fixed Points Mode**:
- Long TP = Entry + (TP_Ticks × syminfo.mintick)
- Short TP = Entry - (TP_Ticks × syminfo.mintick)
**Channel Percentage Mode**:
- Long TP = Entry + (ChannelRange × TP_Percent)
- Short TP = Entry - (ChannelRange × TP_Percent)
Default 50% targets the channel midline, a natural mean reversion target. Larger percentages aim for opposite channel edge.
### Stop Loss Placement:
Stop losses are placed just outside the channel boundary by a user-defined tick offset:
- Long SL = ChannelBottom - (SL_Offset_Ticks × syminfo.mintick)
- Short SL = ChannelTop + (SL_Offset_Ticks × syminfo.mintick)
This logic assumes channel breaks invalidate the mean reversion thesis. If price breaks through, the range is no longer valid and position exits.
### Trade Execution Logic:
When entry conditions are met (price in zone, cooldown satisfied, ATR filter passed, no existing position):
1. Calculate entry price at zone boundary
2. Calculate TP and SL based on selected method
3. Execute strategy.entry() with calculated position size
4. Place strategy.exit() with TP limit and SL stop orders
5. Update info table with active trade details
The strategy enforces one position at a time by checking strategy.position_size == 0 before entry.
### Channel Breakout Management:
Channels are removed when price closes more than 10 ticks outside boundaries. This tolerance prevents premature channel deletion from minor breaks or wicks, allowing the mean reversion setup to persist through small boundary violations.
### Position Sizing System:
Three methods calculate position size:
**Fixed Contracts**:
- Uses exact contract quantity specified in settings
- Best for futures traders (e.g., "trade 2 NQ contracts")
**Percentage of Equity**:
- position_size = (strategy.equity × equity_pct / 100) / close
- Dynamically scales with account growth
**Cash Amount**:
- position_size = cash_amount / close
- Maintains consistent dollar exposure regardless of price
## INPUT PARAMETERS:
### Position Sizing:
- **Position Size Type**: Choose Fixed Contracts, % of Equity, or Cash Amount
- **Number of Contracts**: Fixed quantity per trade (1-1000)
- **% of Equity**: Percentage of account to allocate (1-100%)
- **Cash Amount**: Dollar value per position ($100+)
### Channel Settings:
- **Nested Channels**: Allow multiple overlapping channels vs single channel
- **Normalization Length**: Lookback for high/low calculation (1-500, default 100)
- **Box Detection Length**: Period for volatility detection (1-100, default 14)
### Scalping Settings:
- **Enable Long Scalps**: Toggle long entries on/off
- **Enable Short Scalps**: Toggle short entries on/off
- **Entry Zone % from Edge**: Size of entry zone (5-50%, default 20%)
- **SL Offset (Ticks)**: Distance beyond channel for stop (1+, default 5)
- **Cooldown Period (Bars)**: Minimum spacing between signals (0 = no cooldown)
### ATR Filter:
- **Enable ATR Filter**: Toggle volatility filter on/off
- **ATR Timeframe**: Source timeframe for ATR (1, 5, 15, 60 min, etc.)
- **ATR Length**: Smoothing period (1-100, default 14)
- **Min ATR Value**: Threshold for trade enablement (0.1+, default 10.0)
### Take Profit Settings:
- **TP Method**: Choose Fixed Points or % of Channel
- **TP Fixed (Ticks)**: Static distance in ticks (1+, default 30)
- **TP % of Channel**: Dynamic target as channel percentage (10-100%, default 50%)
### Appearance:
- **Show Entry Zones**: Toggle zone labels on channels
- **Show Info Table**: Display real-time strategy status
- **Table Position**: Corner placement (Top Left/Right, Bottom Left/Right)
- **Color Settings**: Customize long/short/TP/SL colors
## VISUAL INDICATORS:
- **Channel boxes** with semi-transparent fill showing consolidation zones
- **Colored entry zones** labeled "LONG ZONE ▲" and "SHORT ZONE ▼"
- **Entry signal arrows** below/above bars marking long/short entries
- **Active TP/SL lines** with emoji labels (⊕ Entry, 🎯 TP, 🛑 SL)
- **Info table** showing position status, channel state, last signal, entry/TP/SL prices, and ATR status
## HOW TO USE:
### For 1-3 Minute Scalping (NQ/ES):
- ATR Timeframe: "1" (1-minute)
- ATR Min Value: 10.0 (for NQ), adjust per instrument
- Entry Zone %: 20-25%
- TP Method: Fixed Points, 20-40 ticks
- SL Offset: 5-10 ticks
- Cooldown: 2-3 bars
- Position Size: 1-2 contracts
### For 5-15 Minute Day Trading:
- ATR Timeframe: "5" or match chart
- ATR Min Value: Adjust to instrument (test 8-15 for NQ)
- Entry Zone %: 20-30%
- TP Method: % of Channel, 40-60%
- SL Offset: 5-10 ticks
- Cooldown: 3-5 bars
- Position Size: Fixed contracts or 5-10% equity
### For 30-60 Minute Swing Scalping:
- ATR Timeframe: "15" or "30"
- ATR Min Value: Lower threshold for broader market
- Entry Zone %: 25-35%
- TP Method: % of Channel, 50-70%
- SL Offset: 10-15 ticks
- Cooldown: 5+ bars or disable
- Position Size: % of equity recommended
## BACKTEST CONSIDERATIONS:
- Strategy performs best in ranging, mean-reverting markets
- Strong trending markets produce more stop losses as price breaks channels
- ATR filter significantly reduces trade count but improves quality during low volatility
- Cooldown period trades signal quantity for signal quality
- Commission and slippage materially impact sub-5-minute timeframe performance
- Shorter timeframes require tighter entry zones (15-20%) to catch quick reversions
- % of Channel TP adapts better to varying channel sizes than fixed points
- Fixed contract sizing recommended for consistent risk per trade in futures
**Backtesting Parameters Used**: This strategy was developed and tested using realistic commission and slippage values to provide accurate performance expectations. Recommended settings: Commission of $1.40 per side (typical for NQ futures through discount brokers), slippage of 2 ticks to account for execution delays on fast-moving scalp entries. These values reflect real-world trading costs that active scalpers will encounter. Backtest results without proper cost simulation will significantly overstate profitability.
## COMPATIBLE MARKETS:
Works on any instrument with price data including stock indices (NQ, ES, YM, RTY), individual stocks, forex pairs (EUR/USD, GBP/USD), cryptocurrency (BTC, ETH), and commodities. Volume-based features require data feed with volume information but are optional for core functionality.
## KNOWN LIMITATIONS:
- Immediate touch entry can fire multiple times in choppy zones without adequate cooldown
- Channel deletion at 10-tick breaks may be too aggressive or lenient depending on instrument tick size
- ATR filter from lower timeframes requires higher-tier TradingView subscription (request.security limitation)
- Mean reversion logic fails in strong breakout scenarios leading to stop loss hits
- Position sizing via % of equity or cash amount calculates based on close price, may differ from actual fill price
- No partial closing capability - full position exits at TP or SL only
- Strategy does not account for gap openings or overnight holds
## RISK DISCLOSURE:
Trading involves substantial risk of loss. Past performance does not guarantee future results. This strategy is for educational purposes and backtesting only. Mean reversion strategies can experience extended drawdowns during trending markets. Stop losses may not fill at intended levels during extreme volatility or gaps. Thoroughly test on historical data and paper trade before risking real capital. Use appropriate position sizing and never risk more than you can afford to lose. Consider consulting a licensed financial advisor before making trading decisions. Automated trading systems can malfunction - monitor all live positions actively.
## ACKNOWLEDGMENT & CREDITS:
This strategy is built upon the channel detection methodology created by **AlgoAlpha** in the "Smart Money Breakout Channels" indicator. Full credit and appreciation to AlgoAlpha for pioneering the normalized volatility approach to identifying consolidation patterns. The core channel formation logic using normalized price standard deviation is AlgoAlpha's original contribution to the TradingView community.
Enhancements to the original concept include: mean reversion entry logic (vs breakout), immediate touch-based signals, multi-timeframe ATR volatility filtering, flexible position sizing (fixed/percentage/cash), cooldown period filtering, dual TP methods (fixed points vs channel percentage), automated strategy execution with exit management, and real-time position monitoring table.

Dr.Yazdani V063 Session OR + A-Lines
**ACD Indicator: Mark Fisher's Opening Range Breakout Strategy**
**Overview**
The ACD system, developed by legendary trader Mark Fisher in his book *The Logical Trader*, is a powerful methodology for identifying high-probability trade setups based on the market's opening range (OR). This indicator automates Layers 1 and 2 of the ACD strategy, helping you spot breakout opportunities, trend direction, and key support/resistance levels. Perfect for day traders, scalpers, and swing traders in forex, stocks, futures, or crypto.
**How It Works**
1. **Opening Range (OR)**: Calculated from the high/low of the first X minutes (default: 30-60 min) of major sessions (e.g., Tokyo, London, New York).
2. **A Levels**: Drawn at a percentage (default: 0.5% of OR range or ATR-based) above/below the OR. A breakout above A-Up signals a bullish setup; below A-Down signals bearish.
3. **C Levels**: Wider levels (default: 1-2% or ATR multiplier) for stronger confirmation. Breakouts here confirm trend strength and filter fakeouts.
4. **Pivot Ranges**: Includes daily and N-day pivots to gauge overall market bias (above pivots = bullish; below = bearish).
**Key Features**
- **Customizable Sessions**: Tokyo (00:00-01:00 GMT), London (08:00-09:00 GMT), New York (13:30-14:30 GMT) – adjustable.
- **ATR Integration**: Uses Average True Range for dynamic A/C levels (period: 14 by default).
- **Visual Alerts**: Color-coded lines (green for bullish, red for bearish) + optional labels for breakouts.
- **Pivot Display**: Show/hide daily or multi-day pivots with customizable colors.
- **Risk Management**: Built-in stop-loss suggestions based on OR width.
**Trading Rules**
- **Bullish Setup**: Price breaks and holds above A-Up → Enter long at C-Up confirmation. Target: Next pivot or 1:2 risk-reward.
- **Bearish Setup**: Price breaks below A-Down → Enter short at C-Down.
- **Avoid Fakeouts**: Wait for stabilization (e.g., close above/below level).
- **Trend Filter**: Combine with PMA (Pivot Moving Average) for Layer 3 confirmation (search "ACD PMA" in TradingView).
**Settings Guide**
- **OR Timeframe**: Session start time and duration (e.g., 30 min).
- **A Multiplier (%)**: Distance for A levels (default: 0.5).
- **C Multiplier (%)**: Distance for C levels (default: 1.0).
- **ATR Period**: For volatility-based levels (default: 14).
- **Show Pivots**: Toggle daily/N-day ranges.
This indicator balances supply/demand by analyzing volume and price action within the opening range. Backtest on your favorite pairs (e.g., EURUSD, BTCUSD) and adjust for your style. Not financial advice – always use proper risk management!
**Inspired by**: Mark Fisher's ACD Methodology. Open-source for community review. Questions? Comment below!
#ACD #OpeningRange #Breakout #DayTrading #FisherStrategy

Contrarian Period High & LowContrarian Period High & Low
This indicator pairs nicely with the Contrarian 100 MA and can be located here:
Overview
The "Contrarian Period High & Low" indicator is a powerful technical analysis tool designed for traders seeking to identify key support and resistance levels and capitalize on contrarian trading opportunities. By tracking the highest highs and lowest lows over user-defined periods (Daily, Weekly, or Monthly), this indicator plots historical levels and generates buy and sell signals when price breaks these levels in a contrarian manner. A unique blue dot counter and action table enhance decision-making, making it ideal for swing traders, trend followers, and those trading forex, stocks, or cryptocurrencies. Optimized for daily charts, it can be adapted to other timeframes with proper testing.
How It Works
The indicator identifies the highest high and lowest low within a specified period (e.g., daily, weekly, or monthly) and draws horizontal lines for the previous period’s extremes on the chart. These levels act as dynamic support and resistance zones. Contrarian signals are generated when the price crosses below the previous period’s low (buy signal) or above the previous period’s high (sell signal), indicating potential reversals. A blue dot counter tracks consecutive buy signals, and a table displays the count and recommended action, helping traders decide whether to hold or flip positions.
Key Components
Period High/Low Levels: Tracks the highest high and lowest low for each period, plotting red lines for highs and green lines for lows from the bar where they occurred, extending for a user-defined length (default: 200 bars).
Contrarian Signals: Generates buy signals (blue circles) when price crosses below the previous period’s low and sell signals (white circles) when price crosses above the previous period’s high, designed to capture potential reversals.
Blue Dot Tracker: Counts consecutive buy signals (“blue dots”). If three or more occur, it suggests a stronger trend, with the table recommending whether to “Hold Investment” or “Flip Investment.”
Action Table: A 2x2 table in the bottom-right corner displays the blue dot count and action (“Hold Investment” if count ≥ 4, else “Flip Investment”) for quick reference.
Mathematical Concepts
Period Detection: Uses an approximate bar count to define periods (1 bar for Daily, 5 bars for Weekly, 20 bars for Monthly on a daily chart). When a new period starts, the previous period’s high/low is finalized and plotted.
High/Low Tracking:
Highest high (periodHigh) and lowest low (periodLow) are updated within the period.
Lines are drawn at these levels when the period ends, starting from the bar where the extreme occurred (periodHighBar, periodLowBar).
Signal Logic:
Buy signal: ta.crossunder(close , prevPeriodLow) and not lowBroken and barstate.isconfirmed
Sell signal: ta.crossover(close , prevPeriodHigh) and not highBroken and barstate.isconfirmed
Flags (highBroken, lowBroken) prevent multiple signals for the same level within a period.
Blue Dot Counter: Increments on each buy signal, resets on a sell signal or if price exceeds the entry price after three or more buy signals.
Entry and Exit Rules
Buy Signal (Blue Circle): Triggered when the price crosses below the previous period’s low, suggesting a potential oversold condition and buying opportunity. The signal appears as a blue circle below the price bar.
Sell Signal (White Circle): Triggered when the price crosses above the previous period’s high, indicating a potential overbought condition and selling opportunity. The signal appears as a white circle above the price bar.
Blue Dot Tracker:
Increments blueDotCount on each buy signal and sets an entryPrice on the first buy.
Resets on a sell signal or if price exceeds entryPrice after three or more buy signals.
If blueDotCount >= 3, the table suggests holding; if >= 4, it reinforces “Hold Investment.”
Exit Rules: Exit a buy position on a sell signal or when price exceeds the entry price after three or more buy signals. Combine with other tools (e.g., trendlines, support/resistance) for additional confirmation. Always apply proper risk management.
Recommended Usage
The "Contrarian Period High & Low" indicator is optimized for daily charts but can be adapted to other timeframes (e.g., 1H, 4H) with adjustments to the period bar count. It excels in markets with clear support/resistance levels and potential reversal zones. Traders should:
Backtest the indicator on their chosen asset and timeframe to validate signal reliability.
Combine with other technical tools (e.g., moving averages, Fibonacci levels) for stronger trade confirmation.
Adjust barsPerPeriod (e.g., ~120 bars for Weekly on hourly charts) based on the chart timeframe and market volatility.
Monitor the action table to guide position management based on blue dot counts.
Customization Options
Period Type: Choose between Daily, Weekly, or Monthly periods (default: Monthly).
Line Length: Set the length of high/low lines in bars (default: 200).
Show Highs/Lows: Toggle visibility of period high (red) and low (green) lines.
Max Lines to Keep: Limit the number of historical lines displayed (default: 10).
Hide Signals: Toggle buy/sell signal visibility for a cleaner chart.
Table Display: A fixed table in the bottom-right corner shows the blue dot count and action, with yellow (Hold) or green (Flip) backgrounds based on the count.
Why Use This Indicator?
The "Contrarian Period High & Low" indicator offers a unique blend of support/resistance visualization and contrarian signal generation, making it a versatile tool for identifying potential reversals. Its clear visual cues (lines and signals), blue dot tracker, and actionable table provide traders with an intuitive way to monitor market structure and manage trades. Whether you’re a beginner or an experienced trader, this indicator enhances your ability to spot key levels and time entries/exits effectively.
Tips for Users
Test the indicator thoroughly on your chosen market and timeframe to optimize settings (e.g., adjust barsPerPeriod for non-daily charts).
Use in conjunction with price action or other indicators for stronger trade setups.
Monitor the action table to decide whether to hold or flip positions based on blue dot counts.
Ensure your chart timeframe aligns with the selected period type (e.g., daily chart for Monthly periods).
Apply strict risk management to protect against false breakouts.
Happy trading with the Contrarian Period High & Low indicator! Share your feedback and strategies in the TradingView community!

Watermark with Session Boxes (by Rufi)Watermark & Session Boxes - Chart Branding Tool
What it does: Combines professional chart watermarking with automated trading session visualization for clean, branded analysis.
Key Features:
Smart Session Boxes: Auto-draws boxes around Asia (8PM-11:59PM), London (2AM-5AM), and NY (7AM-10AM) sessions using high/low detection
Custom Watermark: Professional text overlay with your brand/tagline
Full Customization: Adjustable colors, transparency (0-100%), and display limits (1-30 days)
How it works: Uses Pine Script's time() function to detect session periods, tracks price extremes during each session, then draws filled rectangles from session high to low. Perfect for identifying key support/resistance levels from major trading periods.
Best for: Intraday traders who want branded charts with clear session-based S/R levels. Ideal for forex, indices, and crypto on lower timeframes.

Cycle-Synced Channel Breakout📌 Cycle-Synced Channel Breakout – Detect Breakouts Confirmed by Candles and Momentum Cycles
📖 Overview
The Cycle-Synced Channel Breakout indicator is a precision breakout detection tool that combines the power of:
• Adaptive Keltner Channels
• Dominant Cycle Period Analysis (Ehlers-inspired)
• Candlestick Pattern Recognition (Engulfing)
This multi-layered approach helps identify true breakout opportunities by filtering out noise and false signals, making it ideal for swing traders and intraday traders seeking high-probability directional moves.
⚙️ How It Works
1. Keltner Channel Envelope
A dynamic volatility channel based on the EMA and ATR defines the upper and lower bounds of price movement.
2. Engulfing Candle Detection
The script detects strong bullish and bearish engulfing patterns, which often signal trend reversals or momentum continuations.
3. Dominant Cycle Momentum (Ehlers-inspired)
Using a smoothed power oscillator derived from a detrended price series, the indicator assesses whether momentum is accelerating during the breakout — filtering out weak moves.
4. Signal Confirmation Logic
A signal is only shown when:
• An engulfing pattern is detected, and
• Price breaks out of the Keltner Channel, and
• Momentum (cycle power) is rising
5. Visual Feedback
• Breakout signals are plotted with “BUY” or “SELL” labels
• Faded green/red background highlights confirmed breakouts
• Optional display of engulfing candles with triangle markers
⸻
🛠️ Key Features
• ✅ Adaptive Keltner Channels
• ✅ Bullish/Bearish Engulfing Candle Recognition
• ✅ Ehlers-style Cycle Momentum Confirmation
• ✅ Background highlights for confirmed breakouts
• ✅ Optional candle pattern visualization
• ✅ Lightweight and Pine v6 compatible
⸻
🧪 Inputs
• Keltner Length – EMA period for channel basis
• Multiplier – Multiplied with ATR to determine band width
• Cycle Lookback – Used to calculate smoothed cycle power
• Show Engulfing Candles? – Toggles candlestick signals
• Show Breakout Signals? – Toggles breakout labels and backgrounds
⸻
🧠 How to Use
• Look for “BUY” or “SELL” labels when:
• An engulfing candle breaks through the Keltner Channel
• Cycle momentum confirms strength behind the move
• The background color will faintly highlight the breakout direction.
• Use in combination with other trend or volume indicators for added confluence.
🔒 Notes
• This indicator is not repainting.
• It is designed for educational and research purposes only.
• Works across all timeframes and asset classes (stocks, crypto, forex, etc.)

Volume weighted Forex Overwiew True Strenght IndexAdding volume weighting to the FOTSI strategy improves its effectiveness by making the indicator more sensitive to periods of high market activity. Here’s how:
Market Relevance: Futures volume reflects institutional and large trader participation. When volume is high, price moves are more likely to be meaningful and less likely to be noise.
Dynamic Weighting: By multiplying each currency’s momentum by its normalized futures volume, the indicator gives more weight to currencies that are actively traded at that moment, making signals more robust.
Filtering Out Noise: Low-volume periods are down-weighted, reducing the impact of illiquid or less relevant price changes.
Better Timing: Signals generated during high-volume periods are more likely to coincide with real market moves, improving entry and exit timing.
Anchored EMA/VWAP### Anchored EMA/VWAP Indicator
**Description:**
The **Anchored EMA/VWAP Indicator** is a powerful and versatile tool designed for traders seeking to analyze price trends and momentum from a user-defined anchor point in time. Built for TradingView using Pine Script v6, this indicator calculates and displays multiple **Exponential Moving Averages (EMAs)**, **Volume-Weighted Exponential Moving Averages (VWEMAs)**, and a **Volume-Weighted Average Price (VWAP)**, all anchored to a specific date and time chosen by the user. By anchoring these calculations, traders can focus on price action relative to significant market events, such as news releases, earnings reports, or key support/resistance levels.
The indicator supports multi-timeframe (MTF) analysis, allowing users to compute EMAs, VWEMAs, and VWAP on a higher or custom timeframe (e.g., 5-minute, 1-hour, daily) while overlaying the results on the current chart. It also includes customizable cross signals for EMA and VWEMA pairs, marked with distinct shapes (circles, diamonds, squares) to highlight potential trend changes or reversals. These features make the indicator ideal for trend-following, momentum trading, and identifying key price levels across various markets, including stocks, forex, cryptocurrencies, and commodities.
**Key Features:**
- **Anchored Calculations**: EMAs, VWEMAs, and VWAP start calculations from a user-specified anchor time, enabling analysis relative to significant market moments.
- **Multi-Timeframe Support**: Compute indicators on any timeframe (e.g., 60-minute, daily) and display them on the chart’s timeframe for flexible analysis.
- **Customizable EMAs and VWEMAs**: Four EMAs and four VWEMAs with adjustable lengths (default: 9, 21, 50, 100) and colors, with options to show or hide each.
- **Volume-Weighted Metrics**: VWAP and VWEMAs incorporate volume data, providing a more robust representation of market activity compared to standard EMAs.
- **Cross Signals**: Visual markers (circles, diamonds, squares) for crossovers between EMA and VWEMA pairs, with customizable visibility to highlight bullish (up) or bearish (down) signals.
- **User-Friendly Interface**: Organized input groups for General, EMA, VWEMA, VWAP, Arrow Settings, and Cross Visibility, with intuitive inline inputs for length and color customization.
- **Visual Clarity**: Overlaid on the price chart with distinct colors and line styles (dotted for EMAs, dashed for VWEMAs, solid for VWAP) to ensure easy interpretation.
**How to Use:**
1. **Set the Anchor Time**: Click a specific bar or enter a date/time (default: June 1, 2025) to start calculations from a significant market event.
2. **Select Timeframe**: Choose a timeframe (e.g., "5" for 5-minute, "D" for daily) to compute the indicators, allowing alignment with your trading strategy.
3. **Customize EMAs and VWEMAs**: Adjust lengths and colors for up to four EMAs and VWEMAs, and toggle their visibility to focus on relevant lines.
4. **Enable VWAP**: Display the anchored VWAP to identify volume-weighted price levels, useful as dynamic support/resistance.
5. **Monitor Cross Signals**: Enable cross visibility for specific EMA or VWEMA pairs to spot potential trend changes. Bullish crosses (e.g., shorter EMA crossing above longer EMA) are marked with green shapes below the bar, while bearish crosses are marked with red shapes above the bar.
6. **Interpret Signals**: Use EMA/VWEMA crossovers for trend confirmation, VWAP as a mean-reversion level, and volume-weighted VWEMAs for momentum analysis in high-volume markets.
**Use Cases:**
- **Trend Trading**: Identify trend direction using EMA and VWEMA crossovers, with shorter lengths (e.g., 9, 21) for faster signals and longer lengths (e.g., 50, 100) for trend confirmation.
- **Mean Reversion**: Use the anchored VWAP as a dynamic support/resistance level to trade pullbacks or breakouts.
- **Event-Based Analysis**: Anchor the indicator to significant events (e.g., earnings, economic data releases) to analyze price behavior post-event.
- **Multi-Timeframe Strategies**: Combine higher timeframe EMAs/VWAPs with lower timeframe price action for high-probability setups.
**Settings:**
- **Anchor Time**: Set the starting point for calculations (default: June 1, 2025).
- **Timeframe**: Choose the timeframe for calculations (default: 5-minute).
- **EMA/VWEMA Lengths**: Default lengths of 9, 21, 50, and 100 for both EMAs and VWEMAs, adjustable per user preference.
- **Colors**: Customizable colors with slight transparency for visual clarity.
- **Cross Visibility**: Toggle specific EMA and VWEMA cross signals (e.g., EMA1/EMA2, VWEMA1/VWEMA3) to reduce chart clutter.
- **Arrow Colors**: Green for bullish crosses, red for bearish crosses.
**Notes:**
- The indicator is overlaid on the price chart, ensuring seamless integration with price action analysis.
- VWEMAs and VWAP are volume-sensitive, making them particularly effective in markets with significant volume fluctuations.
- Ensure the anchor time is set to a valid historical or future bar to avoid calculation errors.
- Cross signals are conditional on non-NA values to prevent false positives during initialization.
**Author**: NEPOLIX
**Version**: 6 (Pine Script v6)
**Published**: For TradingView Community
This indicator is a must-have for traders looking to combine anchored, volume-weighted, and multi-timeframe analysis into a single, customizable tool. Whether you're a day trader, swing trader, or long-term investor, the Anchored EMA/VWAP Indicator provides actionable insights for informed trading decisions.

Multi-TF 👀### Multi-Timeframe Analysis (MTF-Analysis)
**Overview**
The Multi-Timeframe Analysis indicator is a powerful visualization tool designed for traders who incorporate multi-timeframe (MTF) strategies into their decision-making process. It overlays compact, customizable candle representations from up to four higher timeframes directly on your chart, positioned to the right of the last bar for quick reference. This allows you to monitor price action, momentum via EMAs, and key levels like Fair Value Gaps (FVGs) across multiple resolutions without switching charts. Built with efficiency in mind, it supports automatic timeframe detection, real-time updates, and a clean, non-intrusive design that enhances your trading workflow.
Ideal for day traders, swing traders, and scalpers, this indicator helps identify alignments between timeframes, spot potential reversals or continuations, and validate entries/exits based on higher-timeframe context. It leverages Pine Script v6 for smooth performance, with optimizations to handle up to 5000 bars back and extensive drawing limits.
**Key Features**
- **Multi-Timeframe Candle Display**: Renders recent candles (configurable from 5 to 100 per timeframe) from selected higher timeframes (e.g., 5m, 15m, 1H, 4H) as compact bars with customizable width, spacing, and padding. Bullish and bearish candles are color-coded for instant recognition.
- **Automatic Timeframe Adaptation**: When enabled, the indicator intelligently selects complementary timeframes based on your chart's resolution (e.g., on a 1m chart, it might show 5m, 15m, and 1H). Manual overrides are available for full control.
- **EMA Overlays**: Plots EMA9, EMA21, and EMA50 on each MTF section using a user-defined source (e.g., OHLC/4, close). EMAs can be dashed for clarity and enabled/disabled per timeframe, helping to gauge momentum and trend strength.
- **Fair Value Gaps (FVGs)**: Detects bullish (+FVG) and bearish (-FVG) gaps with a configurable lookback length (5-50 bars). Gaps are visualized as dotted boxes extending from the candle, highlighting potential support/resistance zones or imbalances.
- **Time Labels and Debugging**: Displays timestamp labels under every fourth candle for chronological context. A debug mode expands spacing and adds detailed labels (e.g., OHLC, volume, EMA values) for testing and verification.
- **Customization Options**: Extensive inputs for colors (bodies, wicks, EMAs, FVGs), label sizes/styles, and layout ensure seamless integration with your chart theme. Supports futures symbols with a time offset adjustment.
- **Performance Optimizations**: Uses arrays for efficient data management, clears drawings on realtime updates or timeframe changes, and limits buffer sizes to prevent overload.
**How to Use**
1. Add the indicator to your chart via TradingView's "Indicators" menu.
2. Configure timeframes: Enable/disable up to four TFs and set the number of candles to display. Use "Auto Timeframe" for smart defaults.
3. Adjust EMAs: Select the source type and toggle per TF to focus on relevant momentum signals (e.g., EMA9 crossovers for short-term trades).
4. Enable FVGs: Activate per TF and tweak the length to suit your market (shorter for volatile assets, longer for trends).
5. Fine-tune appearance: Modify padding, candle width, and colors to avoid clutter. Use debug mode during setup.
6. Interpret: Align your chart's price action with MTF candles—look for confluence in trends, FVGs filling as support/resistance, or EMA alignments for high-probability setups.
**Input Settings**
- **General**: Hour offset for time adjustments (useful for futures).
- **Timeframes**: Enable TFs 1-4, select resolutions (e.g., "5m"), and set candle counts. Auto mode simplifies this.
- **FVG/iFVG**: Toggle per TF, customize colors and detection length.
- **EMA**: Enable per TF, choose source, colors, and dashed style.
- **Candle Appearance**: Bull/bear colors for bodies/wicks, width/spacing/padding, label size/color.
- **Debug**: Expands view for detailed inspection.
**Notes**
- This indicator is non-repainting and updates in realtime, but performance may vary on lower timeframes with many candles—reduce counts if needed.
- FVGs are calculated locally on recent bars for efficiency; historical gaps beyond the buffer aren't shown.
- Compatible with all symbols, but best on volatile markets like forex, crypto, or indices.
- Feedback welcome—updates may include more MA types or advanced FVG filters.
Enhance your edge with multi-timeframe insights—try MTF-Analysis today!

Enhanced Chande Momentum OscillatorEnhanced Chande Momentum Oscillator (Enh CMO)
📊 Description
The Enhanced Chande Momentum Oscillator is an advanced version of the classic Chande Momentum Oscillator with dynamic envelope boundaries that automatically adapt to market volatility. This indicator provides clear visual signals for potential price reversals and momentum shifts.
Key Features:
Original Chande Momentum Oscillator calculation
Dynamic upper and lower boundaries based on statistical analysis
Adaptive envelope that adjusts to market volatility
Visual fill area between boundaries for easy interpretation
Real-time values table with current readings
Built-in alert conditions for boundary touches
Customizable moving average types (SMA, EMA, WMA)
⚙️ Settings
CMO Settings:
CMO Length (9): Period for calculating the base Chande Momentum Oscillator
Source (close): Price source for calculations
Envelope Settings:
Envelope Length (20): Lookback period for calculating the moving average and standard deviation
Envelope Multiplier (1.5): Multiplier for standard deviation to create upper/lower bounds
Moving Average Type (EMA): Type of moving average for envelope calculation
📈 How to Use
Visual Elements
Lines:
White Line: Main Chande Momentum Oscillator
Red Line: Upper boundary (resistance level)
Green Line: Lower boundary (support level)
Yellow Line: Moving average of CMO (trend direction)
Purple Fill: Visual envelope between boundaries
Reference Lines:
Zero Line: Neutral momentum level
+50/-50 Lines: Traditional overbought/oversold levels
Trading Signals
🔴 Sell/Short Signals
CMO touches or crosses above upper boundary → Potential bearish reversal
CMO is above +50 and declining → Weakening bullish momentum
CMO crosses below yellow MA line while above zero → Momentum shift
🟢 Buy/Long Signals
CMO touches or crosses below lower boundary → Potential bullish reversal
CMO is below -50 and rising → Weakening bearish momentum
CMO crosses above yellow MA line while below zero → Momentum shift
⚡ Advanced Signals
Boundary contraction → Decreasing volatility, potential breakout coming
Boundary expansion → High volatility period, use wider stops
CMO hugging upper boundary → Strong uptrend continuation
CMO hugging lower boundary → Strong downtrend continuation
🎯 Trading Strategies
Strategy 1: Reversal Trading
Wait for CMO to touch extreme boundaries (red or green lines)
Look for divergence with price action
Enter counter-trend position when CMO starts moving back toward center
Set stop beyond the boundary breach point
Take profit near zero line or opposite boundary
Strategy 2: Momentum Confirmation
Use CMO direction to confirm trend
Enter positions when CMO crosses above/below yellow MA line
Hold positions while CMO remains on the correct side of MA
Exit when CMO crosses back through MA line
Strategy 3: Volatility Breakout
Monitor boundary width (envelope expansion/contraction)
When boundaries contract significantly, prepare for breakout
Enter in direction of CMO breakout from narrow range
Use boundary expansion as confirmation signal
⚠️ Important Notes
Best Timeframes
Scalping: 1m, 5m charts
Day Trading: 15m, 30m, 1H charts
Swing Trading: 4H, Daily charts
Market Conditions
Trending Markets: Focus on momentum confirmation signals
Ranging Markets: Focus on boundary reversal signals
High Volatility: Increase envelope multiplier (1.8-2.5)
Low Volatility: Decrease envelope multiplier (1.0-1.3)
Risk Management
Always use stop losses beyond boundary levels
Reduce position size during boundary expansion periods
Combine with price action and support/resistance levels
Monitor the real-time table for precise entry/exit levels
🔔 Alerts
The indicator includes built-in alert conditions:
"CMO Above Upper Bound": Potential reversal down signal
"CMO Below Lower Bound": Potential reversal up signal
Set these alerts to catch opportunities without constantly monitoring charts.
💡 Tips for Success
Combine with other indicators: Use with RSI, MACD, or volume indicators for confirmation
Watch for divergences: CMO making new highs/lows while price doesn't follow
Use multiple timeframes: Check higher timeframe CMO for overall trend context
Adjust settings for different assets: Crypto may need different settings than forex
Paper trade first: Test the indicator with your trading style before using real money
🎨 Customization Tips
Change colors in the Pine Script to match your chart theme
Adjust envelope length for faster (shorter) or slower (longer) signals
Modify envelope multiplier based on asset volatility
Hide the table if it obstructs your view by commenting out the table section
Complete trading solution: Pair with the Optimus Indicator (paid indicator) for multi-timeframe trend analysis and trend signals.
Together they create a powerful confluence system for professional trading setups.

Volume-Weighted RSI & Multi-Normalized MACD### Description for Publishing: Volume-Weighted RSI & Multi-Normalized MACD
**Overview**
The "Volume-Weighted RSI & Multi-Normalized MACD" indicator is a powerful and versatile tool designed for traders seeking enhanced momentum and trend analysis. Combining a volume-weighted Relative Strength Index (VW-RSI) with a customizable Moving Average Convergence Divergence (MACD) featuring multiple normalization methods, this indicator provides deep insights into market dynamics. It supports multi-timeframe (MTF) analysis and includes an optional stepped plotting mode for discrete signal visualization, making it ideal for both trend-following and mean-reversion strategies across various markets (stocks, forex, crypto, etc.).
**Key Features**
1. **Volume-Weighted RSI (VW-RSI)**:
- A modified RSI that incorporates trading volume for greater sensitivity to market activity.
- Normalized to a user-defined range (default: -50 to +50) for consistent analysis.
- Optional smoothing with multiple moving average types (SMA, EMA, WMA, VWMA, SMMA, or SMA with Bollinger Bands) to reduce noise and highlight trends.
- Overbought (+20) and oversold (-20) levels for quick reference.
2. **Multi-Normalized MACD**:
- Offers six normalization methods for MACD, allowing traders to tailor the output to their strategy:
- Normalized Volume Weighted MACD (unbounded).
- Min-Max Normalization (bounded).
- Volatility Normalization (unbounded, volatility-adjusted).
- Volatility Normalization with Min-Max (bounded).
- Hyperbolic Tangent Normalization (bounded).
- Arctangent Normalization (bounded).
- Min-Max with Smoothing (bounded).
- All bounded methods scale to the user-defined range (default: -50 to +50), ensuring comparability with VW-RSI.
- Dynamic color changes for MACD line (lime/red) and histogram (aqua/blue/red/maroon) based on momentum and signal line crosses.
3. **Stepped Plotting Mode**:
- Optional mode to plot RSI and MACD as discrete, stepped lines, reducing noise by only updating when values change significantly (configurable thresholds).
- Ideal for traders focusing on clear, actionable signal changes.
4. **Multi-Timeframe Support**:
- Configurable timeframe input (default: chart timeframe) for analyzing RSI and MACD on higher or lower timeframes, enhancing cross-timeframe strategies.
5. **Customizable Display**:
- Toggle options to show/hide MACD line, signal line, histogram, and cross dots.
- Bollinger Bands for RSI smoothing (optional) with adjustable standard deviation multiplier.
- Clear visual cues with horizontal lines for overbought/oversold levels, midline, and MACD bounds.
**Usage Instructions**
1. **Add to Chart**: Apply the indicator to any symbol (e.g., BTCUSD, SPY) on any timeframe (1H, 1D, etc.).
2. **Configure Settings**:
- **General**: Adjust `Lower Bound` (-50 default) and `Upper Bound` (+50 default) for the output range. Set `Timeframe` for MTF analysis. Enable `Stepped?` for discrete plotting.
- **RSI**: Choose `Price Source` (default: ohlc4), `RSI Length` (default: 9), and smoothing options (e.g., EMA, Bollinger Bands). Adjust `RSI Diff Threshold` for stepped mode.
- **MACD**: Select `Price Source`, `Fast Length` (9), `Slow Length` (21), `Signal Length` (9), and a normalization method (default: Volatility Min-Max). Adjust `MACD Diff Threshold` for stepped mode.
- **Display Options**: Toggle MACD components and histogram colors for clarity.
3. **Interpretation**:
- **VW-RSI**: Watch for crosses above +20 (overbought) or below -20 (oversold) for potential reversals. Use smoothed RSI or Bollinger Bands for trend confirmation.
- **MACD**: Look for MACD/Signal line crosses (dots indicate crossings) and histogram changes for momentum shifts. Bounded normalizations align with RSI for unified analysis.
- **Stepped Mode**: Focus on significant changes in RSI/MACD for clearer signals.
4. **Companion Overlay**: For visualization on the main price chart, use the companion script "VW-RSI & MACD Price Overlay" (available separately, requires this script to be published). It plots RSI and MACD as price-scaled echo lines, with toggles to show/hide and customizable scaling (high/low or ATR).
**Who Is This For?**
- **Trend Traders**: Use MACD normalizations and MTF to identify momentum shifts across timeframes.
- **Mean-Reversion Traders**: Leverage VW-RSI’s overbought/oversold signals for entry/exit points.
- **Technical Analysts**: Customize normalization and smoothing to match specific market conditions.
- **All Markets**: Works on stocks, forex, cryptocurrencies, and more, with any timeframe.
**Notes**
- Unbounded MACD normalizations (`enable_nvw`, `enable_vol`) may produce values outside -50/+50, suitable for volatility-focused strategies.
- For price chart overlay, publish this script and use its ID in the companion script’s `request.security` call.
- Adjust scaling inputs in the companion script for optimal visualization on volatile or stable assets.
**Author’s Note**
Developed by NEPOLIX, this indicator combines volume-weighted precision with flexible normalization for robust technical analysis. Feedback and suggestions are welcome to enhance future versions!

Universal Gann Square & Cube LevelsUniversal Gann Square & Cube Levels - Dynamic Support/Resistance
Description:
📊 UNIVERSAL GANN LEVELS INDICATOR
This powerful indicator automatically plots Gann Square and Cube levels around the current stock price, providing dynamic support and resistance levels based on W.D. Gann's mathematical theories.
🎯 KEY FEATURES:
✅ Auto-Adaptive: Works for ANY stock price (₹20 to ₹100,000+)
✅ Real-time Detection: Uses current close price automatically
✅ Dual Level System: Square levels (black) + Cube levels (red)
✅ Customizable Range: Adjust percentage range (5% to 50%)
✅ Clean Display: Toggle square/cube lines independently
✅ Universal Compatibility: Works on all timeframes and instruments
📈 HOW IT WORKS:
Square Levels (Black Lines): Based on perfect squares (n²) around current price
Cube Levels (Red Lines): Based on perfect cubes (n³) around current price
Smart Range: Automatically calculates relevant levels within your specified percentage range
Info Display: Shows current price and level counts
⚙️ SETTINGS:
Price Range %: Control how many levels appear (default: 15%)
Show Square Levels: Toggle black square lines on/off
Show Cube Levels: Toggle red cube lines on/off
🔥 PERFECT FOR:
Day traders seeking precise entry/exit points
Swing traders identifying key support/resistance zones
Gann theory practitioners and students
Multi-timeframe analysis across all instruments
💡 USAGE TIPS:
Use 10-20% range for active day trading
Use 30-50% range for swing trading analysis
Watch for price reactions at square/cube intersections
Combine with volume analysis for confirmation
🌟 WHY THIS INDICATOR?
Unlike fixed Gann calculators, this indicator dynamically adapts to ANY price level, making it truly universal for Indian stocks, crypto, forex, and commodities.
⚠️ DISCLAIMER:
This indicator is for educational and informational purposes only. It is not financial advice and should not be considered as a recommendation to buy or sell any security. Trading involves significant risk of loss and may not be suitable for all investors. Past performance does not guarantee future results. Always conduct your own research and consult with a qualified financial advisor before making any investment decisions. The developer assumes no responsibility for any trading losses incurred through the use of this indicator.
📋 COMPATIBILITY:
All TradingView plans
All timeframes (1m to 1M)
Stocks, Crypto, Forex, Commodities
Mobile and desktop platforms

RMA EMA Crossover | MisinkoMasterThe RMA EMA Crossover (REMAC) is a trend-following overlay indicator designed to detect shifts in market momentum using the interaction between a smoothed RMA (Relative Moving Average) and its EMA (Exponential Moving Average) counterpart.
This combination provides fast, adaptive signals while reducing noise, making it suitable for a wide range of markets and timeframes.
🔎 Methodology
RMA Calculation
The Relative Moving Average (RMA) is calculated over the user-defined length.
RMA is a type of smoothed moving average that reacts more gradually than a standard EMA, providing a stable baseline.
EMA of RMA
An Exponential Moving Average (EMA) is then applied to the RMA, creating a dual-layer moving average system.
This combination amplifies trend signals while reducing false crossovers.
Trend Detection (Crossover Logic)
Bullish Signal (Trend Up) → When RMA crosses above EMA.
Bearish Signal (Trend Down) → When EMA crosses above RMA.
This simple crossover system identifies the direction of momentum shifts efficiently.
📈 Visualization
RMA and EMA are plotted directly on the chart.
Colors adapt dynamically to the current trend:
Cyan / Green hues → RMA above EMA (bullish momentum).
Magenta / Red hues → EMA above RMA (bearish momentum).
Filled areas between the two lines highlight zones of trend alignment or divergence, making it easier to spot reversals at a glance.
⚡ Features
Adjustable length parameter for RMA and EMA.
Overlay format allows for direct integration with price charts.
Visual trend scoring via color and fill for rapid assessment.
Works well across all asset classes: crypto, forex, stocks, indices.
✅ Use Cases
Trend Following → Stay on the right side of the market by following momentum shifts.
Reversal Detection → Crossovers highlight early trend changes.
Filter for Trading Systems → Use as a confirmation overlay for other indicators or strategies.
Visual Market Insight → Filled zones provide immediate context for trend strength.