Price Level Highlighter [ldlwtrades]This indicator is a minimalist and highly effective tool designed for traders who incorporate institutional concepts into their analysis. It automates the identification of key psychological price levels and adds a unique, dynamic layer of information to help you focus on the most relevant area of the market. Inspired by core principles of market structure and liquidity, it serves as a powerful visual guide for anticipating potential support and resistance.
The core idea is simple: specific price points, particularly those ending in round numbers or common increments, often act as magnets or barriers for price. While many indicators simply plot static lines, this tool goes further by intelligently highlighting the single most significant level in real-time. This dynamic feature allows you to quickly pinpoint where the market is currently engaged, offering a clear reference point for your trading decisions. It reduces chart clutter and enhances your focus on the immediate price action.
Features
Customizable Price Range: Easily define a specific Start Price and End Price to focus the indicator on the most relevant area of your chart, preventing unnecessary clutter.
Adjustable Increment: Change the interval of the lines to suit your trading style, from high-frequency increments (e.g., 10 points) for scalping to wider intervals (e.g., 50 or 100 points) for swing trading.
Intelligent Highlighting: A key feature that automatically identifies and highlights the single horizontal line closest to the current market price with a distinct color and thickness. This gives you an immediate visual cue for the most relevant price level.
Highly Customizabile: Adjust the line color, style, and width for both the main lines and the highlighted line to fit your personal chart aesthetic.
Usage
Apply the indicator to your chart.
In the settings, input your desired price range (Start Price and End Price) to match the market you are trading.
Set the Price Increment to your preferred density.
Monitor the chart for the highlighted line. This is your active price level and a key area of interest.
Combine this tool with other confirmation signals (e.g., order blocks, fair value gaps, liquidity pools) to build higher-probability trade setups.
Best Practices
Pairing: This tool is effective across all markets, including stocks, forex, indices, and crypto. It is particularly useful for volatile markets where price moves rapidly between psychological levels.
Mindful Analysis: Use the highlighted level as a reference point for your analysis, not as a standalone signal. A break above or below this level can signify a shift in market control.
Backtesting: Always backtest the indicator on your preferred market and timeframe to understand how it performs under different conditions.
在脚本中搜索"forex"

Apex Edge Sentinel - Stop Loss HUDApex Edge – ATR Sentinel Stop Loss HUD
The Apex Edge – ATR Sentinel is a complete stop-loss intelligence system built as a clean, always-on HUD.
It delivers institutional-level risk guidance by calculating and displaying live ATR-based stop levels for both long and short trades at multiple risk tolerances.
Forget cluttered charts and repainting lines — Sentinel gives you a clear stop-loss reference panel that updates dynamically with every bar.
✅ Features
• Triple ATR Multipliers
User-defined (e.g. x1.5 / x2.0 / x2.5). Compare tight, medium, and wide stops instantly.
• Dual-Side SL Levels
Both Long and Short safe stop prices displayed side by side. No more guessing trend
bias.
• ATR Transparency
HUD shows ATR(length) so you always know the calculation basis. Default = 14, adjustable
to your style.
• ATR Regime Meter
Detects volatility conditions (LOW / NORMAL / HIGH) by comparing ATR to its SMA. Helps
you avoid over-tight stops in high-volatility markets.
• Tick-Aware Rounding
Stop levels auto-rounded to the instrument’s tick size (Gold = 0.10, FX = 0.0001, indices =
whole points).
Custom HUD Design
• Location: Top/Bottom, Left/Right
• Sizes: Compact / Medium / Large (desktop or mobile)
• Opacity control (25% default Apex styling)
How to Use
1. Load Sentinel on your chart.
2. Check the HUD:
• ATR(14): 2.6 → base volatility measure.
• x1.5 / x2.0 / x2.5 → instant SL levels for both long & short trades.
3. Before entering a trade → decide which multiplier matches your style (tight scalper vs wider swing).
4. Manually place your SL at the level displayed in the HUD.
Sentinel works as both:
• A pre-trade check (is ATR stop too wide for my RR?).
• A live risk compass (updated stop levels every bar).
Why Apex Sentinel?
Most ATR stop indicators clutter charts with lagging lines or repainting trails. Sentinel strips it back to what matters:
• The numbers.
• The risk levels.
• The context.
It’s a pure stop-loss HUD, designed for serious traders who want clarity, discipline, and instant reference points across any market or timeframe.
Notes
• This is a HUD-only system (no automatic SL line). Traders manually apply the SL level
shown in the panel.
• Defaults: ATR(14), multipliers 1.5 / 2.0 / 2.5. Adjust to your trading style.
• Best used on intraday pairs like XAUUSD, EURUSD, indices, but works universally.
Apex Edge Philosophy: Clean. Smart. Institutional.
No clutter. No gimmicks. Just precision tools for modern markets.

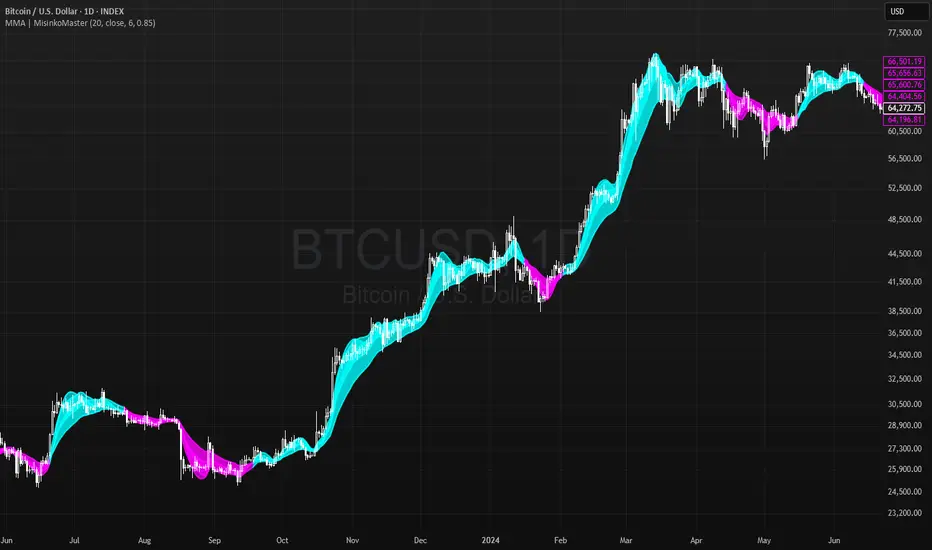
Momentum Moving Averages | MisinkoMasterThe Momentum Moving Averages (MMA) indicator blends multiple moving averages into a single momentum-scoring framework, helping traders identify whether market conditions are favoring upside momentum or downside momentum.
By comparing faster, more adaptive moving averages (DEMA, TEMA, ALMA, HMA) against a baseline EMA, the MMA produces a cumulative score that reflects the prevailing strength and direction of the trend.
🔎 Methodology
Moving Averages Used
EMA (Exponential Moving Average) → Baseline reference.
DEMA (Double Exponential Moving Average) → Reacts faster than EMA.
TEMA (Triple Exponential Moving Average) → Even faster, reduces lag further.
ALMA (Arnaud Legoux Moving Average) → Smooth but adaptive, with adjustable σ and offset.
HMA (Hull Moving Average) → Very responsive, reduces lag, ideal for momentum shifts.
Scoring System
Each comparison is made against the EMA baseline:
If another MA is above EMA → +1 point.
If another MA is below EMA → -1 point.
The total score reflects overall momentum:
Positive score → Bullish bias.
Negative score → Bearish bias.
Trend Logic
Bullish Signal → When the score crosses above 0.1.
Bearish Signal → When the score crosses below -0.1.
Neutral or sideways trends are identified when the score remains between thresholds.
📈 Visualization
All five moving averages are plotted on the chart.
Colors adapt to the current score:
Cyan (Bullish bias) → Positive momentum.
Magenta (Bearish bias) → Negative momentum.
Overlapping fills between MAs highlight zones of convergence/divergence, making momentum shifts visually clear.
⚡ Features
Adjustable length parameter for all MAs.
Adjustable ALMA parameters (sigma and offset).
Cumulative momentum score system to filter false signals.
Works across all markets (crypto, forex, stocks, indices).
Overlay design for direct chart integration.
✅ Use Cases
Trend Confirmation → Ensure alignment with market momentum.
Momentum Shifts → Spot when faster MAs consistently outperform the baseline EMA.
Entry & Exit Filter → Avoid trades when the score is neutral or indecisive.
Divergence Visualizer → Filled zones make it easier to see when MAs begin separating or converging.
Low History Required → Unlike most For Loops, this script does not require that much history, making it less lagging and more responsive
⚠️ Limitations
Works best in trending conditions; performance decreases in sideways/choppy ranges.
Sensitivity of signals depends on chosen length and ALMA settings.
Should not be used as a standalone buy/sell system—combine with volume, structure, or higher timeframe analysis.
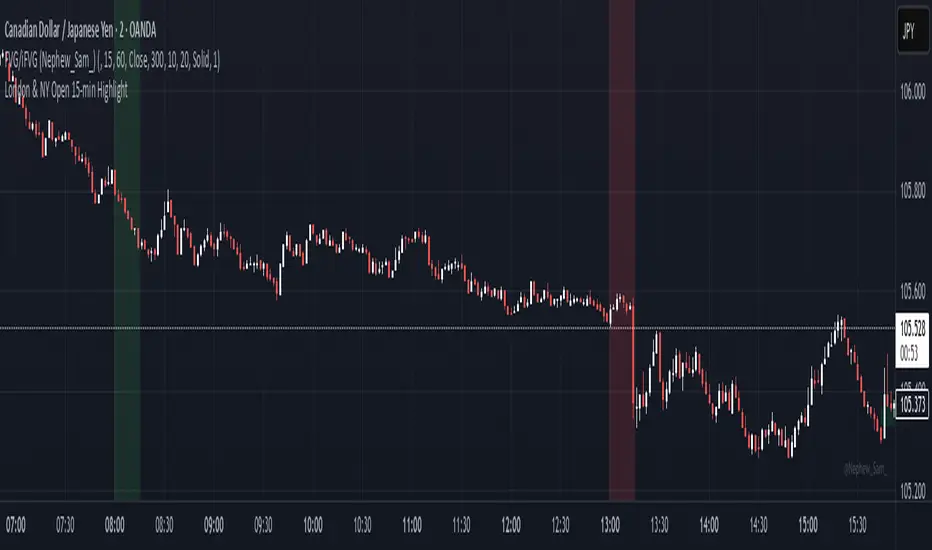
8am–11am HighlightUsed mostly for Forex markets as indicator when the price goes above or below the levels between London session - waiting for reversal & extra confirmation before entering trade.
SMC BOS - Structure Breaks & Median Continuation ProjectionsThis tool shows what usually happens after a Break of Structure (BOS).
It scans past BOS events on your chart, finds the ones most similar to the latest break (using ATR to filter by volatility), and then plots the median continuation path.
Optional percentile bands (P10–P90) display the possible range of outcomes around the median.
Key features:
• Automatic detection of bullish and bearish BOS events
• Library of past BOS with adjustable size and spacing
• ATR-based similarity and recency weighting
• Median continuation projections with optional percentile bands
• Customizable colors, signals, and stats table
• Works on any market and timeframe
Use cases:
• See how price typically behaves after a BOS
• Support SMC analysis with data-driven projections
• Improve trade planning by visualizing likely continuations
• Apply across crypto, forex, stocks, and futures
Originality:
Instead of only marking BOS, this script learns from history and projects forward the median path of the most similar past cases, adjusted for volatility. It turns BOS signals into practical continuation scenarios.
Instructions:
Add the indicator to your chart. When a BOS is detected, the projection is drawn automatically.
Use the settings to adjust the library, ATR weighting, projection style, percentile bands, and the display of signals or stats.
For questions or customization, contact Julien Eche (Julien_Eche) on TradingView.

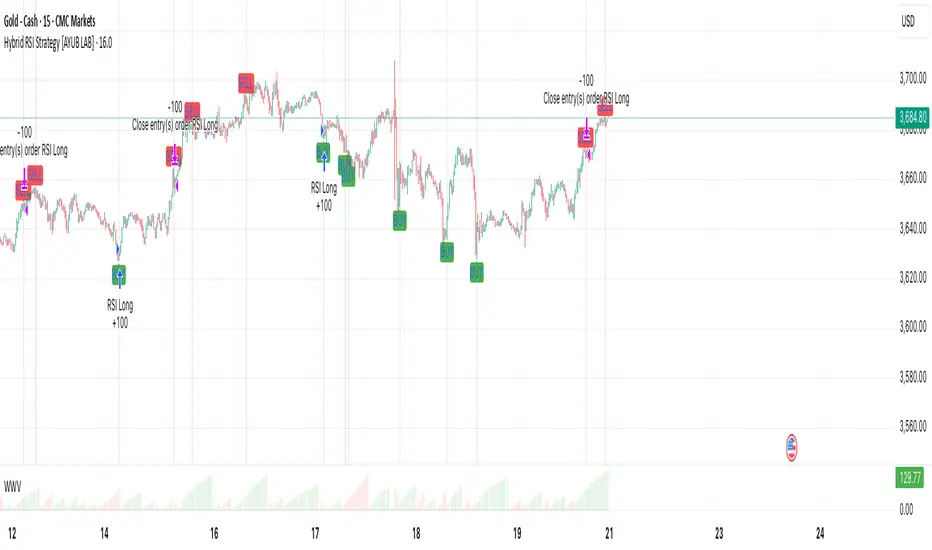
Hybrid RSI Strategy [Heifereum ]This is a hybrid script that combines visual RSI indicator signals with an optional backtestable trading strategy.
BUY Entry: When RSI crosses above the oversold level (default 30)
SELL Exit: When RSI crosses below the overbought level (default 70)
Timeframe: Works best on trending assets (crypto, forex, indices) in 5min to 1H
Backtest Toggle: Turn ON/OFF live testing using the Enable Backtest Mode? setting
Visual Cues: Buy/Sell labels, background coloring, and alerts ready for webhook automation
Use this strategy to visually explore RSI dynamics, run performance backtests, or hook up to external bots via alerts.
EMA50 + SR Boxes + VP Right + ATR + SL% + Entries + SentimentThis indicator combines several pro-grade building blocks to read the market at a glance:
EMA50 as a trend filter.
Smart Support/Resistance zones (rectangles) detected where price has touched multiple times.
“U / Inverted U” markers (confirmed pivots).
Optional Buy/Sell signals: only when a U appears inside a support zone with price above the EMA50 (buy), or an inverted U inside a resistance zone with price below the EMA50 (sell).
Simplified right-side Volume Profile (with a special Forex fallback if volume isn’t usable).
ATR & SL%: displays current ATR and an SL% based on ATR(100) Daily / Close × 100, attached to the latest candle.

ARO Pro — Adaptive Regime OscillatorARO Pro — Adaptive Regime Oscillator (v6)
ARO Pro turns your chart into a context-aware decision system. It classifies every bar as Trending (up or down) or Ranging in real time, then switches its math to match the regime: trend strength is measured with an ATR-normalized EMA spread, while range behavior is tracked with a center-based RSI oscillator. The result is cleaner entries, fewer false signals, and faster reads on regime shifts—without repainting.
⸻
How it works (under the hood)
1. Regime Detection (Kaufman ER):
ARO computes Kaufman’s Efficiency Ratio (ER) over a user-defined length.
- ER > threshold → Trending (direction from EMA fast vs. EMA slow)
- ER ≤ threshold → Ranging
2. Adaptive Oscillator Core:
- Trend mode: (EMA(fast) − EMA(slow)) / ATR * 100 → momentum normalized by volatility.
- Range mode: RSI(length) − 50 → mean-reversion pressure around zero.
3. Volatility Filter (optional):
Blocks signals if ATR as % of price is below a floor you set. This reduces noise in thin or quiet markets.
4. MTF Trend Filter (optional & non-repainting):
Confirms signals only if a higher timeframe EMA(fast) > EMA(slow) for longs (or < for shorts). Implemented with lookahead_off and gaps_on.
5. Confirmation & Alerts:
Signals are locked only on bar close (barstate.isconfirmed) and offered via three alert types: ARO Long, ARO Short, ARO Regime Shift.
⸻
What you see on the chart
• Background heat:
• Green = Trending Up, Red = Trending Down, Gray = Range.
• ARO line (panel): Adaptive oscillator (trend/value colors).
• Signal markers: ▲ Long / ▼ Short on confirmed bars.
• Guide lines: Upper/Lower thresholds (±K) and zero line.
• Info Panel (table): Regime, ER, ATR %, ARO, HTF status (OK/BLOCK/OFF), and a Confidence light.
• Debug Overlay (optional): Quick view of thresholds and raw conditions for tuning.
⸻
Inputs (quick reference)
• Signals: Fast/Slow EMA, RSI length, ER length & threshold, oscillator smoothing, signal threshold.
• Filters: ATR length, minimum ATR% (volatility floor), toggle for volatility filter.
• Visuals: Background on/off, Info Panel on/off, Debug overlay on/off.
• MTF (safe): Toggle + HTF timeframe (e.g., 240, D, W).
⸻
Interpreting signals
• Long: Trend regime AND fast EMA > slow EMA AND ARO ≥ +threshold (confirmed bar, filters passing).
• Short: Trend regime AND fast EMA < slow EMA AND ARO ≤ −threshold (confirmed bar, filters passing).
• Regime Shift: Alert when ER moves the market from Range → Trend or flips trend direction.
⸻
Practical use cases & examples
1) Intraday momentum alignment (scalps to day trades)
• Timeframes: 5–15m with HTF filter = 4H.
• Flow:
1. Wait for Trend Up background + HTF OK.
2. Enter on ▲ Long when ARO crosses above +threshold.
3. Stops: 1–1.5× ATR(14) below trigger bar or below last micro swing.
4. Exits: Partial at 1× ATR, trail remainder with an ATR stop or when ARO reverts to zero/Regime Shift.
• Why it works: You’re trading with the dominant higher-timeframe structure while avoiding low-volatility fakeouts.
2) Swing trend following (cleaner trend legs)
• Timeframes: 1H–4H with HTF filter = 1D.
• Flow:
1. Only act in Trend background aligned with HTF.
2. Add on subsequent ▲ signals as ARO maintains positive (or negative) territory.
3. Reduce or exit on Regime Shift (Trend → Range or direction flip) or when ARO crosses back through zero.
• Stops/targets: Initial 1.5–2× ATR; move to breakeven once the trade gains 1× ATR; trail with a multiple-ATR or structure lows/highs.
3) Range tactics (fade the extremes)
• Timeframes: 15m–1H or 1D on mean-reverting names.
• Flow:
1. Act only when background = Range.
2. Fade moves when ARO swings from ±extremes back toward zero near well-defined S/R.
3. Exit at the opposite band or zero line; abort if a Regime Shift to Trend occurs.
• Tip: Increase ER threshold (e.g., 0.35–0.40) to label more bars as Range on choppy instruments.
4) Event days & macro filters
• Approach: Raise the volatility floor (Min ATR%) on macro days (FOMC, CPI).
• Effect: You’ll ignore “fake” micro swings in the minutes leading up to releases and catch only post-event confirmed momentum.
⸻
Parameter tuning guide
• ER Threshold:
• Lower (0.20–0.30) = more Trend bars, more signals, higher noise.
• Higher (0.35–0.45) = stricter trend confirmation, fewer but cleaner signals.
• Signal Threshold (±K):
• Raise to reduce whipsaws; lower for earlier but noisier triggers.
• Volatility Floor (ATR%):
• Thin/quiet assets benefit from a higher floor (e.g., 0.3–0.6).
• Highly liquid futures/forex can work with lower floors.
• HTF Filter:
• Keep it ON when you want higher win consistency; turn OFF for tactical counter-trend plays.
⸻
Alerts (recommended setup)
• “ARO Long” / “ARO Short”: Entry-style alerts on confirmed signals.
• “ARO Regime Shift”: Context alert to scale in/out or switch playbooks (trend vs. range).
All alerts are non-repainting and fire only when the bar closes.
⸻
Best practices & combinations
• Price action & S/R: Use ARO to define when to engage, and price structure to define where (breakout levels, pullback zones).
• VWAP/Session tools: In intraday trends, ▲ signals above VWAP tend to carry; avoid shorts below session VWAP in strong downtrends.
• Risk first: Size by ATR; never let a single ARO event override your max risk per trade.
• Portfolio filter: On indices/ETFs, enable HTF filter and a stricter ER threshold to ride regime legs.
⸻
Non-repaint and implementation notes
• The script does not repaint:
• Signals are computed and locked on bar close (barstate.isconfirmed).
• All higher-timeframe data uses request.security(..., lookahead_off, gaps_on).
• No future indexing or negative offsets are used.
• The Info Panel and Debug overlay are purely visual aids and do not change signal logic.
⸻
Limitations & tips
• Chop sensitivity: In hyper-choppy symbols, consider raising ER threshold and the signal threshold, and enable HTF filter.
• Instrument personality: EMAs/RSI lengths and volatility floor often need a quick 2–3 minute tune per asset class (FX vs. crypto vs. equities).
• No guarantees: ARO improves context and timing, but it is not a promise of profitability—always combine with risk management.
⸻
Quick start (TL;DR)
1. Timeframes: 5–15m intraday (HTF = 4H); 1H–4H swing (HTF = 1D).
2. Use defaults, then tune ER threshold (0.25–0.40) and Signal threshold (±20).
3. Enable Volatility Floor (e.g., 0.2–0.5 ATR%) on quiet assets.
4. Trade ▲ / ▼ only in matching Trend background; fade extremes only in Range background.
5. Set alerts for Long, Short, and Regime Shift; manage risk with ATR stops.
⸻
Author’s note: ARO Pro is designed to be clear, adaptive, and operational out of the box. If you publish variants (e.g., different ER logic, alternative trend cores), please credit the original and document any changes so users can compare behavior reliably.

Fiery River Torgi### Description of the "Fiery River" (FR) Indicator
**Overview of the Indicator**
"Fiery River" (abbreviated as FR, with variants like "FR-Torg") is a technical indicator for TradingView, written in Pine Script version 6. It combines Fibonacci levels with exponential moving averages (EMAs) and standard deviations to dynamically plot support and resistance zones on price charts. The indicator calculates "effective close" prices based on candlestick bodies for better volatility representation, then derives levels using custom Fibonacci multipliers applied to deviations from the EMA midline. It supports multi-timeframe analysis by incorporating a secondary timeframe, making it ideal for traders analyzing trends, reversals, and extensions in various markets like forex or crypto. The name evokes a "fiery" stream of adaptive levels flowing across the chart. 🔥
**Key Features**
- **Level Construction**: Uses an EMA of the "effective close" price (derived from open/close max/min) and standard deviation to create a midline. Fibonacci levels are calculated by multiplying deviations with coefficients (e.g., 1.55, 1.89, 0.89), resulting in "long" and "short" lines. It plots 9 lines total: 5 for the primary timeframe (green, red, gray, black for shorts, and a midline) and 4 for the secondary timeframe (with transparency for distinction).
- **Color Scheme**: Green for weaker levels, red for stronger, gray for mid-range, and black for shorts/extensions.
- **Fills**: Adds green fills between level pairs to highlight potential trading zones, enhancing visual clarity.
- **Alerts**: Automatic notifications trigger when the price touches specific levels (e.g., "FM-Torgi green!" for the first green line), helping with timely signals.
- **Multi-Timeframe Support**: Pulls data from a secondary timeframe (e.g., daily while main is hourly) using `request.security`, allowing comparison across scales.
- **Customization**: Inputs for EMA periods (default 89), secondary timeframe, and multipliers for flexibility.
**How to Use**
1. Add the indicator to your TradingView chart via the "Indicators" menu.
2. Configure settings: Set EMA periods, choose a secondary timeframe (e.g., 'D' for daily), and adjust Fibonacci multipliers if needed.
3. Interpret levels: Use green/red zones for entries/exits, gray for mid-support, and shorts for extensions. Fills indicate high-probability areas.
4. Enable alerts for real-time notifications on level touches.
Best combined with other tools like RSI or volume for confirmation. It's suited for swing trading or scalping on volatile assets. 📈
**Advantages and Limitations**
- **Pros**: Highly adaptive to price movements, customizable, visually intuitive with fills and multi-timeframe depth. Efficient for identifying Fibonacci-based zones without manual drawing.
- **Cons**: Can clutter the chart with many lines if not managed; requires testing on different symbols as hardcoded multipliers may not fit all markets perfectly. Potential for false signals in sideways markets.
If you'd like me to expand on the code, suggest modifications, or provide examples, let me know! 😊

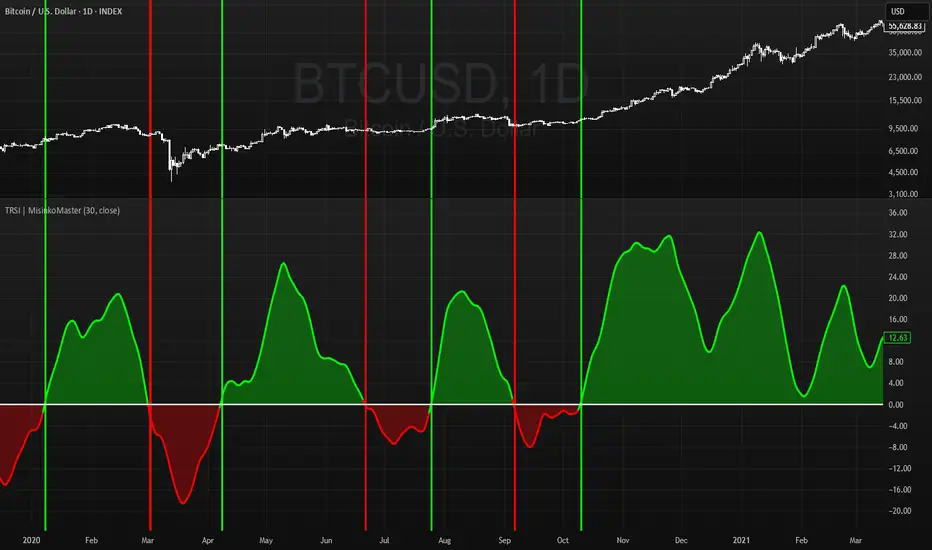
Triple RSI | MisinkoMasterThe Triple RSI (TRSI) is an advanced trend-following oscillator designed to capture trend reversals with speed and smoothness, combining concepts from traditional RSI, multi-timeframe momentum analysis, and layered moving average smoothing.
By blending multiple RSI lengths and applying a unique smoothing sequence, the TRSI creates a fast, momentum-driven RSI oscillator that reduces noise without sacrificing responsiveness.
🔎 Methodology
The indicator is built in three main steps:
Multi-Length RSI Calculation
Three RSIs are calculated using different lengths derived from the user’s input n:
RSI(√n) → very fast, highly responsive.
RSI(n/2) → moderately fast.
RSI(n) → slower, more stable baseline.
Each RSI is normalized by subtracting 50, centering values around zero.
Triple RSI Formula
The three RSIs are combined into the base formula:
TRSI=RSI(√n)+RSI(n/2)−RSI(n)
TRSI=RSI(√n)+RSI(n/2)−RSI(n)
This subtracts the slower RSI from the faster ones, boosting responsiveness and making the TRSI more momentum-oriented than a standard RSI.
Layered Smoothing
The raw TRSI is smoothed in three steps:
RMA(n/2)
RMA(√n)
HMA(√n)
This sequence balances stability and speed:
RMA provides consistency and reduces false noise.
HMA adds responsiveness and precision.
The result is a smooth yet reactive oscillator, optimized for reversal detection.
📈 Trend Classification
The TRSI offers three ways to interpret trend direction:
Oscillator Values
Above 0 → Bullish (uptrend).
Below 0 → Bearish (downtrend).
Oscillator Colors
Green TRSI line → Positive momentum.
Red TRSI line → Negative momentum.
Background Colors
Green background flash → Reversal into bullish trend.
Red background flash → Reversal into bearish trend.
This makes it easy to scan past price history and quickly identify turning points.
🎨 Visualization
TRSI line plotted with dynamic coloring (green/red).
Filled area between TRSI and zero-line reflects momentum bias.
Background flashes highlight trend reversal points, adding context and clarity for visual traders.
⚡ Features
Adjustable length parameter (n).
Dynamic use of √n and n/2 for multi-speed RSI blending.
Built-in smoothing with 2× RMA + 1× HMA.
Multiple trend detection methods (value, color, background).
Works across all assets and timeframes (crypto, forex, stocks, indices).
✅ Use Cases
Reversal Detection → Catch early shifts in trend direction.
Trend Confirmation → Stay aligned with momentum.
Momentum Filter → Avoid counter-trend trades in trending markets.
Historical Analysis → Quickly scan past reversals via background coloring.
⚠️ Limitations
As with all oscillators, TRSI may give false signals in sideways/choppy markets.
Optimal sensitivity depends on asset volatility → adjust n for best results.
It is not a standalone system and should be combined with other tools (trend filters, volume, higher timeframe confluence).
Double Median SD Bands | MisinkoMasterThe Double Median SD Bands (DMSDB) is a trend-following tool designed to capture market direction in a way that balances responsiveness and smoothness, filtering out excessive noise without introducing heavy lag.
Think of it like a house:
A jail (too restrictive) makes you miss opportunities.
No house at all (too unsafe) leaves you exposed to false signals.
DMSDB acts like a comfortable house with windows—protecting you from the noise while still letting you see what’s happening in the market.
🔎 Methodology
The script works in the following steps:
Standard Deviation (SD) Calculation
Computes the standard deviation of the selected price source (ohlc4 by default).
The user can choose whether to use biased (sample) or unbiased (population) standard deviation.
Raw Bands Construction
Upper Band = source + (SD × multiplier)
Lower Band = source - (SD × multiplier)
The multiplier can be adjusted for tighter or looser bands.
First Median Smoothing
Applies a median filter over half of the length (len/2) to both bands.
This reduces noise without creating excessive lag.
Second Median Smoothing
Applies another median filter over √len to the already smoothed bands.
This produces a balance:
Cutting the length → maintains responsiveness.
Median smoothing → reduces whipsaws.
The combination creates a fast yet clean band system ideal for trend detection.
📈 Trend Logic
The trend is detected based on price crossing the smoothed bands:
Long / Bullish (Purple) → when price crosses above the upper band.
Short / Bearish (Gold) → when price crosses below the lower band.
Neutral → when price remains between the bands.
🎨 Visualization
Upper and lower bands are plotted as colored lines.
The area between the bands is filled with a transparent zone that reflects the current bias:
Purple shading = Bullish zone.
Golden shading = Bearish zone.
This creates a visual tunnel for trend confirmation, helping traders quickly identify whether price action is trending or consolidating.
⚡ Features
Adjustable Length parameter (len) for dynamic control.
Adjustable Band Multiplier for volatility adaptation.
Choice between biased vs. unbiased standard deviation.
Double median smoothing for clarity + responsiveness.
Works well on cryptocurrencies (e.g., BTCUSD) but is flexible enough for stocks, forex, and indices.
✅ Use Cases
Trend Following → Ride trends by staying on the correct side of the bands.
Entry Timing → Use crossovers above/below bands for entry triggers.
Filter for Other Strategies → Can serve as a directional filter to avoid trading against the trend.
⚠️ Limitations & Notes
This is a trend-following tool, so it will perform best in trending conditions.
In sideways or choppy markets, whipsaws may still occur (although smoothing reduces them significantly).
The indicator is not a standalone buy/sell system. For best results, combine with volume, momentum, or higher-timeframe confluence.
All of this makes for a really unique & original tool, as it removes noise but keeps good responsitivity, using methods from many different principles which make for a smooth a very useful tool

Bollinger Adaptive Trend Navigator [QuantAlgo]🟢 Overview
The Bollinger Adaptive Trend Navigator synthesizes volatility channel analysis with variable smoothing mechanics to generate trend identification signals. It uses price positioning within Bollinger Band structures to modify moving average responsiveness, while incorporating ATR calculations to establish trend line boundaries that constrain movement during volatile periods. The adaptive nature makes this indicator particularly valuable for traders and investors working across various asset classes including stocks, forex, commodities, and cryptocurrencies, with effectiveness spanning multiple timeframes from intraday scalping to longer-term position analysis.
🟢 How It Works
The core mechanism calculates price position within Bollinger Bands and uses this positioning to create an adaptive smoothing factor:
bbPosition = bbUpper != bbLower ? (source - bbLower) / (bbUpper - bbLower) : 0.5
adaptiveFactor = (bbPosition - 0.5) * 2 * adaptiveMultiplier * bandWidthRatio
alpha = math.max(0.01, math.min(0.5, 2.0 / (bbPeriod + 1) * (1 + math.abs(adaptiveFactor))))
This adaptive coefficient drives an exponential moving average that responds more aggressively when price approaches Bollinger Band extremes:
var float adaptiveTrend = source
adaptiveTrend := alpha * source + (1 - alpha) * nz(adaptiveTrend , source)
finalTrend = 0.7 * adaptiveTrend + 0.3 * smoothedCenter
ATR-based volatility boundaries constrain the final trend line to prevent excessive movement during volatile periods:
volatility = ta.atr(volatilityPeriod)
upperBound = bollingerTrendValue + (volatility * volatilityMultiplier)
lowerBound = bollingerTrendValue - (volatility * volatilityMultiplier)
The trend line direction determines bullish or bearish states through simple slope comparison, with the final output displaying color-coded signals based on the synthesis of Bollinger positioning, adaptive smoothing, and volatility constraints (green = long/buy, red = short/sell).
🟢 Signal Interpretation
Rising Trend Line (Green): Indicates upward direction based on Bollinger positioning and adaptive smoothing = Potential long/buy opportunity
Falling Trend Line (Red): Indicates downward direction based on Bollinger positioning and adaptive smoothing = Potential short/sell opportunity
Built-in Alert System: Automated notifications trigger when bullish or bearish states change, allowing you to act on significant development without constantly monitoring the charts
Candle Coloring: Optional feature applies trend colors to price bars for visual consistency
Configuration Presets: Three parameter sets available - Default (standard settings), Scalping (faster response), and Swing Trading (slower response)

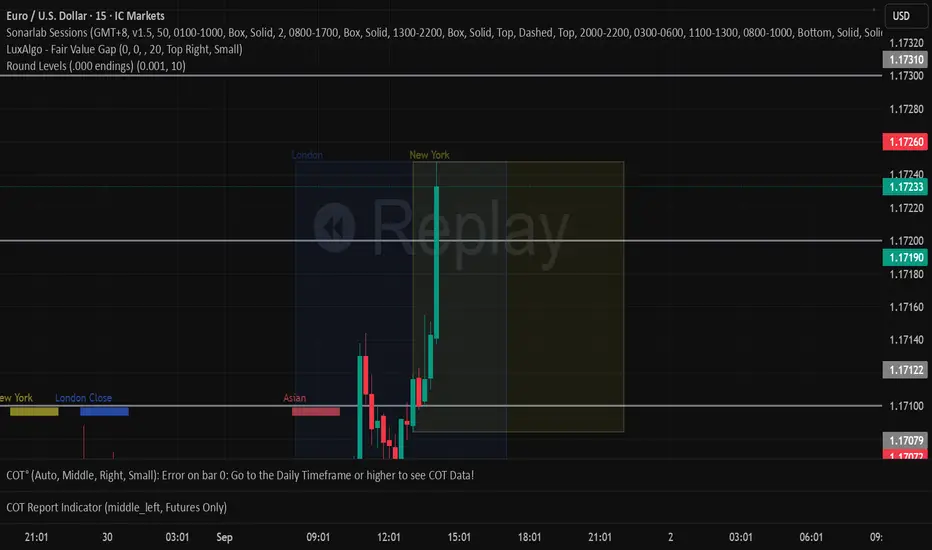
Round Levels (.000 endings)his indicator automatically detects and marks horizontal price levels that end with trailing zeros (psychological round numbers). Examples: 1.17000, 1.16900, 1.16800 etc. These levels often act as strong support or resistance zones because traders and institutions tend to place orders around round numbers.
Features:
Plots horizontal lines at configurable “round” intervals (e.g., .000, .050, .500).
Option to select how many levels above and below current price to display.
Labels each level with its exact price for easy identification.
Helps visualize psychological levels, institutional zones, and round-number trading strategies.
Use Cases:
Spotting potential reversal zones where many traders cluster orders.
Enhancing confluence with other tools (support/resistance, Fibonacci, supply/demand).
Works on all assets (Forex, Stocks, Crypto, Indices) and all timeframes.
FSVZO [Alpha Extract]A sophisticated volume-weighted momentum oscillator that combines Fourier smoothing with Volume Zone Oscillator methodology to deliver institutional-grade flow analysis and divergence detection. Utilizing advanced statistical filtering including ADF trend analysis and multi-dimensional volume dynamics, this indicator provides comprehensive market sentiment assessment through volume-price relationships with extreme zone detection and intelligent divergence recognition for high-probability reversal and continuation signals.
🔶 Advanced VZO Calculation Engine
Implements enhanced Volume Zone Oscillator methodology using relative volume analysis combined with smoothed price changes to create momentum-weighted oscillator values. The system applies exponential smoothing to both volume and price components before calculating positive and negative momentum ratios with trend factor integration for market regime awareness.
🔶 Fourier-Based Smoothing Architecture
Features advanced Fourier approximation smoothing using cosine-weighted calculations to reduce noise while preserving signal integrity. The system applies configurable Fourier length parameters with weighted sum normalization for optimal signal clarity across varying market conditions with enhanced responsiveness to genuine trend changes.
// Fourier Smoothing Algorithm
fourier_smooth(src, length) =>
sum = 0
weightSum = 0
for i = 0 to length - 1
weight = cos(2 * π * i / length)
sum += src * weight
weightSum += weight
sum / weightSum
🔶 Intelligent Divergence Detection System
Implements comprehensive divergence analysis using pivot point methodology with configurable lookback periods for both standard and hidden divergence patterns. The system validates divergence conditions through range analysis and provides visual confirmation through plot lines, labels, and color-coded identification for precise timing analysis.
15MIN
4H
12H
🔶 Flow Momentum Analysis Framework
Calculates flow momentum by measuring oscillator deviation from its exponential moving average, providing secondary confirmation of volume flow dynamics. The system creates momentum-based fills and visual indicators that complement the primary oscillator analysis for comprehensive market flow assessment.
🔶 Extreme Zone Detection Engine
Features sophisticated extreme zone identification at ±98 levels with specialized marker system including white X markers for signals occurring in extreme territory and directional triangles for potential reversal points. The system provides clear visual feedback for overbought/oversold conditions with institutional-level threshold accuracy.
🔶 Dynamic Visual Architecture
Provides advanced visualization engine with bullish/bearish color transitions, dynamic fill regions between oscillator and signal lines, and flow momentum overlay with configurable transparency levels. The system includes flip markers aligned to color junction points for precise signal timing with optional bar close confirmation to prevent repainting.
🔶 ADF Trend Filtering Integration
Incorporates Augmented Dickey-Fuller inspired trend filtering using normalized price statistics to enhance signal quality during trending versus ranging market conditions. The system calculates trend factors based on mean deviation and standard deviation analysis for improved oscillator accuracy across market regimes.
🔶 Comprehensive Alert System
Features intelligent multi-tier alert framework covering bullish/bearish flow detection, extreme zone reversals, and divergence confirmations with customizable message templates. The system provides real-time notifications for critical volume flow changes and structural market shifts with exchange and ticker integration.
🔶 Performance Optimization Framework
Utilizes efficient calculation methods with optimized variable management and configurable smoothing parameters to balance signal quality with computational efficiency. The system includes automatic pivot validation and range checking for consistent performance across extended analysis periods with minimal resource usage.
This indicator delivers sophisticated volume-weighted momentum analysis through advanced Fourier smoothing and comprehensive divergence detection capabilities. Unlike traditional volume oscillators that focus solely on volume patterns, the FSVZO integrates volume dynamics with price momentum and statistical trend filtering to provide institutional-grade flow analysis. The system's combination of extreme zone detection, intelligent divergence recognition, and multi-dimensional visual feedback makes it essential for traders seeking systematic approaches to volume-based market analysis across cryptocurrency, forex, and equity markets with clearly defined reversal and continuation signals.

FU + SMI Validator (Proper FU, 30m)Overview
The FU + SMI Validator is a sophisticated technical analysis indicator designed to detect Proper FU (Fakeouts or Liquidity Sweeps) on the 30-minute timeframe. This tool aims to help traders identify high-probability reversal setups that occur when price briefly breaks key levels (sweeping liquidity), then reverses with momentum confirmation.
Fakeouts are common market events where price action “hunts stops” before reversing direction. Correctly identifying these events can offer excellent entry points with defined risk. This indicator combines price action logic with momentum and volatility filters to provide reliable signals.
Core Concepts
Proper FU (Fakeout) Detection
At its core, the script identifies proper fakeouts by checking if the current bar’s price:
For bullish fakeouts: dips below the previous bar’s low (sweeping stops) and then closes above the previous bar’s high
For bearish fakeouts: spikes above the previous bar’s high and then closes below the previous bar’s low
This ensures that the breakout is a true sweep rather than just a one-sided close.
Optionally, the script can require one additional confirmation bar after the FU, ensuring that the momentum is sustained and reducing false signals.
SMI-style Momentum Validation
To improve the quality of signals, the indicator uses a proxy for the Stochastic Momentum Index (SMI) by calculating the difference between current and past linear regression slopes of price. This momentum check helps ensure that fakeouts occur alongside actual directional strength.
Key points:
Momentum must be increasing in the direction of the FU signal.
Momentum filters can be enabled or disabled based on user preference.
Squeeze Condition to Avoid Low-Volatility Traps
The script includes a volatility filter based on a squeeze-like condition:
It compares Bollinger Bands (BB) and Keltner Channels (KC).
When BB bands contract inside KC bands, the market is in a squeeze state, signaling low volatility.
Fakeouts during squeeze conditions are often unreliable; the script can filter these out to reduce false alarms.
Killzone Session Timing Filter
Recognizing that liquidity and volatility vary by session, this tool supports optional filtering for:
London Killzone: 09:00 to 10:30 (UK time)
New York Killzone: 13:00 to 14:30 (UK time)
Signals only trigger during these high-activity windows if enabled, helping traders focus on periods with the best liquidity and market participation.
Note: For Killzone filtering to work accurately, your TradingView chart must be set to the UK timezone.
Features & Benefits
Robust FU detection ensures the breakout price action is meaningful, reducing noise.
Momentum filter via linear regression slope captures trend strength in a smooth, mathematically sound way.
Low-volatility squeeze avoidance helps reduce false signals in choppy or range-bound markets.
Killzone timing filter focuses your attention on the most liquid and active market hours.
Optional confirmation bar increases signal reliability.
Raw FU markers allow visualization of all detected fakeouts for pattern recognition and manual analysis.
Alerts built-in for both valid buy and sell FU setups, enabling real-time notification and quicker decision-making.
Customization Options
Killzone usage: Enable or disable the session timing filter.
Sessions: Configure London and New York killzone time ranges.
Momentum alignment: Enable or disable momentum filter based on SMI proxy.
Volatility filter: Avoid signals during squeeze or low-volatility conditions.
FU confirmation: Option to require one additional confirming candle after the initial FU.
Squeeze and momentum parameters: Adjust Bollinger Bands length and multiplier, Keltner Channel length and ATR multiplier.
Raw FU markers: Show or hide all detected fakeouts regardless of filters.
How to Use This Indicator
Apply to 30-minute charts for forex pairs, indices, cryptocurrencies, or other instruments.
Set your chart timezone to UK time if using Killzone filters.
Adjust input parameters based on your preferred sessions and risk tolerance.
Look for green “VALID BUY FU” labels below bars for bullish fakeout entries.
Look for red “VALID SELL FU” labels above bars for bearish fakeout entries.
Use the alert system to receive notifications on setups.
Combine with your existing analysis or risk management strategy for entries, stops, and profit targets.
Why Use FU + SMI Validator?
Fakeouts are some of the most lucrative but tricky setups for many traders. Without proper filters, they can lead to false entries and losses. This script integrates price action, momentum, volatility, and session timing into one package, providing a robust tool to spot high-quality fakeout opportunities and improve trading confidence.
Limitations
Requires chart to be set to UK timezone for session filters.
Designed specifically for 30-minute timeframe — performance on other timeframes may vary.
Momentum is a proxy, not a direct SMI calculation.
Like all indicators, best used in conjunction with sound risk management and other analysis tools.
Potential Enhancements
Conversion into a full strategy script for backtesting entries and exits.
Addition of other momentum indicators (RSI, MACD) or volume filters.
Customizable time zones or auto time zone detection.
Multi-timeframe analysis capabilities.
Visual dashboard for summary of signal stats.

Bar Statistics - DELTA/OI/TOTAL/BUY/SELL/LONGS/SHORTSBar Statistics - Advanced Volume & Open Interest Analysis
Overview
The Bar Statistics indicator is a comprehensive analytical tool designed to provide traders with detailed insights into market microstructure through advanced volume analysis, open interest tracking, and market flow detection. This indicator transforms complex market data into easily digestible visual information, displaying six key metrics in customizable colored boxes that update in real-time.
Unlike traditional volume indicators that only show basic volume data, this indicator combines multiple data sources to reveal the underlying forces driving price movement, including volume delta calculations from lower timeframes, open interest changes, and estimated market positioning.
What Makes This Indicator Unique
1. Multi-Timeframe Volume Delta Precision
The indicator utilizes lower timeframe data (default 1-second) to calculate highly accurate volume delta measurements, providing much more precise buy/sell pressure analysis than standard timeframe-based calculations. This approach captures intraday volume dynamics that are often missed by conventional indicators.
2. Real-Time Updates
Unlike many indicators that only update on bar completion, this tool provides live updates for the developing candle, allowing traders to see evolving market conditions as they happen.
3. Market Flow Analysis
The unique "L/S" (Long/Short) metric combines open interest changes with price/volume direction to estimate net market positioning, helping identify when participants are accumulating or distributing positions.
4. Adaptive Visual Intensity
The gradient color system automatically adjusts based on historical context, making it easy to identify when current values are significant relative to recent market activity.
5. Complete Customization
Every aspect of the display can be customized, from the order of metrics to individual color schemes, allowing traders to adapt the tool to their specific analysis needs.
6.All In One Solution
6 Metrics in one indicator no more using 5 different indicators.
Core Features Explained
DELTA (Volume Delta)
What it shows: Net difference between aggressive buy volume and aggressive sell volume
Calculation: Uses lower timeframe data to determine whether each trade was initiated by buyers or sellers
Interpretation:
Positive values indicate aggressive buying pressure
Negative values indicate aggressive selling pressure
Magnitude indicates the strength of directional pressure
OI Δ (Open Interest Change)
What it shows: Change in open interest from the previous bar
Data source: Fetches open interest data using the "_OI" symbol suffix
Interpretation:
Positive values indicate new positions entering the market
Negative values indicate positions being closed
Combined with price direction, reveals market participant behavior
L/S (Net Long/Short Bias)
What it shows: Estimated net change in long vs short market positions
Calculation method: Combines open interest changes with price/volume direction using configurable logic
Scenarios analyzed:
New Longs: Rising OI + Rising Price/Volume = Long position accumulation
Liquidated Longs: Falling OI + Falling Price/Volume = Long position exits
New Shorts: Rising OI + Falling Price/Volume = Short position accumulation
Covered Shorts: Falling OI + Rising Price/Volume = Short position exits
Result: Net bias toward long (positive) or short (negative) market sentiment
TOTAL (Total Volume)
What it shows: Standard volume for the current bar
Purpose: Provides context for other metrics and baseline activity measurement
Enhanced display: Uses gradient intensity based on recent volume history
BUY (Estimated Buy Volume)
What it shows: Estimated aggressive buy volume
Calculation: (Total Volume + Delta) / 2
Use case: Helps quantify the actual buying pressure in monetary/contract terms
SELL (Estimated Sell Volume)
What it shows: Estimated aggressive sell volume
Calculation: (Total Volume - Delta) / 2
Use case: Helps quantify the actual selling pressure in monetary/contract terms
Configuration Options
Timeframe Settings
Custom Timeframe Toggle: Enable/disable custom lower timeframe selection
Timeframe Selection: Choose the precision level for volume delta calculations
Auto-Selection Logic: Automatically selects optimal timeframe based on chart timeframe
Net Positions Calculation
Direction Method: Choose between Price-based or Volume Delta-based direction determination
Value Method: Select between Open Interest Change or Volume for position size calculations
Display Customization
Row Order: Completely customize which metrics appear and in what order (6 positions available)
Color Schemes: Individual color selection for positive/negative values of each metric
Gradient Intensity: Configurable lookback period (10-200 bars) for relative intensity calculations
Visual Elements
Box Format: Clean, professional box display with clear labels
Color Coding: Intuitive color schemes with customizable transparency gradients
Real-time Updates: Live updating for developing candles with historical stability
How to Use This Indicator
For Day Traders
Volume Confirmation: Use DELTA to confirm breakout validity - strong directional moves should show corresponding volume delta
Entry Timing: Watch for volume delta divergences at key levels to time entries
Exit Signals: Monitor when aggressive volume shifts against your position
For Swing Traders
Market Flow: Focus on the L/S metric to identify when participants are accumulating or distributing
Open Interest Analysis: Use OI Δ to confirm whether moves are backed by new money or position adjustments
Trend Validation: Combine multiple metrics to validate trend strength and sustainability
For Scalpers
Real-time Edge: Utilize the live updates to see developing imbalances before bar completion
Quick Decision Making: Focus on DELTA and BUY/SELL for immediate market pressure assessment
Volume Profile: Use TOTAL volume context for optimal entry/exit sizing
Setup Recommendations
Futures Markets: Enable OI tracking and use Volume Delta direction method
Crypto Markets: Focus on DELTA and volume metrics; OI may not be available
Stock Markets: Use Price direction method with volume value calculations
High-Frequency Analysis: Set lower timeframe to 1S for maximum precision
Technical Implementation
Data Accuracy
Utilizes TradingView's ta.requestVolumeDelta() function for precise buy/sell classification
Implements error checking for data availability
Handles missing data gracefully with fallback calculations
Performance Optimization
Efficient array management with configurable lookback periods
Smart box creation and deletion to prevent memory issues
Optimized real-time updates without historical data corruption
Compatibility
Works on all timeframes from seconds to daily
Compatible with futures, forex, crypto, and stock markets
Automatically adjusts calculation methods based on available data
Risk Disclaimers
This indicator is designed for educational and analytical purposes. It provides statistical analysis of market data but does not guarantee trading success. Users should:
Combine with other forms of analysis
Practice proper risk management
Understand that past performance doesn't predict future results
Be aware that volume delta and open interest data quality varies by market and data provider
Conclusion
The Bar Statistics indicator represents a significant advancement in retail trader access to professional-grade market analysis tools. By combining multiple data sources into a single, customizable display, it provides the depth of analysis needed for comprehensive market microstructure understanding while maintaining the simplicity required for effective decision-making.

Grand Master's Candlestick Dominance (ATR Enhanced)### Grand Master's Candlestick Dominance (ATR Enhanced)
**Overview**
Unleash the ancient wisdom of Japanese candlestick charting with a modern twist! This comprehensive Pine Script v5 strategy and indicator scans for over 75 classic and advanced candlestick patterns (bullish, bearish, and neutral), assigning dynamic strength scores (1-10) to each for precise signal filtering. Enhanced with Average True Range (ATR) for volatility-aware body size validation, it dominates the markets by combining timeless pattern recognition with robust confirmation layers. Whether used as a backtestable strategy or visual indicator, it empowers traders to spot high-probability reversals, continuations, and indecision setups with surgical accuracy.
Inspired by Steve Nison's *Japanese Candlestick Charting Techniques*, this tool elevates pattern analysis beyond basics—think Hammers, Engulfing patterns, Morning Stars, and rare gems like Abandoned Baby or Concealing Baby Swallow—all consolidated into intelligent arrays for real-time averaging and prioritization.
**Key Features**
- **Extensive Pattern Library**:
- **Bullish (25+ patterns)**: Hammer (8.0), Bullish Engulfing (10.0), Morning Star (7.0), Three White Soldiers (9.0), Dragonfly Doji (8.0), and more (e.g., Rising Three, Unique Three River Bottom).
- **Bearish (25+ patterns)**: Hanging Man (8.0), Bearish Engulfing (10.0), Evening Star (7.0), Three Black Crows (9.0), Gravestone Doji (8.0), and exotics like Upside Gap Two Crows or Stalled Pattern.
- **Neutral/Indecision (34+ patterns)**: Doji variants (Long-Legged, Four Price), Spinning Tops, Harami Crosses, and multi-bar setups like Upside Tasuki Gap or Advancing Block.
Each pattern includes duration tracking (1-5 bars) and ATR-adjusted body/shadow criteria for relevance in volatile conditions.
- **Smart Confirmation Filters** (All Toggleable):
- **Trend Alignment**: 20-period SMA (customizable) ensures entries align with the prevailing trend; optional higher timeframe (e.g., Daily) MA crossover for multi-timeframe confluence.
- **Support/Resistance (S/R)**: Pivot-based levels with 0.01% tolerance to confirm bounces or breaks.
- **Volume Surge**: 20-period volume MA with 1.5x spike multiplier to validate momentum.
- **ATR Body Sizing**: Filters small bodies (<0.3x ATR) and long bodies (>0.8x ATR) for context-aware pattern reliability.
- **Follow-Through**: Ensures post-pattern confirmation via bullish/bearish closes or closes beyond prior bars.
Minimum average strength (default 7.0) and individual pattern thresholds (5.0) prevent weak signals.
- **Entry & Exit Logic**:
- **Long Entry**: Bullish average strength ≥7.0 (outweighing bearish), uptrend, volume spike, near support, follow-through, and HTF alignment.
- **Short Entry**: Mirror for bearish dominance in downtrends near resistance.
- **Exits**: Bearish/neutral shift, or fixed TP (5%) / SL (2%)—pyramiding disabled, 10% equity sizing.
- Backtest range: Jan 1, 2020 – Dec 31, 2025 (editable). Initial capital: $10,000.
- **Interactive Dashboard** (Top-Right Panel):
Real-time insights including:
- Market phase (e.g., "Bullish Phase (Avg Str: 8.2)"), active pattern (e.g., "BULLISH: Bullish Engulfing (Str: 10.0, Bars: 2)"), and trend status.
- Strength breakdowns (Bull/Bear/Neutral counts & averages).
- Filter status (e.g., "Volume: ✔ Spike", "ATR: Enabled (L:0.8, S:0.3)").
- Backtest stats: Total trades, win rate, streak, and last entry/exit details (price & timestamp).
Toggle mode: Strategy (live trades) or Indicator (signals only).
- **Advanced Alerts** (15+ Toggleable Types):
Set up via TradingView's "Any alert() function call" for bar-close triggers:
- Entry/Exit signals with strength & pattern details.
- Strong patterns (≥2 bullish/bearish), neutral indecision, volume spikes.
- S/R breakouts, HTF reversals, high-confidence singles (≥8.0 strength).
- Conflicting signals, MA crossovers, ATR volatility bursts, multi-bar completions.
Example: "STRONG BULLISH PATTERN detected! Strength: 9.5 | Top Pattern: Three White Soldiers | Trend: Up".
**Customization & Usage Tips**
- **Inputs Groups**: Strategy toggles, confirmations, exits, backtest dates, and 15+ alert switches—all intuitively grouped.
- **Optimization**: Tune min strengths for aggressive (lower) or conservative (higher) trading; enable/disable filters to suit your style (e.g., disable S/R for scalping).
- **Best For**: Forex, stocks, crypto on 1H–Daily charts. Test on historical data to refine TP/SL.
- **Limitations**: No external data installs; relies on built-in TA functions. Patterns are probabilistic—combine with your risk management.
Master the candles like a grandmaster. Deploy on TradingView, backtest relentlessly, and let dominance begin! Questions? Drop a comment.
*Version: 1.0 | Updated: September 2025 | Credits: Built on Pine Script v5 with nods to Nison's timeless techniques.*

Session AnchorsDescription
This indicator highlights the four main global trading sessions — London, New York AM, New York PM, and Asia — as color-coded boxes on the chart. Each session is defined by fixed start/end times (New York time) and dynamically updates with the evolving high and low during that interval. This provides a clear view of how volatility and structure shift as trading activity passes from one region to another.
How to use
• Works on any timeframe.
• Toggle sessions on/off based on your trading hours.
• Observe price behavior as one session closes and another opens.
• Use session boxes as context for liquidity, volatility, and structure analysis.
Originality
This script delivers a clean, customizable visualization of global market hours and session ranges, avoiding extra overlays so traders can isolate session-based behavior without distraction.
⚠️ Disclaimer
This indicator does not generate signals. It provides a structural mapping of global sessions for contextual analysis only.

Simple Technicals Table📊 Simple Technicals Table
🎯 A comprehensive technical analysis dashboard displaying key pivot points and moving averages across multiple timeframes
📋 OVERVIEW
The Simple Technicals Table is a powerful indicator that organizes essential trading data into a clean, customizable table format. It combines Fibonacci-based pivot points with critical moving averages for both daily and weekly timeframes, giving traders instant access to key support/resistance levels and trend information.
Perfect for:
Technical analysts studying multi-timeframe data
Chart readers needing quick reference levels
Market researchers analyzing price patterns
Educational purposes and data visualization
🚀 KEY FEATURES
📊 Dual Timeframe Analysis
Daily (D1) and Weekly (W1) data side-by-side
Real-time updates as market conditions change
Seamless comparison between timeframes
🎯 Fibonacci Pivot Points
R3, R2, R1 : Resistance levels using Fibonacci ratios (38.2%, 61.8%, 100%)
PP : Central pivot point from previous period's data
S1, S2, S3 : Support levels with same methodology
📈 Complete EMA Suite
EMA 10 : Short-term trend identification
EMA 20 : Popular swing trading reference
EMA 50 : Medium-term trend confirmation
EMA 100 : Institutional support/resistance
EMA 200 : Long-term trend determination
📊 Essential Indicators
RSI 14 : Momentum for overbought/oversold conditions
ATR 14 : Volatility measurement for risk management
🎨 Full Customization
9 table positions : Place anywhere on your chart
5 text sizes : Tiny to huge for optimal visibility
Custom colors : Background, headers, and text
Optional pivot lines : Visual weekly levels on chart
⚙️ HOW IT WORKS
Fibonacci Pivot Calculation:
Pivot Point (PP) = (High + Low + Close) / 3
Range = High - Low
Resistance Levels:
R1 = PP + (Range × 0.382)
R2 = PP + (Range × 0.618)
R3 = PP + (Range × 1.000)
Support Levels:
S1 = PP - (Range × 0.382)
S2 = PP - (Range × 0.618)
S3 = PP - (Range × 1.000)
Smart Price Formatting:
< $1: 5 decimal places (crypto-friendly)
$1-$10: 4 decimal places
$10-$100: 3 decimal places
> $100: 2 decimal places
📊 TECHNICAL ANALYSIS APPLICATIONS
⚠️ EDUCATIONAL PURPOSE ONLY
This indicator is designed solely for technical analysis and educational purposes . It provides data visualization to help understand market structure and price relationships.
📈 Data Analysis Uses
Support & Resistance Identification : Visualize Fibonacci-based pivot levels
Trend Analysis : Study EMA relationships and price positioning
Multi-Timeframe Study : Compare daily and weekly technical data
Market Structure : Understand key technical levels and indicators
📚 Educational Benefits
Learn about Fibonacci pivot point calculations
Understand moving average relationships
Study RSI and ATR indicator values
Practice multi-timeframe technical analysis
🔍 Data Visualization Features
Organized table format for easy data reading
Color-coded levels for quick identification
Real-time technical indicator values
Historical data integrity maintained
🛠️ SETUP GUIDE
1. Installation
Search "Simple Technicals Table" in indicators
Add to chart (appears in middle-left by default)
Table displays automatically on any timeframe
2. Customization
Table Position : Choose from 9 locations
Text Size : Adjust for screen resolution
Colors : Match your chart theme
Pivot Lines : Toggle weekly level visualization
3. Optimization Tips
Use larger text on mobile devices
Dark backgrounds work well with light text
Enable pivot lines for visual reference
✅ BEST PRACTICES
Recommended Usage:
Use for technical analysis and educational study only
Combine with other analytical methods for comprehensive analysis
Study multi-timeframe data relationships
Practice understanding technical indicator values
Important Notes:
Levels based on previous period's data
Most effective in trending markets
No repainting - uses confirmed data only
Works on all instruments and timeframes
🔧 TECHNICAL SPECS
Performance:
Pine Script v5 optimized code
Minimal CPU/memory usage
Real-time data updates
No lookahead bias
Compatibility:
All chart types (Candlestick, Bar, Line)
Any instrument (Stocks, Forex, Crypto, etc.)
All timeframes supported
Mobile and desktop friendly
Data Accuracy:
Precise floating-point calculations
Historical data integrity maintained
No future data leakage
📱 DEVICE SUPPORT
✅ Desktop browsers (Chrome, Firefox, Safari, Edge)
✅ TradingView mobile app (iOS/Android)
✅ TradingView desktop application
✅ Light and dark themes
✅ All screen resolutions
📋 VERSION INFO
Version 1.0 - Initial Release
Fibonacci-based pivot calculations
Dual timeframe support (Daily/Weekly)
Complete EMA suite (10, 20, 50, 100, 200)
RSI and ATR indicators
Fully customizable interface
Optional pivot line visualization
Smart price formatting
Mobile-optimized display
⚠️ DISCLAIMER
This indicator is designed for technical analysis, educational and informational purposes ONLY . It provides data visualization and technical calculations to help users understand market structure and price relationships.
⚠️ NOT FOR TRADING DECISIONS
This tool does NOT provide trading signals or investment advice
All data is for analytical and educational purposes only
Users should not base trading decisions solely on this indicator
Always conduct thorough research and analysis before making any financial decisions
📚 Educational Use Only
Use for learning technical analysis concepts
Study market data and indicator relationships
Practice chart reading and data interpretation
Understand mathematical calculations behind technical indicators
The Simple Technicals Table provides technical data visualization to assist in market analysis education. It does not constitute financial advice, trading recommendations, or investment guidance. Users are solely responsible for their own research and decisions.
Author: ToTrieu
Version: 1.0
Category: Technical Analysis / Support & Resistance
License: Open source for educational use
💬 Questions? Comments? Feel free to reach out!

FX % Change TableFX % Change Table
This tool provides currency strength analysis at a glance, allowing traders to instantly identify which currencies are outperforming or underperforming without the need to manually check each pair. It offers decision support for entries and exits by helping traders align their positions with broader strength and weakness trends, such as buying the strongest currency against the weakest. Its versatility makes it suitable for any timeframe, whether used by scalpers or swing traders. Best of all, it delivers these insights in a clean and simple format, presenting complex multi-pair calculations in an easy-to-read visual display.
This tool is especially helpful for traders who incorporate currency strength analysis, correlation checks, or basket trading into their strategy. It reduces time spent flipping through charts and provides a structured overview for smarter trade decisions.
Unlike traditional single-pair indicators, this tool calculates the percentage change between the current and previous higher timeframe closes for a group of forex pairs. You can choose between two curated groups:
• Majors – EURUSD, GBPUSD, USDJPY, USDCHF, AUDUSD, NZDUSD, USDCAD
• Cross Pairs – A wide basket of EUR, GBP, AUD, NZD, CAD, and CHF crosses
For each symbol, the script requests the selected timeframe’s price data, calculates the percentage change from the previous bar’s close, and then displays it in a neatly formatted table. Green highlights strength, red highlights weakness, and gray shows neutrality — making shifts in momentum instantly recognizable.
How to Use
1. Select your timeframe – For example, "60" (1H) to view hourly change, "240" (4H) for broader moves, or "D" for daily strength/weakness.
2. Choose your group – Focus on the Majors for a macro USD view, or switch to Cross Pairs for secondary flows.
3. Position the table – Place it in any corner of your chart (top-left, top-right, bottom-left, bottom-right) to match your workspace.
The table updates dynamically at the close of each bar, ensuring the displayed data always reflects the most recent market movements.

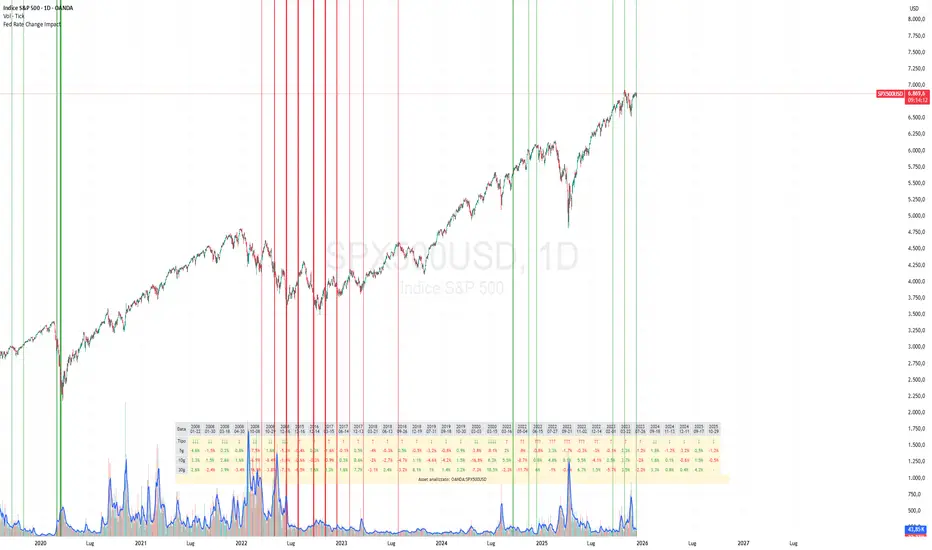
Fed Rate Change Impact📊 Fed Rate Change Impact — Macro Event-Driven Indicator
Fed Rate Change Impact is an advanced indicator designed to analyze the impact of Federal Reserve interest rate changes on financial markets. It integrates event-driven logic with dynamic visualization, percentage diagnostics, and multi-asset selection, offering a clear and customizable view of post-event effects.
🔍 Key Features 📅 Preloaded Fed Events : Includes over 30 historical rate cut (↓) and hike (↑) dates from 2008 to 2024.
📈 Post-Event Analysis : Calculates the percentage change of the selected asset 5, 10, and 30 days after each event.
📌 Vertical Chart Lines : Visually highlights each event directly on the chart, with dynamic coloring (red for hikes, green for cuts).
📋 Diagnostic Table : Displays real-time impact for each event, with color-coded values and a compact layout.
🧠 Interactive Filter: Choose to display only hikes, only cuts, or both.
🧭 Flexible Asset Selection : Analyze the current chart asset, pick from a predefined list, or manually input any ticker via input.symbol().
🎯 Contextual Highlighting : The table highlights the analyzed asset if it matches the active chart symbol.
⚙️ Customizable Parameters lookahead5, lookahead10, lookahead30: Define the time horizon for measuring post-event impact.
eventFilter : Choose which type of events to display.
presetAsset / customAsset : Select or input the asset to analyze.
🧪 Recommended Use Cases Macroeconomic analysis on indices, commodities, crypto, and forex
Studying delayed effects of rate changes on sensitive assets
Building event-driven strategies or diagnostic overlays
Visual backtesting and cross-asset comparison
🧠 Technical Notes The indicator is compatible with overlay=true and works best on Daily timeframe.
The table automatically adapts to the number of events and includes visual padding for improved readability.
All calculations are performed in real time and require no external data.
Phantom Trend IndicatorOverview
The Phantom Trend Indicator (PTI) is a streamlined tool for identifying trend direction and strength. It blends zigzag-based trend detection with a volume profile to display a histogram showing price distance from the Point of Control (POC). Six distinct colors highlight trend states, with background highlights for extreme price zones. Ideal for stocks, forex, crypto, and futures across any timeframe.
Features:
Trend Detection: Uses zigzag fractals to identify uptrends and downtrends.
Histogram Colors: Six colors for trend strength (low, high, extreme for up/down trends) or neutral (gray).
Dynamic Levels: Plots POC, Value Area Low (VAL), and High (VAH) via volume profile.
Background Colors: Highlights overbought (above VAH) or oversold (below VAL) zones.
Alerts: Signals new trends.
How It Works:
Trends: Zigzag fractals define trend ranges, with price position setting histogram colors (low, high, or extreme).
Histogram: Shows price deviation from POC.
Background: Colors extreme zones outside VAL/VAH.
This indicator builds on traditional trend detectors and volume profiles by integrating them into a single, cohesive tool. Unlike standard momentum indicators that rely on moving averages, PTI uses zigzag fractals for more responsive trend identification, reducing lag in volatile markets. Compared to basic volume profile scripts, it adds trend-based color coding and background alerts for extremes, providing clearer visual cues for overbought/oversold conditions. The six distinct colors indicate trend strength, and customizable thresholds allow fine-tuning for different assets and timeframes, enhancing adaptability. Traders benefit from combined momentum and liquidity insights, helping spot reversals or continuations more reliably—making PTI a valuable, standalone addition for both novice and experienced users.
Settings
Trend Detector: Toggle alerts, adjust zigzag sensitivity, and set thresholds for low-to-high and extreme color transitions.
Dynamic Levels: Configure volume profile period, multiplier, accuracy, value area percent, and ATR-based channel width.
Visuals: Customize POC, VAL, VAH, and area fill colors.
Read Histogram: Uptrend colors show early, strong, or overextended moves; downtrend colors indicate early, weakening, or oversold conditions; gray for consolidation.
Background: Monitor for overbought/oversold color-coded signals.
Tune: Adjust zigzag or period settings for your timeframe/asset.
Tips
Shorten period for intraday, extend for swing trading.
Pair with other indicators for confirmation.
Notes:
Requires sufficient chart data for volume profile.
Test settings for low-volatility assets.
For informational use only, not financial advice. Test thoroughly, and happy trading!

Extremum Range MA Crossover Strategy1. Principle of Work & Strategy Logic ⚙️📈
Main idea: The strategy tries to catch the moment of a breakout from a price consolidation range (flat) and the start of a new trend. It combines two key elements:
Moving Average (MA) 📉: Acts as a dynamic support/resistance level and trend filter.
Range Extremes (Range High/Low) 🔺🔻: Define the borders of the recent price channel or consolidation.
The strategy does not attempt to catch absolute tops and bottoms. Instead, it enters an already formed move after the breakout, expecting continuation.
Type: Trend-following, momentum-based.
Timeframes: Works on different TFs (H1, H4, D), but best suited for H4 and higher, where breakouts are more meaningful.
2. Justification of Indicators & Settings ⚙️
A. Moving Average (MA) 📊
Why used: Core of the strategy. It smooths price fluctuations and helps define the trend. The price (via extremes) must cross the MA → signals a potential trend shift or strengthening.
Parameters:
maLength = 20: Default length (≈ one trading month, 20-21 days). Good balance between sensitivity & smoothing.
Lower TF → reduce (10–14).
Higher TF → increase (50).
maSource: Defines price source (default = Close). Alternatives (HL2, HLC3) → smoother, less noisy MA.
maType: Default = EMA (Exponential MA).
Why EMA? Faster reaction to recent price changes vs SMA → useful for breakout strategies.
Other options:
SMA 🟦 – classic, slowest.
WMA 🟨 – weights recent data stronger.
HMA 🟩 – near-zero lag, but “nervous,” more false signals.
DEMA/TEMA 🟧 – even faster & more sensitive than EMA.
VWMA 🔊 – volume-weighted.
ZLEMA ⏱ – reduced lag.
👉 Choice = tradeoff between speed of reaction & false signals.
B. Range Extremes (Previous High/Low) 📏
Why used: Define borders of recent trading range.
prevHigh = local resistance.
prevLow = local support.
Break of these levels on close = trigger.
Parameters:
lookbackPeriod = 5: Searches for highest high / lowest low of last 5 candles. Very recent range.
Higher value (10–20) → wider, stronger ranges but rarer signals.
3. Entry & Exit Rules 🎯
Long signals (BUY) 🟢📈
Condition (longCondition): Previous Low crosses MA from below upwards.
→ Price bounced from the bottom & strong enough to push range border above MA.
Execution: Auto-close short (if any) → open long.
Short signals (SELL) 🔴📉
Condition (shortCondition): Previous High crosses MA from above downwards.
→ Price rejected from the top, upper border failed above MA.
Execution: Auto-close long (if any) → open short.
Exit conditions 🚪
Exit Long (exitLongCondition): Close below prevLow.
→ Uptrend likely ended, range shifts down.
Exit Short (exitShortCondition): Close above prevHigh.
→ Downtrend likely ended, range shifts up.
⚠️ Important: Exit = only on candle close beyond extremes (not just wick).
4. Trading Settings ⚒️
overlay = true → indicators shown on chart.
initial_capital = 10000 💵.
default_qty_type = strategy.cash, default_qty_value = 100 → trades fixed $100 per order (not lots). Can switch to % of equity.
commission_type = strategy.commission.percent, commission_value = 0.1 → default broker fee = 0.1%. Adjust for your broker!
slippage = 3 → slippage = 3 ticks. Adjust to asset liquidity.
currency = USD.
margin_long = 100, margin_short = 100 → no leverage (100% margin).
5. Visualization on Chart 📊
The strategy draws 3 lines:
🔵 MA line (thickness 2).
🔴 Previous High (last N candles).
🟢 Previous Low (last N candles).
Also: entry/exit arrows & equity curve shown in backtest.
Disclaimer ⚠️📌
Risk Warning: This description & code are for educational purposes only. Not financial advice. Trading (Forex, Stocks, Crypto) carries high risk and may lead to full capital loss. You trade at your own risk.
Testing: Always backtest & demo test first. Past results ≠ future profits.
Responsibility: Author of this strategy & description is not responsible for your trading decisions or losses.
