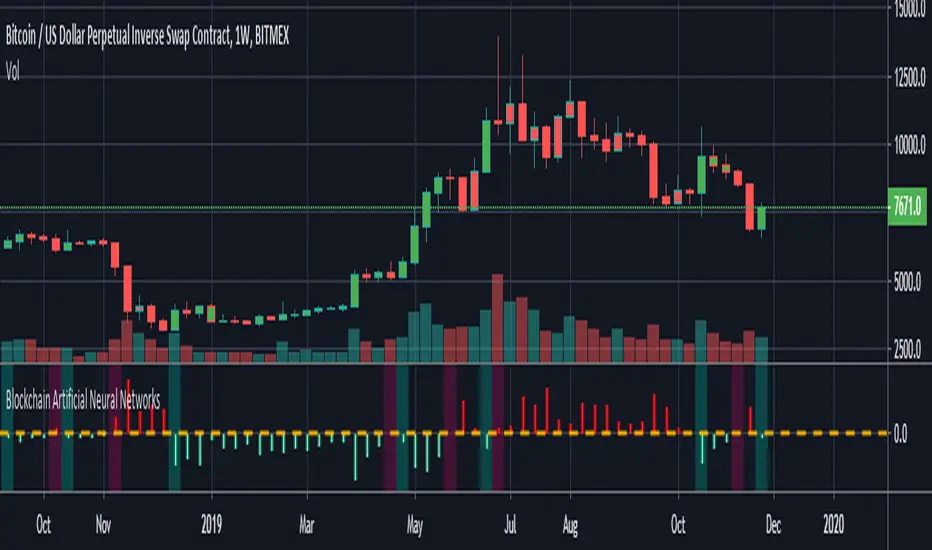
Blockchain Artificial Neural NetworksI found a very high correlation in a research-based Artificial Neural Networks.(ANN)
Trained only on daily bars with blockchain data and Bitcoin closing price.
NOTE: It does not repaint strictly during the weekly time frame. (TF = 1W)
Use only for Bitcoin .
Blockchain data can be repainted in the daily time zone according to the description time.
Alarms are available.
And you can also paint bar colors from the menu by region.
After making reminders, let's share the details of this interesting research:
INPUTS :
1. Average Block Size
2. Api Blockchain Size
3. Miners Revenue
4. Hash Rate
5. Bitcoin Cost Per Transaction
6. Bitcoin USD Exchange Trade Volume
7. Bitcoin Total Number of Transactions
OUTPUTS :
1. One day next price close (Historical)
TRAINING DETAILS :
Learning cycles: 1096436
AutoSave cycles: 100
Grid :
Input columns: 7
Output columns: 1
Excluded columns: 0
Training example rows: 446
Validating example rows: 0
Querying example rows: 0
Excluded example rows: 0
Duplicated example rows: 0
Network :
Input nodes connected: 7
Hidden layer 1 nodes: 5
Hidden layer 2 nodes: 0
Hidden layer 3 nodes: 0
Output nodes: 1
Controls :
Learning rate: 0.1000
Momentum: 0.8000
Target error: 0.0100
Training error: 0.010571
The average training error is really low, almost worth the target.
Without using technical analysis data, we established Artificial Neural Networks with blockchain data.
Interesting!
在脚本中搜索"grid"
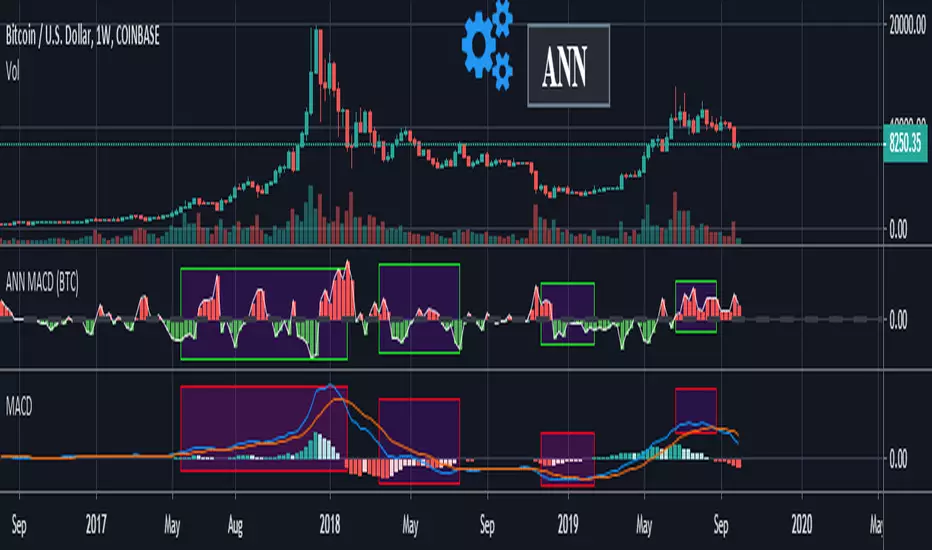
ANN MACD (BTC)
Logic is correct.
But I prefer to say experimental because the sample set is narrow. (300 columns)
Let's start:
6 inputs : Volume Change , Bollinger Low Band chg. , Bollinger Mid Band chg., Bollinger Up Band chg. , RSI change , MACD histogram change.
1 output : Future bar change (Historical)
Training timeframe : 15 mins (Analysis TF > 4 hours (My opinion))
Learning cycles : 337
Training error: 0.009999
Input columns: 6
Output columns: 1
Excluded columns: 0
Grid
Training example rows: 301
Validating example rows: 0
Querying example rows: 0
Excluded example rows: 0
Duplicated example rows: 0
Network
Input nodes connected: 6
Hidden layer 1 nodes: 8
Hidden layer 2 nodes: 0
Hidden layer 3 nodes: 0
Output nodes: 1
Learning rate : 0.6 Momentum : 0.8
More info :
EDIT : This code is open source under the MIT License. If you have any improvements or corrections to suggest, please send me a pull request via the github repository github.com
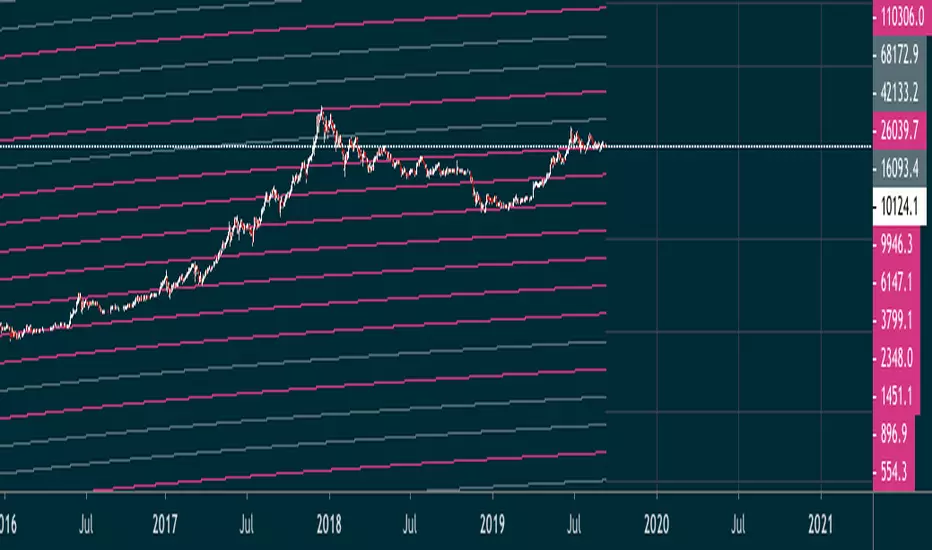

MACD Cross GridShow across all timeframes (15 minute to 1 week) whether MACD has crossed up (blue) or down (orange).

Supertrend Grid 1.0See the current pair's Supertrend direction on 4 different timeframes at once, so you won't get caught with your pants down trading against the trend. Handy for quickly space-barring through a watchlist.
Default settings are (from top to bottom) Daily, 4H, 1H and 15M but these can be changed. Any suggestions, let me know.

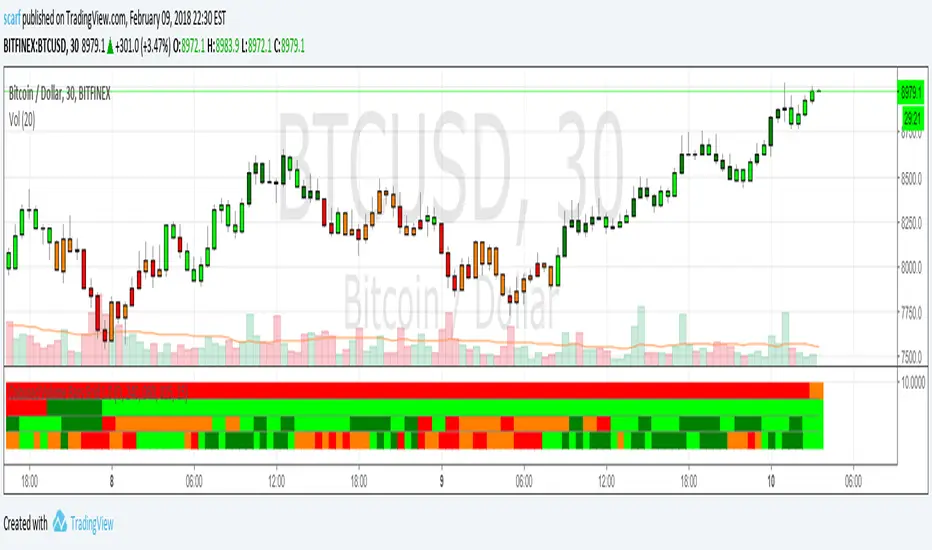
Coloured Volume Grid 1.0Candles are coloured based on relative price and volume:
- If today’s closing price and volume are greater than (n) bars ago, color today’s volume bar green.
- If today’s closing price is greater than (n) bars ago but volume is not, color today’s volume bar lime.
- Similarly, if today’s closing price and volume is less than (n) bars ago, color today’s volume bar orange.
- If today’s closing price is less than (n) bars ago but volume is not, color today’s volume bar red.
The above logic in itself gives pretty remarkable considering how simple the idea is. I have added a multi-timeframe feature where the same logic is applied to 4 other timeframes. This way you can quickly be aware without having to check. There are four layers and the default settings show (from top to bottom) daily, 4h, 1h and 15m
All timeframes are adjustable in the settings.
FXMM Zones TF:M5Observe the price reaction in the zones of supply/demand from multiple timeframes. Original idea from Forex MoneyMap, Dynamic Fibonacci Grid etc.
NOTE: Only for M5 !
