Auto Harmonic Patterns - Open SourceI may not be able to spend much time on the harmonic patterns and realized that there are not much open source scripts on them either. Hence, decided to release open source version which can be used by other developers for reference and build things on top of it.
Original script is protected and can be found here:
Logical ratios of patterns are coded as below:
Notations:
Lines XABCD forms the pattern in all cases. (OXABCD in case of Three drives )
abc = BC retacement of AB, xab = AB retracement of XA and so on
ABCD Classic
0.618 <= abc <= 0.786
1.272 <= bcd <= 1.618
AB=CD
Price difference between AB and CD are equal
Time difference between AB and CD are equal
ABCD Extension
0.618 <= abc <= 0.786
1.272 <= AD/ BC (price) <= 1.618
Gartley
xab = 0.618
0.382 <= abc <= 0.886
1.272 <= bcd <= 1.618 OR xad = 0.786
Crab
0.382 <= xab <= 0.618
0.382 <= abc <= 0.886
2.24 <= bcd <= 3.618 OR xad = 1.618
Deep Crab
xab = 0.886
0.382 <= abc <= 0.886
2.0 <= bcd <= 3.618 OR xad = 1.618
Bat
0.382 <= xab <= 0.50
0.382 <= abc <= 0.886
1.618 <= bcd <= 2.618 OR xad = 0.886
Butterfly
xab = 0.786
0.382 <= abc <= 0.886
1.618 <= bcd <= 2.618 OR 1.272 <= xad <= 2.618
Shark
xab = 0.786
1.13 <= abc <= 1.618
1.618 <= bcd <= 2.24 OR 0.886 <= xad <= 1.13
Cypher
0.382 <= xab <= 0.618
1.13 <= abc <= 1.414
1.272 <= bcd <= 2.0 OR xad = 0.786
Three Drives
oxa = 0.618
1.27 <= xab <= 1.618
abc = 0.618
1.27 <= bcd <= 1.618
5-0
1.13 <= xab <= 1.618
1.618 <= abc <= 2.24
bcd = 0.5
This script contains everything which original script has apart from stats. Use the original script if you are not developer looking for code reference and prefer having stats table.
I have also developed a strategy based on harmonic patterns which can be found here:
在脚本中搜索"harmonic"

[R&D] Harmonic deviationsI'm publishing it for research purposes & welcome any ideas and/or explanations whether it's actually possible or nah to do what I'm doing right now.
...
Idea is simple - if we can do Harmonic Mean, can we do Harmonic Standard Deviations? It should be the same logic, the only difference is instead of actual datapoints we gotta use reciprocals.
In reality I've found smth really curios, it's possible to get these Harmonic Standard Deviations, however, somewhy, depends on your timeframe, u gotta do final sqrt different amount of times. And looks like... the market reacts to these levels.
That's why in the script settings there is a menu where you can choose how many times to perform sqrt operation.
Pls check it out, play with it, see maybe you'll see smth interesting.

Harmonic BloomHarmonic Bloom - Advanced Geometric Analysis
Building upon my previous Fibonacci inspired indicator "TrendZone", Harmonic Bloom is a sophisticated geometric trading indicator inspired by W.D. Gann's legendary market geometry principles. It reveals market structure through three key pivot points and dynamic angular analysis, creating powerful harmonic intersections for precision trading.
🎯 Core Features:
📍 Three-Point Gann System:
Set 3 custom pivot points to define your analysis timeframe
Automatic trend detection (bullish/bearish) between pivots
Dynamic geometric box construction following Gann's square principles
📐 Gann-Style 45° Angle Projections:
Pivot 2 Line: Follows trend direction (up if bullish, down if bearish)
Pivot 3 Line: Creates opposition (opposite direction to Pivot 2)
Corner Line: Mirrors Pivot 2 from appropriate box corner
All angles project forward using Gann's 1x1 (45°) methodology for future price targets
⚡ POWER OF HARMONIC INTERSECTIONS:
Confluence Zones: Where multiple 45° angles intersect create the strongest support/resistance
Geometric Harmony: Intersections represent natural market turning points
Time-Price Balance: Following Gann's principle that time and price must be in harmony
Multiple Timeframe Resonance: Intersection points often align across different timeframes
High-Probability Reversals: Markets frequently respect these geometric intersection levels
📊 Customizable Retracement Levels:
8 fully configurable levels (default: 0.0, 0.25, 0.5, 0.75, 1.0, 1.25, 1.5, 1.75)
Choose between 25% or 50% trendline alignment
Individual style controls for each level
🔢 Advanced Gann Analytics:
Fibonacci sequence detection in bar counts (Gann studied natural number sequences)
Numerology sum analysis on pivot prices (Gann's mystical number approach)
Special highlighting for significant numbers
Optional on-chart labels for key metrics
📈 Trading Applications:
✅ Support/Resistance: Use retracement levels for entry/exit points
✅ Gann Angles: 45° lines show momentum direction and strength following Gann's time-price theory
✅ Intersection Trading: Most powerful signals occur at harmonic intersections where multiple angles converge
✅ Price Targets: Forward projections provide future price objectives using Gann's geometric principles
✅ Market Geometry: Identify harmonic patterns and geometric confluences
✅ Time Analysis: Fibonacci-based bar counting for timing decisions (Gann emphasized time cycles)
🌟 Why Harmonic Intersections Are So Powerful:
Gann believed that markets move in geometric harmony, and when multiple angles intersect, they create "magnetic price levels" where:
Maximum Energy Convergence: Multiple geometric forces meet at one point
Natural Turning Points: Markets respect these intersections as natural support/resistance
Time-Price Synchronicity: Intersections often coincide with significant time cycles
Multi-Dimensional Confirmation: Price, time, and geometry align simultaneously
⚙️ Highly Customizable:
All colors, widths, and styles adjustable
Toggle any feature on/off independently
Extend projections beyond the analysis box
Choose your preferred visual presentation
Perfect for traders who use Gann theory, geometric analysis, harmonic patterns, and mathematical market structure. The true power lies in trading the intersection points where multiple harmonic angles converge - these represent the market's most significant geometric turning points.

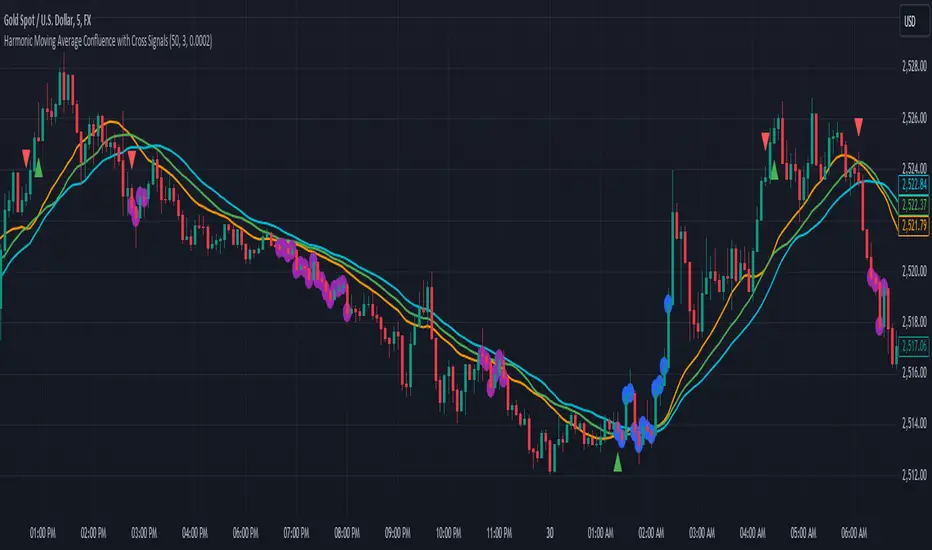
Harmonic Moving Average Confluence with Cross SignalsHarmonic Moving Average Confluence with Cross Signals
Overview:
The "Harmonic Moving Average Confluence with Cross Signals" is a custom indicator designed to analyze harmonic moving averages and identify confluence zones on a chart. It provides insights into potential trading opportunities through cross signals and confluence detection.
Features:
Harmonic Moving Averages (HMAs):
38.2% HMA
50% HMA
61.8% HMA
These HMAs are calculated based on a base period and plotted on the chart to identify key support and resistance levels.
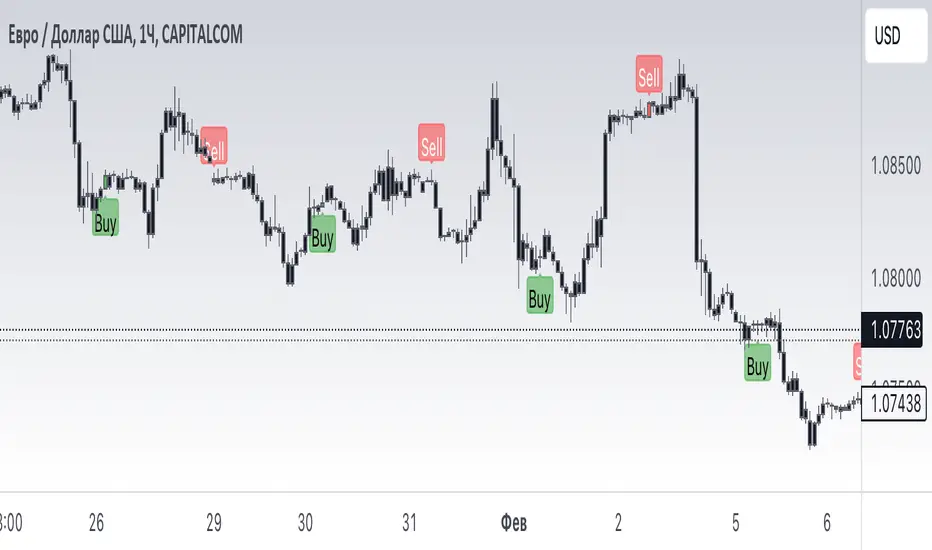
Cross Detection:
Buy Signal: Triggered when the 38.2% HMA crosses above the 50% HMA.
Sell Signal: Triggered when the 38.2% HMA crosses below the 50% HMA.
Buy signals are marked with green triangles below the candles.
Sell signals are marked with red triangles above the candles.
Confluence Detection:
Confluence zones are identified where two or more HMAs are within a specified percentage difference from each other.
Confluence Strength: Default minimum strength is set to 3.
Threshold Percentage: Default is set to 0.0002%.
Confluence zones are marked with blue circles on the chart, with 80% opacity.
Default Settings:
Base Period: 50
Minimum Confluence Strength: 3
Confluence Threshold: 0.0002%
Confluence Circles Opacity: 80%
How to Use It:
Setup:
Add the indicator to your trading chart.
The indicator will automatically calculate and plot the harmonic moving averages and detect cross signals and confluence zones based on the default settings.
Interpreting Signals:
Buy Signal: Look for green triangles below the candles indicating a potential buying opportunity when the 38.2% HMA crosses above the 50% HMA.
Sell Signal: Look for red triangles above the candles indicating a potential selling opportunity when the 38.2% HMA crosses below the 50% HMA.
Confluence Zones: Blue circles represent areas where two or more HMAs are within the specified threshold percentage, indicating potential trading zones.
Adjusting Parameters:
Base Period: Adjust to change the period of the moving averages if needed.
Minimum Confluence Strength: Set to control how many confluence zones need to be present to display a circle.
Threshold Percentage: Set to adjust the sensitivity of confluence detection.
Usage Tips:
Use the signals in conjunction with other technical analysis tools to enhance your trading strategy.
Monitor confluence zones for possible high-interest trading opportunities.
I hope this version aligns better with your needs. If there's anything specific you'd like to adjust or add, just let me know!
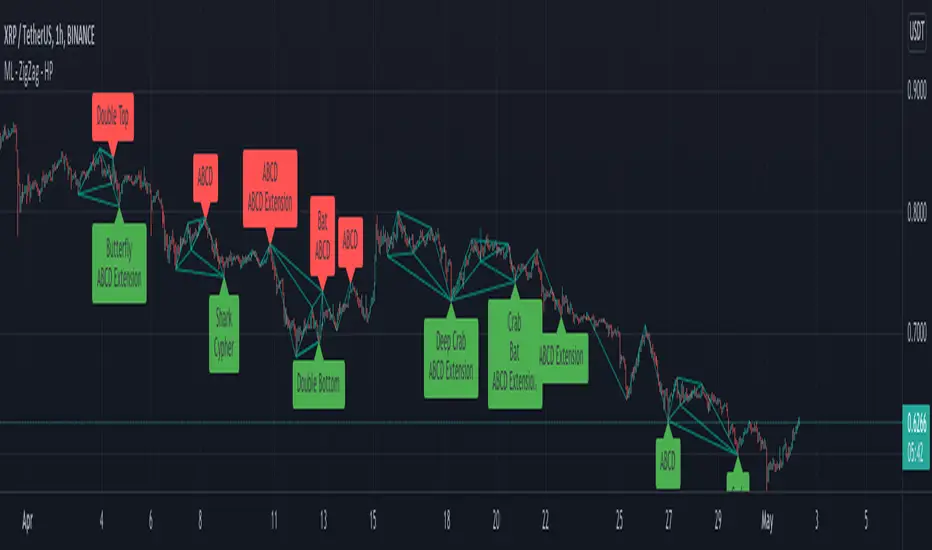
Multi Level ZigZag Harmonic PatternsLets make things bit complicated.
Main difference between this script and the earlier Multi Zigzag Harmonic Pattern is the calculation logic of Zigzag 2, 3 and 4
In the earlier script, all zigzags were plain and were calculated on the basis of different lengths. (Such as 5, 10, 15, 20). These were derived on the basis of Multi Zigzag indicator
In this script, Zigzag 2, 3 and 4 are calculated in slightly different way. They are calculated on the basis of previous zigzag. This means, Zigzag 1 will be the input for Zigzag2 calculation and Zigzag 2 will be the input for Zigzag3 and so on. This is demonstrated in the script - Multi Level Zigzag
One important parameter which is specific to this script is: UseZigZagChain
If checked:
Zigzag2 is formed based on Zigzag1
Zigzag3 is formed based on Zigzag2
Zigzag4 is formed based on Zigzag3
This can lead to patterns covering huge number of candles as this chaining causes exponential effect in each levels. (Effective length grows exponentially in each level)
If unchecked:
Zigzag2 is formed based on Zigzag1 (Same as when checked)
Zigzag3 is formed based on Zigzag1. But, length is set to zigzag2Length + zigzag3Length
Zigzag4 is formed based on Zigzag1. But, length is set to zigzag2Length + zigzag3Length + zigzag4Length
This reduces exponential increase of zigzag lengths over next levels.
Logical ratios of patterns are coded as below:
Notations:
Lines XABCD forms the pattern in all cases. (OXABCD in case of Three drives )
abc = BC retacement of AB, xab = AB retracement of XA and so on
ABCD Classic
0.618 <= abc <= 0.786
1.272 <= bcd <= 1.618
AB=CD
Price difference between AB and CD are equal
Time difference between AB and CD are equal
ABCD Extension
0.618 <= abc <= 0.786
1.272 <= AD/ BC (price) <= 1.618
Gartley
xab = 0.618
0.382 <= abc <= 0.886
1.272 <= bcd <= 1.618 OR xad = 0.786
Crab
0.382 <= xab <= 0.618
0.382 <= abc <= 0.886
2.24 <= bcd <= 3.618 OR xad = 1.618
Deep Crab
xab = 0.886
0.382 <= abc <= 0.886
2.0 <= bcd <= 3.618 OR xad = 1.618
Bat
0.382 <= xab <= 0.50
0.382 <= abc <= 0.886
1.618 <= bcd <= 2.618 OR xad = 0.886
Butterfly
xab = 0.786
0.382 <= abc <= 0.886
1.618 <= bcd <= 2.618 OR 1.272 <= xad <= 2.618
Shark
xab = 0.786
1.13 <= abc <= 1.618
1.618 <= bcd <= 2.24 OR 0.886 <= xad <= 1.13
Cypher
0.382 <= xab <= 0.618
1.13 <= abc <= 1.414
1.272 <= bcd <= 2.0 OR xad = 0.786
Three Drives
oxa = 0.618
1.27 <= xab <= 1.618
abc = 0.618
1.27 <= bcd <= 1.618
5-0
1.13 <= xab <= 1.618
1.618 <= abc <= 2.24
bcd = 0.5
Double Bottom
Last two pivot High Lows make W shape
Last Pivot Low is higher than previous Last Pivot Low.
Last Pivot High is lower than previous last Pivot High.
Price has not gone below Last Pivot Low
Price breaks out of last Pivot High to complete W shape
Double Top
Last two pivot High Lows make M shape
Last Pivot Low is higher than previous Last Pivot Low.
Last Pivot High is lower than previous last Pivot High.
Price has not gone above Last Pivot High
Price breaks out of last Pivot Low to complete M shape
Simple Harmonic Oscillator (SHO)The indicator is based on Akram El Sherbini's article "Time Cycle Oscillators" published in IFTA journal 2018 (pages 78-80) (www.ftaa.org.hk)
The SHO is a bounded oscillator for the simple harmonic index that calculates the period of the market’s cycle. The oscillator is used for short and intermediate terms and moves within a range of -100 to 100 percent. The SHO has overbought and oversold levels at +40 and -40, respectively. At extreme periods, the oscillator may reach the levels of +60 and -60. The zero level demonstrates an equilibrium between the periods of bulls and bears. The SHO oscillates between +40 and -40. The crossover at those levels creates buy and sell signals. In an uptrend, the SHO fluctuates between 0 and +40 where the bulls are controlling the market. On the contrary, the SHO fluctuates between 0 and -40 during downtrends where the bears control the market. Reaching the extreme level -60 in an uptrend is a sign of weakness. Mostly, the oscillator will retrace from its centerline rather than the upper boundary +40. On the other hand, reaching +60 in a downtrend is a sign of strength and the oscillator will not be able to reach its lower boundary -40.
Centerline Crossover Tactic
This tactic is tested during uptrends. The buy signals are generated when the WPO/SHI cross their centerlines to the upside. The sell signals are generated when the WPO/SHI cross down their centerlines. To define the uptrend in the system, stocks closing above their 50-day EMA are considered while the ADX is above 18.
Uptrend Tactic
During uptrends, the bulls control the markets, and the oscillators will move above their centerline with an increase in the period of cycles. The lower boundaries and equilibrium line crossovers generate buy signals, while crossing the upper boundaries will generate sell signals. The “Re-entry” and “Exit at weakness” tactics are combined with the uptrend tactic. Consequently, we will have three buy signals and two sell signals.
Sideways Tactic
During sideways, the oscillators fluctuate between their upper and lower boundaries. Crossing the lower boundary to the upside will generate a buy signal. On the other hand, crossing the upper boundary to the downside will generate a sell signal. When the bears take control, the oscillators will cross down the lower boundaries, triggering exit signals. Therefore, this tactic will consist of one buy signal and two sell signals. The sideway tactic is defined when stocks close above their 50-day EMA and the ADX is below 18

NG [Simple Harmonic Oscillator]The SHO is a bounded oscillator for the simple harmonic index that calculates the period of the market’s cycle.
The oscillator is used for short and intermediate terms and moves within a range of -100 to 100 percent.
The SHO has overbought and oversold levels at +40 and -40, respectively.
At extreme periods, the oscillator may reach the levels of +60 and -60.
The zero level demonstrates an equilibrium between the periods of bulls and bears.
The SHO oscillates between +40 and -40.
The crossover at those levels creates buy and sell signals.
In an uptrend, the SHO fluctuates between 0 and +40 where the bulls are controlling the market.
On the contrary, the SHO fluctuates between 0 and -40 during downtrends where the bears controlthe market.
Reaching the extreme level -60 in an uptrend is a sign of weakness.

HarmonicPatternTrackingLibrary "HarmonicPatternTracking"
Library contains few data structures and methods for tracking harmonic pattern trades via pinescript.
method draw(this)
Creates and draws HarmonicDrawing object for given HarmonicPattern
Namespace types: HarmonicPattern
Parameters:
this (HarmonicPattern) : HarmonicPattern object
Returns: current HarmonicPattern object
method addTrade(this)
calculates HarmonicTrade and sets trade object for HarmonicPattern
Namespace types: HarmonicPattern
Parameters:
this (HarmonicPattern) : HarmonicPattern object
Returns: bool true if pattern trades are valid, false otherwise
method delete(this)
Deletes drawing objects of HarmonicDrawing
Namespace types: HarmonicDrawing
Parameters:
this (HarmonicDrawing) : HarmonicDrawing object
Returns: current HarmonicDrawing object
method delete(this)
Deletes drawings of harmonic pattern
Namespace types: HarmonicPattern
Parameters:
this (HarmonicPattern) : HarmonicPattern object
Returns: current HarmonicPattern object
HarmonicDrawing
Drawing objects of Harmonic Pattern
Fields:
xa (series line) : xa line
ab (series line) : ab line
bc (series line) : bc line
cd (series line) : cd line
xb (series line) : xb line
bd (series line) : bd line
ac (series line) : ac line
xd (series line) : xd line
x (series label) : label for pivot x
a (series label) : label for pivot a
b (series label) : label for pivot b
c (series label) : label for pivot c
d (series label) : label for pivot d
xabRatio (series label) : label for XAB Ratio
abcRatio (series label) : label for ABC Ratio
bcdRatio (series label) : label for BCD Ratio
xadRatio (series label) : label for XAD Ratio
HarmonicTrade
Trade tracking parameters of Harmonic Patterns
Fields:
initialEntry (series float) : initial entry when pattern first formed.
entry (series float) : trailed entry price.
initialStop (series float) : initial stop when trade first entered.
stop (series float) : current stop updated as per trailing rules.
target1 (series float) : First target value
target2 (series float) : Second target value
target3 (series float) : Third target value
target4 (series float) : Fourth target value
status (series int) : Trade status referenced as integer
retouch (series bool) : Flag to show if the price retouched after entry
HarmonicProperties
Display and trade calculation properties for Harmonic Patterns
Fields:
fillMajorTriangles (series bool) : Display property used for using linefill for harmonic major triangles
fillMinorTriangles (series bool) : Display property used for using linefill for harmonic minor triangles
majorFillTransparency (series int) : transparency setting for major triangles
minorFillTransparency (series int) : transparency setting for minor triangles
showXABCD (series bool) : Display XABCD pivot labels
lblSizePivots (series string) : Pivot label size
showRatios (series bool) : Display Ratio labels
useLogScaleForScan (series bool) : Use log scale to determine fib ratios for pattern scanning
useLogScaleForTargets (series bool) : Use log scale to determine fib ratios for target calculation
base (series string) : base on which calculation of stop/targets are made.
entryRatio (series float) : fib ratio to calculate entry
stopRatio (series float) : fib ratio to calculate initial stop
target1Ratio (series float) : fib ratio to calculate first target
target2Ratio (series float) : fib ratio to calculate second target
target3Ratio (series float) : fib ratio to calculate third target
target4Ratio (series float) : fib ratio to calculate fourth target
HarmonicPattern
Harmonic pattern object to track entire pattern trade life cycle
Fields:
id (series int) : Pattern Id
dir (series int) : pattern direction
x (series float) : X Pivot
a (series float) : A Pivot
b (series float) : B Pivot
c (series float) : C Pivot
d (series float) : D Pivot
xBar (series int) : Bar index of X Pivot
aBar (series int) : Bar index of A Pivot
bBar (series int) : Bar index of B Pivot
cBar (series int) : Bar index of C Pivot
dBar (series int) : Bar index of D Pivot
przStart (series float) : Start of PRZ range
przEnd (series float) : End of PRZ range
patterns (bool ) : array representing the patterns
patternLabel (series string) : string representation of list of patterns
patternColor (series color) : color assigned to pattern
properties (HarmonicProperties) : HarmonicProperties object containing display and calculation properties
trade (HarmonicTrade) : HarmonicTrade object to track trades
drawing (HarmonicDrawing) : HarmonicDrawing object to manage drawings
harmonicpatterns1Library "harmonicpatterns1"
harmonicpatterns: methods required for calculation of harmonic patterns. Correction for library (missing export in line 303)
isGartleyPattern(xabRatio, abcRatio, bcdRatio, xadRatio, err_min, err_max) isGartleyPattern: Checks for harmonic pattern Gartley
Parameters:
xabRatio : AB/XA
abcRatio : BC/AB
bcdRatio : CD/BC
xadRatio : AD/XA
err_min : Minumum error threshold
err_max : Maximum error threshold
Returns: True if the pattern is Gartley. False otherwise.
isBatPattern(xabRatio, abcRatio, bcdRatio, xadRatio, err_min, err_max) isBatPattern: Checks for harmonic pattern Bat
Parameters:
xabRatio : AB/XA
abcRatio : BC/AB
bcdRatio : CD/BC
xadRatio : AD/XA
err_min : Minumum error threshold
err_max : Maximum error threshold
Returns: True if the pattern is Bat. False otherwise.
isButterflyPattern(xabRatio, abcRatio, bcdRatio, xadRatio, err_min, err_max) isButterflyPattern: Checks for harmonic pattern Butterfly
Parameters:
xabRatio : AB/XA
abcRatio : BC/AB
bcdRatio : CD/BC
xadRatio : AD/XA
err_min : Minumum error threshold
err_max : Maximum error threshold
Returns: True if the pattern is Butterfly. False otherwise.
isCrabPattern(xabRatio, abcRatio, bcdRatio, xadRatio, err_min, err_max) isCrabPattern: Checks for harmonic pattern Crab
Parameters:
xabRatio : AB/XA
abcRatio : BC/AB
bcdRatio : CD/BC
xadRatio : AD/XA
err_min : Minumum error threshold
err_max : Maximum error threshold
Returns: True if the pattern is Crab. False otherwise.
isDeepCrabPattern(xabRatio, abcRatio, bcdRatio, xadRatio, err_min, err_max) isDeepCrabPattern: Checks for harmonic pattern DeepCrab
Parameters:
xabRatio : AB/XA
abcRatio : BC/AB
bcdRatio : CD/BC
xadRatio : AD/XA
err_min : Minumum error threshold
err_max : Maximum error threshold
Returns: True if the pattern is DeepCrab. False otherwise.
isCypherPattern(xabRatio, axcRatio, xadRatio, err_min, err_max) isCypherPattern: Checks for harmonic pattern Cypher
Parameters:
xabRatio : AB/XA
axcRatio : XC/AX
xadRatio : AD/XA
err_min : Minumum error threshold
err_max : Maximum error threshold
Returns: True if the pattern is Cypher. False otherwise.
isSharkPattern(xabRatio, abcRatio, bcdRatio, xadRatio, err_min, err_max) isSharkPattern: Checks for harmonic pattern Shark
Parameters:
xabRatio : AB/XA
abcRatio : BC/AB
bcdRatio : CD/BC
xadRatio : AD/XA
err_min : Minumum error threshold
err_max : Maximum error threshold
Returns: True if the pattern is Shark. False otherwise.
isNenStarPattern(xabRatio, abcRatio, bcdRatio, xadRatio, err_min, err_max) isNenStarPattern: Checks for harmonic pattern Nenstar
Parameters:
xabRatio : AB/XA
abcRatio : BC/AB
bcdRatio : CD/BC
xadRatio : AD/XA
err_min : Minumum error threshold
err_max : Maximum error threshold
Returns: True if the pattern is Nenstar. False otherwise.
isAntiNenStarPattern(xabRatio, abcRatio, bcdRatio, xadRatio, err_min, err_max) isAntiNenStarPattern: Checks for harmonic pattern Anti NenStar
Parameters:
xabRatio : - AB/XA
abcRatio : - BC/AB
bcdRatio : - CD/BC
xadRatio : - AD/XA
err_min : - Minumum error threshold
err_max : - Maximum error threshold
Returns: True if the pattern is Anti NenStar. False otherwise.
isAntiSharkPattern(xabRatio, abcRatio, bcdRatio, xadRatio, err_min, err_max) isAntiSharkPattern: Checks for harmonic pattern Anti Shark
Parameters:
xabRatio : AB/XA
abcRatio : BC/AB
bcdRatio : CD/BC
xadRatio : AD/XA
err_min : Minumum error threshold
err_max : Maximum error threshold
Returns: True if the pattern is Anti Shark. False otherwise.
isAntiCypherPattern(xabRatio, abcRatio, bcdRatio, xadRatio, err_min, err_max) isAntiCypherPattern: Checks for harmonic pattern Anti Cypher
Parameters:
xabRatio : AB/XA
abcRatio : BC/AB
bcdRatio : CD/BC
xadRatio : AD/XA
err_min : Minumum error threshold
err_max : Maximum error threshold
Returns: True if the pattern is Anti Cypher. False otherwise.
isAntiCrabPattern(xabRatio, abcRatio, bcdRatio, xadRatio, err_min, err_max) isAntiCrabPattern: Checks for harmonic pattern Anti Crab
Parameters:
xabRatio : AB/XA
abcRatio : BC/AB
bcdRatio : CD/BC
xadRatio : AD/XA
err_min : Minumum error threshold
err_max : Maximum error threshold
Returns: True if the pattern is Anti Crab. False otherwise.
isAntiButterflyPattern(xabRatio, abcRatio, bcdRatio, xadRatio, err_min, err_max) isAntiButterflyPattern: Checks for harmonic pattern Anti Butterfly
Parameters:
xabRatio : AB/XA
abcRatio : BC/AB
bcdRatio : CD/BC
xadRatio : AD/XA
err_min : Minumum error threshold
err_max : Maximum error threshold
Returns: True if the pattern is Anti Butterfly. False otherwise.
isAntiBatPattern(xabRatio, abcRatio, bcdRatio, xadRatio, err_min, err_max) isAntiBatPattern: Checks for harmonic pattern Anti Bat
Parameters:
xabRatio : AB/XA
abcRatio : BC/AB
bcdRatio : CD/BC
xadRatio : AD/XA
err_min : Minumum error threshold
err_max : Maximum error threshold
Returns: True if the pattern is Anti Bat. False otherwise.
isAntiGartleyPattern(xabRatio, abcRatio, bcdRatio, xadRatio, err_min, err_max) isAntiGartleyPattern: Checks for harmonic pattern Anti Gartley
Parameters:
xabRatio : AB/XA
abcRatio : BC/AB
bcdRatio : CD/BC
xadRatio : AD/XA
err_min : Minumum error threshold
err_max : Maximum error threshold
Returns: True if the pattern is Anti Gartley. False otherwise.
isNavarro200Pattern(xabRatio, abcRatio, bcdRatio, xadRatio, err_min, err_max) isNavarro200Pattern: Checks for harmonic pattern Navarro200
Parameters:
xabRatio : AB/XA
abcRatio : BC/AB
bcdRatio : CD/BC
xadRatio : AD/XA
err_min : Minumum error threshold
err_max : Maximum error threshold
Returns: True if the pattern is Navarro200. False otherwise.
isHarmonicPattern(x, a, c, c, d, flags, errorPercent) isHarmonicPattern: Checks for harmonic patterns
Parameters:
x : X coordinate value
a : A coordinate value
c : B coordinate value
c : C coordinate value
d : D coordinate value
flags : flags to check patterns. Send empty array to enable all
errorPercent : Error threshold
Returns: Array of boolean values which says whether valid pattern exist and array of corresponding pattern names
HarmonicPatternLibrary "HarmonicPattern"
Functions to detect/check harmonic patterns from provided values.
line_price_rate(point_c, point_b, point_a) Compute the price rate of the line AB divided by the the line BC
Parameters:
point_c : float, the price at point C.
point_b : float, the price at point B.
point_a : float, the price at point A.
Returns: float
line_time_rate(_c, _b, _a) Compute the time rate of the line AB divided by the the line BC
Parameters:
_c : float, the time or bar_index at point C.
_b : float, the time or bar_index at point B.
_a : float, the time or bar_index at point A.
Returns: float
is_inrange(value, min, max) Check if value is within min/max range of tolerance.
Parameters:
value : float, value to check tolerance.
min : float, minimum value in range of tolerance.
max : float, maximum value in range of tolerance.
Returns: bool
isHarmonicTriangle(rate_cba, margin_of_error) Check if the rate(s) correspond to pattern ("Harmonic Triangle").
Parameters:
rate_cba : float, percent rate of the triangle CBA. expects a negative rate.
margin_of_error : float, percent rate of expected error margin, default 0.05(5%).
Returns: bool
is2Tap(rate_cba, margin_of_error) Check if the rate(s) correspond to pattern ("2Tap", 'Double Top / Bottom').
Parameters:
rate_cba : float, percent rate of the triangle CBA. expects a negative rate.
margin_of_error : float, percent rate of expected error margin, default 0.05(5%).
Returns: bool
is3Tap(rate_edc, rate_cba, margin_of_error) Check if the rate(s) correspond to pattern ("3Tap", "Triple Top / Bottom").
Parameters:
rate_edc : float, percent rate of the triangle EDC. expects a negative rate.
rate_cba : float, percent rate of the triangle CBA. expects a negative rate.
margin_of_error : float, percent rate of expected error margin, default 0.05(5%).
Returns: bool
is4Tap(rate_gfe, rate_edc, rate_cba, margin_of_error) Check if the rate(s) correspond to pattern ("4Tap", "Quadruple Top / Bottom").
Parameters:
rate_gfe : float, percent rate of the triangle GFE. expects a negative rate.
rate_edc : float, percent rate of the triangle EDC. expects a negative rate.
rate_cba : float, percent rate of the triangle CBA. expects a negative rate.
margin_of_error : float, percent rate of expected error margin, default 0.05(5%).
Returns: bool
isABCD(rate_cba, rate_dcb, margin_of_error) Check if the rate(s) correspond to pattern ("AB=CD").
Parameters:
rate_cba : float, percent rate of the triangle CBA. expects a negative rate.
rate_dcb : float, percent rate of the triangle DCB. expects a negative rate.
margin_of_error : float, percent rate of expected error margin, default 0.05(5%).
Returns: bool
isBat(rate_edc, rate_dcb, rate_cba, rate_eda, margin_of_error) Check if the rate(s) correspond to pattern ("Bat").
Parameters:
rate_edc : float, percent rate of the triangle EDC. expects a negative rate.
rate_dcb : float, percent rate of the triangle DCB. expects a negative rate.
rate_cba : float, percent rate of the triangle CBA. expects a negative rate.
rate_eda : float, percent rate of the triangle EDA. expects a negative rate.
margin_of_error : float, percent rate of expected error margin, default 0.05(5%).
Returns: bool
isButterfly(rate_edc, rate_dcb, rate_cba, rate_eda, margin_of_error) Check if the rate(s) correspond to pattern ("Butterfly").
Parameters:
rate_edc : float, percent rate of the triangle EDC. expects a negative rate.
rate_dcb : float, percent rate of the triangle DCB. expects a negative rate.
rate_cba : float, percent rate of the triangle CBA. expects a negative rate.
rate_eda : float, percent rate of the triangle EDA. expects a negative rate.
margin_of_error : float, percent rate of expected error margin, default 0.05(5%).
Returns: bool
isGartley(rate_edc, rate_dcb, rate_cba, rate_eda, margin_of_error) Check if the rate(s) correspond to pattern ("Gartley").
Parameters:
rate_edc : float, percent rate of the triangle EDC. expects a negative rate.
rate_dcb : float, percent rate of the triangle DCB. expects a negative rate.
rate_cba : float, percent rate of the triangle CBA. expects a negative rate.
rate_eda : float, percent rate of the triangle EDA. expects a negative rate.
margin_of_error : float, percent rate of expected error margin, default 0.05(5%).
Returns: bool
isCrab(rate_edc, rate_dcb, rate_cba, rate_eda, margin_of_error) Check if the rate(s) correspond to pattern ("Crab").
Parameters:
rate_edc : float, percent rate of the triangle EDC. expects a negative rate.
rate_dcb : float, percent rate of the triangle DCB. expects a negative rate.
rate_cba : float, percent rate of the triangle CBA. expects a negative rate.
rate_eda : float, percent rate of the triangle EDA. expects a negative rate.
margin_of_error : float, percent rate of expected error margin, default 0.05(5%).
Returns: bool
isShark(rate_edc, rate_dcb, rate_cba, rate_eda, margin_of_error) Check if the rate(s) correspond to pattern ("Shark").
Parameters:
rate_edc : float, percent rate of the triangle EDC. expects a negative rate.
rate_dcb : float, percent rate of the triangle DCB. expects a negative rate.
rate_cba : float, percent rate of the triangle CBA. expects a negative rate.
rate_eda : float, percent rate of the triangle EDA. expects a negative rate.
margin_of_error : float, percent rate of expected error margin, default 0.05(5%).
Returns: bool
is5o(rate_edc, rate_dcb, rate_cba, rate_eda, margin_of_error) Check if the rate(s) correspond to pattern ("5o").
Parameters:
rate_edc : float, percent rate of the triangle EDC. expects a negative rate.
rate_dcb : float, percent rate of the triangle DCB. expects a negative rate.
rate_cba : float, percent rate of the triangle CBA. expects a negative rate.
rate_eda : float, percent rate of the triangle EDA. expects a negative rate.
margin_of_error : float, percent rate of expected error margin, default 0.05(5%).
Returns: bool
isWolfe(rate_edc, rate_dcb, rate_cba, rate_eda, margin_of_error) Check if the rate(s) correspond to pattern ("Wolfe").
Parameters:
rate_edc : float, percent rate of the triangle EDC. expects a negative rate.
rate_dcb : float, percent rate of the triangle DCB. expects a negative rate.
rate_cba : float, percent rate of the triangle CBA. expects a negative rate.
rate_eda : float, percent rate of the triangle EDA. expects a negative rate.
margin_of_error : float, percent rate of expected error margin, default 0.05(5%).
Returns: bool
is3Driver(rate_edc, rate_dcb, rate_cba, rate_eda, margin_of_error) Check if the rate(s) correspond to pattern ("3 Driver").
Parameters:
rate_edc : float, percent rate of the triangle EDC. expects a negative rate.
rate_dcb : float, percent rate of the triangle DCB. expects a negative rate.
rate_cba : float, percent rate of the triangle CBA. expects a negative rate.
rate_eda : float, percent rate of the triangle EDA. expects a negative rate.
margin_of_error : float, percent rate of expected error margin, default 0.05(5%).
Returns: bool
isConTria(rate_edc, rate_dcb, rate_cba, rate_eda, margin_of_error) Check if the rate(s) correspond to pattern ("Contracting Triangle").
Parameters:
rate_edc : float, percent rate of the triangle EDC. expects a negative rate.
rate_dcb : float, percent rate of the triangle DCB. expects a negative rate.
rate_cba : float, percent rate of the triangle CBA. expects a negative rate.
rate_eda : float, percent rate of the triangle EDA. expects a negative rate.
margin_of_error : float, percent rate of expected error margin, default 0.05(5%).
Returns: bool
isExpTria(rate_edc, rate_dcb, rate_cba, rate_eda, margin_of_error) Check if the rate(s) correspond to pattern ("Expanding Triangle").
Parameters:
rate_edc : float, percent rate of the triangle EDC. expects a negative rate.
rate_dcb : float, percent rate of the triangle DCB. expects a negative rate.
rate_cba : float, percent rate of the triangle CBA. expects a negative rate.
rate_eda : float, percent rate of the triangle EDA. expects a negative rate.
margin_of_error : float, percent rate of expected error margin, default 0.05(5%).
Returns: bool
isHnS(rate_fed, rate_feb, rate_edc, rate_dcb, rate_cba, rate_eda, margin_of_error) Check if the rate(s) correspond to pattern ("Head and Shoulders").
Parameters:
rate_fed : float, percent rate of the triangle FED. expects a negative rate.
rate_feb : float, percent rate of the triangle FEB. expects a negative rate.
rate_edc : float, percent rate of the triangle EDC. expects a negative rate.
rate_dcb : float, percent rate of the triangle DCB. expects a negative rate.
rate_cba : float, percent rate of the triangle CBA. expects a negative rate.
rate_eda : float, percent rate of the triangle EDA. expects a negative rate.
margin_of_error : float, percent rate of expected error margin, default 0.05(5%).
Returns: bool
HarmonicSwitches█ OVERVIEW
This library is complementary for XABCD Harmonic Pattern Custom Range Interactive
TupleSwitchHL()
: Tuple Switch for High Low
Parameters:
: : _bool, low_X, high_X, low_A, high_A, low_B, high_B, low_C, high_C
Returns: : price_X, price_A, price_B, price_C
TupleSwitchStyleColor()
: Tuple switch for style and color
Parameters:
: : _bool
Returns: : style0, style1, col_dir
TupleSwitchString()
: Tuple switch for string
Parameters:
: : _bool
Returns: : str_dir, str_X, str_A
TupleSwitchValid()
: Tuple switch for valid
Parameters:
: : _str
Returns: : str_invalid, str_valid
TupleSwitchTime()
: Tuple switch for time
Parameters:
: : _str, time_1, time_2, time_3
Returns: : E1, E2
SwitchColor()
: Switch color
Parameters:
: : _str
Returns: : col_valid
SwitchExtend()
: Extend line
Parameters:
: : _str
Returns: : _extend
harmonicpatternsarraysLibrary "harmonicpatternsarrays"
Library provides an alternative method to scan harmonic patterns and contains utility functions using arrays.
These are mostly customized for personal use. Hence, will not add documentation for arrays. All credit to @HeWhoMustNotBeNamed
getLabel()
delete()
delete()
delete()
delete()
delete()
pop()
pop()
pop()
pop()
pop()
shift()
shift()
shift()
shift()
shift()
unshift()
unshift()
unshift()
unshift()
unshift()
unshift()
unshift()
unshift()
unshift()
unshift()
clear()
clear()
clear()
clear()
clear()
push()
push()
push()
push()
push()
push()
push()
push()
push()
push()
get_trend_series()
getrange()
getSupportedPatterns()
scan_xab()
scan_abc_axc()
scan_bcd()
scan_xad_xcd()
get_prz_range()
isHarmonicPattern()

Harmonic Super GuppyHarmonic Super Guppy – Harmonic & Golden Ratio Trend Analysis Framework
Overview
Harmonic Super Guppy is a comprehensive trend analysis and visualization tool that evolves the classic Guppy Multiple Moving Average (GMMA) methodology, pioneered by Daryl Guppy to visualize the interaction between short-term trader behavior and long-term investor trends. into a harmonic and phase-based market framework. By combining harmonic weighting, golden ratio phasing, and multiple moving averages, it provides traders with a deep understanding of market structure, momentum, and trend alignment. Fast and slow line groups visually differentiate short-term trader activity from longer-term investor positioning, while adaptive fills and dynamic coloring clearly illustrate trend coherence, expansion, and contraction in real time.
Traditional GMMA focuses primarily on moving average convergence and divergence. Harmonic Super Guppy extends this concept, integrating frequency-aware harmonic analysis and golden ratio modulation, allowing traders to detect subtle cyclical forces and early trend shifts before conventional moving averages would react. This is particularly valuable for traders seeking to identify early trend continuation setups, preemptive breakout entries, and potential trend exhaustion zones. The indicator provides a multi-dimensional view, making it suitable for scalping, intraday trading, swing setups, and even longer-term position strategies.
The visual structure of Harmonic Super Guppy is intentionally designed to convey trend clarity without oversimplification. Fast lines reflect short-term trader sentiment, slow lines capture longer-term investor alignment, and fills highlight compression or expansion. The adaptive color coding emphasizes trend alignment: strong green for bullish alignment, strong red for bearish, and subtle gray tones for indecision. This allows traders to quickly gauge market conditions while preserving the granularity necessary for sophisticated analysis.
How It Works
Harmonic Super Guppy uses a combination of harmonic averaging, golden ratio phasing, and adaptive weighting to generate its signals.
Harmonic Weighting : Each moving average integrates three layers of harmonics:
Primary harmonic captures the dominant cyclical structure of the market.
Secondary harmonic introduces a complementary frequency for oscillatory nuance.
Tertiary harmonic smooths higher-frequency noise while retaining meaningful trend signals.
Golden Ratio Phase : Phases of each harmonic contribution are adjusted using the golden ratio (default φ = 1.618), ensuring alignment with natural market rhythms. This reduces lag and allows traders to detect trend shifts earlier than conventional moving averages.
Adaptive Trend Detection : Fast SMAs are compared against slow SMAs to identify structural trends:
UpTrend : Fast SMA exceeds slow SMA.
DownTrend : Fast SMA falls below slow SMA.
Frequency Scaling : The wave frequency setting allows traders to modulate responsiveness versus smoothing. Higher frequency emphasizes short-term moves, while lower frequency highlights structural trends. This enables adaptation across asset classes with different volatility characteristics.
Through this combination, Harmonic Super Guppy captures micro and macro market cycles, helping traders distinguish between transient noise and genuine trend development. The multi-harmonic approach amplifies meaningful price action while reducing false signals inherent in standard moving averages.
Interpretation
Harmonic Super Guppy provides a multi-dimensional perspective on market dynamics:
Trend Analysis : Alignment of fast and slow lines reveals trend direction and strength. Expanding harmonics indicate momentum building, while contraction signals weakening conditions or potential reversals.
Momentum & Volatility : Rapid expansion of fast lines versus slow lines reflects short-term bullish or bearish pressure. Compression often precedes breakout scenarios or volatility expansion. Traders can quickly gauge trend vigor and potential turning points.
Market Context : The indicator overlays harmonic and structural insights without dictating entry or exit points. It complements order blocks, liquidity zones, oscillators, and other technical frameworks, providing context for informed decision-making.
Phase Divergence Detection : Subtle divergence between harmonic layers (primary, secondary, tertiary) often signals early exhaustion in trends or hidden strength, offering preemptive insight into potential reversals or sustained continuation.
By observing both structural alignment and harmonic expansion/contraction, traders gain a clear sense of when markets are trending with conviction versus when conditions are consolidating or becoming unpredictable. This allows for proactive trade management, rather than reactive responses to lagging indicators.
Strategy Integration
Harmonic Super Guppy adapts to various trading methodologies with clear, actionable guidance.
Trend Following : Enter positions when fast and slow lines are aligned and harmonics are expanding. The broader the alignment, the stronger the confirmation of trend persistence. For example:
A fast line crossover above slow lines with expanding fills confirms momentum-driven continuation.
Traders can use harmonic amplitude as a filter to reduce entries against prevailing trends.
Breakout Trading : Periods of line compression indicate potential volatility expansion. When fast lines diverge from slow lines after compression, this often precedes breakouts. Traders can combine this visual cue with structural supports/resistances or order flow analysis to improve timing and precision.
Exhaustion and Reversals : Divergences between harmonic components, or contraction of fast lines relative to slow lines, highlight weakening trends. This can indicate liquidity exhaustion, trend fatigue, or corrective phases. For example:
A flattening fast line group above a rising slow line can hint at short-term overextension.
Traders may use these signals to tighten stops, take partial profits, or prepare for contrarian setups.
Multi-Timeframe Analysis : Overlay slow lines from higher timeframes on lower timeframe charts to filter noise and trade in alignment with larger market structures. For example:
A daily bullish alignment combined with a 15-minute breakout pattern increases probability of a successful intraday trade.
Conversely, a higher timeframe divergence can warn against taking counter-trend trades in lower timeframes.
Adaptive Trade Management : Harmonic expansion/contraction can guide dynamic risk management:
Stops may be adjusted according to slow line support/resistance or harmonic contraction zones.
Position sizing can be modulated based on harmonic amplitude and compression levels, optimizing risk-reward without rigid rules.
Technical Implementation Details
Harmonic Super Guppy is powered by a multi-layered harmonic and phase calculation engine:
Harmonic Processing : Primary, secondary, and tertiary harmonics are calculated per period to capture multiple market cycles simultaneously. This reduces noise and amplifies meaningful signals.
Golden Ratio Modulation : Phase adjustments based on φ = 1.618 align harmonic contributions with natural market rhythms, smoothing lag and improving predictive value.
Adaptive Trend Scaling : Fast line expansion reflects short-term momentum; slow lines provide structural trend context. Fills adapt dynamically based on alignment intensity and harmonic amplitude.
Multi-Factor Trend Analysis : Trend strength is determined by alignment of fast and slow lines over multiple bars, expansion/contraction of harmonic amplitudes, divergences between primary, secondary, and tertiary harmonics and phase synchronization with golden ratio cycles.
These computations allow the indicator to be highly responsive yet smooth, providing traders with actionable insights in real time without overloading visual complexity.
Optimal Application Parameters
Asset-Specific Guidance:
Forex Majors : Wave frequency 1.0–2.0, φ = 1.618–1.8
Large-Cap Equities : Wave frequency 0.8–1.5, φ = 1.5–1.618
Cryptocurrency : Wave frequency 1.2–3.0, φ = 1.618–2.0
Index Futures : Wave frequency 0.5–1.5, φ = 1.618
Timeframe Optimization:
Scalping (1–5min) : Emphasize fast lines, higher frequency for micro-move capture.
Day Trading (15min–1hr) : Balance fast/slow interactions for trend confirmation.
Swing Trading (4hr–Daily) : Focus on slow lines for structural guidance, fast lines for entry timing.
Position Trading (Daily–Weekly) : Slow lines dominate; harmonics highlight long-term cycles.
Performance Characteristics
High Effectiveness Conditions:
Clear separation between short-term and long-term trends.
Moderate-to-high volatility environments.
Assets with consistent volume and price rhythm.
Reduced Effectiveness:
Flat or extremely low volatility markets.
Erratic assets with frequent gaps or algorithmic dominance.
Ultra-short timeframes (<1min), where noise dominates.
Integration Guidelines
Signal Confirmation : Confirm alignment of fast and slow lines over multiple bars. Expansion of harmonic amplitude signals trend persistence.
Risk Management : Place stops beyond slow line support/resistance. Adjust sizing based on compression/expansion zones.
Advanced Feature Settings :
Frequency tuning for different volatility environments.
Phase analysis to track divergences across harmonics.
Use fills and amplitude patterns as a guide for dynamic trade management.
Multi-timeframe confirmation to filter noise and align with structural trends.
Disclaimer
Harmonic Super Guppy is a trend analysis and visualization tool, not a guaranteed profit system. Optimal performance requires proper wave frequency, golden ratio phase, and line visibility settings per asset and timeframe. Traders should combine the indicator with other technical frameworks and maintain disciplined risk management practices.

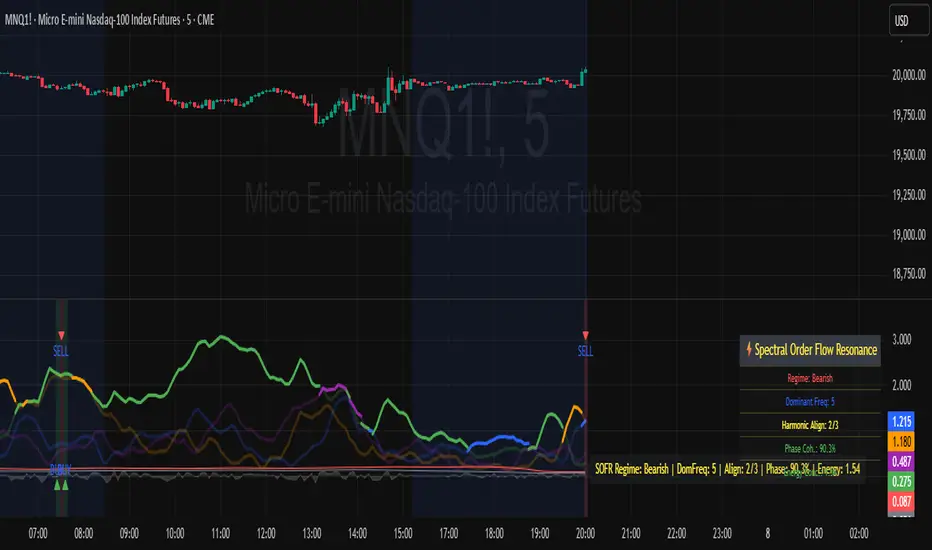
Spectral Order Flow Resonance (SOFR) Spectral Order Flow Resonance (SOFR)
See the Market’s Hidden Rhythms—Trade the Resonance, Not the Noise!
The Spectral Order Flow Resonance (SOFR) is a next-generation tool for traders who want to go beyond price and volume, tapping into the underlying “frequency signature” of order flow itself. Instead of chasing lagging signals or reacting to surface-level volatility, SOFR lets you visualize and quantify the real-time resonance of market activity—helping you spot when the crowd is in sync, and when the regime is about to shift.
What Makes SOFR Unique?
Not Just Another Oscillator:
SOFR doesn’t just measure momentum or volume. It applies spectral analysis (using Fast Fourier Transform) to normalized order flow, extracting the dominant cycles and their resonance strength. This reveals when the market is harmonizing around key frequencies—often the precursor to major moves.
Regime Detection, Not Guesswork:
By tracking harmonic alignment and phase coherence across multiple Fibonacci-based frequencies, SOFR identifies when the market is entering a bullish, bearish, or neutral resonance regime. This is visualized with a dynamic dashboard and info line, so you always know the current state at a glance.
Dynamic Dashboard:
The on-chart dashboard color-codes each key metric—regime, dominant frequency, harmonic alignment, phase coherence, and energy concentration—so you can instantly gauge the strength and direction of the current resonance. No more guesswork or clutter.
Universal Application:
Works on any asset, any timeframe, and in any market—futures, stocks, crypto, forex. If there’s order flow, SOFR can reveal its hidden structure.
How Does It Work?
Order Flow Normalization:
SOFR calculates the net buying/selling pressure and normalizes it using a rolling mean and standard deviation, making the signal robust across assets and timeframes.
Spectral Analysis:
The script applies FFT to the normalized order flow, extracting the magnitude and phase of several key frequencies (typically Fibonacci numbers). This allows you to see which cycles are currently dominating the market.
Resonance & Regime Logic:
When multiple frequencies align and exceed a dynamic resonance threshold, and phase coherence is high, SOFR detects a “resonance regime”—bullish, bearish, or neutral. This is when the market is most likely to experience a strong, sustained move.
Visual Clarity:
The indicator plots each frequency’s magnitude, highlights the dominant one, and provides a real-time dashboard with color-coded metrics for instant decision-making.
SOFR Dashboard Metrics Explained
Regime:
What it means: The current “state” of the market as detected by SOFR—Bullish, Bearish, or Neutral.
Why it matters: The regime tells you whether the market’s order flow is resonating in a way that favors upward moves (Bullish), downward moves (Bearish), or is out of sync (Neutral). This helps you align your trades with the prevailing market force, or stand aside when there’s no clear edge.
Dominant Freq:
What it means: The most powerful frequency (cycle length, in bars) currently detected in the order flow.
Why it matters: Markets often move in cycles. The dominant frequency shows which cycle is currently driving price action, helping you time entries and exits with the market’s “heartbeat.”
Harmonic Align:
What it means: The number of key frequencies (out of 3) that are currently in resonance (above threshold).
Why it matters: When multiple frequencies align, it signals that different groups of traders (with different time horizons) are acting in concert. This increases the probability of a strong, sustained move.
Phase Coh.:
What it means: A measure (0–100%) of how “in sync” the phases of the key frequencies are.
Why it matters: High phase coherence means the market’s cycles are reinforcing each other, not cancelling out. This is a classic signature of trending or explosive moves.
Energy Conc.:
What it means: The concentration of spectral energy in the dominant frequency, relative to the average.
Why it matters: High energy concentration means the market’s activity is focused in one cycle, increasing the odds of a decisive move. Low concentration means the market is scattered and less predictable.
How to Use
Bullish Regime:
When the dashboard shows a green regime and high harmonic alignment, the market is in a bullish resonance—look for long opportunities or trend continuations.
Bearish Regime:
When the regime is red and alignment is high, the market is in a bearish resonance—look for short opportunities or trend continuations.
Neutral Regime:
When the regime is gray or alignment is low, the market is out of sync—consider waiting for clearer signals or using other tools.
Combine with Your Strategy:
Use SOFR as a confirmation tool, a filter for trend/range conditions, or as a standalone regime detector. The dashboard’s color-coded metrics help you instantly spot when the market is entering or exiting resonance.
Inputs Explained
FFT Window Length :
Controls the number of bars used for spectral analysis. Higher values smooth the signal, lower values make it more sensitive.
Order Flow Period:
Sets the lookback for normalizing order flow. Shorter periods react faster, longer periods are smoother.
Fibonacci Frequencies:
Choose which cycles to analyze. Default values (5, 8, 13) capture common market rhythms.
Resonance Threshold:
Sets how strong a frequency’s signal must be to count as “in resonance.” Lower for more signals, higher for stricter filtering.
Signal Smoothing & Amplify:
Fine-tune the display for your chart and asset.
Dashboard & Info Line Toggles:
Show or hide the on-chart dashboard and info line as needed.
Why This Matters
Most indicators show you what just happened. SOFR shows you when the market is entering a state of resonance—when crowd behavior is most likely to produce powerful, sustained moves. By visualizing the hidden structure of order flow, you gain a tactical edge over traders who only see the surface.
For educational purposes only. Not financial advice. Always use proper risk management.
Use with discipline. Trade your edge.
— Dskyz, for DAFE Trading Systems
Dkoderweb repainting issue fix strategyHarmonic Pattern Recognition Trading Strategy
This TradingView strategy called "Dkoderweb repainting issue fix strategy" is designed to identify and trade harmonic price patterns with optimized entry and exit points using Fibonacci levels. The strategy implements various popular harmonic patterns including Bat, Butterfly, Gartley, Crab, Shark, ABCD, and their anti-patterns.
Key Features
Pattern Recognition: Identifies 17+ harmonic price patterns including standard and anti-patterns
Fibonacci-Based Entries and Exits: Uses customizable Fibonacci levels for precision entries, take profits, and stop losses
Alternative Timeframe Analysis: Option to use higher timeframes for pattern identification
Heiken Ashi Support: Optional use of Heiken Ashi candles instead of regular candlesticks
Visual Indicators:
Pattern visualization with ZigZag indicator
Buy/sell signal markers
Color-coded background to highlight active trade zones
Customizable Fibonacci level display
How It Works
The strategy uses a ZigZag-based pattern identification system to detect pivot points
When a valid harmonic pattern forms, the strategy calculates the optimal entry window using the specified Fibonacci level (default 0.382)
Entries trigger when price returns to the entry window after pattern completion
Take profit and stop loss levels are automatically set based on customizable Fibonacci ratios
Visual alerts notify you of entries and exits
The strategy tracks active trades and displays them with background color highlights
Customizable Settings
Trade size
Entry window Fibonacci level (default 0.382)
Take profit Fibonacci level (default 0.618)
Stop loss Fibonacci level (default -0.618)
Alert messages for entries and exits
Display options for specific Fibonacci levels
Alternative timeframe selection
This strategy is designed to fix repainting issues that are common in harmonic pattern strategies, ensuring more reliable signals and backtesting results.

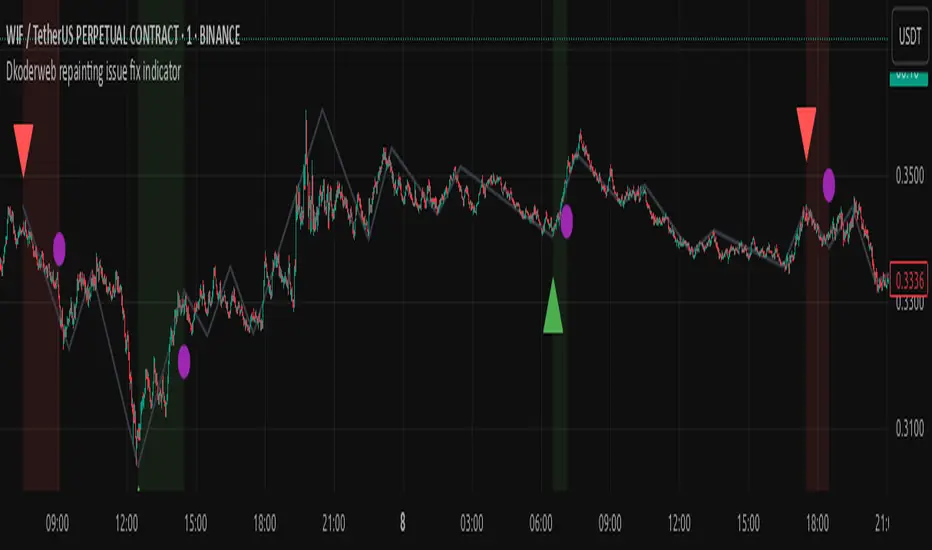
Dkoderweb repainting issue fix indicator# Harmonic Pattern Trading Indicator for TradingView
This indicator, called "Dkoderweb repainting issue fix indicator," is designed to identify and trade harmonic chart patterns in financial markets. It uses Fibonacci relationships between price points to detect various patterns like Bat, Butterfly, Gartley, Crab, Shark, and others.
## Key Features:
- **Pattern Recognition**: Automatically identifies over a dozen harmonic patterns including standard and anti-patterns
- **Customizable Settings**: Options to use Heikin Ashi candles and alternate timeframes
- **Fibonacci Levels**: Configurable display of key Fibonacci retracement levels
- **Entry and Exit Signals**: Clear buy/sell signals with visual triangles above/below bars
- **Trade Management**: Automatic take-profit and stop-loss levels based on Fibonacci relationships
- **Visual Aids**: Color-coded backgrounds to highlight active trade zones
- **Alert System**: Customizable alert messages for trade entries and exits
## How It Works:
The indicator uses a zigzag function to identify significant price pivots, then analyzes the relationships between these pivots to detect specific harmonic patterns. When a valid pattern forms and price reaches the entry zone (defined by a Fibonacci level), the indicator generates a trade signal.
Each pattern has specific Fibonacci ratio requirements between its points, and the indicator continuously scans for these relationships. Trade management is handled automatically with predefined take-profit and stop-loss levels.
This version specifically addresses repainting issues that are common in pattern-detection indicators, making it more reliable for both backtesting and live trading.
Harmonic Trading System Educational (Source Code)This indicator was intended as educational purpose only for Harmonic Patterns using XABCD Pattern Tool.
This indicator was build upon Harmonic Trading : Volume One and Harmonic Trading : Volume Three, written by Scott M Carney.
Harmonic Trading System consist of 3 important elements such as Trade Identification, Trade Execution and Trade Management, each of these element description can be hover at each label.
Harmonic Trading System
1. Trade Identification
This technique use historically proven and repetitive price patterns that focus on overbought and oversold signals generated by price action.
Understanding parameters is critical to define specific opportunities based on individual harmonic pattern including ratio is important.
2. Trade Execution
During harmonic pattern is complete, must focus actual trade within specific time period.
3. Trade Management
Specific Initial Price Objective (IPO) based on risk and opportunity.
Indikator ini bertujuan sebagai pendidikan sahaja untuk Harmonic Pattern menggunakan XABCD Pattern Tool.
Indikator ini dibina berdasarkan buku Harmonic Trading : Volume One dan Harmonic Trading : Volume Three, ditulis oleh Scott M Carney.
Harmonic Trading System mengandungi 3 element penting seperti Trade Identification, Trade Execution dan Trade Management, penerangan setiap elemen boleh didapati dengan meletak mouse pada label.
Harmonic Trading System
1. Trade Identification
Teknik ini menggunakan price patterns yang berulang dan sejarahnya terbukti yang fokus pada signal overbought dan oversold terhasil daripada price action.
Memahami parameter adalah penting untuk mengenalpasti peluang secara spesifik berdasarkan harmonic patern yang tertentu termasuk ratio adalah penting.
2. Trade Execution
Semasa harmonic pattern adalah lengkap, mestilah focus pada trade yang sebenar dalam jangka masa yang spesifik.
3. Trade Management
Initial Price Objective (IPO) secara spesifik berdasarkan risiko dan peluang.
Indicator features :
1. List XAB=CD patterns including ratio and reference page.
2. For desktop display only, not for mobile.
3. Hover to label to display tooltip (example Trade identification).
Kemampuan indikator :
1. Senarai XAB=CD pattern termasuk ratio and rujukan muka surat.
2. Untuk paparan desktop sahaja, bukan untuk mobile.
3. Letak mouse pada labell untuk memaparkan tooltip (example Trade identification).
FAQ
1. Credits / Kredit
Scott M Carney, Harmonic Trading : Volume One
Scott M Carney, Harmonic Trading : Volume Three
2. Pattern and Chapter involved / Pattern dan Bab terlibat
Bullish Harmonic Trade Management Model - Harmonic Trading: Volume One - Page 209
Bearish Harmonic Trade Management Model - Harmonic Trading: Volume One - Page 220
The Harmonic Trading Process - Harmonic Trading: Volume Three - Page 42 to 44
Bullish Phases of Trading - Harmonic Trading: Volume Three - Page 48
Bearish Phases of Trading - Harmonic Trading: Volume Three - Page 50
3. Code Usage / Penggunaan Kod
Free to use for personal usage but credits are most welcomed especially for credits to Scott M Carney.
Bebas untuk kegunaan peribadi tetapi kredit adalah amat dialu-alukan terutamanya kredit kepada Scott M Carney.
Bullish Harmonic Trading System
Bearish Harmonic Trading System

Harmonic Pattern Educational Volume 2 (Source Code)This indicator was intended as educational purpose only for Harmonic Patterns using XABCD Pattern Tool.
This indicator was build upon Harmonic Trading : Volume Two, which was continuation from Harmonic Trading : Volume One and The Harmonic Trader, written by Scott M Carney.
Explaination was similar to previous build, build 0 and build 1 .
Volume 2 introduce Harmonic Ratio Progression, which result new patterns such as 5-0 and Alternate Bat.
Indikator ini bertujuan sebagai pendidikan sahaja untuk Harmonic Pattern menggunakan XABCD Pattern Tool.
Indikator ini dibina berdasarkan buku Harmonic Trading : Volume Two, juga sambungan daripada Harmonic Trading : Volume One and The Harmonic Trader, ditulis oleh Scott M Carney.
Penerangan yang sama berdasarkan binaan lepas, build 0 and build 1 .
Volume 2 memperkenalkan Harmonic Ratio Progression, membolehkan pattern baru seperti 5-0 dan Alternate Bat.
Indicator features :
1. List XAB=CD patterns including ratio and reference page.
2. For desktop display only, not for mobile.
Kemampuan indikator :
1. Senarai XAB=CD pattern termasuk ratio and rujukan muka surat.
2. Untuk paparan desktop sahaja, bukan untuk mobile.
FAQ
1. Credits / Kredit
Scott M Carney, Harmonic Trading : Volume One
2. Pattern and Chapter involved / Pattern dan Bab terlibat
Bullish 5-0 - Page 79
Bearish 5-0 - Page 88
Bullish Alternate Bat - Page 103
Bearish Alternate Bat - Page 106
3. Code Usage / Penggunaan Kod
Free to use for personal usage but credits are most welcomed especially for credits to Scott M Carney.
Bebas untuk kegunaan peribadi tetapi kredit adalah amat dialu-alukan terutamanya kredit kepada Scott M Carney.
5-0
Alternate Bat

Harmonic Pattern Educational Volume 1 (Source Code)This indicator was intended as educational purpose only for Harmonic Patterns using XABCD Pattern Tool.
This indicator was build upon Harmonic Trading : Volume One, which was continuation from The Harmonic Trader, written by Scott M Carney.
From the previous build , only Gartley and Butterfly were explained ideally based on The Harmonic Trader.
For this buid, Gartley and Butterfly were further refined and additional patterns such as Bat, Crab and Deep Crab were born based on Harmonic Trading : Volume One.
Explaination was similar to previous build . In addition, Perfect Patterns are added except for Deep Crab.
Indikator ini bertujuan sebagai pendidikan sahaja untuk Harmonic Pattern menggunakan XABCD Pattern Tool.
Indikator ini dibina berdasarkan buku Harmonic Trading : Volume One, juga sambungan daripada The Harmonic Trader, ditulis oleh Scott M Carney.
Berdasarkan binaan lepas , cuma Gartley dan Butterfly diterangkan secara ideal berdasarkan The Harmonic Trader.
Untuk binaan ini, Gartley dan Butterfly telah dihalusi dan pattern tambahan seperti Bat, Crab and Deep Crab telah lahir berdasarkan Harmonic Trading : Volume One.
Penerangan yang sama berdasarkan binaan lepas . Tambahan, Perfect Pattern telah ditambah kecuali untuk Deep Crab.
Indicator features :
1. List XAB=CD patterns including ratio and reference page.
2. For desktop display only, not for mobile.
Kemampuan indikator :
1. Senarai XAB=CD pattern termasuk ratio and rujukan muka surat.
2. Untuk paparan desktop sahaja, bukan untuk mobile.
FAQ
1. Credits / Kredit
Scott M Carney, Harmonic Trading : Volume One
2. Pattern and Chapter involved / Pattern dan Bab terlibat
Bullish Ideal Bat - Page 72
Bearish Ideal Bat - Page 83
Bullish Perfect Bat - Page 91
Bearish Perfect Bat - Page 94
Bullish Ideal Gartley - Page 99
Bearish Ideal Gartley - Page 106
Bullish Perfect Gartley - Page 115
Bearish Perfect Gartley - Page 118
Bullish Ideal Crab - Page 123
Bearish Ideal Crab - Page 130
Bullish Perfect Crab - Page 143
Bearish Perfect Crab - Page 146
Bullish Ideal Deep Crab - Page 137
Bearish Ideal Deep Crab - Page 140
Bullish Ideal Butterfly - Page 150
Bearish Ideal Butterfly - Page 158
Bullish Perfect Butterfly - Page 163
Bearish Perfect Butterfly - Page 166
3. Code Usage / Penggunaan Kod
Free to use for personal usage but credits are most welcomed especially for credits to Scott M Carney.
Bebas untuk kegunaan peribadi tetapi kredit adalah amat dialu-alukan terutamanya kredit kepada Scott M Carney.
Ideal / Perfect Bat
Ideal / Perfect Gartley
Ideal / Perfect Crab
Ideal Deep Crab
Ideal / Perfect Butterfly

Harmonic Trend Pulse1. Overview
The Harmonic Trend Pulse Indicator is a technical analysis tool designed for use on price charts. It combines elements of trend detection and harmonic moving averages to provide users with visual insights into market dynamics. The indicator is adaptable to different market conditions and is structured to aid in understanding price movements without making predictions.
2. Key Parameters
The indicator's performance relies on three adjustable settings:
Length: Defines the lookback period used to calculate the midpoint of price movements based on the highest and lowest points within the selected range.
Center: A smoothing parameter that affects how sensitive the trendline is to changes in the market. Higher values lead to a smoother trendline, while lower values make it more reactive.
HMA Length: This is the length for calculating the Harmonic Moving Average (HMA), which is a weighted moving average that helps filter out noise from price data, offering a cleaner view of the underlying trend.
3. Indicator Calculation
The indicator works as follows:
Midpoint Calculation: It first calculates the midpoint of the price using the highest high and lowest low over the given Length. This midpoint is then smoothed using an Exponential Moving Average (EMA) based on the Center value.
Harmonic Moving Average (HMA):
The HMA is calculated by first applying a Weighted Moving Average (WMA) over half the HMA Length and the full HMA Length.
It then computes the final trendline using the HMA formula, which smooths out short-term price fluctuations to provide a more accurate representation of the trend.
4. Visual Interpretation
The indicator plots the HMA trendline on the chart, with its color changing based on the market's direction:
Green Line: Indicates an upward trend when the current HMA value is higher than the previous bar's HMA.
Red Line: Indicates a downward trend when the current HMA value is lower than the previous bar's HMA.
This color-coded visual allows traders to quickly identify the current market trend and assess its strength.
5. Key Benefits
Clear Trend Detection: The combination of trend logic and the harmonic moving average helps users spot market direction changes quickly.
Noise Reduction: The Harmonic Moving Average (HMA) filters out short-term price fluctuations, making it easier to observe the overall trend.
Customizable Parameters: Traders can adjust the Length, Center, and HMA Length settings to tailor the indicator's sensitivity to their preferred trading style.
6. Conclusion
The Harmonic Trend Pulse Indicator provides a flexible and effective tool for tracking market trends. By using a combination of advanced moving averages and trend detection techniques, it offers traders valuable insights into the price dynamics of various assets. Its simple yet powerful visualization helps traders make informed decisions based on current market conditions.

Harmonic Strings and Oscillations [AstroHub] Harmonic Strings and Market Oscillations Indicator
Welcome to the exciting world of trading with the Harmonic Strings and Market Oscillations indicator, crafted using cutting-edge principles of string theory and harmonic oscillations. 🚀 This innovative indicator provides precise trading signals by analyzing market dynamics.
Unique Features of the Indicator:
Harmonic Strings and Market Oscillations stand out for its originality in applying string theory principles. The indicator's calculations are based on mathematical concepts, ensuring accurate identification of entry and exit points in the market. 🔍
Key Concepts and Calculations:
The indicator utilizes harmonic oscillation formulas, where each parameter (string length, amplitude, frequency) plays a crucial role in analyzing market fluctuations. These calculations offer precise signals for decision-making in trading operations. 📈
Application in Various Strategies:
Long-Term Investing:
Increase the "String Length" to identify long-term trends.
Example: Set "String Length" to a higher level (e.g., 200) to better identify long-term trends in stocks.
Example Usage: Long-term trend in stocks: Set "String Length" to 200 to effectively identify stable long-term trends.
Moving Market Movements:
Decrease "String Length" and increase "Frequency of Oscillations" to detect short-term movements.
Example: Set "String Length" to a lower level (e.g., 50) and increase "Frequency of Oscillations" to effectively identify short-term movements in the currency market.
Example Usage: Intraday trading on the currency market: Set "String Length" to 50 to catch short-term trends.
These variations allow flexible adjustment of the indicator according to your trading strategies and timeframes. Experiment with parameters to find the optimal combination to achieve your specific goals in financial markets. 💼
Ease of Use:
The indicator provides access to parameters such as "String Length," "Amplitude of Oscillations," "Frequency of Oscillations," and "Entry Threshold." This ensures flexibility in customization based on the trader's individual preferences.
Visual Signals and Alerts:
Use color-coded bars to highlight entry and exit points. Apply alerts for timely responses to market opportunities. 🚨
Non-Programmer Usage Example:
Open the indicator settings.
Adjust "String Length" based on your trading strategy.
Fine-tune "Amplitude" to control signal strength.
Experiment with "Frequency" to adapt to different market conditions.
By integrating various usage strategies, Harmonic Strings and Market Oscillations becomes your reliable tool for adapting to diverse market conditions and achieving success in trading. 🌐💹
Regression Channel Alternative MTF█ OVERVIEW
This indicator displays 3 timeframes of parallel channel using linear regression calculation to assist manual drawing of chart patterns.
This indicator is not true Multi Timeframe (MTF) but considered as Alternative MTF which calculate 100 bars for Primary MTF, can be refer from provided line helper.
The timeframe scenarios are defined based on Position, Swing and Intraday Trader.
█ INSPIRATIONS
These timeframe scenarios are defined based on Harmonic Trading : Volume Three written by Scott M Carney.
By applying channel on each timeframe, MW or ABCD patterns can be easily identified manually.
This can also be applied on other chart patterns.
█ CREDITS
Scott M Carney, Harmonic Trading : Volume Three (Reaction vs. Reversal)
█ TIMEFRAME EXPLAINED
Higher / Distal : The (next) longer or larger comparative timeframe after primary pattern has been identified.
Primary / Clear : Timeframe that possess the clearest pattern structure.
Lower / Proximate : The (next) shorter timeframe after primary pattern has been identified.
Lowest : Check primary timeframe as main reference.
█ EXAMPLE OF USAGE / EXPLAINATION

Harmonic Pattern Educational Volume 0 (Source Code)This indicator was intended as educational purpose only for Harmonic Patterns using XABCD Pattern Tool.
Gartley and Butterfly patterns were ideal patterns explained from The Harmonic Trader written by Scott M Carney.
Some values are further updated later in Harmonic Trading: Volume Three, also by Scott M Carney.
The Harmonic Trader book was also known as Harmonic Trading: Volume Zero.
Usually Bullish Patterns show as "M" shape while Bearish Patterns show as "W" shape.
";" indicates range, example : 1.27;1.618 meaning that value between 1.27 to 1.618.
Indikator ini bertujuan sebagai pendidikan sahaja untuk Harmonic Pattern menggunakan XABCD Pattern Tool.
Pattern Gartley dan Butterfly, juga sebagai pattern ideal telah diterangkan dari buku The Harmonic Trader ditulis oleh Scott M Carney.
Beberapa nilai kemudiannya telah dikemaskini dalam Harmonic Trading: Volume Three, juga oleh Scott M Carney.
Buku The Harmonic Trader book juga dikenali sebagai Harmonic Trading: Volume Zero.
Kebiasaanya Bullish Pattern tunjuk sebagai bentuk "M" manakala Bearish Pattern tunjuk sebagai bentuk "W".
";" menunjukkan range, contoh : 1.27;1.618 bermaksud nilai 1.27 hingga 1.618.
Indicator features :
1. List XAB=CD patterns including ratio and reference page.
2. For desktop display only, not for mobile.
Kemampuan indikator :
1. Senarai XAB=CD pattern termasuk ratio and rujukan muka surat.
2. Untuk paparan desktop sahaja, bukan untuk mobile.
FAQ
1. Credits / Kredit
Scott M Carney, The Harmonic Trader
2. Pattern and Chapter involved / Pattern dan Bab terlibat
Bullish Ideal Gartley - Page 160
Bearish Ideal Gartley - Page 171
Bullish Ideal Butterfly - Page 194
Bearish Ideal Butterfly - Page 204
3. Code Usage / Penggunaan Kod
Free to use for personal usage but credits are most welcomed especially for credits to Scott M Carney.
Bebas untuk kegunaan peribadi tetapi kredit adalah amat dialu-alukan terutamanya kredit kepada Scott M Carney.
Bullish (M) / Bearish (W) Ideal Gartley
Bullish (M) / Bearish (W) Ideal Butterfly
