Open = High / Low MarkerOpen = High / Low Marker Open = High / Low Marker Open = High / Low Marker Open = High / Low Marker Open = High / Low Marker Open = High / Low Marker Open = High / Low Marker
在脚本中搜索"high low"

Previous session High/Low – Asia London USA Overview
This indicator automatically plots the Previous Day’s (PD) session Highs and Lows for the Asia (Tokyo), London, and USA (New York) trading sessions.
Each session is color-coded for clarity:
🟩 Asia (Green)
🟥 London (Red)
🟦 USA (Blue)
At the close of each session, the indicator records that session’s high and low, draws horizontal lines across the chart, and labels them neatly in the center of each range — above the high and below the low for perfect visual balance.
⚙️ How It Works
The script continuously tracks the current high and low within each session.
When a session closes, those values are locked in as the PD High and PD Low.
Clean lines and centered labels are drawn immediately.
The labels automatically offset slightly above or below the line to avoid overlap, with user-controlled spacing.
This helps traders quickly identify where price interacts with the previous session’s structure, a core concept for many session-based and liquidity-based strategies.
🧭 Sessions and Timezones
Each market session runs in its native timezone, so you can align them perfectly to your chart or your preferred trading hours:
Asia Session: Default 08:30 – 11:00 (Australia/Adelaide time)
London Session: Default 08:00 – 10:00 (Europe/London)
USA Session: Default 09:30 – 16:00 (America/New_York)
You can change each session’s hours and timezone from the Inputs panel.
🎨 Customization
In the Inputs menu you can:
Toggle each session on or off
Choose line color and thickness
Enable or disable labels
Adjust vertical offset (ticks) for label spacing
“High label offset” – moves label further above the high line
“Low label offset” – moves label further below the low line
These adjustments make it easy to keep charts clean and readable on any instrument or timeframe.
📈 Practical Use
This indicator is ideal for:
Session traders who mark PD Highs/Lows as liquidity zones
London or NY session scalpers who watch for breakouts, fakeouts, or reversals
ICT / Smart Money Concepts users wanting automatic session reference levels
Anyone wanting a quick visual map of inter-session structure

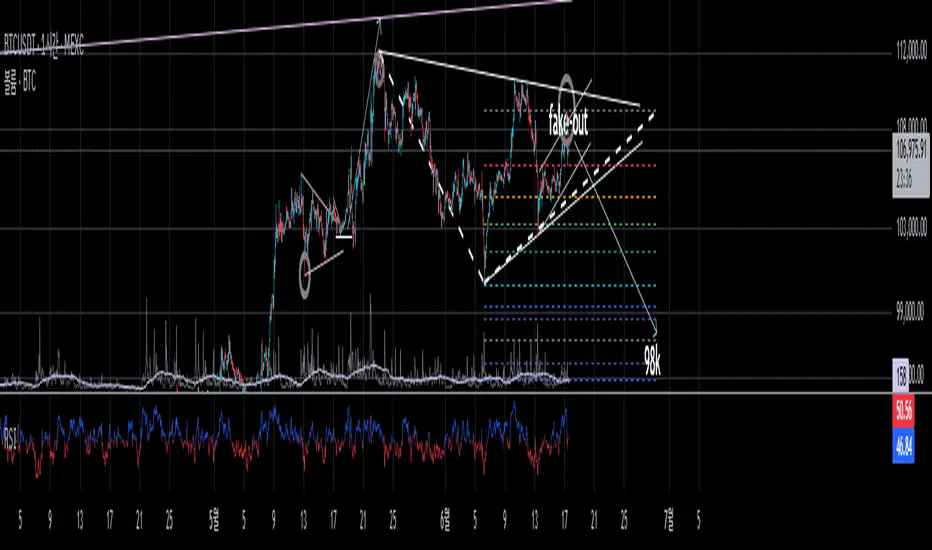
Previous Day & Week High/Low LevelsPrevious Day & Week High/Low Levels is a precision tool designed to help traders easily identify the most relevant price levels that often act as strong support or resistance areas in the market. It automatically plots the previous day’s and week’s highs and lows, as well as the current day’s developing internal high and low. These levels are crucial reference points for intraday, swing, and even position traders who rely on price action and liquidity behavior.
Key Features
Previous Day High/Low:
The indicator automatically draws horizontal lines marking the highest and lowest prices from the previous trading day.
These levels are widely recognized as potential zones where the market may react again — either rejecting or breaking through them.
Previous Week High/Low:
The script also tracks and displays the high and low from the last completed trading week.
Weekly levels tend to represent stronger liquidity pools and broader institutional zones, which makes them especially important when aligning higher timeframe context with lower timeframe entries.
Internal Daily High/Low (Real-Time Tracking):
While the day progresses, the indicator dynamically updates the current day’s internal high and low.
This allows traders to visualize developing market structure, identify intraday ranges, and anticipate potential breakouts or liquidity sweeps.
Multi-Timeframe Consistency:
All levels — daily and weekly — remain visible across any chart timeframe, from 1 minute to 1 day or higher.
This ensures traders can maintain perspective and avoid losing track of key zones when switching views.
Customizable Visuals:
The colors, line thickness, and label visibility can be easily adjusted to match personal charting preferences.
This makes the indicator adaptable to any trading style or layout, whether minimalistic or detailed.
How to Use
Identify Key Reaction Zones:
Observe how price interacts with the previous day and week levels. Rejections, consolidations, or clean breakouts around these lines often signal strong liquidity areas or potential directional moves.
Combine with Market Structure or Liquidity Concepts:
The indicator works perfectly with supply and demand analysis, liquidity sweeps, order block strategies, or simply classic support/resistance techniques.
Scalping and Intraday Trading:
On lower timeframes (1m–15m), the daily levels help identify intraday turning points.
On higher timeframes (1h–4h or daily), the weekly levels provide broader context and directional bias.
Risk Management and Planning:
Using these levels as reference points allows for more precise stop placement, target setting, and overall trade management.
Why This Indicator Helps
Markets often react strongly around previous highs and lows because these zones contain trapped liquidity, pending orders, or institutional decision points.
By having these areas automatically mapped out, traders gain a clear and objective view of where price is likely to respond — without needing to manually draw lines every day or week.
Whether you’re a beginner still learning about price structure, or an advanced trader refining entries within liquidity zones, this tool simplifies the process and keeps your charts clean, consistent, and data-driven.

Key-Levels - D/W/M High-Low + Fib + MA🧭 Key-Levels – D/W/M High-Low + Fibonacci + Moving Averages
A complete multi-timeframe analysis toolkit that combines Daily, Weekly, and Monthly high/low levels, Fibonacci retracements, and customizable moving averages — all in one clean, efficient display.
Ideal for traders who want to identify key reaction zones, retracement levels, and trend alignment across multiple timeframes.
🔹 Features
1. Prior High/Low Levels
Plots Daily (PDH/PDL), Weekly (PWH/PWL), and Monthly (PMH/PML) key levels
Adjustable colors, styles (Solid / Dashed / Dotted), and line widths
Optional midline display for each timeframe
Displays live labels with price values and % difference from current close
Extend lines rightward to project future price interactions
2. Fibonacci Retracement
Auto-detects swing highs/lows using configurable pivot lengths
Smart pivot logic prioritizes major swings based on % span
Auto-orients retracements depending on trend direction
Customizable visibility and color for each Fibonacci level
Supports 0.236 → 1.618 levels, with optional auto-extension in uptrend scenarios
Displays ratio + price for each level label
3. Pivot Labels
Optionally show pivot high/low labels with customizable text and background colors
Independent control of left/right length and label style
4. Moving Averages
Up to three customizable MAs (default: 8 EMA, 21 EMA, 50 SMA)
Choose between EMA or SMA for each
Toggle individual or all moving averages
Adjustable lengths, colors, and line widths
5. Alerts
Built-in alert condition for price crossing a user-defined level
Clean alert message format with ticker symbol and live price
⚙️ Customization
Flexible style controls for lines, labels, and colors
Adjustable right-extension length for projecting levels
Font size and visibility toggles for all elements
Smart grouping for intuitive settings management
📈 Ideal For
Identifying key reversal or breakout zones
Spotting Fibonacci confluence between retracements and prior highs/lows
Tracking trend structure via multi-timeframe MAs
Swing traders, intraday traders, and technical analysts
💡 Summary
Key-Levels – D/W/M High-Low + Fib + MA is a professional-grade indicator designed to simplify complex multi-timeframe analysis.
It helps you see the bigger picture, find actionable zones, and trade with confidence.
🧩 Compatible with any market and timeframe.

True High/Low RSI for DivergenceThis Pine Script creates a highly specialized RSI (Relative Strength Index) indicator designed to provide a more accurate signal for divergence trading. Its official title is "True High/Low RSI for Divergence."
Here is a breakdown of its core features:
1. Dual RSI Calculation based on Highs and Lows:
Unlike a standard RSI that typically uses the closing price of a candle, this indicator calculates two separate RSI lines:
A "High RSI" : This line calculates the RSI based on the high price of each candle. It is intended to track momentum peaks more accurately.
A "Low RSI" : This line calculates the RSI based on the low price of each candle. It is designed to track momentum troughs more accurately.
The main purpose of this separation is to avoid the potential errors that can occur when using an average price (like the close or hl2) during periods of high volatility. By using the true extremes of the price candles, the indicator aims to show a more "true" representation of momentum for identifying divergences between price and the indicator.
2. Dynamic Transparency:
This is a key visual feature. The RSI lines are not always fully visible. They dynamically fade into view as they enter significant overbought or oversold zones:
The Low RSI line (red by default) is invisible when above a value of 50. As it drops from 49 towards 30, it becomes progressively more opaque (more visible). It reaches full opacity at an RSI value of 30, visually alerting the user to strengthening oversold conditions.
The High RSI line (blue by default) is invisible when below a value of 50. As it rises from 51 towards 70, it also becomes progressively more opaque. It is fully opaque at an RSI value of 70, highlighting strengthening overbought conditions.
3. User Customization:
The script allows for user flexibility. You can change:
The colors for both the High and Low RSI lines.
The RSI calculation length (default is 14).
The price source for each RSI line (though they are specifically designed to use high and low).
In summary, this indicator is a purpose-built tool for traders who rely on divergence. It provides a more precise and visually intuitive way to track momentum at its true peaks and troughs, helping to make more informed trading decisions.
Swing High/Low by %REnglish Description
Swing High/Low by %R
This indicator identifies potential swing high and swing low points by combining William %R overbought/oversold turning points with classic swing price structures.
Swing High: Detected when William %R turns down from overbought territory and the price forms a local high (higher than both neighboring bars).
Swing Low: Detected when William %R turns up from oversold territory and the price forms a local low (lower than both neighboring bars).
This tool is designed to help traders spot possible market reversals and better time their entries and exits.
Customizable parameters:
Williams %R period
Overbought & Oversold thresholds
The indicator plots clear signals above/below price bars for easy visualization.
For educational purposes. Please use with proper risk management!
คำอธิบายภาษาไทย
Swing High/Low by %R
อินดิเคเตอร์นี้ใช้ระบุจุด Swing High และ Swing Low ที่มีโอกาสเป็นจุดกลับตัวของตลาด โดยอาศัยสัญญาณจาก William %R ที่พลิกกลับตัวบริเวณ overbought/oversold ร่วมกับโครงสร้างราคาแบบ swing
Swing High: เกิดเมื่อ William %R พลิกกลับลงจากเขต Overbought และราคาแท่งกลางสูงกว่าทั้งสองแท่งข้างเคียง
Swing Low: เกิดเมื่อ William %R พลิกกลับขึ้นจากเขต Oversold และราคาแท่งกลางต่ำกว่าทั้งสองแท่งข้างเคียง
ช่วยให้เทรดเดอร์สามารถมองเห็นโอกาสในการกลับตัวของราคา และใช้ประกอบการวางแผนจังหวะเข้าหรือออกจากตลาดได้อย่างแม่นยำมากขึ้น
ตั้งค่าได้:
ระยะเวลา Williams %R
ค่าขอบเขต Overbought & Oversold
อินดิเคเตอร์จะแสดงสัญลักษณ์อย่างชัดเจนบนกราฟเพื่อความสะดวกในการใช้งาน
ควรใช้ร่วมกับการบริหารความเสี่ยง

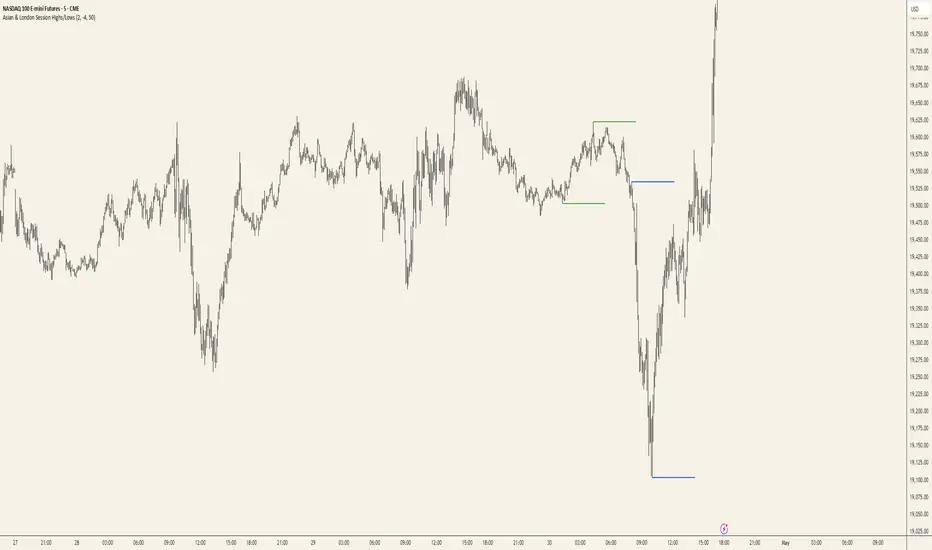
Asian & London Session Highs/LowsAsian & London Session Highs/Lows with Extendable Lines
This TradingView script automatically marks the highs and lows of the Asian and London trading sessions for the most recent day, allowing traders to identify key levels during these active periods. The lines representing the high and low of each session are drawn at the exact price point where the high/low occurred, and they extend to the right for a customizable number of bars, helping to visualize how the price reacts to these key levels after the session ends.
Key Features:
Session High/Low Tracking: Automatically tracks the highest and lowest points for the Asian and London sessions.
Extendable Lines: Lines start at the exact bar where the high/low occurred and can be extended to the right for a specified number of bars.
Timezone Adjustment: Allows you to input a timezone offset to adjust session times based on your local time or desired market time zone.
Customizable Colors & Line Thickness: Adjust the color and thickness of the session high and low lines to suit your visual preferences.
Clear & Precise Levels: Helps identify important support and resistance levels, making it easier to spot market reactions around session highs and lows.
This indicator is perfect for day traders and those looking to trade during specific market hours, offering clear visual markers of session boundaries and critical price levels.
Swing Highs and Lows between two InstrumentsThis Indicator will show you common Swing Points between two different trading symbols.
You can also use it to display the Swing Points of the current symbol or another symbol only.
When applying the Indicator to your chart it will ask you to put in a symbol. This symbol is used to find common Swing Points against the symbol that you have on your screen. Should you decide not to choose any symbol the indicator will instead mark all Swing Points for the current symbol.
Settings
Symbol: Choose any symbol that you want to compare to the selected symbol on your screen.
Sensitivity: The sensitivity defines how many candles left and right of a Swing Point have to be below (Swing High) or above (Swing Low) in order for the Indicator to mark it. A lower sensitivity will give a lot more Swing points, whereas a higher sensitivity will show less, but more important Swing Points.
Equal Highs Permissible: When calculating where a Swing Point is you can decide how you want equal highs and equal lows to be handled. The default is set to "yes" which means equal highs will be counted as if they were below (Swing High) or above (Swing Low). Choosing "no" will alter the indicators behaviour and only mark a Swing Point if all values within the sensitivity are below (Swing High) or above (Swing Low). As equal highs/lows are not below/above the Swing Point, but at the same level it will not mark the Swing Point.
Options:
You can choose to display Swing Highs and Lows for each symbol individually as well as Common Swing Points, which is the default. If you choose to display different Swing Points at the same time the visual order of importance is the following: common Swing Points > current symbol Swing Points > second symbol Swing Points.
You can also change the symbols and colors that mark the Swing Points or restrict the timeframes that the Indicator works on.

FVG, Swing, Target, D/W/M High Low Detector Basic by Trader Riaz"FVG, Swing, Target, D/W/M High Low Detector Basic by Trader Riaz " is a powerful TradingView indicator designed to enhance your trading strategy by identifying key market structures and levels. This all-in-one tool detects Fair Value Gaps (FVGs), Swing Highs/Lows, and previous Day, Previous Week, and Previous Month Highs/Lows, helping traders make informed decisions with ease.
Key Features:
Bullish & Bearish FVG Detection: Highlights Fair Value Gaps with customizable colors, labels, and extension options.
Swing Highs & Lows: Automatically detects and marks Swing Highs and Lows with adjustable display settings and extensions.
Next Target Levels: Identifies potential price targets based on market direction (rising or falling).
Daily, Weekly, and Monthly High/Low Levels: Displays previous day, week, and month highs/lows with customizable colors.
Customizable Settings: Fully adjustable inputs for colors, number of levels to display, and extension periods.
Clean Visuals: Intuitive and non-intrusive design with dashed lines, labels, and tooltips for better chart readability.
This indicator is ideal for traders looking to identify key price levels, improve market structure analysis, and enhance their trading strategies.
Happy Trading,
Trader Riaz

NFP High/Low Levels PlusNFP High/Low Levels Plus
Description:
This indicator stores the 12 most recent NFP (Non-Farm-Payroll) days and their values.
Values are captured from 0830 (NFP Release) until close of market
The High and Low values for each NFP month are drawn on the chart with horizontal lines.
- Labels indicating the month's high or low line are placed after the line
- Optionally the high/low price can be displayed additionally
Support and Resistance boxes can be drawn at the closest NFP level above and below the
current price.
- Boxes will automatically update as prices cross the NFP value
Macro Indicator
- This option displays a small table in the top right corner that says "Up" or " Down"
- The Macro Indicator can be used to judge the potential direction for the current month
- Macro direction is calculated by the following:
- UP: If two consecutive days both open and close above the most recent NFP High level
- DOWN: If two consecutive days both open and close below the most recent NFP Low level
Micro Indicator
- This option displays a small table in the top right corner that says "Up" or " Down"
- The Micro Indicator can be used to judge the potential direction for low timeframes 1H or
lower
- Micro direction is calculated by the following:
- UP: If two consecutive 10m candles close above the 20EMA
- DOWN: If two consecutive 10m candles close below the 20EMA
NFP Session Bars
- This feature draws an arrow at the bottom of the chart for each candle that falls within the
NFP session day
- This is useful for identifying NFP Days
Support / Resistance Table
- This displays a table bottom center showing the nearest high and low NFP line level
What is an NFP Day and why is it useful to add to my chart?
- NFP Days are one of the most important data releases monthly
- NFP (Non-Farm-Payroll) is the official release of 80% of the US workforce employed in
manufacturing, construction, and goods
- It does not include those who work on farms, private households, non-profit and
government workers
- Historically these high/low levels for the day create strong support and resistance levels
- Having them displayed on the chart can help identify potential strong levels and pivot points
Full Indicator with all options enabled and identified
Easily update NFP Release Days in the indicator settings
Modify various options: Show/Hide lines, labels, directional indicator tables, values tables
Adjust line width, offsets, colors, font sizes, box widths
Enable individual Directional Indicators and modify colors
Example of full indicator enabled
You can find a list of the NFP Release Schedule on the official US Bureau of Labor Statistics website. This is useful for updating the indicator settings with the correct dates

Custom Previous High/Low + Breakout AlertsThis indicator plots the previous high and low of the selected timeframe and alerts you when the price breaks either level.
To prevent spam, it triggers only once per period. If both the high and low break within the same period, you will receive an alert for each, but no duplicates if price hovers around these levels.
How to Set Up Alerts
1. Choose Your Timeframe
- In the indicator settings, select the timeframe for the high/low reference.
- Example: If you select 1 hour, the indicator will plot the previous 1-hour high and low and alert you when either level is broken
2. Create an Alert
- Condition → High/Low Break Alerts
- Function → Any alert() function call
Optional:
- If you want alerts only for high breakouts or low breakouts, select High Breakout or Low Breakout and use "Once Per Bar" as the trigger. (It will still alert only once per period.)
3. Setting Alerts for Multiple Timeframes
- If you want to create another alert for a different timeframe, first select the new timeframe in the indicator settings, then create a new alert
- Note: Previous alerts will continue to notify you based on the timeframe they were originally set for, even if you change the timeframe in the indicator settings.

AEST High-Low MarkerOverview
This TradingView indicator, AEST High-Low Marker, is designed to mark the highest and lowest price levels observed between 5:00 PM and 6:00 PM AEST and extend these levels visually on the chart only between 5:00 PM and 12:00 AM AEST.
Functionality
Time Conversion for AEST
Since TradingView operates in UTC, the script translates AEST (UTC+10 or UTC+11 during daylight savings) into UTC time.
The script starts tracking from 5:00 PM AEST (7 AM UTC) to 6:00 PM AEST (8 AM UTC).
The high and low lines will be displayed only between 5:00 PM and 12:00 AM AEST (7 AM to 2 PM UTC).
Real-Time High & Low Calculation
The indicator dynamically updates the session high and low as new candles form during the 5 PM - 6 PM AEST period.
It captures the maximum high and minimum low during this timeframe.
Line Display Restrictions
The session high and low lines will only be drawn between 5:00 PM and 12:00 AM AEST to prevent chart clutter.
The lines disappear after 12:00 AM AEST.
Visual Representation
Blue Line: Marks the session high recorded between 5 PM - 6 PM AEST.
Red Line: Marks the session low recorded between 5 PM - 6 PM AEST.
Both lines extend until 12 AM AEST and then disappear.
Use Case
This indicator is useful for traders looking to track key price levels formed between 5 PM and 6 PM AEST and observe how price interacts with these levels until midnight.
It is particularly beneficial for intraday and short-term trading strategies, allowing users to identify potential support and resistance zones based on early evening price action.

Swing High/Low (ZigZag) [ChartPrime]Swing High/Low (ZigZag) Indicator
The Swing High/Low (ZigZag) Indicator is a versatile tool for identifying and visualizing price swings, swing highs, and swing lows. It dynamically plots levels for significant price points while connecting them with a ZigZag line, enabling traders to analyze market structure and trends with precision.
⯁ KEY FEATURES
Swing Highs and Lows Detection
Accurately detects and marks swing highs and lows, providing a clear structure of market movements.
Real-Time ZigZag Line
Connects swing points with a dynamic ZigZag line for a visual representation of price trends.
Customizable Swing Sensitivity
Swing length input allows traders to adjust the sensitivity of swing detection to match their preferred market conditions.
Swing Levels with Shadows
Option to display swing levels with extended shadows for better visibility and market analysis.
Broken Levels Marking
Tracks and visually updates levels as dashed lines when broken, providing insights into shifts in market structure.
Swing Direction Display
At the top-right corner, the indicator displays the current swing direction (up or down) with a directional arrow for quick reference.
Interactive Labels
Marks swing levels with labels, showing the price of swing highs and lows for added clarity.
Dynamic Market Structure Analysis
Automatically adjusts ZigZag lines and levels as the market evolves, ensuring real-time updates for accurate trading decisions.
⯁ HOW TO USE
Analyze Market Trends
Use the ZigZag line and swing levels to identify the overall direction and structure of the market.
Spot Significant Price Points
Swing highs and lows act as potential support and resistance levels for trading opportunities.
Adjust Swing Sensitivity
Modify the swing length setting to match your trading strategy, whether scalping, day trading, or swing trading.
Monitor Broken Levels
Use the dashed lines of broken levels to identify changes in market dynamics and potential breakout or breakdown zones.
Plan Entries and Exits
Leverage swing levels and direction to determine optimal entry, stop-loss, and take-profit points.
⯁ CONCLUSION
The Swing High/Low (ZigZag) Indicator is a powerful tool for traders seeking to visualize price swings and market structure. Its real-time updates, customizable settings, and dynamic swing direction make it an invaluable resource for technical analysis and decision-making.

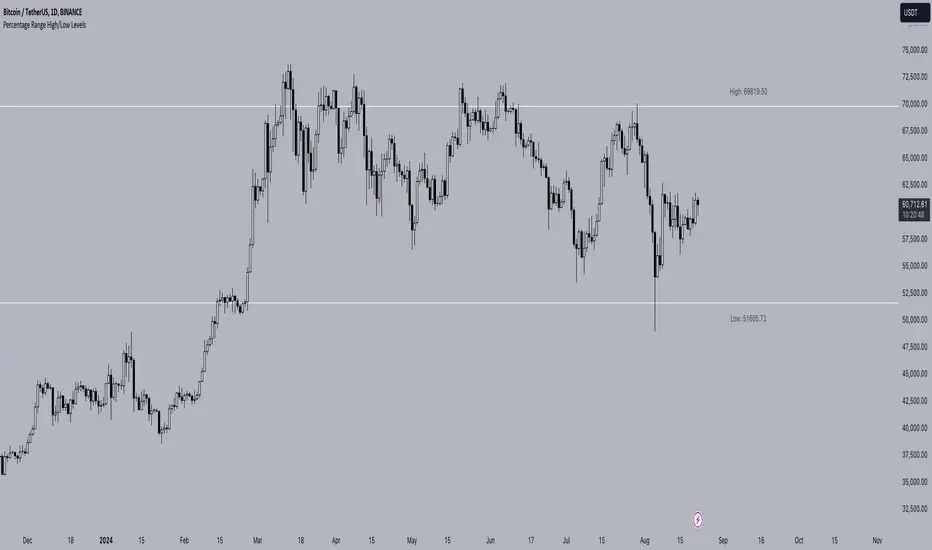
Percentage Range High/Low LevelsPercentage Range High/Low Levels Indicator
Overview
The "Percentage High/Low Levels" indicator is a versatile tool designed to help traders visualize key price levels that are a certain percentage away from the current price. Instead of using traditional volatility measures like the Average True Range (ATR), this script allows traders to plot lines above and below the current price based on a user-defined percentage. These levels can act as potential support and resistance zones, helping traders in decision-making processes such as setting targets, stop-losses, or identifying overbought and oversold conditions.
How It Works
Percentage-Based Calculation:
The script calculates two levels: a high level and a low level. These are determined by adding and subtracting a specified percentage from the current price. For example, if you set the percentage to 1%, the script will plot a line 1% above the current price (high level) and another line 1% below the current price (low level).
Timeframe Selection:
You can choose the timeframe over which the percentage levels are calculated. This means that the levels can be based on different timeframes, such as daily, weekly, or monthly data, depending on your trading strategy.
Customization Options:
Line Extension: The lines can be extended to the left, right, both directions, or neither, depending on your preference.
Colors: You can customize the colors of both the high and low lines and their respective labels.
Label Size: The size of the labels can be adjusted, allowing you to tailor the visibility of the levels to your charting needs.
Label Placement and Styling:
The labels indicating the price levels are placed above the lines to keep your chart clean and readable. The labels are transparent and do not have a background, ensuring they don't obscure any important chart information. You can also adjust the distance of the labels from the current bar using the label offset feature.
How to Use
Selecting the Percentage:
Choose a percentage that aligns with your trading strategy. A smaller percentage might be useful for intraday trading, while a larger percentage could be more appropriate for swing or position trading.
Choosing the Timeframe:
Set the timeframe to match the period over which you are analyzing the market. For example, if you are trading on a daily chart, you might want to select the daily timeframe.
Customizing Visuals:
Use the input options to adjust the colors, label sizes, and line extensions according to your preference. This helps in maintaining a chart setup that is both functional and visually appealing.
Interpreting the Levels:
The high and low levels can act as dynamic support and resistance levels. If the price approaches one of these levels, it may either reverse or break through, depending on the market conditions. Traders can use these levels to set stop-loss orders, take-profit targets, or even enter new positions based on price action around these zones.
Concepts Underlying the Calculation
The indicator is based on the concept of price percentage levels, which are straightforward yet powerful tools in technical analysis. Unlike volatility-based indicators that adapt to changing market conditions, percentage levels provide fixed reference points, allowing traders to gauge potential price movements in a consistent manner. This can be particularly useful in trending markets, where the price often respects certain percentage-based levels as it progresses in its direction.
By offering a clear, customizable approach to plotting these levels, the "Percentage High/Low Levels" indicator becomes a valuable addition to any trader's toolkit, regardless of the market or timeframe they are working with.
Best Practices
Testing and Validation: Before using this indicator in live trading, it is advisable to test it on historical data or in a demo environment to understand how it behaves in different market conditions.
Combination with Other Indicators: For enhanced accuracy, consider using this indicator in combination with trend indicators (like moving averages) or momentum oscillators (like RSI) to confirm potential reversal points or breakouts.
This indicator is suitable for traders looking to incorporate a systematic approach to identifying key price levels that are easy to interpret and adjust according to market conditions.
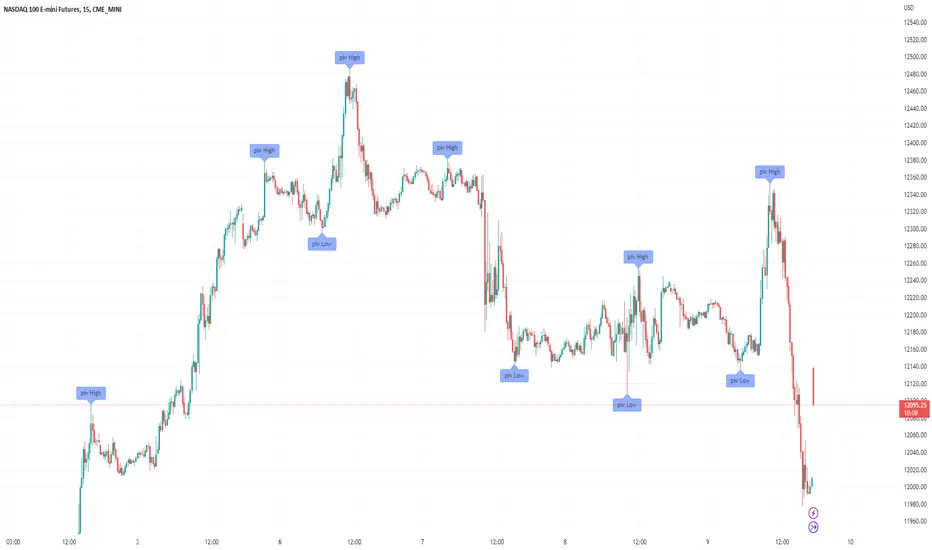
Breakout Detector (Previous MTF High Low Levels) [LuxAlgo]The Breakout Detector (Previous MTF High Low Levels) indicator highlights breakouts of previous high/low levels from a higher timeframe.
The indicator is able to: display take-profit/stop-loss levels based on a user selected Win/Loss ratio, detect false breakouts, and display a dashboard with various useful statistics.
Do note that previous high/low levels are subject to backpainting, that is they are drawn retrospectively in their corresponding location. Other elements in the script are not subject to backpainting.
🔶 USAGE
Breakouts occur when the price closes above a previous Higher Timeframe (HTF) High or below a previous HTF Low.
On the advent of a breakout, the closing price acts as an entry level at which a Take Profit (TP) and Stop Loss (SL) are placed. When a TP or SL level is reached, the SL/TP box border is highlighted.
When there is a breakout in the opposite direction of an active breakout, previous breakout levels stop being updated. Not reaching an SL/TP level will result in a partial loss/win,
which will result in the box being highlighted with a dotted border (default). This can also be set as a dashed or solid border.
Detection of False Breakouts (default on) can be helpful to avoid false positives, these can also be indicative of potential trend reversals.
This indicator contains visualization when a new HTF interval begins (thick vertical grey line) and a dashboard for reviewing the breakout results (both defaults enabled; and can be disabled).
As seen in the example above, the active, open breakout is colored green/red.
You can enable the setting ' Cancel TP/SL at the end of HTF ', which will stop updating previous TP/SL levels on the occurrence of a new HTF interval.
🔶 DETAILS
🔹 Principles
Every time a new timeframe period starts, the previous high and low are detected of the higher timeframe. On that bar only there won't be a breakout detection.
A breakout is confirmed when the close price breaks the previous HTF high/low
A breakout in the same direction as the active breakout is ignored.
A breakout in the opposite direction stops previous breakout levels from being updated.
Take Profit/Stop Loss, partially or not, will be highlighted in an easily interpretable manner.
🔹 Set Higher Timeframe
There are 2 options for choosing a higher timeframe:
• Choose a specific higher timeframe (in this example, Weekly higher TF on a 4h chart)
• Choose a multiple of the current timeframe (in this example, 75 minutes TF on a 15 min chart - 15 x 5)
Do mind, that when using this option, non-standard TFs can give less desired timeframe changes.
🔹 Setting Win/Loss Levels
The Stop Loss (SL) / Take Profit (TP) setting has 2 options:
W%:L% : A fixed percentage is chosen, for TP and SL.
W:L : In this case L (Loss-part) is set through Loss Settings , W (Win-part) is calculated by multiplying L , for example W : L = 2 : 1, W will be twice as large as the L .
🔹 Loss Settings
The last drawing at the right is still active (colored green/red)
The Loss part can be:
A multiple of the Average True Range (ATR) of the last 200 bars.
A multiple of the Range Cumulative Mean (RCM).
The Latest Swing (with Length setting)
Range Cumulative Mean is the sum of the Candle Range (high - low) divided by its bar index.
🔹 False Breakouts
A False Breakout is confirmed when the price of the bar immediately after the breakout bar returns above/below the breakout level.
🔹 Dashboard
🔶 ALERTS
This publication provides several alerts
Bullish/Bearish Breakout: A new Breakout.
Bullish/Bearish False Breakout: False Breakout detected, 1 bar after the Breakout.
Bullish/Bearish TP: When the TP/profit level has been reached.
Bullish/Bearish Fail: When the SL/stop-loss level has been reached.
Note that when a new Breakout causes the previous Breakout to stop being updated, only an alert is provided of the new Breakout.
🔶 SETTINGS
🔹 Set Higher Timeframe
Option : HTF/Mult
HTF : When HTF is chosen as Option , set the Higher Timeframe (higher than current TF)
Mult : When Mult is chosen as Option , set the multiple of current TF (for example 3, curr. TF 15min -> 45min)
🔹 Set Win/Loss Level
SL/TP : W:L or W%:L%: Set the Win/Loss Ratio (Take Profit/Stop Loss)
• W : L : Set the Ratio of Win (TP) against Loss (SL) . The L level is set at Loss Settings
• W% : L% : Set a fixed percentage of breakout price as SL/TP
🔹 Loss Settings
When W : L is chosen as SL/TP Option, this sets the Loss part (L)
Base :
• RCM : Range Cumulative Mean
• ATR : Average True Range of last 200 bars
• Last Swing : Last Swing Low when bullish breakout, last Swing High when bearish breakout
Multiple : x times RCM/ATR
Swing Length : Sets the 'left' period ('right' period is always 1)
Colours : colour of TP/SL box and border
Borders : Style border when breakout levels stop being updated, but TP/SL is not reached. (Default dotted dot , other option is dashed dsh or solid sol )
🔹 Extra
Show Timeframe Change : Show a grey vertical line when a new Higher Timeframe interval begins
Detect False Outbreak
Cancel TP/SL at end of HTF
🔹 Show Dashboard
Location: Location of the dashboard (Top Right or Bottom Right/Left)
Size: Text size (Tiny, Small, Normal)
See USAGE/DETAILS for more information

52 Week High/Low FibonacciThe primary purpose of this indicator is to calculate and plot the 52-week high and low prices along with the Fibonacci retracement levels on the price chart. Fibonacci levels are commonly used in trading to identify potential support, resistance, and price reversal points.
First, the script initializes the Fibonacci levels and their corresponding colors, which will be used to plot the levels on the chart. Next, it calculates the 52-week high and low prices by finding the highest and lowest prices over the last 252 trading days, approximately equivalent to one year. Then, it identifies the overall trend direction by comparing the number of bars since the highest high and the lowest low. If the highest high is more recent, the trend is considered downwards; if the lowest low is more recent, the trend is upwards.
The script then plots the Fibonacci retracement levels on the chart, using horizontal lines at the respective price levels. It also creates labels for each level, displaying the percentage and the price value. Additionally, it draws a line connecting the 52-week high and low prices, providing a visual representation of the price range during the 52-week period.
Pros of this indicator include:
-Automatic calculation and plotting of Fibonacci levels, saving time for traders
-Clear trend identification based on 52-week high and low prices
-Visually appealing and easy-to-read chart representation with color-coded levels
-Provides insight into potential price reversal areas based on widely used Fibonacci levels
Cons of this indicator include:
-Only works on daily timeframes, limiting its usefulness for intraday and weekly traders
-Assumes that the trend will continue in the same direction, which may not always be accurate in real-world markets
-Does not provide explicit buy or sell signals, leaving the trading decision-making process up to the trader
-Solely relies on Fibonacci levels, which may not always be accurate; it is recommended to use other technical indicators or strategies alongside this indicator for a comprehensive trading approach
In conclusion, the '52 Week High Low Fibonacci' indicator is a valuable tool for traders interested in using Fibonacci levels for identifying potential price reversal points. By automatically calculating and plotting these levels based on 52-week high and low prices, the indicator provides a clear, color-coded visual aid, which can be especially helpful for traders who base their strategies on these levels.
However, it's worth noting that this indicator is limited to daily timeframes and doesn't provide explicit buy or sell signals, requiring traders to incorporate their own analysis and judgement in their decision-making process. The indicator also operates on the assumption of trend continuation, which may not always hold true.
While it's a beneficial tool, relying solely on this indicator for trading decisions may not be advisable. It's best used in conjunction with other indicators and trading strategies, providing a more balanced and comprehensive approach to trading in the financial markets. As always, risk management should be a key part of any trading strategy.
**YOUR INSIGHTFUL FEEDBACK OR SUGGESTIONS FOR REVISIONS TO THIS CODE ARE HIGHLY APPRECIATED. PLEASE FEEL FREE TO SHARE YOUR THOUGHTS TO FOSTER ITS CONTINUAL IMPROVEMENT**

Filter-Out Weak Pivot highs/lows, Swing highs/lows: MethodJust a simple indicator for refining the standard method of finding Pivot highs & Lows; Allowing user to filter-out weak/flat/rounded Pivot highs/lows
-Aim of this is to get pivot highs & pivot lows coded to print more in line with what the eye would naturally be drawn to as an obvious pivot high/low.
-This uses local moving average around the pivot high/low together with user-input ATR multiple, to create a condition for filtering out lacklustre pivot highs/lows.
-Thought i'd publish this separately as a tool that other coders might find useful.
//inputs//
~adjust looback/lookforward for Pivot highs/lows
~adjust 'spikiness' index to filter out less impressive pivot highs/lows (higher number = more selective)
Koalafied EdgesIndicator based on user selected periods 'edges' (highs/lows). Includes One-Time-Framing and sweeps of levels.
User selection of previous Session/Day/Week highs and lows. These will plot over the relevant period once it has completed. Intra-day there are three periods that can be plotted.
For now these are most relevant to crypto. It can be useful to think of previous levels being locations that are likely to contain liquidity that the market might sweep in the future,
as much like pivot points, traders stop orders can be found there. Session breaks are included to allow for clear delineation between user selected periods. Additionally the option
to colour the background of a specific period is given to the user, this can be useful as an aid for visual analysis of session behaviour over time.
Untapped Levels
Previous Levels (Highs/Lows) that price has not re-tested will remain on the chart. These are typically the levels that are swept for liquidity in future periods.
Sweeps
Sweeps are formed when a candle opens above/below a previous periods level, crosses it and closes back on the side of the open. Often can mark important
pivots in the market and potential reversals. Useful if you think of stop liquidity resting outside previous periods highs/lows. Market 'sweeps' the level,
taking liquidity and reverses. Alerts for these are included.
One-Time-Framing
Indicator shows One-Time-Framing (OTF) for user selection of Candle, Session, Day, and Weekly timeframes. The background between the periods highs and lows (or candle colour)
will display the OTF state. This is a Market Profile concept that isn't typically found in Tradingview Scripts.
OTF is a sequence of days or time period where you don’t get a break of the previous candles low (OTF Up) or high (OTF Down). Typically shows a market
that is trending in one direction. If it's an outside day then no OTF status, if it's an inside day then the previous period high or low hasn't been
breached so OTF status stays same.
Candle colouring. I've included the option to switch between OTF coloured candles or my Volume Extension candles. I find the Volume Extension Candles invaluable
in showing areas of high market participation and can be quite informative at significant levels often showing exhaustion at support/resistance or market strength on breakouts.
Candles not supported by rising volume are coloured black while those that are retain their colouring.
Important to note that this indicator plots prior levels only when the selected period has ended. So at the start of a new period, the high/low of the previous
period will be plotted, with untapped lines extended into the future. The indicator is designed to show you what 'has' happened and to provide areas
of interest where you may wish to initiate trades. The sweep signals are the only real-time plots.

[ADOL_]High/Low Finder Neweng.
High/Low Finder New version.
compare left / right. left is new, right is old.
Characteristic)
1. Added filtering check button. no filtering-high/low-3 stages of probability up high/low
2. Reinforcement of logic
3. Change the notation of arrows
Time frame)
You can use it all the time,
Recommended among them: 3 or 15 minutes (3minutes : scalping), 1hour
Mark)
no filtering/filtering high/low point: arrow
Probability up filtering: high point (orange), low point (blue) lettering
Standard 1)
Signal generating rod = reference rod
The breakthrough of the high and low points of the reference rod and the candle around the reference rod
Check the flow and catch the loss cut through the pressed neck.
Standard 2)
Draw a trend line from the signal generation peak to the next signal section
We use a breakthrough strategy.
Applications)
trend line with filtering
kor.
High / Low Finder 새 버전.
왼쪽 / 오른쪽을 비교합니다. 왼쪽은 새롭고 오른쪽은 오래되었습니다.
특성)
1. 필터링 체크 버튼이 추가되었습니다. 필터링 없음-높음 / 낮음 3 단계 확률 높음 / 낮음
2. 논리 강화
3. 화살표 표기법 변경
기간)
올타임가능
추천 : 3 ~ 15 분 (3 분 : 스캘핑), 1 시간
표시)
필터링 및 필터링 없는 고점,저점 : 화살표
확률업 필터링 : 고점 (주황색), 저점 (파란색) 글자로 표기
표준 1)
신호 발생 봉 = 기준 봉
기준 봉의 고점, 저점과 흐름을 확인
흐름을 확인하고 눌림목 체크
표준 2)
신호 생성 피크에서 다음 신호 섹션까지 추세선을 그립니다.
표준2응용)
필터링이있는 추세선

[ADOL_]High/Low Finders
High/Low Finders
Logic)
It is a finder that finds the signal generation of the high and low points through the candle pattern.
Candle pattern logic is composed of 6 conditions.
Chart principle)
-Chart Formula 1
Chart = Horizontal + Vertical = Price + Time
-Chart Formula 2
Chart = P+L+S+M
Point: Reference point such as inflection point and RBI
Line: Trend line, resistance line, support line, etc.
Side: Mid-range area, such as side of triangular convergence and side of box circle
Market: The range of the large trend of bullish market, decline market, and sideways market
Point in the chart formula: This is a pattern that considers the inflection point.
Chart Principle) Matryoshka
Matryoshka's principle also applies to the time frame,
Of course, it can be used in any timeframe.
Time frame)
You can use it all the time,
Recommended among them: 5 or 15 minutes (fast signal)
function)
Finds the high/low point. Alerts are available.
Mark)
-Price acceleration momentum: Arrow signal above candle.
It shows the status of the trend sensitively (quickly).
-Korean notation of high/low = basic pattern
-(Secondary) High/Low Emoticon Mark = Complementary Pattern
The place where korean and emoticons overlap is strong,
Approach to short-term entry when a single signal occurs rather than overlapping
standard1)
Signal generating rod = reference rod
The breakthrough of the high and low points of the reference rod and the candle around the reference rod
Check the flow and catch the loss cut through the pressed neck.
Standard 2)
Draw a trend line from the signal generation peak to the next signal section
We use a breakthrough strategy.
Response)
Risk can be lowered when approaching by splitting.
Application) More strategies for users.
High/Low Finders(고점, 저점 탐색기)
로직)
캔들패턴을 통해 고점과 저점의 신호발생을 찾아주는 FINDER 입니다.
캔들패턴 로직에는 6가지의 조건이 복합구성되어 있습니다.
차트의 원리)
- 차트공식1
차트 = 가로 + 세로 = 가격 + 시간
- 차트공식2
차트 = 점선면장
점 : 변곡점, 타점 등의 기준점
선 : 추세선, 저항선, 지지선 등 단~중범위 흐름
면 : 삼각수렴의 면, 박스권의 면 등 중범위 영역
장 : 상승장,하락장,횡보장의 大추세 범위
차트의 공식중에서 점 : 변곡점을 고려한 패턴입니다.
차트원리) 마트료시카
마트료시카의 원리는 타임프레임에도 적용되므로
당연히 모든 타임프레임에서 사용 가능합니다.
타임프레임)
모든시간 사용가능하지만,
그중에서 굳이 추천 : 5, 15분봉(빠른 신호)
기능)
고점/저점을 찾아줍니다. 얼러트 사용 가능합니다.
표기)
- 가격가속모멘텀 : 캔들 위 화살표 신호.
트렌드의 상태를 민감하게(빠르게) 보여줍니다.
- 고점/저점의 한글표기 = 기본패턴
- (보조)고점/저점 이모티콘 표기 = 보완패턴
한글과 이모티콘의 중첩되는 자리가 강하며,
중첩이 아닌 단일 신호 발생시 단기적인 진입으로 접근
기준1)
신호발생봉 = 기준봉
기준봉의 고점, 저점의 돌파와 기준봉 주변 캔들의
흐름을 확인하고 눌림목을 통해 로스컷을 잡습니다.
기준2)
신호발생봉 이후 다음신호구간까지 추세선을 긋고
돌파전략을 구사합니다.
대응)
분할로 접근시 리스크를 낮출 수 있습니다.
예시)
응용) 더 많은 전략은 유저를 위해.

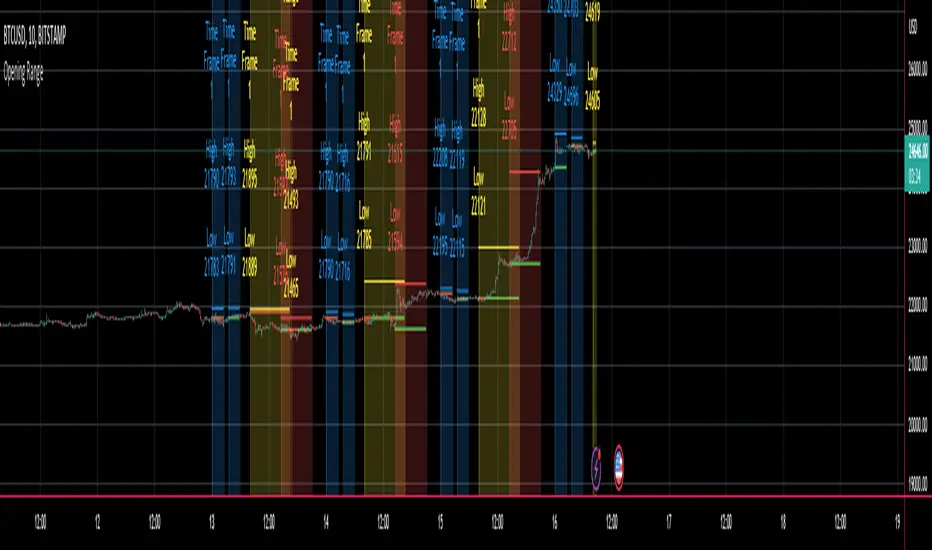
Multi Ticker Session Opening High Low RangeThe Multi Ticker Session Opening High Low Range Indicator by the Caretaker.
The original idea for this indicator came out of a request from Krown's Crypto Cave community member ZFelds.
This indicator is designed to display the High / Low Ranges of the "on chart" asset, at a chosen resolution from the opening time of, and for the duration of, the chosen Ticker Sessions (up to 3) .
Its function is to allow the user to easily keep track of the session times of the major world indices, and the reaction of the on chart assets price from the opening of the ticker sessions over the duration of the ticker sessions.
Typically used for a guide when scalp trading on low time-frames by plotting the opening 1 or 5 minute High/Low trading range of an asset during the start of a major market opening up an d making trading decisions based on the reaction of Price Action around those levels.
It does this by plotting High / Low Range bands (plus mid-lines) which displays the High and Low range of the on chart assets opening candle at the chosen time resolution for the chosen ticker (Defaults : SPX, NI225, UKX).
The Range bands fill colour changes depending on whether the chart asset closes candles within, above, or below the range (Default : Silver, Green, Red).
It plots optional Background "Session Bars" and "Session Banners" which function to clearly show the session.
The background "Session bars" can be set to plot just the first bar as a signal or on all session bars.
The "Session Banners" are horizontal lines of chosen width which "float" above the chart data.
Optional info text-boxes also "float" above the chart data and function to display the session opening range information.
(Ticker symbol, Opening range time resolution, Session open high & low).
The text-boxes can be set to full label or short label.
The text-boxes can be set to the left or center of the session.
The height offset by which the text-boxes and banners float above the highest high of the range is alterable in the settings.
The text-boxes and banners also have a "clash avoidance" function which will offset their heights to help avoid them clashing on screen (This offset is alterable in the settings).
CryptoSignalScanner - Double High/Low & Engulfing IndicatorDESCRIPTION:
This script has been designed to show the double high/low candle patterns and the Engulfing candles patterns.
• This scripts is based on RSI length.
• It displays a label when a Double High or Double Low candle pattern is detected.
• It displays a label when a Bullish Engulfing or Bearish Engulfing candle pattern is detected.
• It is also possibility to set a Double High/Low, Double High, Double Low, Bullish/Bearish Engulfing, Bullish Engulfing, or Bearish Engulfing alert.
HOW TO USE:
• When a Double High signal appears it means that we have probably or temporarily stopped the uptrend and could see a reversal. Most likely we will see a downtrend from here.
• When a Double Low signal appears it means that we have probably or temporarily stopped the downtrend and probably could see a reversal. Most likely we will see an uptrend from here.
• When a Bullish Engulfing candle appears it means that we probably made a reversal to the upside. Bullish Engulfing patterns are more likely to signal reversals when they are preceded by three or more red candlesticks.
• When a Bearish Engulfing candle appears it means that we probably made a reversal to the downside. Bearish Engulfing patterns are more likely to signal reversals when they are preceded by three or more green candlesticks.
• Wait for a clear reversal to buy or to sell. Use the Fibonacci tool together with the Eliot Waves to help you with this.
FEATURES:
• You can show/hide the labels based on RSI length and high/low input values.
• You can show/hide the labels based on the % candle match.
• You can show/hide the Double High/Low labels.
• You can show/hide the Bullish/Bearish Engulfing labels.
HOW TO GET ACCESS TO THE SCRIPT:
• Use the link below to subscribe to our indicators.
REMARKS:
• This advice is NOT financial advice.
• We do not provide personal investment advice and we are not a qualified licensed investment advisor.
• All information found here, including any ideas, opinions, views, predictions, forecasts, commentaries, suggestions, or stock picks, expressed or implied herein, are for informational, entertainment or educational purposes only and should not be construed as personal investment advice.
• We will not and cannot be held liable for any actions you take as a result of anything you read here.
• We only provide this information to help you make a better decision.
• While the information provided is believed to be accurate, it may include errors or inaccuracies.
Good Luck,
The CryptoSignalScanner Team

NY 9:30-9:35 High/Low Range📘 Script Description
This script automatically identifies and plots the high and low of the 5-minute candle formed between 9:30 AM and 9:35 AM New York time, which corresponds to the opening of the U.S. equity market.
The goal is to provide a clear reference level for intraday volatility, directional bias, and breakout levels.
🔍 Function Overview
■ 1. Detects the 9:30–9:35 NY Time Candle
The script converts chart timestamps into New York session time and automatically captures the 5-minute candle that forms between:
NY 9:30:00 → NY 9:35:00
■ 2. Automatically Draws Horizontal Lines
After identifying the high and low of this candle, the script draws:
High line → Red
Low line → Blue
Lines start exactly at the 9:30 timestamp
Lines extend 3 hours into the future (until NY 12:30)
Lines do not extend beyond 3 hours (prevents unwanted diagonal lines or lines from previous days)
■ 3. Label Display at NY 20:00
The script places a label at New York 20:00, marking:
“9:30 High” for the high line
“9:30 Low” for the low line
This allows you to instantly identify the key reference levels at the end of the trading day.
■ 4. Auto-Removal at NY 20:00
At NY 20:00, both the lines and the labels are automatically deleted.
No old lines remain on the chart, ensuring clarity and accuracy for each new trading day.
🎯 Purpose and Use Cases
This script is highly useful for:
Determining intraday direction after the NY open
Tracking volatility spikes at the U.S. equity market open
Identifying breakout levels
Using high/low as dynamic support and resistance throughout the day
Understanding market context during economic events or high-impact sessions
The 9:30–9:35 range is one of the most watched price zones in global markets, often serving as the day’s initial liquidity sweep.
📝 Key Features
Accurate New York time conversion
Clean horizontal lines (no previous-day diagonal lines)
Labels positioned clearly at NY 20:00
No unnecessary visuals—simple and effective
Lightweight script with minimal chart impact
