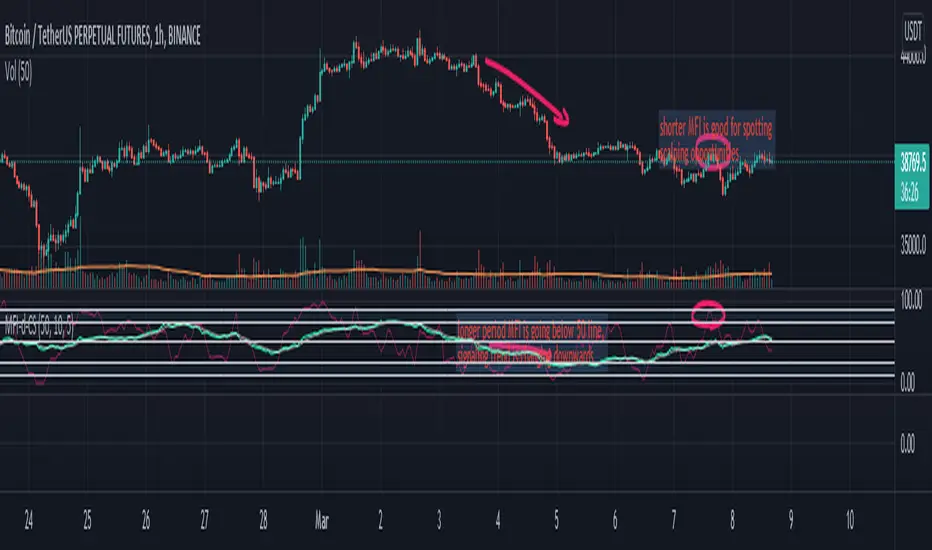
Money Flow Index (double) by CoinStaghey Piners community,
this is an iteration of inbuilt MFI script, with two MFIs of different lengths and one Moving Average which is dependent on MFI 1.
I find it useful to see the trend of longer MFI period, which tells me what direction to trade. On shorter period MFI I'm looking at Oversold or Overbought zones - while quicker MFI index is there, I'm looking to Buy/Sell, depending on trend.
Alternatively, you can use also MFI1 and MA crossovers to spot potential entries.
It seems like a good tool for crypto markets on any timeframes - from 5min, to 4h.
在脚本中搜索"index"
Trend Analysis Index [CC]The Trend Analysis Index was created by Adam White and not to be confused with the Trend Analysis Indicator that I also published. This indicator operates under the same idea but using a completely different calculation to achieve similar results. The idea behind this indicator is for a combination of volatility and trend confirmation. If the indicator is above it's signal line then the stock is very volatile and vice versa. If the stock is currently trending as in above a chosen moving average for example and the indicator falls below the signal line then there is a pretty good chance in a trend reversal. The recommended buy and sell system to use is to pair this indicator with a moving average crossover system which I have included in the script. Buy when the indicator is above it's signal and the shorter moving average crosses above the longer moving average. For selling you would do the same and sell when the indicator is above it's signal and the shorter moving average crosses below the longer moving average. I have included strong buy and sell signals in addition to the normal ones so stronger signals are darker in color and normal signals are lighter in color.
Let me know what other indicators or scripts you would like to see me publish!

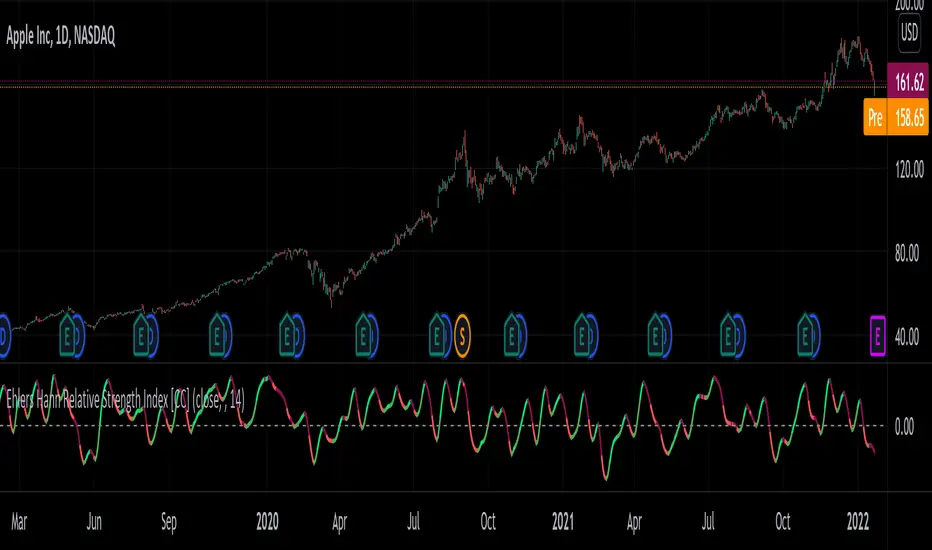
Ehlers Hann Relative Strength Index [CC]The Hann Relative Strength Index was created by John Ehlers (Stocks and Commodities Jan 2022 pgs 26-28) and this indicator builds upon his Hann Window Indicator to create an unique rsi indicator that doesn't rely on overbought or oversold levels to determine a reversal point and also provides a very superior smoothing without any of the lag associated with traditional smoothing. A much more useful RSI than the standard version in my honest opinion. Short term you buy when the line turns green and sell when it turns red. Medium to long term you buy when the indicator rises above the 0 line and sell when it falls below the 0 line. I have included strong buy and sell signals in addition to normal ones so strong signals are darker in color and normal signals are lighter in color.
Let me know if there are any other indicators or scripts you would like to see me publish!
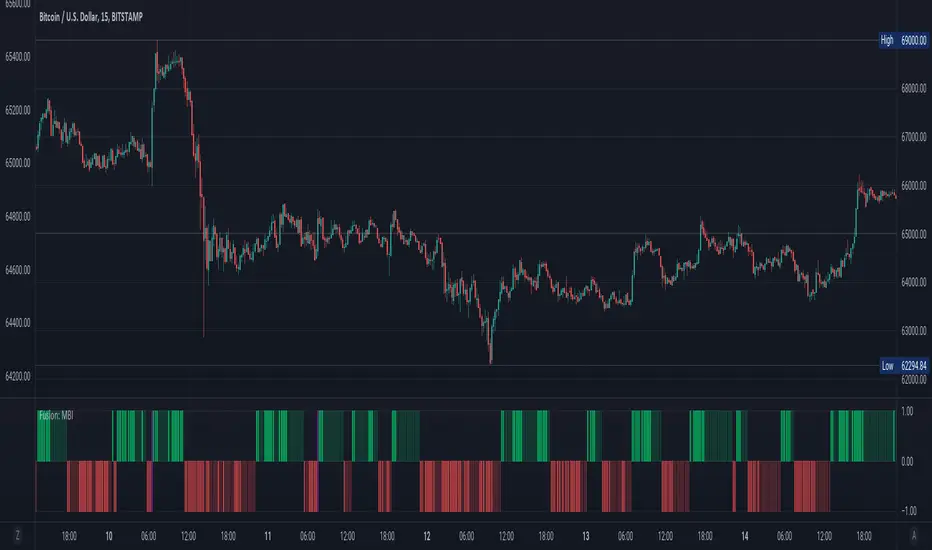
Fusion: Monster Breakout IndexThis indicator is designed to display on both the main chart and a separate chart area. If you want to display it on the main chart then flip the 4 display options. Well... you might want to:
Disable it first
Move it
Flip the display options
and then show it so the move doesn't look ugly.
Display options:
On a separate chart it will display red and lime bars showning potential breakouts.
On the main chart it will show a channel.
Personally like to see it both ways so I generally have two copies of it with one on the main chart.
The " Bar back marker " option is a tiny down arrow at the top of the chart showing where the length of the lookback starts from the current bar. So, if you set the length to 10 then this will be 10 bars back from the current bar. You can show it on or off the main chart but it's not all that visually tasteful off the main chart.
The length is certainly not some optimized setting so set to whatever suits your needs.
The source I set at hl2 which makes more sense to me than the default most people use of close so again, don't assume the settings are correct for your environment... play with it.
Credit:
Modified from the "Monster Breakout Index" by racer8 under the licence of: This source code is subject to the terms of the Mozilla Public License 2.0 at mozilla.org
The code is structured to easily drop into a bigger system so use it as a lone indicator or add the code to some bigger project you are creating. If you do, send me a note, it would be nice to know it's being well used.
Finally, if you find value please do make a comment, give a thumbs up etc.
Enjoy and good luck!
Relative Volume Strength Index (MZ RVSI)INTRODUCTION
Volume always plays a role of key indication for price movements and momentum and I always found the same problem with all available volume oscillators and indicators which is that their data is always in compounded form that can’t be easily used in raw form as a parameter in many strategies.
This indicator uses raw volume data from one of following oscillators:
TFS Volume Oscillator
On Balance Volume
Klinger Volume Oscillator
Cumulative Volume Oscillator
Volume Zone Oscillator
Then this data goes through the following process of noise filtration:
Hull Moving Average of input data to reduce noise
Relative Strength Index of HMA
Hull Moving Average of RSI to reduce noise for finalized RVSI
ADDITIONAL FEATURES
Heiken-Ashi: Heiken-Ashi values are optional to use in calculations and I’ve set them to default as I found good results with them.
Slope for Trend Detection: Slope of finalized RVSI is calculated in order to check volume trend direction. Another additional feature of Volume breakouts is also added which is used in dynamic coloring of RVSI. Dynamic color indications are as follows.
Green Color:
Strong Volume Uptrend above volume breakout point
Fuchsia Color:
Weak Volume Uptrend below volume breakout point but slope supported
Red Color:
Strong Volume Downtrend below volume breakout point
Gray Color:
Weak Volume Downtrend above volume breakout point but slope supported
Yellow Color:
Possible trend reversal as slope is flat.
DEFAULTS SETTINGS
Volume length is 30 (Better for timeframes higher than 1H)
Hull Moving Average and RSI length is set to 14
ADDITIONAL APPLICATIONS
This indicator can be used as divergence detection tool for volume same way as RSI is used for price divergence. I’ll soon add divergence signals inside the code and this code can be used in multiple ways as volume breakout indication in strategies for better results.

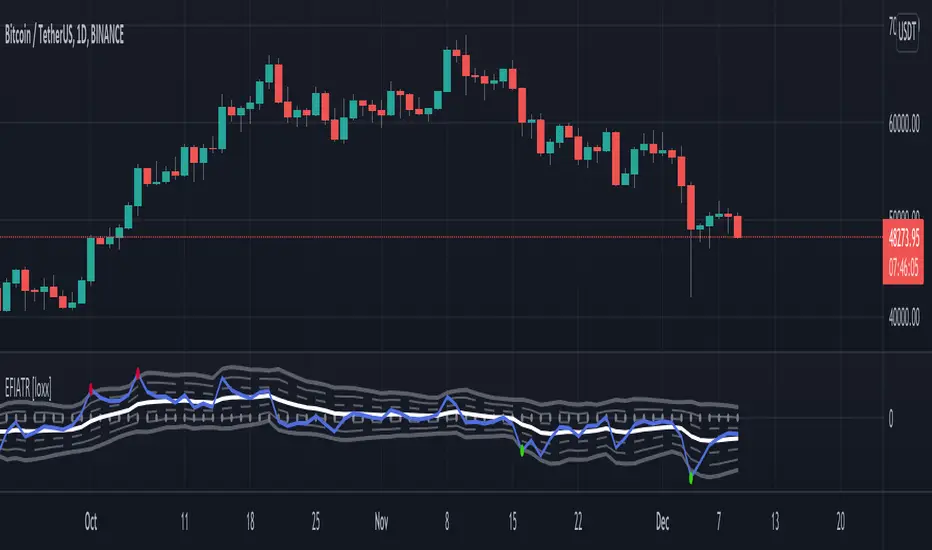
Elder Force Index With ATR Channels [loxx]Elder Force Index With ATR Channels, adaptive from original script by Dr. Alexander Elder
What it does
-EFI is used to sport reversals mainly on the weekly time frame
-When EFI spikes over 3 x ATR calculated on the signal line, price is said to have exhausted and you can start looking for reversals
Features
-Change all inputs
-Truncate EFI at 4 x ATR so as to not squish the indicator
-Open source, use code as you wish. If you use this code, shoot me a line and tell me how you're using it
RSI Levels, Multi-TimeframeThe relative strength index (RSI) is a momentum indicator that measures the magnitude of recent price changes to evaluate overbought or oversold conditions. RSI is normally displayed as an oscillator separately from price and can have a reading from 0 to 100. This indicator takes the RSI and plots the 30 & 70 levels onto the price chart so you can see when price is going to meet the 30 or 70 levels. The reason the 30 & 70 levels are important is because many traders (and bots) use those as signals to buy (at 30 RSI) or sell (at 70 RSI). Additionally, this indicator allows you to display not just the RSI levels of your currently viewed timeframe on the chart, but also shows the RSI levels of up to 6 different timeframes on the same chart. This allows you to quickly see if multiple RSI levels are aligning across different timelines, which is an even stronger indication that price is going to change direction when it meets those levels on the chart. There are a lot of nice configuration options, like:
Style customization (color, thickness, size)
Labels on the chart so you can tell which plots are the RSI levels
Optionally display the plot as a horizontal line if all you care about is the RSI level right now
Toggle overbought (RSI 70) or oversold (RSI 30) on/off completely

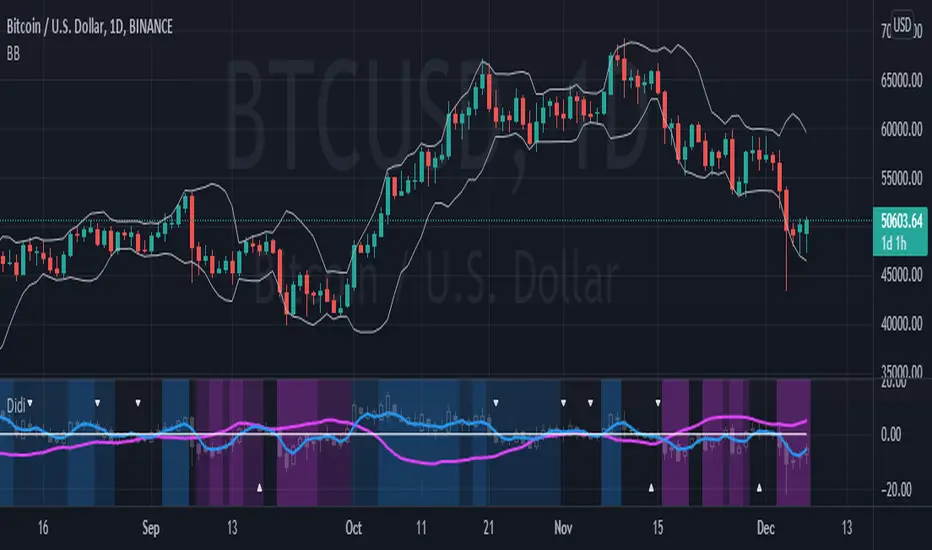
Didi index setupBeta version of the Didi setup combo - (almost) everything in one single indicator:
Didi index + DMI + TRIX + Stochastic.
Better description on how to use and color customization to come in next versions.
Enjoy!
Correlation IndexShows how often and how much the underlying security deviates from the base stock.
Indices that help in the selection of securities:
Lst10 - last 10(long factor parameter) periods average
Aver - fulltime averaged
pwr - total deviation area from base
ust - unstability (drawdown index)
cor - percent of positive bars
cross - fulltime averaged deviation

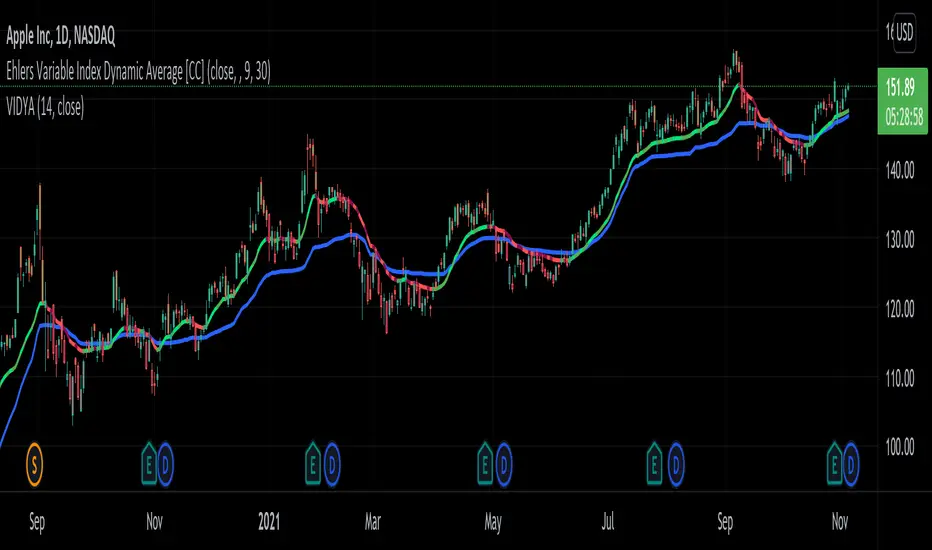
Ehlers Variable Index Dynamic Average [CC]The Variable Index Dynamic Average was created by Tushar Chande and this is a variation of that original formula created by John Ehlers. As you can see I have included the default Vidya from a script by @everget and as you can see the Ehlers version is able to follow the price much closer. I have included strong buy and sell signals in addition to normal ones and so darker colors are strong signals and lighter colors are normal ones. Buy when the line turns green and sell when it turns red.
Let me know if there are any other scripts you would like to see me publish!
[LanZhu] - Bursa Index/Sector Trend With PortfolioDescription
Hi all, this is a simple indicator that shows trend of both KLCI and sectors of Bursa . The sector finding is using my Bursa_Sector library. Besides, I have also included portfolio tracker which is by Mohamed3nan in this script.
Usage
Top Trend - Malaysia KLCI Index Trend
Bottom Trend - Any Bursa Sector Trend
Portfolio Table - Copy from Portfolio Tracker by Mohamed3nan

True Strength Index Histogram [Futures Market]This is a modified version of True Strength Index to fit the scalping trading style in futures market

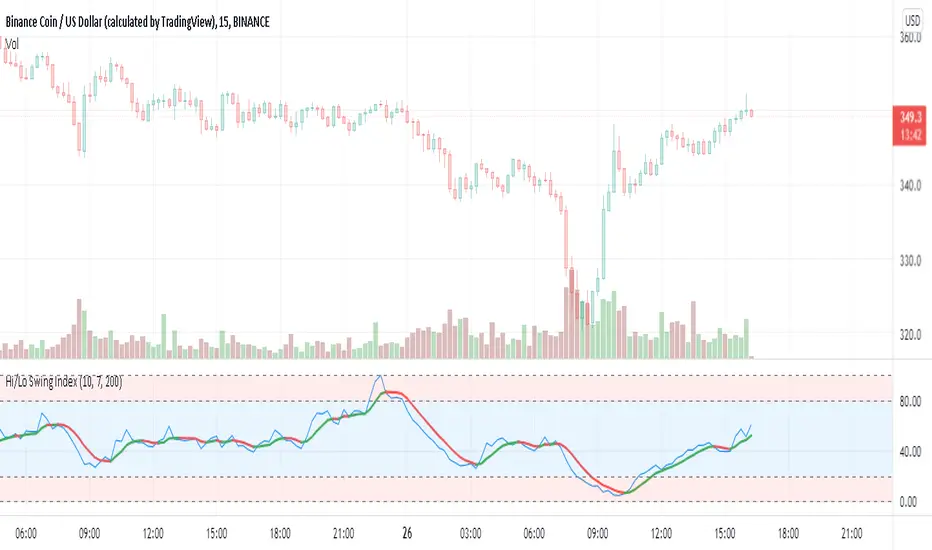
Hi/Lo Swing Index [by hajixde]Author: Hajixde
This indicator illustrates the High-to-Low variation. It works nicely on shorter time frames.
The index value is calculated based on the observation length (Memory Length). By changing this input, you can have a wider or shorter observation range.
MA Length is the moving average filter length, which smooths out the signal.
There is an additional smoothing function to make the output even smoother (Smoothing Length). Remember, that "Smoothing Length" is better to be less than "MA Length".
You may activate the trend direction.
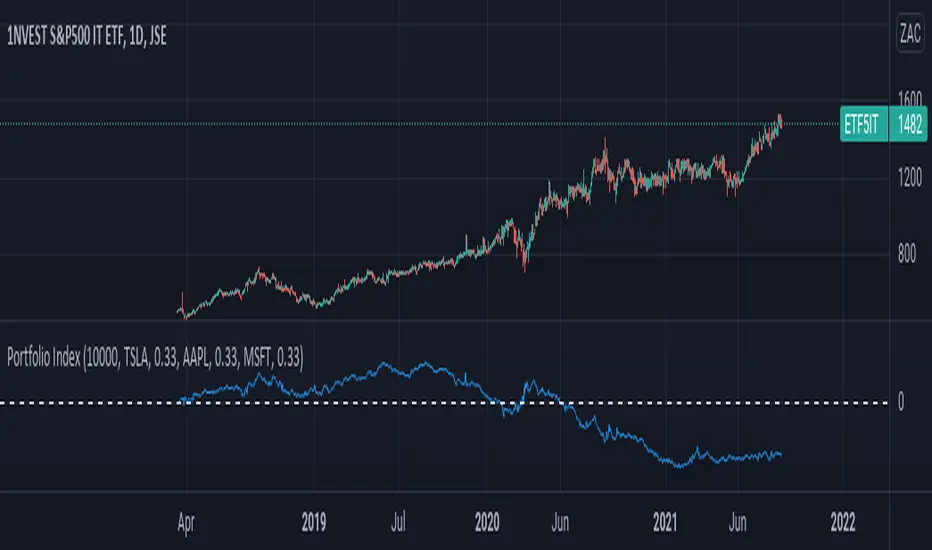
Portfolio IndexPortfolio Index Indicator
Compare a selected asset against a 3 assets portfolio.
Inputs :
- Equity : Default 10000, Initial capital for the portfolio
- %Holding : % of Holding for each Portfolio Element
- Asset in the chart as compared asset
Output :
- Delta between selected asset and portfolio
Ichimoku with MACD/ CMF/ TSIThis is a very powerful trend strategy designed for markets such as stocks market , stock index and crypto.
For time frames I found out that 1h seems to do the trick.
Components:
Ichimoku full pack
MACD histogram
CMF oscillator
TSI oscillator
Rules for entry
Long :
For Ichimoku:Tenkan part of cloud is bigger than kijun, Chikou is above 0 , close of a candle is above the Senkou
MACD histogram is above 0
CMF oscillator is positive and bigger than 0.1
TSI oscillator is above 0
Short:
For Ichimoku:Tenkan part of cloud is smaller than kijun, Chikou is below 0 , close of a candle is belowthe Senkou
MACD histogram is below 0
CMF oscillator is negative and below -0.1
TSI oscillator is below 0
Rules for exit
This strategy does not have any risk management inside. Instead it exits whenver it receives an opposite signal form the original one used for entry.
If you have any questions let me know !

Relative Strength Index 2x maThe relative strength index, represented as two moving averages with periods, one of which will be a multiple of the longer moving average by the amount you set.
The indicator can work both in automatic and manual mode. In automatic mode, the optimal periods are selected, in my opinion, depending on which timeframe is being analyzed at the current moment. In manual mode, you can set the required period yourself.
You can also set the method of smoothing the moving averages yourself and apply them to the opening or closing, the minimum of the bar, etc.
An important point: it is possible to enable/disable graphical functions that may not be required - just check the box next to the function that you want to see on your indicator.
Show ConDiv? - enabling / disabling the convergence/divergence function of the moving averages of the RSI indicator (not to be confused with the MACD for the asset price chart)
Show ma? - enabling/disabling the graphical display of the moving averages of the RSI indicator
Show RSI? - enabling / disabling the standard RSI indicator (if you want to see only it, check the box opposite; in this case, you need to remove the other two checkboxes)
I wish you good luck in building your trading plans, and remember: such indicators do not predict the future price movement on the chart, they only determine the characteristics of the price movement at the current time, taking into account historical data.

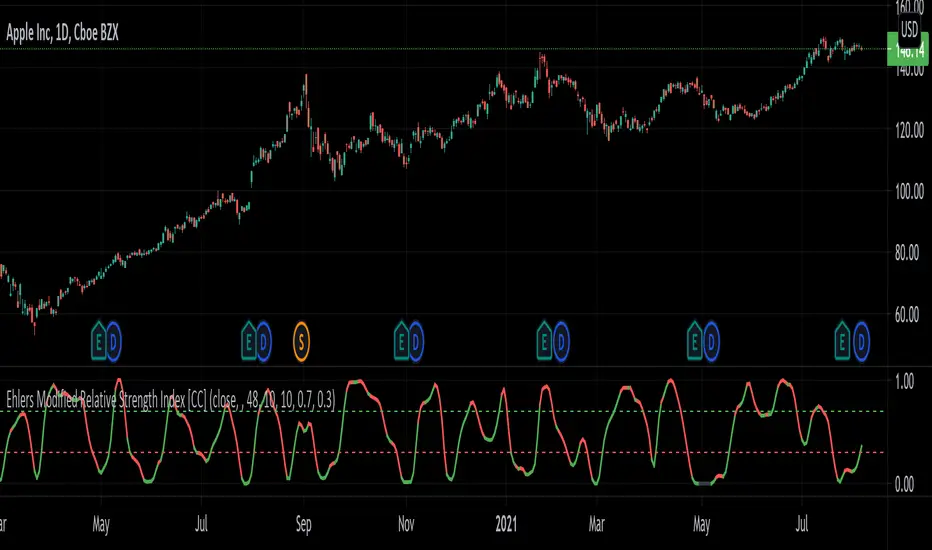
Ehlers Modified Relative Strength Index [CC]The Modified Relative Strength Index was created by John Ehlers (Cycle Analytics For Traders pgs 87-88) and this is a typical RSI that uses his roofing filter as the input. He smooths it with his own super smoother filter to provide signals. This indicator is extremely reactive and works in cycles so keep that in mind. I haven't been able to come up with clear buy and sell signals at this point so let me know if you any suggestions but I'm publishing the code to complete my goal of publishing all of his work one day. I will be publishing a bunch of Ehlers scripts in the next few weeks so stay tuned. What I recommend for buy and sell signals at this point are to buy when the indicator goes below the oversold line and starts going up and sell when the indicator goes below the oversold line a second time. Vice versa for sell signals.
Let me know if there are any other scripts you would like to see me publish!
Money Flow Index 5 min Strategy1 - Apply the 3 period Money Flow Index indicator to the 5 minute chart, using 0 and 100 as our oversold and overbought boundaries
2 - Wait for the MFI to reach overbought levels, that indicates the presence of "big sharks" in the market. Price needs to hold up
the first two MFI overbought occurrences of the day to be considered as a bullish entry signal.*
3 - We buy when the MFI = 100 and the next candle is a bullish candle with short wicks.
4 - We place our Stop Loss below the low of the trading day and we Take Profit during the first 60 minutes after taking the trade.
The logic above can be used in a mirrored fashion to take short entries, this is a custom parameter that can be modified from
the strategy Inputs panel.
* I'm using a SMA filter to avoid buying when the price is declining. Time frame was better at 15 min according to my test.

RedK Volume-Weighted Directional Efficiency Index (DXF)RedK Volume-Weighted Directional Efficiency Index (DXF) is a momentum indicator - that builds on Kaufman's Efficiency Ratio (ER) concept.
DXF utilizes a restricted +100/-100 oscillator to represent the "quality" of a trend, and does a good job in detecting the possibility of an upcoming trend change (in both direction and quality), improving our ability to make decisions on trade entries and exits.
Here's a quick background on Kaufman's Efficiency Ratio (ER)
------------------------------------------------------------------------------- Copied from internet sources -----------------------------
Developed by Perry Kaufman and introduced in his book “New Trading Systems and Methods”, the Efficiency Ratio reflects relative market speed to volatility. There are cases, when it is used as a filter, which helps a trader to avoid ”choppy” markets or trading ranges and to identify smoother trends.
ER is the result of dividing the net change in price movement during n-periods by the sum of all bar-to-bar price changes during the same n-periods. In case the market is trending smoother, then the ratio will be higher. In case the ratio shows readings in proximity to zero, this implies that market movement is inefficient and ”choppy”.
If the Efficiency Ratio shows a reading of +100, this means that the trading instrument is in a bull trend and trending with perfect efficiency.
If the Efficiency Ratio shows a reading of -100, this means that the trading instrument is in a bear trend and trending with perfect efficiency.
It is impossible for any instrument to have a perfect Efficiency ratio, because any movement against the major trend during the examined period of time would cause the ratio to drop.
If the Efficiency Ratio shows a reading above +30 (common setting for the "Significant Level"), this is indicative of a quality bull trend. If the ratio shows a reading below -30, this is indicative of a quality bear trend.
------------------------------------------------------------------------------- End of Copy -------------------------------------------------------------------------------------------------------
Kaufman also used the ER as basis for his famous Kaufman Adaptive Moving Average (KAMA).
Read more on ER & Kama here
How is DXF different from other ER-based indicators?
------------------------------------------------------------------
- Let's get the easy part out of the way: DXF has a "volume-weighting" option ✔
This option is OFF by default (to avoid errors with instruments with no volume data)
- once this option is applied, it provides the benefit of combining the volume effect into the calculation - those who appreciate the effect of volume on price action will hopefully find this option valuable
- The calculation of ER and how it can be "best utilized":
Let's examine the ER concept a bit closer: as a (math) concept, the (original) Efficiency Ratio (ER) takes the positive change of the price of an instrument during a certain period, and divide it by the sum of (absolute) price moves that were observed during that same period.
So, in the trader's language, we will be saying "out of a total of $20 moves (up and down) that MSFT did in the past 10 days, MSFT only made a net change of $5 up during that period" - so the "10-day ER" for MSFT in that case is 5/20 = 25% -- then we continue to observe that ongoing "10-day ER" and if it increases, we can expect that MSFT is going to establish a strong move (trend) up --- right?
the magic word here is to "observe the ongoing ER" - many of the ER based indicators just use the ER as calculated by Kaufman's original method. IMHO, these are just "point-in-time readings" - if we hope to get real insights from the ER, we need to take an average of that reading - for our "time window" we're interested in - and only then we can identify trends and patterns in the ER value as it changes during that windowss- DXF does that - and that allows a trader to say "the (weighted) 5-day average of the 10-day ER for MSFT is increasing, and that why i expect an up-trend" -- makes sense ? both the "Lookback" used to calculate the ER, and the Length of observed "window" for the Average ER are adjustable in DXF settings
Other Uses and Settings :
---------------------------------
- As a momentum indicator, DXF can predict an upcoming change of trend - cause that will reflect on the average ER value. There are few examples in the chart where the price move and ER trend *do not agree* - The trader can see these signs and take decisions accordingly
- DXF can help reveal best entries and exits: assume we are long-term bullish on MSFT, and we want to "buy the dip" - DXF can help reveal the time where price is recovering from extreme weakness - and that would be the ideal buy opportunities for us - exampled marked on the chart
- the Stepping & Smoothing options enable better visualization of the DXF plot. the "raw" DXF is still shown as a silver line.
- The "Significant Levels" option is available and is set to -20/+20 by default .. also adjustable in indicator settings.
- Please use DXF in combination with other trend and volume indicators, and with thorough chart / price action analysis and not in isolation to ensure you get proper signal confirmation for trades. In the chart above, you can see DXF combined with a moving average that can act as a filter and to confirm the price moves.
---------------------------------------------------
As usual, feedback & comments are welcome - if you find this work useful in your trading arsenal, please share a comment - i would be more than happy to learn about that. Good luck!

Euro Currency Volatility IndexThis script is written on request of a Forex trader who wanted the value of Euro Currency Volatility Index shown on his chart.
He wanted to have the value displayed to help him with his trades.
As I do not trade Forex, I do not know the co-relation of $EVZ with Forex currency pairs and wrote the script only on his request. Perhaps other Forex traders who understand $EVZ and Forex may also benefit from this script.
All the best to all.

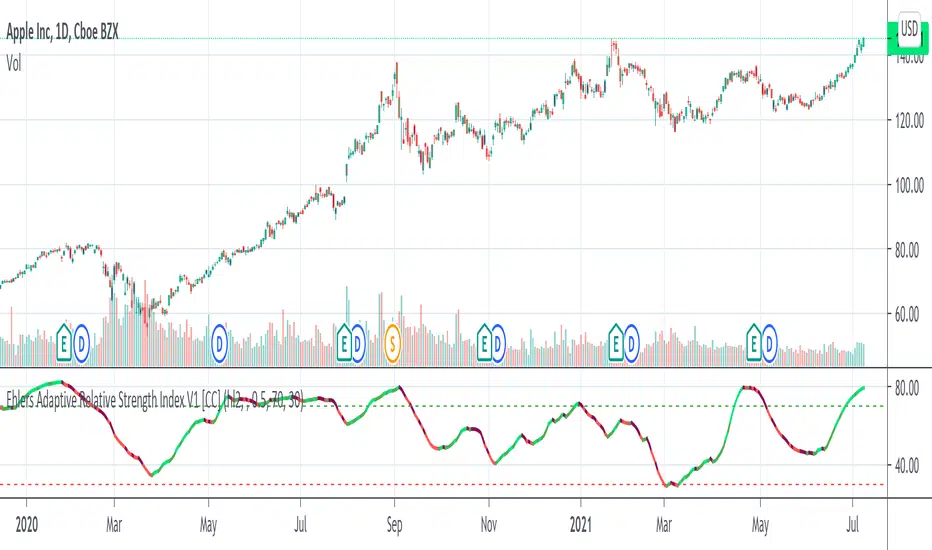
Ehlers Adaptive Relative Strength Index V1 [CC]The Adaptive Relative Strength Index was created by John Ehlers and this is his first version. I will of course publish his updated version at a later date along with publishing the final script from Jim Sloman's Ocean Theory book. I have changed his script to include extra smoothing to provide clear buy and sell signals. This is a version of a RSI that is very adaptive to changes by finding the length of the current cycle and using that to calculate the rsi and I use this same basic process to provide extra smoothing. A great strategy of course is to buy right after the indicator goes from below the oversold level to right above it and stay in until the indicator turns red or when it reaches the overbought level. I have included strong buy and sell signals in addition to normal ones and the darker colors mean strong signals and lighter colors are normal signals.
Let me know what other indicators you would like to see me publish!
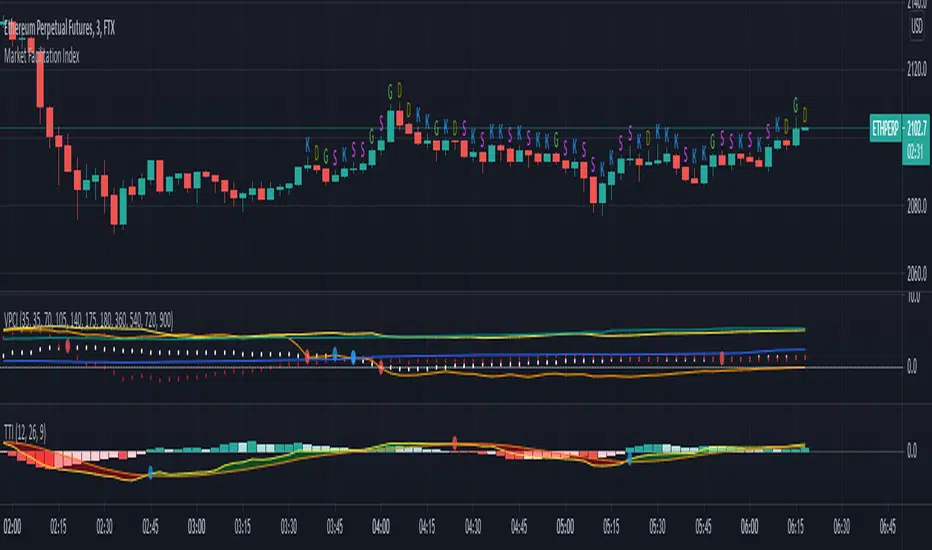
[MFI] Market Facilitation Index Written by Bruce-JSH
Implemented MFI(Market Facilitation Index) of Buff Dormeier
no license, no copyright.
There are no obligations or restrictions on you no matter how you do this script.
version 2021.07.11.a
1. First public release
2. G => Green(++), D => faDe bar(--), K => faKe bar(-+), S => Squat bar(+-)