[blackcat] L3 Price Positioning IndexLevel: 3
Background
Are you tired of traditional Japanese candlesticks? Do you want to try a new type of candle master chart?
Function
L3 Price Positioning Index is totally brand-new candle chart invented by myself. This main chart can provide effective resistance and support levels, and you can see where the price is running at any time. There are 3 key circle lines. Green circle line is used to indicate oversold support or breakthrough support levels; yellow circle line indicates the midline position where prices may pause; and red circle line indicates overbought resistance or breakthrough resistance levels.
There are two types of candlestick charts.
The first type candles are mid-to-long-term trend candles, navy represents an uptrend and the length of the candle represents a change in intensity; maroon represents a downward trend and the length of the candle represents a change in intensity. This trend candle is the effective support and resistance level of the second type short-term swing candle.
The second type candles are short-term candles fluctuate around the first medium- and long-term trend candles. The second short-term candle is divided into five colors: green means pump; fuchsia means retracement in the ascending process; yellow means bullish reversal signal; red means dump; blue means price rebound in the descending process.
Key Signal
THREE KEY LINES:
htop --> red circle line, overbought resistance or pump breakout threshold
hmid --> yellow circle line, price pause zone, sideways may happen here
hbot --> green circle line, oversold support or dump breakout threshold
MID-LONG TERM CANDLES:
x22,x33 --> navy for up and maroon for down trend, they are important support or resistance for short term price movements
SHORT TERM CANDLES:
1. bearreboun --> rebounce in down trend candle with blue color
2. pump --> up trend pump candle with green color
3. bullreversal --> bullish reversal candle with yellow color
4. dump --> bearish dump candle with red color
5. bullretra --> retracement in up trend candle with fuchsia
Pros and Cons
Pros:
1. Long term trend identification by three lines for overbought, oversold and breakouts
2. Mid term trend support and resistance with navy and maroon candles
3. Short term price behaviors are classified into 5 types of candles in blue, green, yellow, red and fuchsia
Cons:
I invent this to solve traditional JP candlestick shortcomings. If you find anything on Cons, just feedback to me for improvements.
Remarks
Brand-new Candle System invented by myself
Readme
In real life, I am a prolific inventor. I have successfully applied for more than 60 international and regional patents in the past 12 years. But in the past two years or so, I have tried to transfer my creativity to the development of trading strategies. Tradingview is the ideal platform for me. I am selecting and contributing some of the hundreds of scripts to publish in Tradingview community. Welcome everyone to interact with me to discuss these interesting pine scripts.
The scripts posted are categorized into 5 levels according to my efforts or manhours put into these works.
Level 1 : interesting script snippets or distinctive improvement from classic indicators or strategy. Level 1 scripts can usually appear in more complex indicators as a function module or element.
Level 2 : composite indicator/strategy. By selecting or combining several independent or dependent functions or sub indicators in proper way, the composite script exhibits a resonance phenomenon which can filter out noise or fake trading signal to enhance trading confidence level.
Level 3 : comprehensive indicator/strategy. They are simple trading systems based on my strategies. They are commonly containing several or all of entry signal, close signal, stop loss, take profit, re-entry, risk management, and position sizing techniques. Even some interesting fundamental and mass psychological aspects are incorporated.
Level 4 : script snippets or functions that do not disclose source code. Interesting element that can reveal market laws and work as raw material for indicators and strategies. If you find Level 1~2 scripts are helpful, Level 4 is a private version that took me far more efforts to develop.
Level 5 : indicator/strategy that do not disclose source code. private version of Level 3 script with my accumulated script processing skills or a large number of custom functions. I had a private function library built in past two years. Level 5 scripts use many of them to achieve private trading strategy.
在脚本中搜索"index"

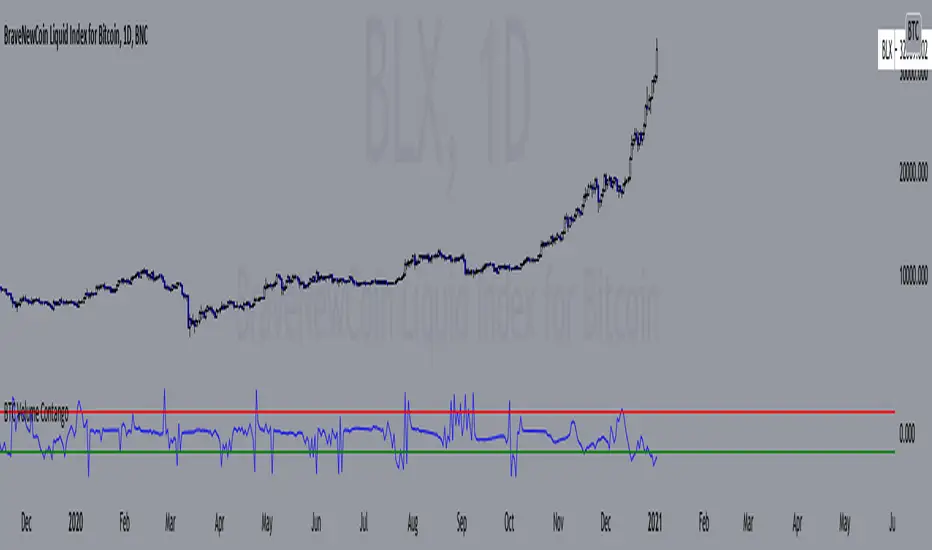
BTC Volume Contango IndexBased on my previous script "BTC Contango Index" which was inspired by a Twitter post by Byzantine General:
This is a script that shows the contango between spot and futures volumes of Bitcoin to identify overbought and oversold conditions. When a market is in contango, the volume of a futures contract is higher than the spot volume. Conversely, when a market is in backwardation, the volume of the futures contract is lower than the spot volume.
The aggregate daily volumes on top exchanges are taken to obtain Total Spot Volume and Total Futures Volume. The script then plots (Total Futures Volume/Total Spot Volume) - 1 to illustrate the percent difference (contango) between spot and futures volumes of Bitcoin. This data by itself is useful, but because aggregate futures volumes are so much larger than spot volumes, no negative values are produced. To correct for this, the Z-score of contango is taken. The Z-score (z) of a data item x measures the distance (in standard deviations StdDev) and direction of the item from its mean (U):
Z-score = (x - U) / StDev
A value of zero indicates that the data item x is equal to the mean U, while positive or negative values show that the data item is above or below the mean (x Values of +2 and -2 show that the data item is two standard deviations above or below the chosen mean, respectively, and over 95.5% of all data items are contained within these two horizontal references). We substitute x with volume contango C, the mean U with simple moving average ( SMA ) of n periods (50), and StdDev with the standard deviation of closing contango for n periods (50), so the above formula becomes: Z-score = (C - SMA (50)) / StdDev(C,50).
When in contango, Bitcoin may be overbought.
When in backwardation, Bitcoin may be oversold.
The current bar calculation will always look incorrect due to TV plotting the Z-score before the bar closes.
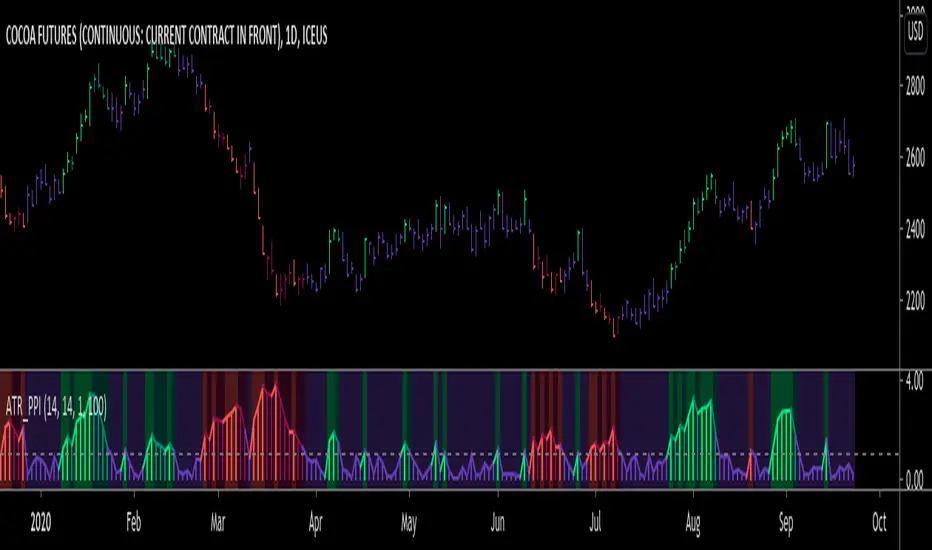
ATR Pivot Point Index [racer8]Description:
ATR Pivot Point Index (ATR_PPI) is based on the theory of mean reversion.
I was inspired to create this indicator after watching a particular YouTube video on the UKspreadbetting channel.
In this video, the trader being interviewed mentioned that he would exit when price is too far from the moving average.
In other words, he exits when he thinks price will revert back to the moving average (mean reversion).
I'm not sure what period moving average he used, so I set it to the standard 14 periods.
I wanted to quantify his strategy so that the user can consistently exit a trade at a fixed distance away from the moving average.
For this indicator, this distance is in ATR units.
This strategy of exiting is known as the mean reversion exit strategy.
Alternatively, if the user wishes to, this indicator can also be used as an entry indicator (Trend entry strategy).
---------------------------------------------------------------------------------------------------------------------------------------------------------------------------------
Parameters:
1. Sma Period - controls length of moving average (Affects histogram).
2. Atr Period - controls length of Atr, doesn't have much affect on indicator (Affects histogram).
3. Atr Pivot Point Level - controls horizontal line, it determines how far away in Atr units you want to exit/enter from the sma for every trade.
---------------------------------------------------------------------------------------------------------------------------------------------------------------------------------
Interpreting signals:
(Trend entry strategy) When histogram is...
Green - enter long
Red - enter short
Purple - No signal
(Mean reversion exit strategy) When histogram is...
Green - exit long
Red - exit short
Purple - No signal
---------------------------------------------------------------------------------------------------------------------------------------------------------------------------------
Calculation:
Distance = Absolute value of (current close - moving average(14))
ATR_units = Distance / ATR(14) ...........Plot as histogram.
Add horizontal line set at (2)*ATR .......Plot line.
Is histogram > line?
Yes, histogram color is green/red.
No, histogram color is purple.
Note: For mean reversion exit strategy, I recommend HIGHER Atr Pivot Point Level values. Vice versa for trend entry strategy.
Enjoy :)
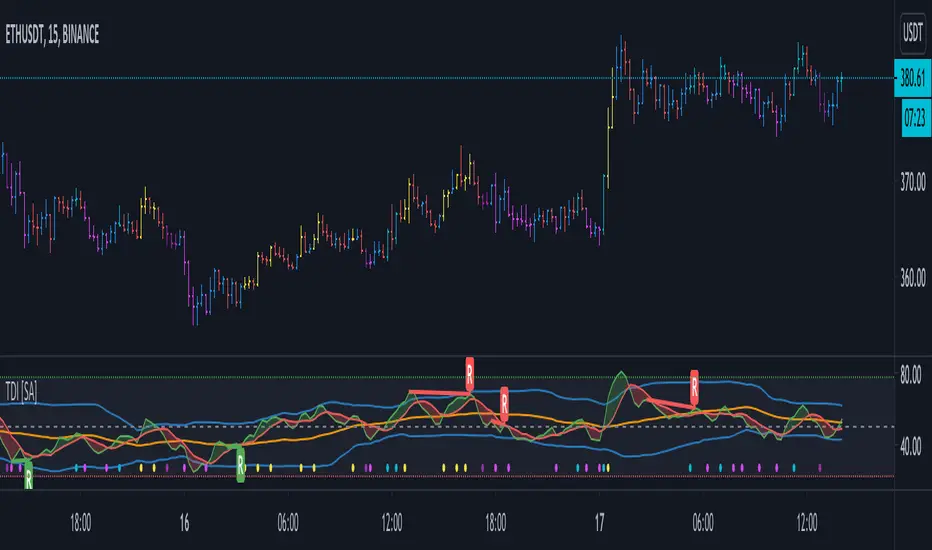
TDI - Traders Dynamic Index [SystemAlpha]Traders Dynamic Index with Divergence
Credits to the original code author LazyBear and modifications by JustUncleL
Riley's Movement IndexBrief Description:
Riley's Movement Index is a new indicator developed and named after me.
RMI is quite interesting in that uses two lines to cross each other.
One line represents the bullish side of the market, and the other line represents the bearish side of the market.
A signal occurs when the two lines cross each other.
-------------------------------------------
Calculation:
Up
1. high > prev high?
2. If yes, then Up = (high - prev high)
3. If no, then Up = 0
Dn
1. low < prev low?
2. If yes, then Dn = (prev low - low)
3. If no, then Dn = 0
SumUp (n) = Sum of Up over n periods
SumDn (n) = Sum of Dn over n periods
Plot SumUp & SumDn lines.
-------------------------------------------
How to interpret a signal:
When SumUp > SumDn, market is bullish.
When SumUp < SumDn, market is bearish.
-------------------------------------------
Recommended setting:
I would suggest a setting of 10, the default setting.
-------------------------------------------
Enjoy, and smash that follow button!

Big Breakout IndexBig Breakout Index is a great indicator for detecting breakouts. When the current close breaks out of consolidation, the indicator will tell you.
Green - Buy
Red - Sell

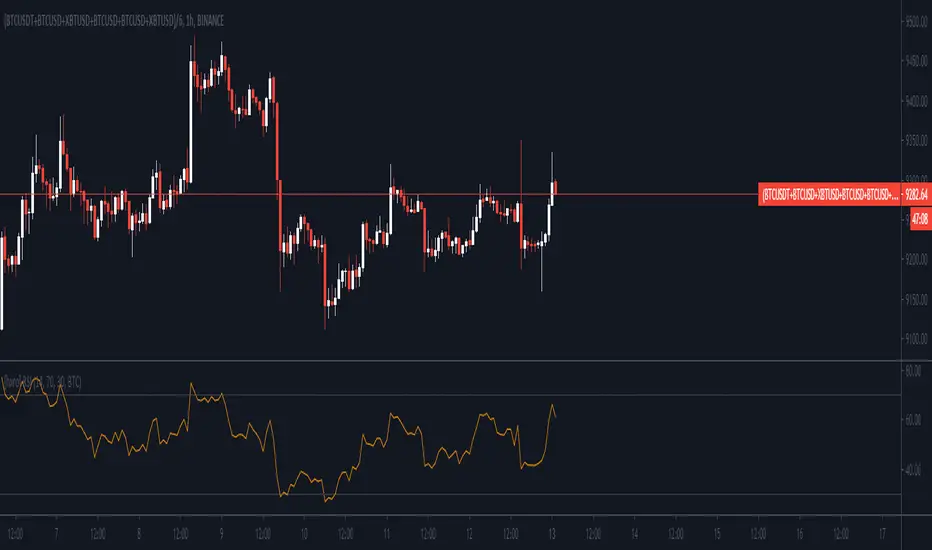
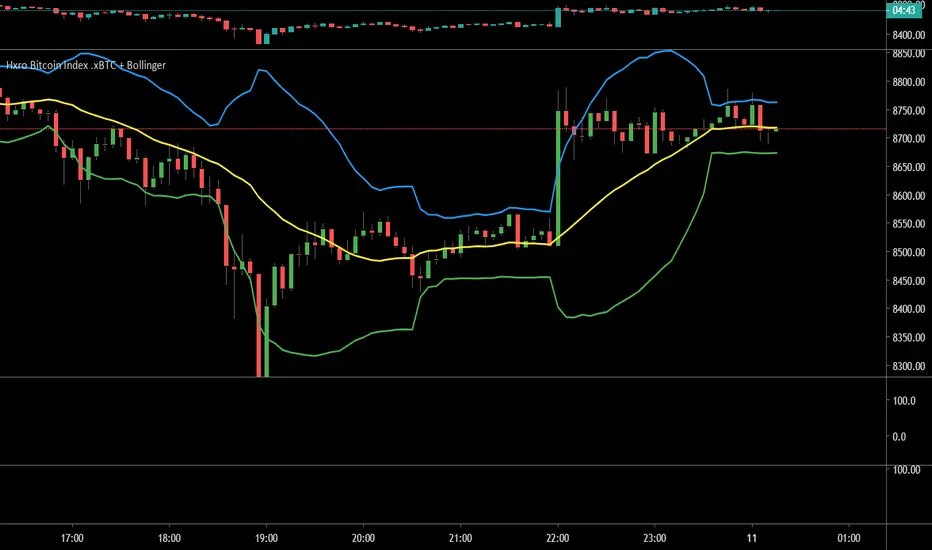
[hxro] Relative Strength IndexSimple RSI with HXRO index calculated internaly, you can select BTC, ETH, BNB or CHART for classic usage
The Upper & Lower band are also configurable
Directional Volume IndexA new idea of mine that I am presently experimenting on for my trades.
The Directional Volume Index (DVI) is defined as follows:
DVI = VWMA(len1) - SMA(len2), where by default, len1==len2
The sign of the DVI provides volume confirmation of the direction of the price trend.
The magnitude of the DVI provides the volume confirmation of the strength of the price trend.
The novel aspects and principles of this indicator and this source code are the property of © cybernetwork.
This indicator and script is free for the TV community to use.

FauxLife EFIModification to Elder's Force Index (EFI)
Ability to change calculation from standard EMA to your choice of SMA, EMA, WMA, or HMA. Very interesting results!
Adjust lookback from standard/suggested 13 candlesticks
Added a color indication to positive or negative force reading
Added background color tint for an easier read on dashboard setups
Suggested pair with my On Balance Volume with Cross to use as a filter & entry/exit setup. Enter or exit trades when the two indicators switch at the same time or within 1-2 candlesticks of each other.

COT extremes indexCalculates the difference between net of noncommercials and net of commercials.
Difference = (net of noncommercials) - (net of commercials).
The extreme reading in one end or another may indicate the possible change of trend.
Based on Tradingview COT sample script and Babypips formula.
Works on daily timeframe.

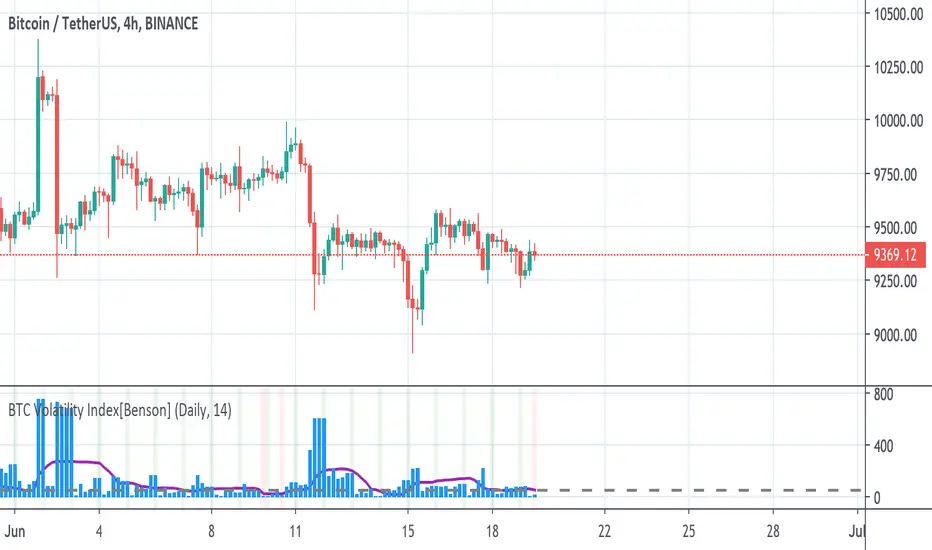
BTC Volatility Index[Benson]This indicator is for choosing the best timing to long BTC move future on FTX.
The basic idea is that when BTC's price volatility Index is relatively low(under 50 in 4hr timeframe or under 200 in D timeframe), it's more likely to have huge volatility afterwards, which it's a good time to long BTC's move future.
Green background --> Move future expected strike price
Red background --> Good timing to long BTC move future
Relative Strength Index @ inflowjetRelative Strength Index 80/20 with extra 30/70 area and 50% dashed line

Easy Directional Movement IndexNothing more than a graphical tweak for the integrated Directional movement index (DMI). The purpose is to make the reading of the DMI easier and more immediate.
The area between DI+ and DI- is filled, and the indicator's range in divided into 4 sections, each of them representing a different price tendency:
- When ADX line is inside the red colored area (0-25), the market is in a ranging phase.
- When inside the aqua colored area (25-50), there is a trend.
- When inside the blue colored area (50-75), there is a strong trend
- When inside the navy colored area (75-100), there is an extremely strong trend.
However keep in mind that these are default levels that may be not always significant. You can change them from the script settings as you prefer, to better tweak your analysis.
Please support my work and follow me if you like my scripts. Many more of them are coming in the future.
@Bezzus

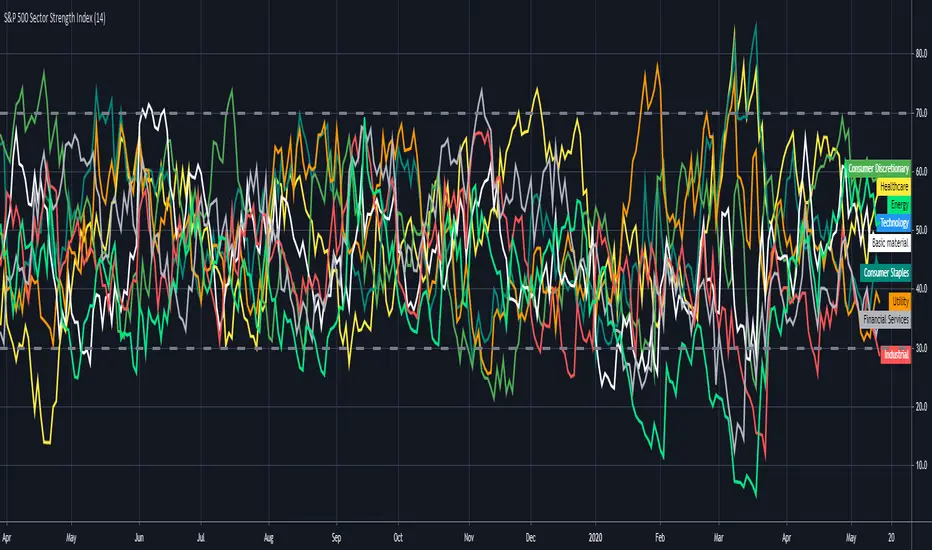
S&P 500 Sector Strength IndexHi traders , this is lonelygrass again 😄, and I am going to show what you don't often see out there and share it with you.
This indicator is called "s&p 500 sector strength index"😎 , which allows you to distinguish strengths and weaknesses between different sectors in s&p500, and to create meaningful trading frameworks around it.
Similar to the RSI indicator , it also has overbought and oversold levels , you can clearly figure out the degree of crowd behaviors in various sectors' stocks .
For me 🤣, I will use it to "BUY LOW⬇️ , SELL HIGH⬆️". When a sector is oversold at the moment, I will try to buy those stocks when I find price actions and chart patterns in comply with the analysis by this indicator , the opposite for shortselling.
Also, for sake of being more user-friendly 👍, I added a function which enables you to only select the sector(s) you want to look at in order to make it less messy.
If you can't help to know what I will share with you coming up, then FOLLOW my account 😙 . Also , your likes and shares are really important 🎊. I will get more motivated to bring you new thing every day!!! ✍
Relative Volume Strength IndexRVSI is an alternative volume-based indicator that measures the rate of change of average OBV.
How to read a chart using it?
First signal to buy is when you see RVSI is close to green oversold levels.
Once RVSI passes above it's orange EMA, that would be the second alert of accumulation.
Be always cautious when it reaches 50 level as a random statistical correction can be expected because of "market noises".
You know it's a serious uptrend when it reaches above 75 and fluctuates there, grading behind EMA.
The best signal to sell would be a situation where you see RVSI passing below it's EMA when the whole thing is close to Red overbought level
It looks simple, but it's powerful!
I'd use RVSI in combination with price-based indicators.

Weighted Moving Average of Relative Strength IndexJust weighted moving average of Relative Strength Index to see a clearer picture.

Two Bars IndexThe Two Bars Index compares the current bar to a bar n periods back.
This indicator is incredibly simple, yet so effective.

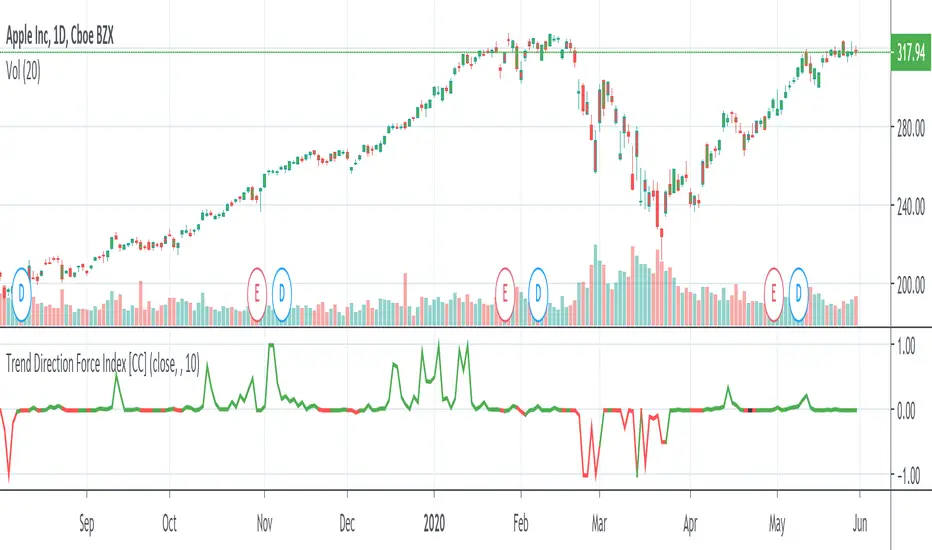
Trend Direction Force IndexThis is my own version of the famous Trend Direction Force Index and I modified the original to make my version react quickly to any trend. I have color coded the indicator to make it extremely easy to read so if it is green then buy and red then sell.
This was a custom request so if you would like more then just send me a message!
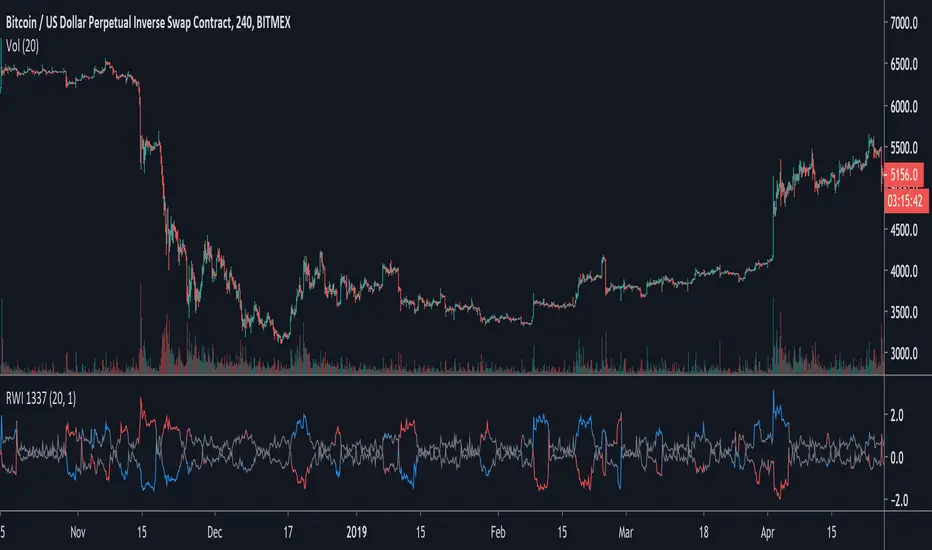
Random Walk Index 1337A modification of the original Random Walk Index (RWI) script by everget, this one updates to version 4 and adds a threshold value and colouring.
If both high and low are below the default threshold of 1.0 the line chart will be coloured in grey.
Adjusting the length and threshold should allow you to see flat and choppy periods.
SMI Stochastic Momentum Index 2x set per Baiynd -Tom1traderStochastic Momemtum Index - a true strength indix tsi with a moving average signal.
This uses the built in with modifications per Anne-Marie Baiynds recommendations - she uses a SIMPLE MOVING AVERAGE
for the signal (signal length at 4x the short length seems to work best to reflect actual price action support or resistance)
Note: Default settings in this code have been updated to her most recent recommendations that I have seen.
video is entitled "The Most Reliable Technical Indicator I Have Ever Used"
Note: I have not discussed this with Ms . Baiynd this is my interpretation of the vids I have seen.
Anne-Marie Baiynd also in talks / videos refers to the use of short / long of 4/20 and 6/40 and have combined both of them here
This overlays both of them with their respective SMAs- a 4/20 lengths and a 6/40 lengths in darker colors and smallest linewidth.
this gives a perspective on slightly higher time frame action.
USAGE: Generally above and below the black dashed zero line is long or short
KEYS: -Plot position relative to zero black, red overbought, green oversold and the gray lines at .25 -.25
Indicator action often more significant out side of the more "neutral" +.25/-.25 area
and near or above/below the red/green dashed lines.
-Steepness of slopes
Slopes of smi plots relate directly to price action where steeper is more momentum.
- -SMI blue relation to its simple moving average orange and the SMI longer dark blue with moving average purple.
MAJOR FEATURE - The average acts as support or resistance to the SMI and the price unless breaking out.
Price is often pausing or reversing iin finding primary/secondary support or resistance as well at those times.
You Can See and anticipate Where Support or Resistance may be Encountered. (much unlike most indicators)
My standard caveat -use at your own risk. Like anyone else I do not know what the next bar/candle is going to do
and I place all of my trades with a management plan in place for the worst case scenario.
That said enjoy your charting and trading.
This was coded starting with the built-in indicator "SMI Ergontic Oscilator / Indicator". You do this by within the Pine Editor select "New" tab and
choose the indicator that you want the code for. This populates the editor with the code for the built in indicator and you can modify it to suit your
purposes and save it / publish it and etc. Thanks for following this and Keep Smiling!

Construction Company IndexCouldn't find an index for construction companies so I made one. Useful to compare to the real estate market. It is just the average of the top 10 construction and engineering companies.
