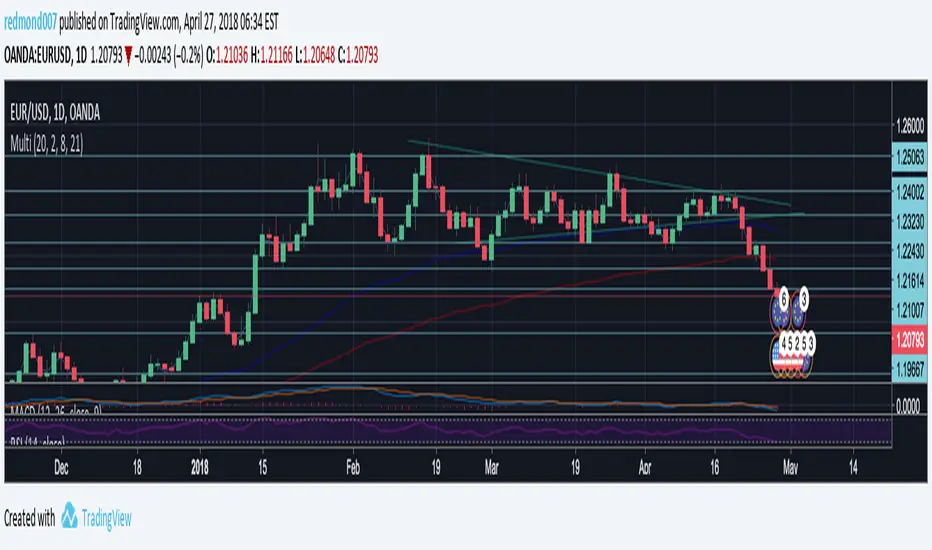
Multi Indicators v1 - 20 50 200 EMA/SMA, Bollinger Bands, VWAPMulti Indicators v1
20 50 200 EMA/SMA, Bollinger Bands, VWAP
These can be turned on and off
I'll be adding to this multi indicator in future updates
在脚本中搜索"indicators"
Multi Indicators- MA, EMA, MA Cross, Parabolic SarMulti Indicators
- 3 Simple Moving Average
- 3 Exp Moving Average
- Cross of Moving Averages
- Parabolic SAR
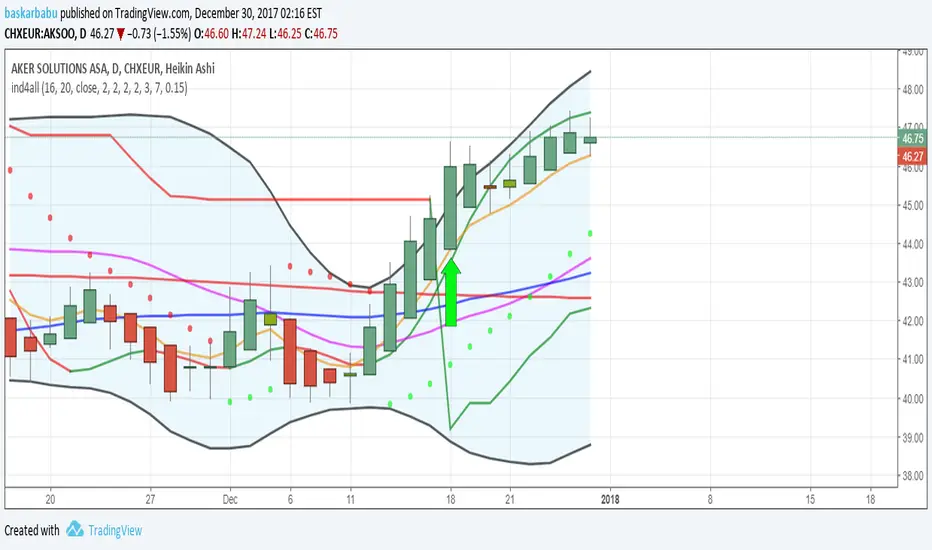
All indicators in one!All indicators in one!
Hull MA (2 colors) + Bollinger Bands + 6 EMA + 50 SMA + 200 SMA + Parabolic SAR + SUPER TREND (2 colors) + Doji signals (yellow)
EMA Indicators with BUY sell SignalCombine 3 EMA indicators into 1. Buy and Sell signal is based on
- Buy signal based on 20 Days Highest High resistance
- Sell signal based on 10 Days Lowest Low support
Input :-
1 - Short EMA (20), Mid EMA (50) and Long EMA (200)
2 - Resistance (20) = 20 Days Highest High line
3 - Support (10) = 10 Days Lowest Low line

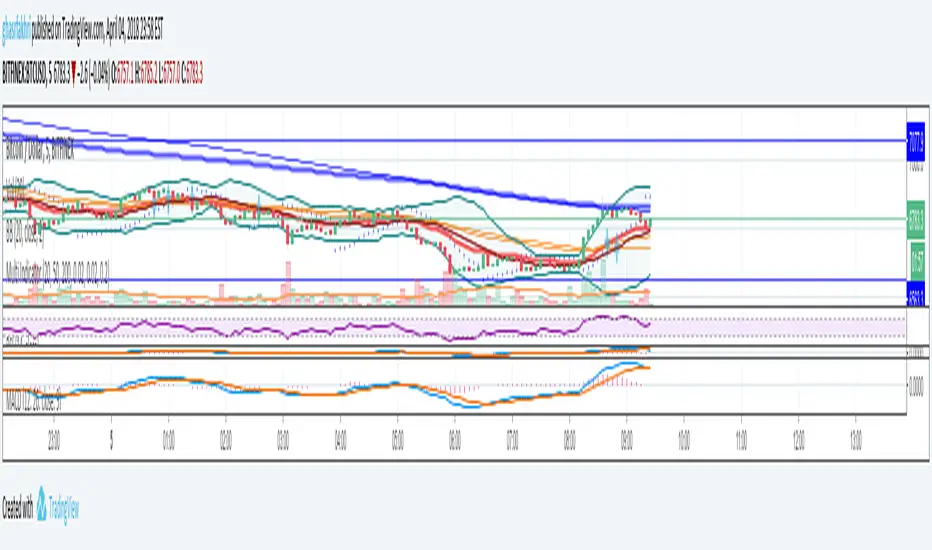
Volume Flow Indicator [LazyBear]VFI,introduced by Markos Katsanos, is based on the popular On Balance Volume (OBV) but with three very important modifications:
* Unlike the OBV, indicator values are no longer meaningless. Positive readings are bullish and negative bearish.
* The calculation is based on the day's median (typical price) instead of the closing price.
* A volatility threshold takes into account minimal price changes and another threshold eliminates excessive volume.
A simplified interpretation of the VFI is:
* Values above zero indicate a bullish state and the crossing of the zero line is the trigger or buy signal.
* The strongest signal with all money flow indicators is of course divergence.
I have exposed options to plot a signal EMA. All parameters are configurable.
Markos suggests using 0.2 coeff for day trading and 0.1 for intra-day.
More info:
www.precisiontradingsystems.com

Indicator: Relative Volume Indicator & Freedom Of MovementRelative Volume Indicator
------------------------------
RVI is a support-resistance technical indicator developed by Melvin E. Dickover. Unlike many conventional support and resistance indicators, the Relative Volume Indicator takes into account price-volume behavior in order to detect the supply and demand pools. These pools are marked by "Defended Price Lines" (DPLs), also introduced by the author.
RVI is usually plotted as a histogram; its bars are highlighted (black, by default) when the volume is unusually large. According to the author, this happens if the indicator value exceeds 2.0, thus signifying that a possible DPL is present.
DPLs are horizontal lines that run across the chart at levels defined by following conditions:
* Overlapping bars: If the indicator spike (i.e., indicator is above 2.0 or a custom value)
corresponds to a price bar overlapping the previous one, the previous close can be used as the
DPL value.
* Very large bars: If the indicator spike corresponds to a price bar of a large size, use its
close price as the DPL value.
* Gapping bars: If the indicator spike corresponds to a price bar gapping from the previous bar,
the DPL value will depend on the gap size. Small gaps can be ignored: the author suggests using
the previous close as the DPL value. When the gap is big, the close of the latter bar is used
instead.
* Clustering spikes: If the indicator spikes come in clusters, use the extreme close or open
price of the bar corresponding to the last or next to last spike in cluster.
DPLs can be used as support and resistance levels. In order confirm and refine them, RVI is used along with the FreedomOfMovement indicator discussed next.
Freedom of Movement Indicator
------------------------------
FOM is a support-resistance technical indicator, also by Melvin E. Dickover. FOM is the ratio of relative effect (relative price change) to the relative effort (normalized volume), expressed in standard deviations. This value is plotted as a histogram; its bars are highlighted (black, by default( when this ratio is unusually high. These highlighted bars, or "spikes", define the positioning of the DPLs.
Suggestions for placing DPLs are the same as for the Relative Volume Indicator discussed above.
Note that clustering spikes provide the strongest DPLs while isolated spikes can be used to confirm and refine those provided by the Relative Volume Indicator. Coincidence of spikes of the two indicator can be considered a sign of greater strength of the DPL.
More info:
S&C magazine, April 2014.
I am still trying these on various instruments to understand the workings more. Don't forget to share what you learn -- any use cases / ideal scenarios / gotchas, would love to hear them all.

3 new Indicators - PGO / RAVI / TIIMy "to-publish" list is getting too big, so decided to push out 3 indicators in the same chart
Feel free to "make mine" and use :) Leave a comment on what you think.
Pretty Good Oscillator
----------------------------------------
This indicator, by Mark Johnson, measures the distance of the current close from its N-day simple moving average, expressed in terms of an average true range (see Average True Range) over a similar period. So for instance a PGO value of +2.5 would mean the current close is 2.5 average days' range above the SMA.
Johnson's approach was to use it as a breakout system for longer term trades. If the PGO rises above 3.0 then go long, or below -3.0 then go short, and in both cases exit on returning to zero (which is a close back at the SMA). Indicator marks all these areas (3/-3/0)
Rapid Adaptive Variance Indicator
---------------------------------------------------------
RAVI is a simple indicator, by Tushar Chande, to show whether a stock is trending or not. Unlike ADX, RAVI measures only the trend intensity, it doesn't distinguish which way the trend is going. Rising RAVI shows the beginning of a trend or an increase in trend intensity, a decreasing slope signifies decreasing intensity. Also, RAVI often reacts more quickly and exhibits a more pronounced curve than ADX.
The standard values for daily charts are 7 and 65. For hourly charts, the most common averaging periods are 12 and 72 or 24 and 120.
The signal lines suggested are from +/- 0.3% to +/-1%. I haven't added any markings as these signals are instrument-specific. I suggest doing some back testing and adding these accordingly.
Trend Intensity Index
--------------------------------------
TII, by M. H. Pee, measures the strength of a trend, by looking at what proportion of the past "n" days prices have been above or below the level of today's "x"-day simple moving average. You can configure "n" via options page. "x" is calculated as "2 times n".
TII moves between 0 and 100. A strong uptrend is indicated when TII is above 80. A strong downtrend is indicated when TII is below 20.
Pee recommended entering trades when levels of 80 on the upside or 20 on the downside are reached. Indicator marks these lines for easy reference.


[2022]Volume Flow v3 with alertsIndicators are an essential part of technical analysis of cryptocurrency. Their main function is to predict market direction based on historic price, cryptocurrency volume and other information. There are several types of crypto indicators illustrating various parameters (trend, volatility, volume, momentum, etc.) but in this article we will look at volume indicators.
Volume indicators demonstrate changing of trading volume over time. This information is very useful as crypto trading volume displays how strong the current trend is. For example, if the price goes up and the volume is high then the trend is strong and will more likely last longer. There are various volume indicators, but we’ll talk about the most popular ones, such as:
On Balance Volume
Accumulation/Distribution Line
Money Flow Index
Chaikin Oscillator
Chaikin Money Flow
Ease of Movement

Gold Option Signals with EMA and RSIIndicators:
Exponential Moving Averages (EMAs): Faster to respond to recent price changes compared to simple moving averages.
RSI: Measures the magnitude of recent price changes to evaluate overbought or oversold conditions.
Signal Generation:
Buy Call Signal: Generated when the short EMA crosses above the long EMA and the RSI is not overbought (below 70).
Buy Put Signal: Generated when the short EMA crosses below the long EMA and the RSI is not oversold (above 30).
Plotting:
EMAs: Plotted on the chart to visualize trend directions.
Signals: Plotted as shapes on the chart where conditions are met.
RSI Background Color: Changes to red for overbought and green for oversold conditions.
Steps to Use:
Add the Script to TradingView:
Open TradingView, go to the Pine Script editor, paste the script, save it, and add it to your chart.
Interpret the Signals:
Buy Call Signal: Look for green labels below the price bars.
Buy Put Signal: Look for red labels above the price bars.
Customize Parameters:
Adjust the input parameters (e.g., lengths of EMAs, RSI levels) to better fit your trading strategy and market conditions.
Testing and Validation
To ensure that the script works as expected, you can test it on historical data and validate the signals against known price movements. Adjust the parameters if necessary to improve the accuracy of the signals.

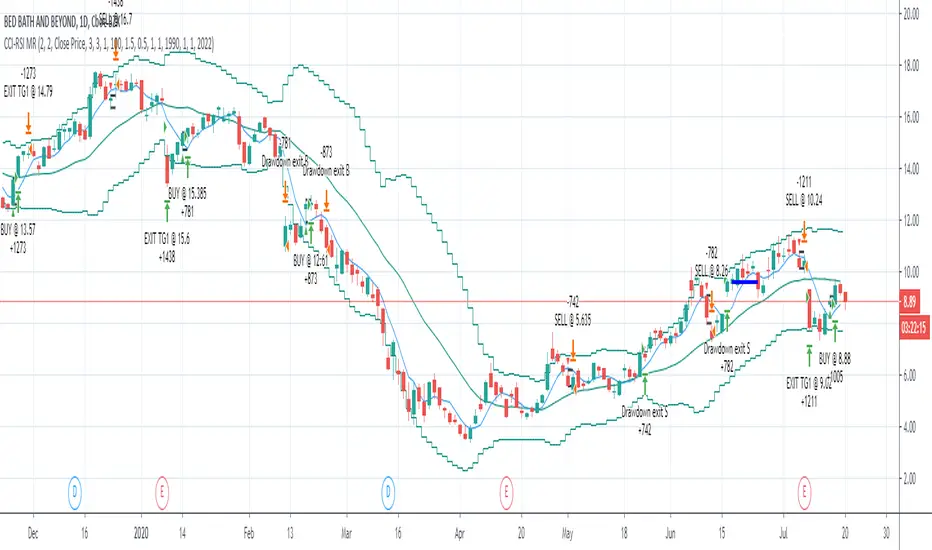
CCI-RSI MR Indicators:
Bollinger Bands (20 period, 2σ)
RSI (14 period) and Simple moving average of RSI (5 period)
CCI (20 period)
SMA (5 period)
Entry Conditions:
Buy when:
Swing low (5) should be lower than the highest of lower BB (3 periods)
Both RSI crossover RSI_5 and CCI crossover -100 should have happened within last 3 candles (including the current candle)
Once all the above conditions are met, the close should be higher than SMA (5) within the next 3 candles
After condition 3 is satisfied, we enter the trade at next candle’s open
Stop loss will be at 1 tick lower than previous swing low
Sell when:
Swing high (5) should be higher than the lowest of upper BB (3 periods)
Both RSI crossunder RSI_5 and CCI crossunder 100 should have happened within last 3 candles (including the current candle)
Once all the above conditions are met, the close should be lower than SMA (5) within the next 3 candles
After condition 3 is satisfied, we enter the trade at next candle’s open
Stop loss will be at 1 tick higher than previous swing high
Exit Conditions:
Since it’s mean reversion strategy we’ll be having only 2 target exits with a trailing stop loss after target price 1 is achieved.
Target exit price 1 & 2 are decided based on the risk ‘R’ for each trade
Depending on the instrument and time frame a trailing stop loss of 0.5R or 1R has opted.
A stop limit is placed @Entry_price +- 2*ATR(20) to offset the risk of losing significantly more than 1xR in a trade
Gaussian Acceleration ArrayIndicators play a role in analyzing price action, trends, and potential reversals. Among many of these, velocity and acceleration have held a significant place due to their ability to provide insight into momentum and rate of change. This indicator takes the old calculation and tweaks it with gaussian smoothing and logarithmic function to ensure proper scaling.
A Brief on Velocity and Acceleration: The concept of velocity in trading refers to the speed at which price changes over time, while acceleration is the rate of change(ROC) of velocity. Early momentum indicators like the RSI and MACD laid foundation for understanding price velocity. However, as markets evolve so do we as technical analysts, we seek the most advanced tools.
The Acceleration/Deceleration Oscillator, introduced by Bill Williams, was one of the early attempts to measure acceleration. It helped gauge whether the market was gaining or losing momentum. Over time more specific tools like the "Awesome Oscillator"(AO) emerged, which has a set length on the datasets measured.
Gaussian Functions: Named after the mathematician Carl Friedrich Gauss, the Gaussian function describes a bell-shaped curve, often referred to as the "normal distribution." In trading these functions are applied to smooth data and reduce noise, focusing on underlying patterns.
The Gaussian Acceleration Array leverages this function to create a smoothed representation of market acceleration.
How does it work?
This indicator calculates acceleration based the highs and lows of each dataset
Once the weighted average for velocity is determined, its rate of change essentially becomes the acceleration
It then plots multiple lines with customizable variance from the primary selected length
Practical Tips:
The Gaussian Acceleration Array offers various customizable parameters, including the sample period, smoothing function, and array variance. Experiment with these settings to tailor it to preferred timeframes and styles.
The color-coded lines and background zones make it easier to interpret the indicator at a glance. The backgrounds indicate increasing or decreasing momentum simply as a visual aid while the lines state how the velocity average is performing. Combining this with other tools can signal shifts in market dynamics.

Parabolic Scalp Take Profit[ChartPrime]Indicators can be a great way to signal when the optimal time is for taking profits. However, many indicators are lagging in nature and will get market participants out of their trades at less than optimal price points. This take profit indicator uses the concept of slope and exponential gain to calculate when the optimal time is to take profits on your trades, thus making this a leading indicator.
Usage:
In essence the indicator will draw a parabolic line that starts from the market participants entry point and exponentially grows the slope of the line eventually intersecting with the price action. When price intersects with the parabolic line a take profit signal will appear in the form of an x. We have found that this take profit indicator is especially useful for scalp trades on lower timeframes.
How To Use:
Add the indicator to the chart. Click on the candle which the trade is on. Click on either the price which the trade will be at, or at the bottom of the candle in a long, or the top of a candle in a short. Select long or short. Open the settings of the indicator and adjust the aggressiveness to the desired value.
Settings:
- Start Time -- This is the bar in which your entry will be at, or occured at and the script will ask you to click on the bar with your mouse upon first adding the script.
- Start Price -- This is the price in which the entry will be at, or was at and the script will ask you to click on the price with your mouse upon first adding the script.
- Long/Short -- This is a setting which lets the script know if it is a long or a short trade, and the script will ask you to confirm this upon first adding it to the chart.
- Aggressiveness -- This directly affects how aggressive the exponential curve is. A value of 101 is the lowest possible setting, indicating a very non-aggressive exponential buildup. A value of 200 is the highest and most aggressive setting, indicating a doubling effect per bar on the slope.

Pre-Market PillarsIndicators that displays where to enter and exit on pre market and low cap stocks.
Inspired by Ross Cameron strategy.

Alson Chew PAM EXE and Mother BarIndicators for strategies taught by Alson Chew's Price Action Manipulation (PAM) course
Two functions.
First it identifies EXE bars (Pin, Mark, Icecream bars).
Second it identifies Mother bars and draws an extension line for 6 bars.
Applicable to all time frames and can customise how many signals to show.
To be used in conjunction with trading strategies like
- 20 SMA, 50 SMA, 200 SMA FS formation
- Force Bottom, Force Top FS formation
- UR1 and DR1 using EXE Bar

Indicators OverviewThis Indicator help you to see whether the price is above or below vwap, supertrend. Also you can see realtime RSI value.
You can add upto 15 stock of your choice.

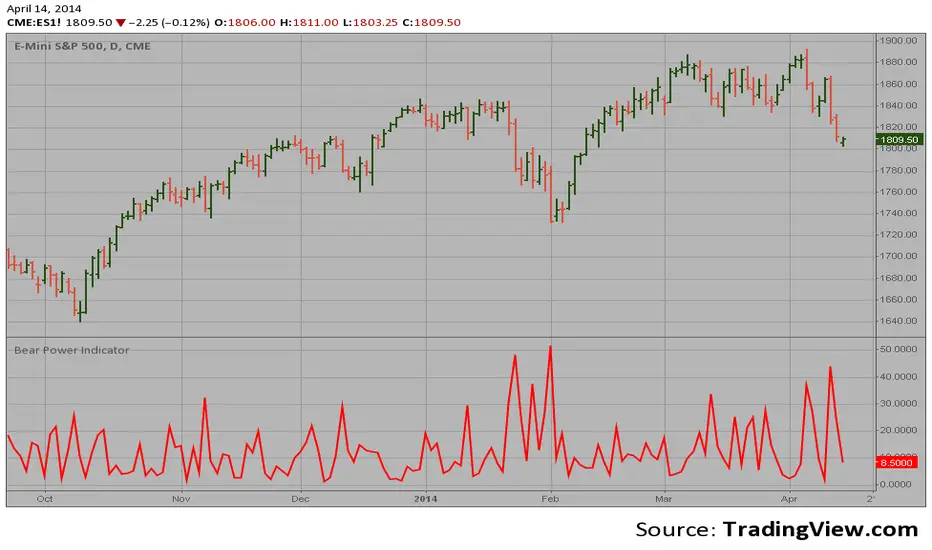
Bear Power Indicator Hi
Let me introduce my Bear Power Indicator script.
To get more information please see "Bull And Bear Balance Indicator"
by Vadim Gimelfarb.
Multi Indicator Screener w/ Gates by DeepsageDeepsage Weighted Screener w/ Gates is a high-frequency, candle-by-candle market screening tool designed for precision entries on the 1-minute timeframe (Settings are adjustable to fit other timeframes).
The screener aggregates 31 weighted technical indicators across trend, momentum, volatility, trend strength, and volume to evaluate market conditions at every candle close and classify directional bias.
To improve signal quality, the system includes three independent gate indicators that act as a confirmation layer. These gates do not influence the score itself but instead approve or block trade entry signals, helping filter out low-quality conditions while still allowing exit signals to function normally.
All indicator parameters and gate conditions are fully adjustable, allowing the screener to be adapted to different instruments, volatility regimes, and execution styles.

ADX DMI SqueezeThis is my version of the ADX/DMI with added some added features.
J. Welles Wilder Jr. is the creator and originator of the Average Directional Movement Index (ADX) and the Directional Movement Index (DMI) so I encourage you to learn more about this indicator.
I like to scalp the NASDQ and I like taking breakouts above/blow the Bollinger Band (std def one) and or the BB 20 sma . I also use VWAP.
On the chart is my indicator VWAP BB MA which has Vwap and BB if your wanting a combination.
I like taking longs when price is above VWAP, shorts when below VWAP, doing this keeps you on the right side of the market.
You will need to work the settings of the ADX Squeeze to get the best of it for your style of trading. This indicator is just that, It indicates what price has done so, like all indicators it lags however, look at price first then the indicators might support your ideas.
As time evolves I’ll be maintain and doing updates.
ADX DMI Squeeze – How to Use
Overview
This indicator combines:
ADX / DMI → Measures trend strength and direction
ADX Squeeze Histogram → Shows when the trend is accelerating or “squeezing” for a breakout
Triangles → Highlight potential expansion points
Optional DI+ / DI− lines → Show bullish/bearish dominance
ADX Threshold Lines (15 / 20) → Help filter weak trends
Early ADX Acceleration Dots → Provide an early heads-up before a squeeze fires
It can be used standalone or alongside other trend tools like VWAP for better entry timing.
Entry Guidelines
Long Trades (Buy):
Histogram above 0
Green triangle appears
ADX rising or above threshold (15/20 recommended)
Optional: DI+ > DI− confirms bullish strength
Short Trades (Sell):
Histogram above 0
Red triangle appears
ADX rising or above threshold (15/20 recommended)
Optional: DI− > DI+ confirms bearish strength
Avoid trades if:
Histogram negative
Triangles appear but ADX below threshold or trend not confirmed by DI linesOptional Filters
Require ADX acceleration: Only shows signals when ADX is increasing → avoids late or false entries
Require VWAP slope: Only triggers signals in line with VWAP trend → improves confluence
Tips
Best on 30-min or higher timeframes for swing/short-term trend trades
Can be combined with VWAP, support/resistance, or Bollinger Bands
Use DI lines toggle if you want extra visual trend confirmation
Adjust DMI length (sensitivity) and ADX smoothing for your preferred timeframe
Interpretation
Histogram turning green above 0 + triangle → strong bullish move forming
Histogram turning red above 0 + triangle → strong bearish move forming
ADX above 20 → strong trend, more reliable
ADX below 15 → weak trend, signals less reliable
In short:
Long = Green bars above 0 + Green triangle
Short = Red bars above 0 + Red triangle
Confirm with ADX above threshold and optionally DI lines

Smart Money Pressure DifferentialPurpose
The Smart Money Pressure Differential (SMPD) is built to reveal the underlying tug‑of‑war between informed volume flows represented by NVI and reactive volume flows represented by PVI, using a clean statistical framework. Instead of relying on raw NVI or PVI, which drift over time and are not directly comparable, the script isolates pressure deviations by measuring how far each index moves away from its own long‑term expectation. By standardizing these deviations, SMPD produces a stable, volatility‑normalized spread that highlights accumulation, distribution, and regime transitions with far greater clarity than traditional volume indicators.
How It Works
The script computes NVI and PVI, scales them, and subtracts their EMAs to extract deviation‑from‑trend pressure, with optional WMA smoothing to reduce micro‑noise. Each deviation series is then standardized independently using rolling mean and standard deviation, ensuring both NVI and PVI operate on equal statistical footing. Their difference becomes the SMPD spread, a normalized measure of which side is exerting more pressure. A second layer applies log‑ROC to capture acceleration rather than level, and these acceleration signals can be plotted as dotted lines. Standard deviation reference levels at 0, 1, 2, and 3 provide a consistent frame for interpreting extreme pressure events.
Rationale
This architecture solves structural weaknesses found in most volume‑based tools, particularly scale drift, volatility collapse, and the instability of cumulative indicators. Standardizing before differencing prevents one index from overpowering the other, ensuring the spread reflects true pressure imbalance rather than structural bias. The log‑ROC layer adds a stable acceleration measure that avoids the distortions of classic ROC when values approach zero. The result is a regime‑independent engine, producing signals that remain comparable across assets, timeframes, and market conditions. SMPD therefore becomes a robust diagnostic tool for identifying when smart‑money pressure is building, fading, or reversing, without relying on arbitrary thresholds or bounded oscillators that distort signal strength.

ORB 369 - Opening Range Breakout The ORB 369 is a professional-grade momentum indicator designed to capture the volatility of the New York market open. While many Opening Range Breakout (ORB) scripts simply draw lines, this script integrates time-segmented price action with Supply and Demand (S/D) theory to filter out "fakeouts" and identify high-probability institutional entries.
💡 The Core Concept: Why 3-6-9?
The strategy is rooted in the "Market Open Volatility" principle. The first 15 minutes (9:30–9:45 AM EST) represent the period where institutional orders are processed and "price discovery" is most aggressive.
The Range: We define the 15-minute high and low as the "Battlefield."
The 369 Logic: This script focuses on the 3rd 5-minute candle of the session (completing the 15m range) and monitors the subsequent 5m and 15m cycles for a definitive trend shift.
🛠️ How It Works
The script utilizes Pine Script v6 high-precision time-tracking and state-handling to ensure accuracy even on historical data.
1. Dynamic Session Anchoring
Unlike static indicators, this script uses America/New_York timezone anchoring. It identifies the Opening Range (OR) regardless of your local time, ensuring you are aligned with the NYSE floor traders.
2. Supply & Demand Detection
The script doesn't just look at the high/low; it analyzes the micro-structure within that 15-minute window.
It identifies unmitigated zones (areas where price moved so fast it left "imbalances").
If a breakout occurs but price immediately hits an internal S/D zone, it warns the trader of a potential "Look Above and Fail" scenario.
3. Breakout Confirmation (5m Logic)
A common mistake is entering on a "wick." This script uses Closing Logic:
Bullish Signal: A 5-minute candle must close entirely above the 15m High.
Bearish Signal: A 5-minute candle must close entirely below the 15m Low.
The script then repaints the candle body (defaulting to Blue/Red) to provide an instant visual cue that the "Breakout is Confirmed."
📈 How to Use It
Wait for the Box: At 9:45 AM EST, the script will automatically lock in the High, Low, and Midpoint (Mean) of the range.
Monitor the Midpoint: The Midpoint acts as the "Line in the Sand." If a breakout occurs but price stays near the Midpoint, the trend is weak. If price stays in the upper half of the range, the Bullish bias is stronger.
The Entry: Wait for the Candle Color Change. A blue candle above the range suggests a long entry; a red candle below suggests a short.
Supply/Demand Zones: If the script highlights a "Demand Zone" at the bottom of the range and price bounces off it before breaking the top, this provides a "double-confluence" setup.
⚙️ Technical Features
Customizable Aesthetics: Use the Settings menu to change the breakout colors (Green/Blue/Red) to match your personal chart theme.
Smart Tooltips: Hover over the inputs in the settings to see detailed explanations of what each parameter does.
Alert Ready: Built-in alerts for "Bullish Breakout" and "Bearish Breakout" that can be sent directly to your phone or desktop via TradingView.

Zen Lab ALL-IN-ONE🧠 Zen Lab All-In-One Trading Toolkit
The Zen Lab All-In-One indicator is built for traders who want structure, confluence, and volatility awareness in one clean system — without cluttering their charts with 10 different tools.
This combines news awareness, ATR volatility planning, session levels, trend context, and execution checklists into a single professional trading assistant.
📰 Smart News Filter (Stay Out of Chaos)
The indicator automatically highlights only the news events that actually move markets:
🔴 High-Impact Economic Events
⚪ Market Holidays
No low-impact noise. No unnecessary distractions.
Just the events most likely to cause volatility spikes.
✔️ On-chart vertical news markers
✔️ Optional news table
✔️ Designed for intraday and session traders
📏 Customizable ATR Volatility Tool
Trade based on real market movement, not guesswork.
The built-in ATR table lets you:
• View current ATR
• Calculate stop loss distance using ATR multipliers
This helps you size trades based on conditions, not emotions.
📋 Confluence Checklist (Execution Discipline)
Stay consistent with your trading rules.
The on-chart checklist allows you to track your confluences before entering a trade, helping reduce impulsive decisions and reinforcing discipline.
Great for traders who follow a structured system.
📈 Moving Average Trend Context
Includes a built-in moving average to help you quickly identify current trend direction and market bias without adding extra indicators.
Perfect for confirming lower timeframe direction
🌍 Session High & Low Identifier
Know where the real liquidity is.
Automatically marks key session ranges so you can:
✔️ Spot session breakouts
✔️ Trade liquidity sweeps
✔️ Identify expansion from consolidation
Designed for London, New York, and Asian session strategies.

DEMA200 + EMA9/20/50 + VWAP (Paul Laurent Trading)This script is an all-in-one overlay indicator for TradingView that combines a **DEMA 200**, **EMA 9/20/50**, and TradingView’s **anchored VWAP** (the same VWAP logic as the default VWAP indicator). It’s designed to keep your chart clean while showing key trend and mean-reversion references in one place.
**How to use it**
* Add it to your chart like any indicator: open **Indicators**, search the script name, and click **Add to chart**.
* Use **EMA 9/20/50** for short-term trend and pullback structure (9 = fastest, 50 = slowest).
* Use **DEMA 200** as your long-term trend filter and major dynamic support/resistance.
* Use **VWAP (middle blue line)** as the intraday “fair value” reference. Price above VWAP generally shows stronger demand; below VWAP suggests weaker demand.
* Open the script **Settings** to customize:
* **Colors** and **Strength (line width)** for each line
* VWAP **Anchor Period** (Session, Week, Month, etc.)
* Optional VWAP **Bands** (off by default, can be enabled anytime)
