'last red low / last green high' exitThis is a good alternative to pivot points and ma lines to find long and short exit points (stop loss prices) for a trade.
When you hear traders say "set the stop loss to the recent swing", this indicator seems to do a reasonable job of finding those.
This script marks
the low of the most recent red candle
the high of the most recent green candle
in order to help identify a reasonable stop loss exit point for long and short trades.
You can also specify a distance threshold to the stop loss point.
How to use it.
Decide how far from the current price the exit should be (default 1.5%)
Use your chosen trading strategy to identify a long or short entry position
Add a long/short drawing to the close of the trade candle
Set the stop loos of your drawing to the exit line of this indicator
Set the take profit of your drawing using the desired risk to reward ratio
Note: A good rule is that if this indicator does not show a valid exit line, do not enter the trade.
Note: If the change of a new "last Green High" or the "last Red Low" is below 0.5%, the indicator will keep the previous values
在脚本中搜索"low"

3D GATOR %HLThis indicator tracks the 3 day trading bots and measures the high and the low (%).
Usually a trend can change or continue every 3 days.
When volatility decreases and both values are the same gator is going to open its jaws so it's a good time to open a position long. Avoid shorts during low volatility.
On the other hand when volatility increases, and gator has its jaws wide open is a good time to look for shorts.
That's pretty much it.
This indicator was designed by me and created by Marketwatcher.

Previous High/Low LevelsPrevious High/Low Levels
Select 5 Custom Timeframes to display the previous High and Low levels on your chart.
NOTE: For Levels to work correctly and for price labels to be displayed, Right-click chart background -> select Settings -> select Scales -> tick “Indicator Last Value Label".
Once indicator has been added open settings and select timeframe, color, labels, offset parameters and line style as desired then SAVE.
Handy when using The Strat.

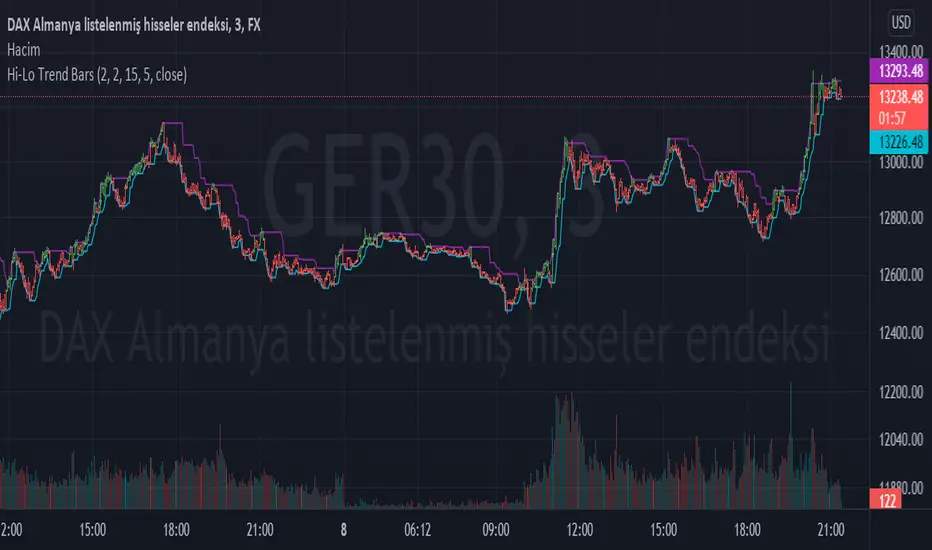
Hi-Lo Trend BarsI present to you a simple but useful indicator.
The basic logic is an indicator that tracks the high of the high bars in the specified range and the low of the low bars in the specified range.
I used two multipliers in order to go out of certain ranges and I tried to provide precision by subtracting this multiplier value from the lowest and highest values.
I set the steps of the multipliers to 0.01 so that it is easy to use on instruments that require finer tuning.
Because every instrument has its own dynamics. You should change the multiplier values according to the instrument dynamics.
For example, under Spot, these multiplier values work efficiently with a large multiplier such as 2.0. It is more efficient in the range of 0.1 - 0.2 in the stock market.
I hope your transactions will be of some use in directional evaluation.
Thanks.
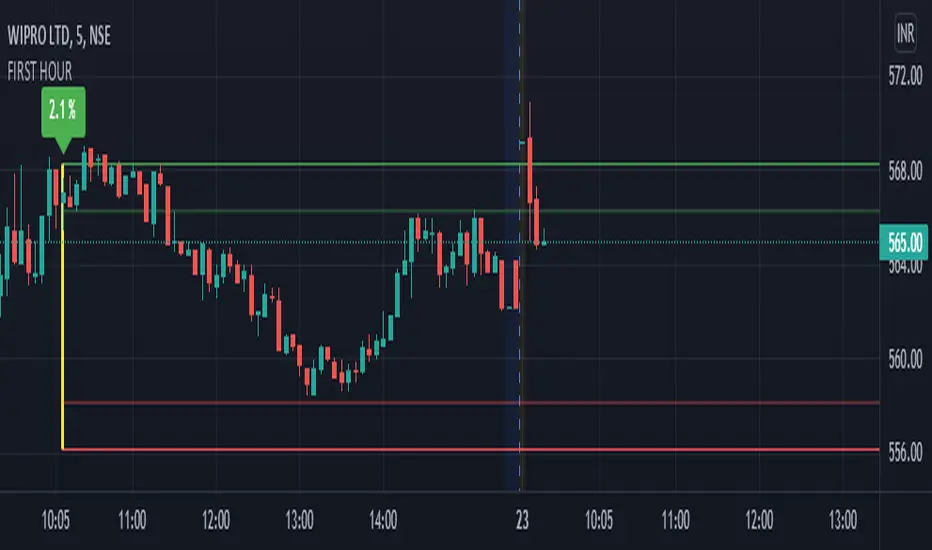
first hour high and low by akash mauryaThis indicator marks the first hour's high and low with a line with the percentage of range height.
First hour high and low generally act as heavy support and resistance or say major key areas in daily intraday charts.
You can adjust the settings if you want to see previous days' hour range lines or not.
This indicator will automatically create hour-range lines after an hour of market opening.
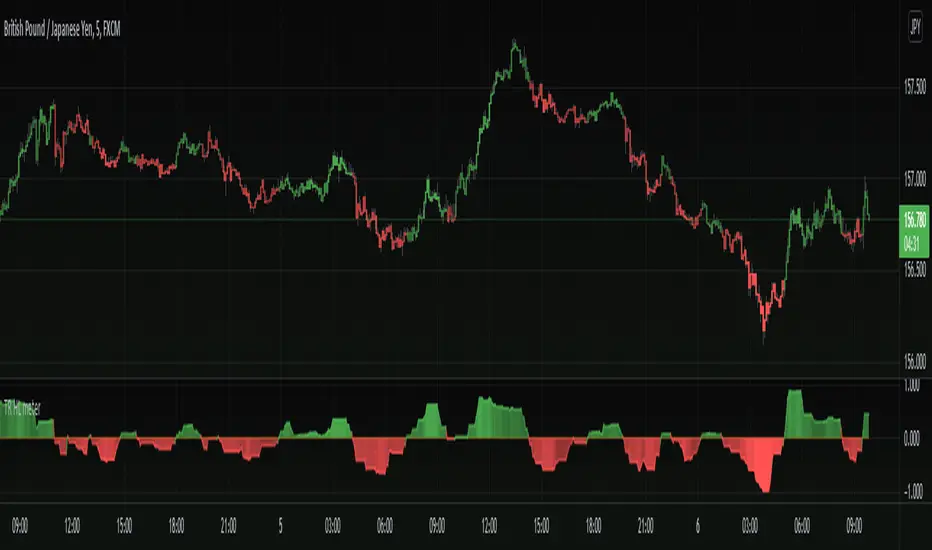
TR High/Low meterInteresting take for a velocity and trend analysis indicator, I call it The TR high/low meter.
First it will find the highest high and lowest low based on X bars back.
Now comes the twist, instead of storing these lowest or highest prices, we store the TR (true range) into the appropriate array (one array for lowest and one array for highest).
Finally, we sum up these two arrays for highest TR's and lowest TR's and subtract each other to get the difference, Hench, see who is stronger.
In the end we plot the difference into the indicator we have here.
The plot is colored with gradient color in which bright color emphasizes the movement is strong and weaker color emphasizes the movement is getting weaker.
Basically this indicator shows us the asset trend direction and strength. Awesome!
==Colors and Bar Colors==
Green: Up Trending
Light Green: Weakening up trend
Red: Down Trending.
Light Red: Weakening Down Trending.
==Notes==
Bar coloring is enabled on this chart!
Supports EMA smoothing (disabled by default)
Like if you like and Enjoy! Follow for more upcoming indicators/strategies: www.tradingview.com
HL Strategy - High Low - 5/5Pivot points observing higher highs, lower lows, lower hights and higher lows

52 Weeks High/Low WidgetSome time ago I published my "All-Time High/Low Widget". I was asked to build and 52w weeks version.
So finally it's ready. It works pretty much the same way but uses a time period only of 52weeks.
You can also change the number of weeks in the parameters.
You can plot the levels and display some stats when 52W high/low happened and how far away are we at this moment.
Also, you can create alerts to get notified on 52W levels breakouts.
Disclaimer
Please remember that past performance may not be indicative of future results.
Due to various factors, including changing market conditions, the strategy may no longer perform as well as in historical backtesting.
This post and the script don’t provide any financial advice.

Daily DeviationShows you the normal deviation from the OPEN based upon historical data.
Levels measured:
Normal range (1 standard deviation) of the CLOSE (vs the OPEN).
Normal daily HIGH +1, +2, +3, and +4 standard deviations.
Normal daily LOW -1, -2, -3, and -4 standard deviations.
Configuration:
Always shows you the normal CLOSE vs OPEN range for the current session.
Can display previous day's ranges (extra days) based upon the calendar (not trading days).
Normally displays which levels have been exceeded (to reduce noise and keep auto-scale to a minimum), but can show all the ranges for the current session.
The default number of days to measure (50) will affect the accuracy but outliers are cleaned to avoid dramatic variance.
Note:
These are only statistical representations of what has occurred in the past. You can interpret the current price as oversold or overbought for the day (and only that day) relative to the OPEN. Gaps high or low are not considered in the equation.

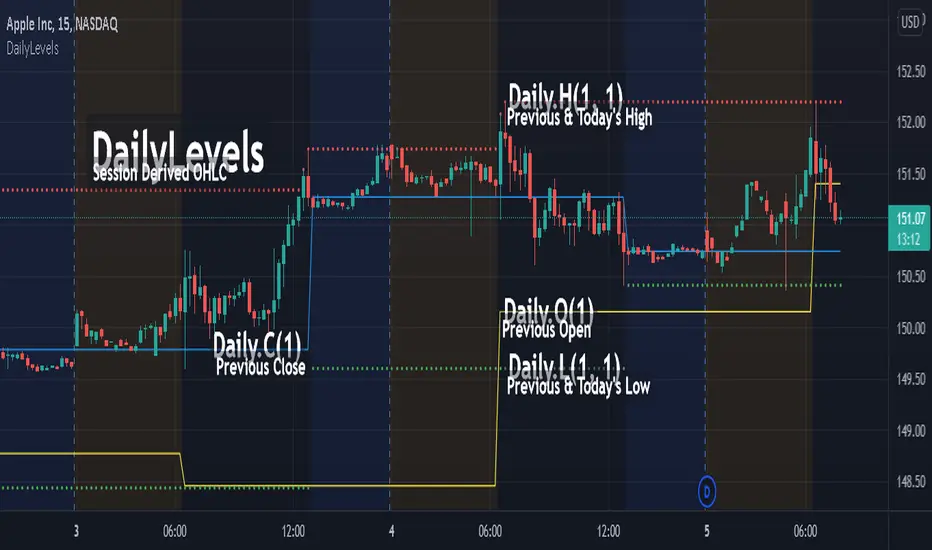
DailyLevelsLibrary "DailyLevels"
Functions for acquiring daily timeframe data by number of prior days.
openD(daysPrior, spec, res) Gets the open for the number of days prior.
Parameters:
daysPrior : Number of days back to get the open from.
spec : session.regular (default), session.extended or other time spec.
res : The resolution (default = '1440').
Returns: The open for the number of days prior.
highD(daysPrior, extraForward, spec, res) Gets the highest value for the number of days prior.
Parameters:
daysPrior : Number of days back to get the high from.
extraForward : Number of extra days forward to include.
spec : session.regular (default), session.extended or other time spec.
res : The resolution (default = '1440').
Returns: The high for the number of days prior.
lowD(daysPrior, extraForward, spec, res) Gets the lowest value for the number of days prior.
Parameters:
daysPrior : Number of days back to get the low from.
extraForward : Number of extra days forward to include.
spec : session.regular (default), session.extended or other time spec.
res : The resolution (default = '1440').
Returns: The low for the number of days prior.
closeD(daysPrior, spec, res) Gets the close for the number of days prior.
Parameters:
daysPrior : Number of days back to get the open from. 0 produces the current close
spec : session.regular (default), session.extended or other time spec.
res : The resolution (default = '1440').
Returns: The close for the number of days prior.
hlc3D(daysPrior, extraForward, spec, res) Gets the HLC3 value for the number of days prior.
Parameters:
daysPrior : Number of days back to get the HLC3 from.
extraForward : Number of extra days forward to include. Determines the closing value.
spec : session.regular (default), session.extended or other time spec.
res : The resolution (default = '1440').
Returns: The HLC3 for the number of days prior.
ICHIMOKU Crypto Swing StrategyThis is a crypto swing strategy designed for timeframes bigger than 1h.
The main components are
ICHOMOKU
KDJ
Average High
Average Low
Rules for entry
For long: we have the ichimoku crosses between tenkan and baselines, we have a rising kdj line and at the same time we have a increase in the average high
For short: we have the ichimoku crosses between tenkan and baselines, we have a falling kdj line and at the same time we have an increase in the average low
Rules for exit
We exit when we have inverse conditions than the initial ones used for entry.
Caution
This strategy does not use a risk management, so be careful with it !
If you have any questions let me know !

Michigandolf's 30min Opening RangeThis script plots the 30min Opening Range as well as the previous day's high & low.
Description:
Blue Line = Top of the 30min Opening Range for the session
Pink Line = Bottom of the 30min Opening Range for the session
White Line = Mid-Point of the 30min Opening Range for the session
White Transparent Area = The full range of the 30min Opening Range
Green Line = Yesterday's High for the session
Red Line = Yesterday's Low for the session
Use:
The Opening Range will continue to expand until the first 30minutes of trading has passed, at which point the range will lock in place for the remainder of the trading session. Many traders use these important levels to gauge trade entries and exits (e.g. Mark Fisher's ACD strategy).
This script does not work currently work for futures (e.g. ES, NQ, RTY) due to the session start time. Will configure for futures trading in a future update.

Pivot High/Low Analysis & Forecast [LuxAlgo]Returns pivot points high/low alongside the percentage change between one pivot and the previous one (Δ%) and the distance between the same type of pivots in bars (Δt). The trailing mean for each of these metrics is returned on a dashboard on the chart. The indicator also returns an estimate of the future time position of the pivot points.
This indicator by its very nature is not real-time and is meant for descriptive analysis alongside other components of the script. This is normal behavior for scripts detecting pivots as a part of a system and it is important you are aware the pivot labels are not designed to be traded in real-time themselves
🔶 USAGE
The indicator can provide information helping the user to infer the position of future pivot points. This information is directly used in the indicator to provide such forecasting. Note that each metric is calculated relative to the same type of pivot points.
It is also common for analysts to use pivot points for the construction of various figures, getting the percentage change and distance for each pivot point can allow them to eventually filter out points of non-interest.
🔹 Forecast
We use the trailing mean of the distance between respective pivots to estimate the time position of future pivot points, this can be useful to estimate the location of future tops/bottoms. The time position of the forecasted pivot is given by a vertical dashed line on the chart.
We can see a successful application of this method below:
Above we see the forecasted pivots for BTCUSD15. The forecast of interest being the pivot high. We highlight the forecast position with a blue dotted line for reference.
After some time we obtain a new pivot high with a new forecast. However, we can see that the time location of this new pivot high matches perfectly with the prior forecast.
The position in time for the forecast is given by:
x1_ph + E
x1_pl + E
where x1_ph denotes the position in time of the most recent pivot high. x1_pl denotes the position in time of the most recent pivot low and E the average distance between respective pivot points.
🔶 SETTINGS
Length: Window size for the detection of pivot points.
Show Forecasted Pivots: Display forecast of future pivot points.
🔹 Dashboard
Dashboard Location: Location of the dashboard on the chart
Dashboard Size: Size of the dashboard on the chart
Text/Frame Color: Determines the color of the frame grid as well as the text color

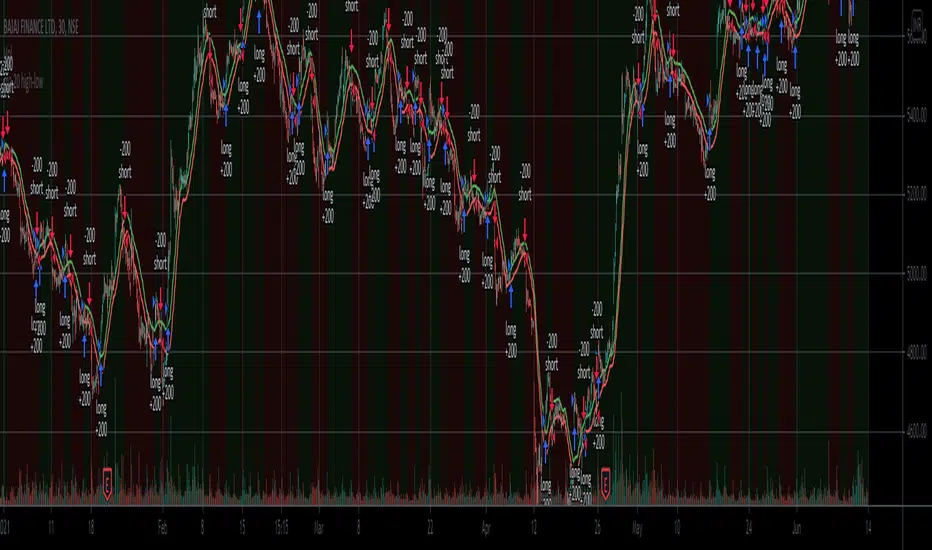
ma 20 high-lowThis is a simple 20-period high and low SMA strategy. We buy the stock when it closes above the 20 period SMA of high prices and sell when it closes below it. We sell when the price closes below 20 period SMA of low prices. This strategy works phenomenally well for a few stocks examples are bajaj finance and bajaj finserv. I want to see if it makes a good return in future. It works well for 30 mins and a daily time frame.
#TheStrat - Highs and Lows of Candles of 4 Custom Time framesThe bread and butter of strat traders is multi-timeframe analysis. We do MTFA in 2 different ways: 1) By Looking for entries confirmed by Full Timeframe Continuity which is just another way of saying that on multiple timeframes, the candles currently forming are all uniform in direction(ie. all red candles or all green candles), and 2) Looking for Strat reversal on lower timeframes that trigger your higher timeframes reversals.
This script is concerned with the latter piece of multi-timeframe analysis, and its application to the strat
Anyone who has watched Sara's videos teaching the strat can see how she uses the highs and lows of her major time periods, the monthly, weekly, and daily, to find entries from her lower time periods to trigger her higher timeframes. This script performs the process of marking the highs and lows of 4-major time periods automatically so that you do not need to mark every single chart you use manually. I have found this script to be very useful, and convenient. I hope that other stratters find it as useful as I am. Below outlines how to use this, although it is mostly self-explanatory. Special thanks and credit to millerrm, who I used his original code snippets to rework his original script to something more tailored to my personal use cases.
Settings -
You can change the time periods of the candles that you would like to mark to any time frame using the 4 dropdown boxes marked TF#
You can choose to toggle the lines for each given time period on and off, in the settings by checking off each time period.
The default colors are purple, blue, orange, and white, in order respective of time from shortest to highest
The default time periods are 3hr, 6hr, 12hr, and daily

Distance High-Low, Open-Close 8 DaysPinescript tables are a nice addition to the language. This one shows a complete distance from daily low to daily high and/or from the daily open to the daily close.
► You can show the distance between low and high
► You can show the distance between open and close
► Have this data for 8 last days
► Flip a table if you need to
I used the original TradingView's code in their news blog.
Have a nice day!

Highest High, Lowest LowHi guys,
This is a simple indicator that I think looks 😎
Basically just determines what the Highest High and the Lowest Low for X bars is.
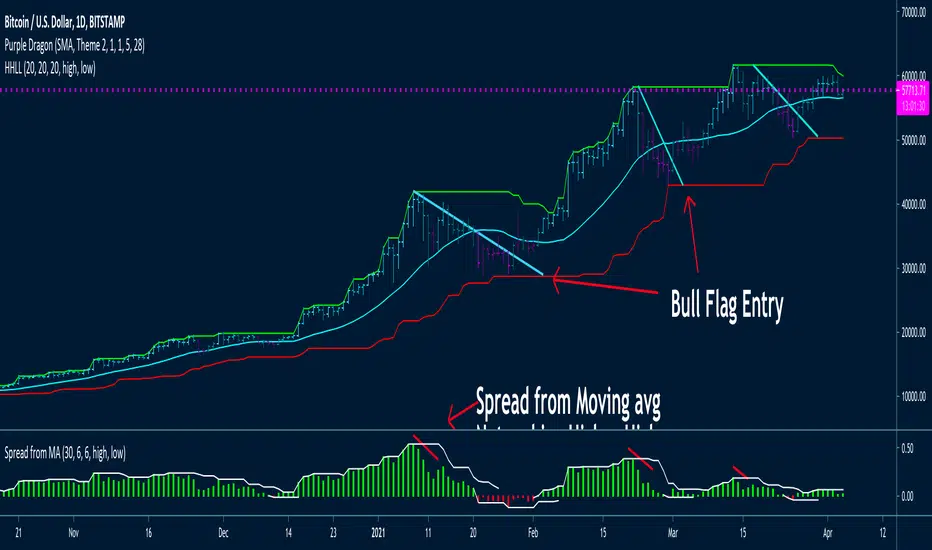
As many of you know, moving averages are quite susceptible to noise ~ I like how how this really shows key inflection points on the chart and reduces trade signal chop which leads to losses.
Seems to be a good system to use with bull flags, on tickers like: BTCUSD, TQQQ, SSO, SPX etc.
Highest High and Lowest Low lookback periods can be changed to your needs
Have included a Moving Average
Will be coding a strategy for this in the next couple of weeks.
Have included in an alert system
Spread from Moving average indicator is available under my other scripts -- seems to indicate when price momentum is starting to stall by price not moving further away from the moving average. That would indicate good points to take profits, as price will likely do a mean reversion 😭
HiLo Extension This Strategy is finding high and low breaks of the day and enter into the trader based on RSI value and time value
1) This strategy is created for Indian Index like Nifty, Bank Nifty and so...
2) Trades are initiate only after 10:15 AM and before 3:10PM
3) High and Low of the day break will be check during the above time frame
4) RSI value will be check (RSI 50)
5) and trade will be initiate
6) Stop loss set as vwma 20...
Note: This Script will work fine in Index future chart not index spot chart...
This is just my idea only... Please back test yourselve, before using it..
Your comments are welcome!

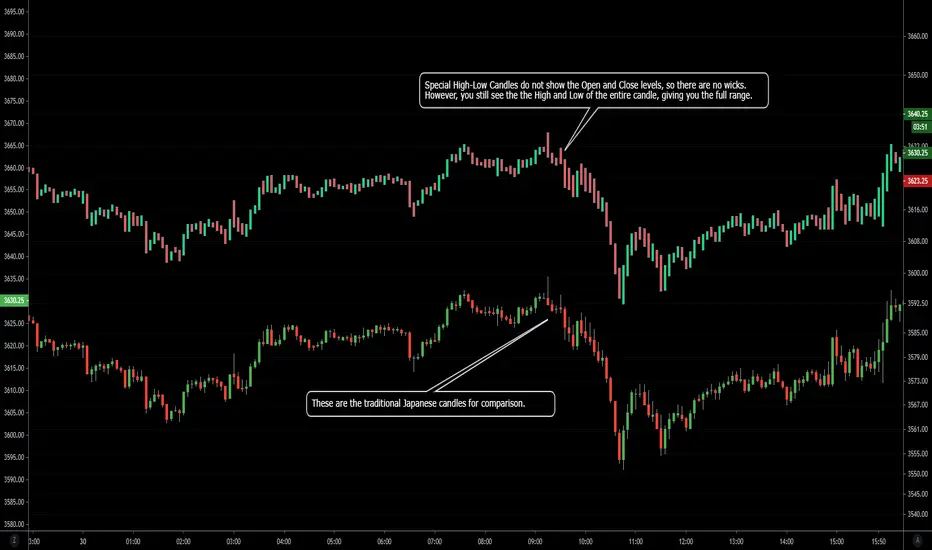
NSDT Special High-Low CandlesThis is an interesting take on candlesticks. These special High-Low Candles do not show the Open and Close levels, so there are no wicks. However, you still see the the High and Low of the entire candle, giving you the full range.
Since this is an indicator, be sure to hide the chart candles to avoid overlap. Or choose offsetting colors to see the traditional candles under the indicator candles.
Rise from All Time LowThis very simple script lets you see how much the asset rose from the All Time Low (ATL).
First, the ATL is calculated and plotted. Then, we measure the distance from ATL and current bar close.
Two labels are plotted :
ATL label
Current close label with rise and rise
It can be useful for penny stocks trading when you want to buy lows but must see how much the price rose last bars to improve entries.
For example, SQBG is actually "only" at x 1.85 from ATL (not an advice in investment) :
If you have ideas to complete or improve this script, let me know in comments ;)

52/N Weeks High/LowPlots 52 Weeks historical high and low with respect to each bar.
Works on all timeframes - minute, days, weeks, months - and always plots 52 weeks historical high and low.
The 52 weeks lookback window slides backwards as we plot for older / historical bars on the chart.
Instead of 52 weeks, number of weeks to look back can be specified using 'No. of weeks to lookback' parameter in Settings --> Inputs.
Style and color for 'High' and 'Low' plots can be changed through Settings --> Style

Higher High / Lower Low StrategyThis is a very simple trend following strategy for Day Trading. The premise is to follow the Moving Average for the trend direction and buy/sell the dips and blips in the trend.
1. In an uptrend, when the candle action offers a "dip", or a lower high, the strategy will then buy on the close of the candle that breaks the high of the previous candle.
2. In a downtrend, when the candle action offers a"blip", or a higher low, the strategy will then sell on the close of the candle that breaks the low of the previous candle.
3. The strategy will go Long only or Short only, not both. It must be manually reversed in the settings when a new trend is established.
4. The start month and year allow you to backtest from then until now. It's not one month at a time.
5. The strategy uses a reversal of the Stochastic %K variable as the exist. The setting for Period K controls the exit for backtesting purposes.
6. The strategy uses a moving average to determine the trend. The setting for the Period MA controls the SMA.
7. The strategy has the option of filtering the number of trades based on the direction of the MACD and/or the Signal line. This can either reduce or increase the probability, and is highly dependent on the price action of the instrument.
WARNING: I am not a licensed financial advisor. This script is intended for entertainment purposes only. I highly recommend you manually enter and exit positions per your own Trading Rules, and do not blindly follow any software or recommendation. Use of this script is elective and at your own discretion, and risk.
If you like this script, please give it a Thumb's Up, and leave a comment. If you would like any custom scripts developed, contact me to discuss it. All of my work here is open and available, free of charge. It can be copied and edited to suit your needs.

BB Indicator - Marks High and low of premarket,daily,yesterdayThis indicator marks what is known as the BB system - Marks on your chart the premarket high and low, current intraday high and low and yesterday's high and low. For the style of the line you can only change the colour, if you make the line a different style it shouldn't show up because if it did it makes the lines ugly.
Pick and select which levels you would like using the indicator and you can also turn on and off the labels if you don't want them.
