Previous Period High/Low LevelsThis indicator plots the previous day, week, and month high and low levels to highlight key liquidity levels.
Perfect for traders using market structure, liquidity, or SMC concepts.
Features:
Auto-plots PDH/PDL, PWH/PWL, and PMH/PML
Adjustable line styles, widths, and label sizes
Toggle price display on or off
Accurate UTC offset handling
在脚本中搜索"low"

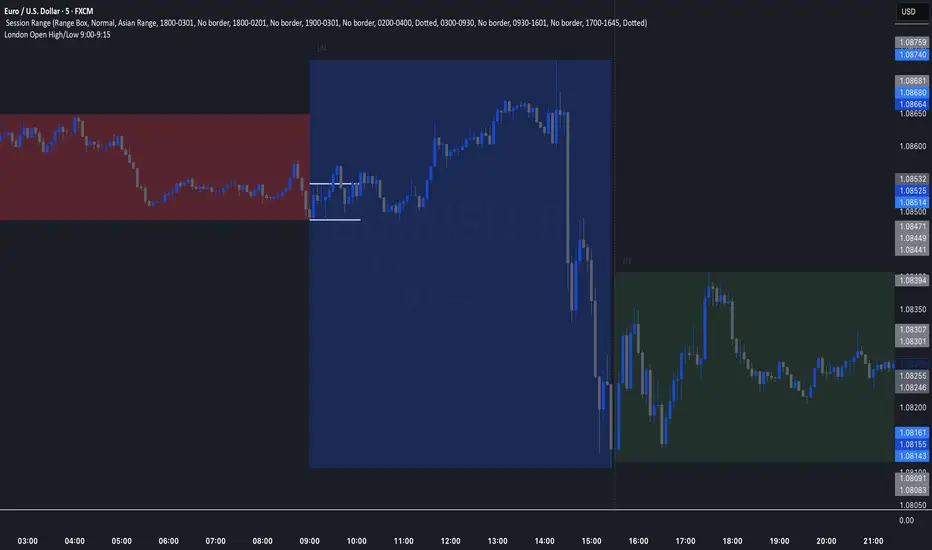
London Open High/Low 9:00-9:15indicator marks out high and low of the first 15 minutes of the London session.
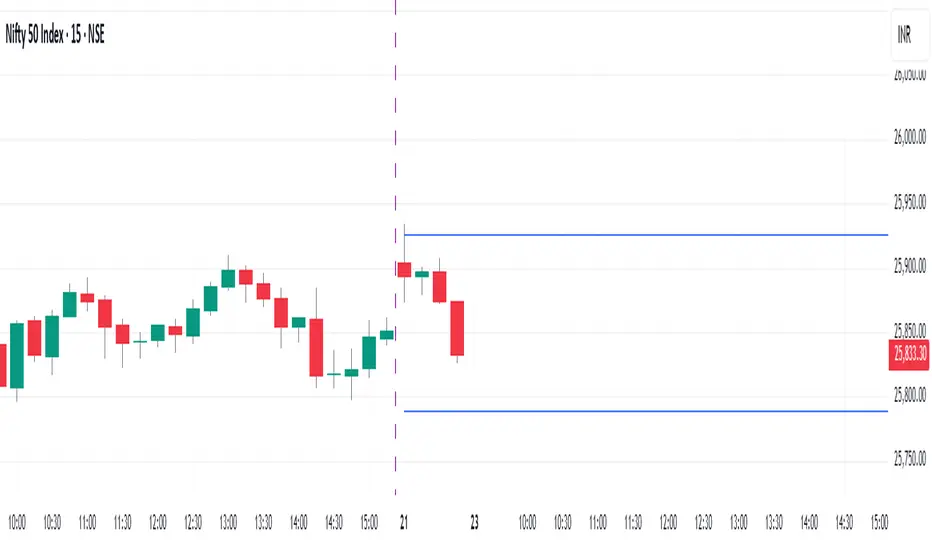
Previous day high lowThis script Identifies and draw Previous day High low on 15 min Intra day chart
Daily Close Cross Above SMA 20 (Low)Daily closing price crosses above SMA 20 low, signals a bullish trend.

Previous Day High-LowIt will show Previous Day High-Low. This will create two horizontal lines automatically updated each day, marking yesterday’s high and low levels clearly on any intraday chart.

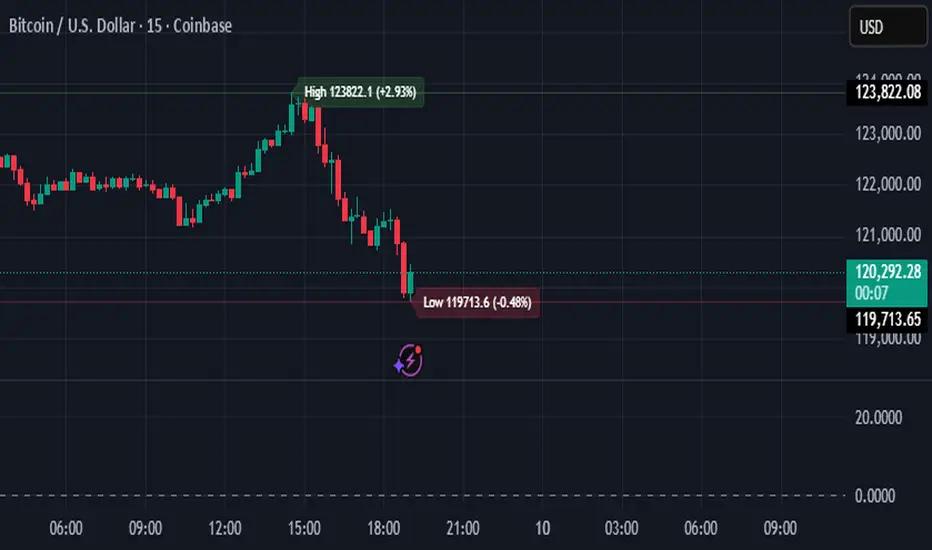
Dynamic Percentage High LowThis script gives a clear percentage wise view of visible high and low on all time frames in your view. It's dynamic.
Forex Session High/Low TrackerThis indicator maps out each Forex session along with their relative highs and lows.

3 Red Heikin Ashi with Higher Lows3 Red Heikin Ashi with Higher Lows. Will Give a Buy Signal when 3 Red Heikin Ashi with Higher Lows is formed


Swing High/Low MarkerThis indicator allows you to find the swing highs and lows of the chart and offsets it by the ATR and a custom factor to give you concrete breakout and stop loss prices.

NY 14:30 High/Low - 1mThis indicator automatically draws horizontal lines for the High (green) and Low (red) of the 14:30 (Lisbon) candle on the 1-minute chart.
It is designed for traders who want to quickly identify the New York open levels (NY Open), allowing you to:
Visualize the NY market opening zone.
Use these levels as intraday support or resistance.
Plan entries and exits based on breakouts or pullbacks.
Features:
Works on any 1-minute chart.
Lines are drawn immediately after the 14:30 candle closes.
Lines extend automatically to the right.
Simple and lightweight, no complex variables or external dependencies.
Daily reset, always showing the current day’s levels.
Recommended Use:
Combine with support/resistance zones, order blocks, or fair value gaps.
Monitor price behavior during the NY open to identify breakout or rejection patterns.

OPEN = LOW + VWAP + Volume SurgeTradingView Pine Script that scans for OPEN = LOW, confirms VWAP support, and checks for volume surge — tailored for your intraday breakout strategy

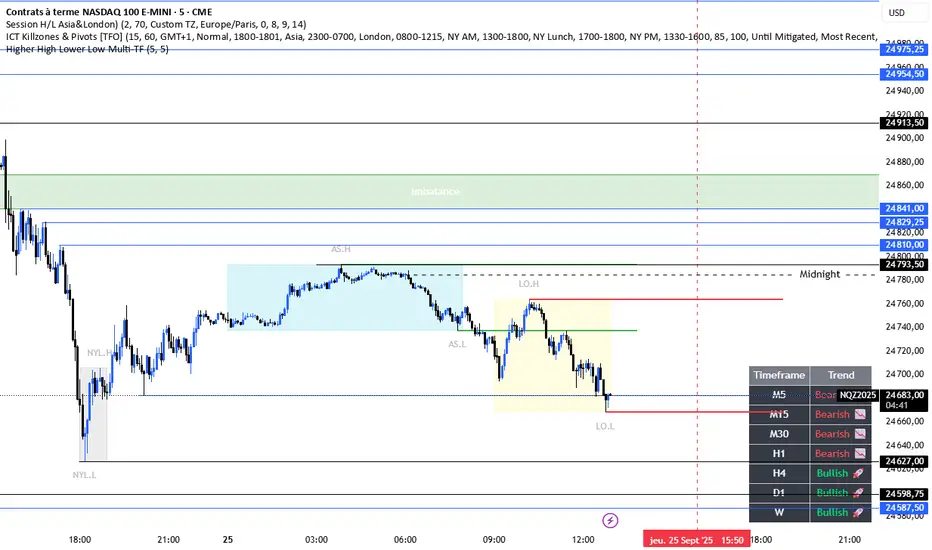
Higher High Lower Low Multi-TF📊 Higher High Lower Low Multi-Timeframe Indicator
Detects market structure shifts (HH, HL, LH, LL)
Identifies trend direction (bullish / bearish / neutral)
Works across multiple timeframes (M5 to Weekly)
Displays a compact trend summary table on the chart
Customizable pivot sensitivity (Left/Right Bars)
Visual labels on chart for structure points
Ideal for structure-based trading and SMC traders
Vortag High/LowThe script displays the previous day's high/low during trading hours from 9:30 to 16:00 EST. This gives us a clean chart.

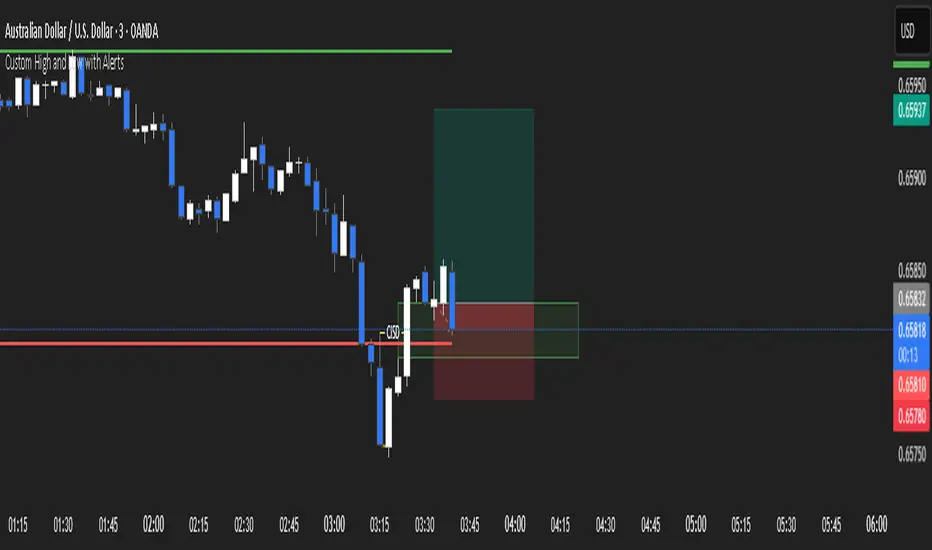
Custom High and Low (W,D,4,1)Custom High and Low (W,D,4,1)
can choose Weekly Daily 4h 1hr Previous High and Low.
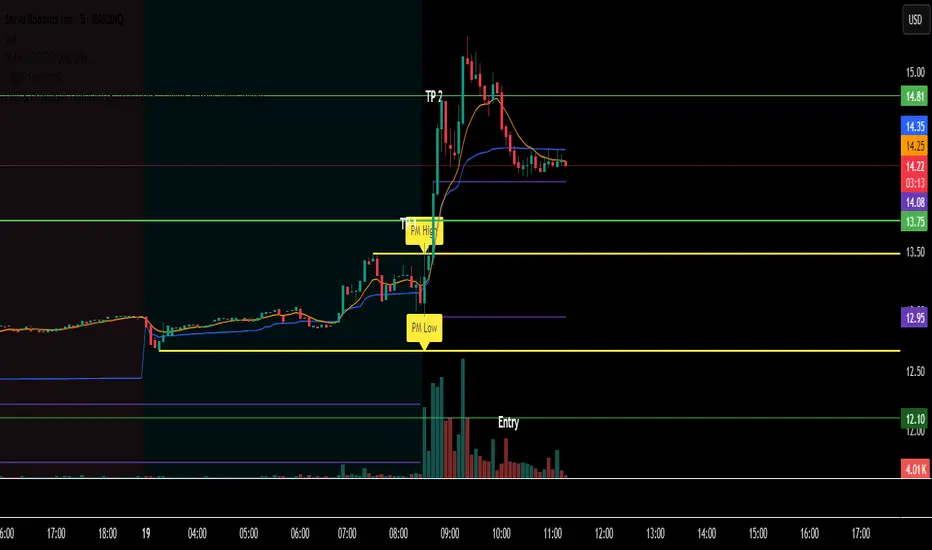
ES/NQ, Pre-Market High & Low (04:00 AM - 09:30 AM)This indicator marks the Pre market high and Pre market low from 04:00am to 09:30am for any us Index

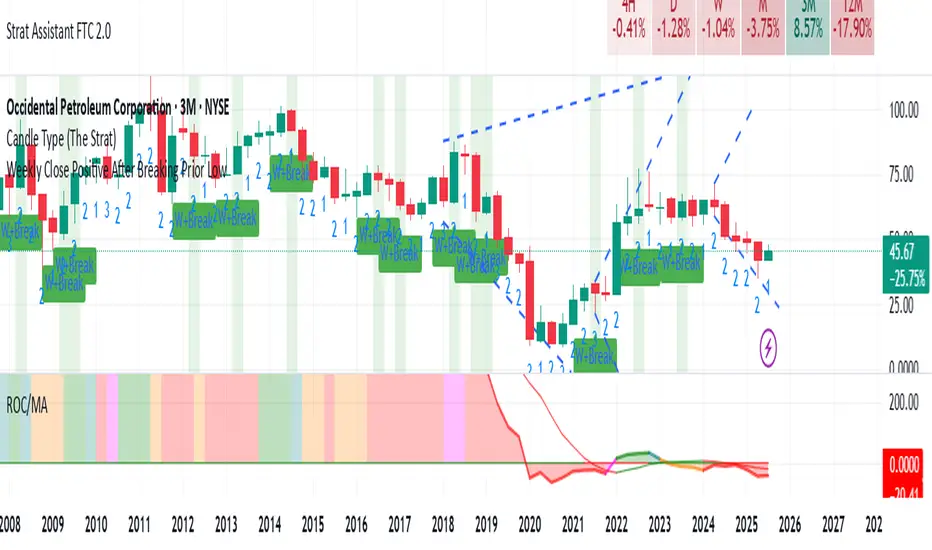
Weekly Close Positive After Breaking Prior LowClosing positive after breaking prior low on weekly basis
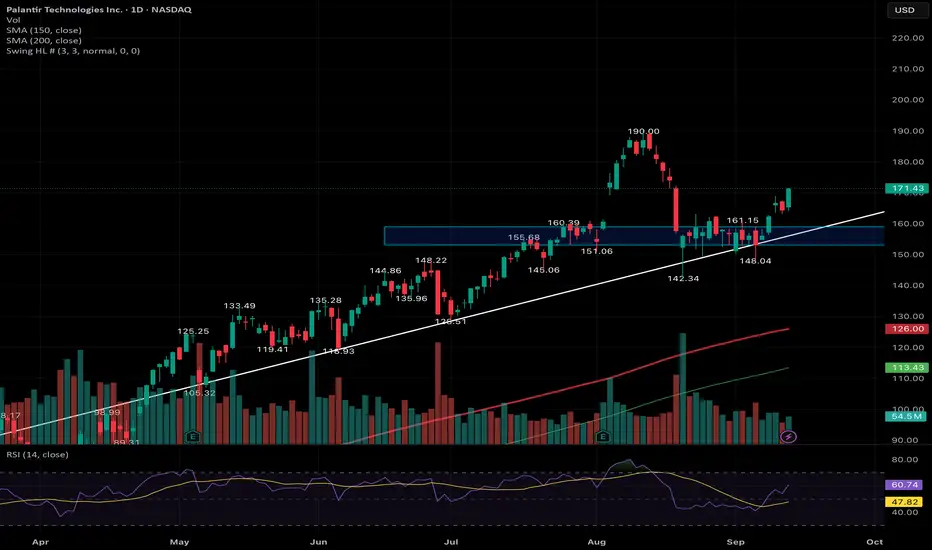
High and Low - MS - 2.0"Showing the high and low points with numbers.
Micha the leftist didn’t say how it’s called in his video.
#LeftismIsAMentalIllness"
נותן לראות את הנקודות הגבוהות והנמוכות עם מספרים
מיכה השמאלן לא אמר איך קוראים לזה בסרטון שלו
#שמאלנותזומחלתנפש
14/09/2025

High and Low - MSShowing the high and low points with numbers.
Micha the leftist didn’t say how it’s called in his video
#LeftismIsAMentalIllness
נותן לראות את הנקודות הגבוהות והנמוכות עם מספרים
מיכה השמאלן לא אמר איך קוראים לזה בסרטון שלו
#שמאלנותזומחלתנפש
RSI HIGHs and LOWs MarkerThis indicator marks significant RSI (14) pivot points directly on the price chart.
Red markers above candles highlight confirmed RSI highs where the RSI value exceeded 75 (overbought zone).
Green markers below candles highlight confirmed RSI lows where the RSI value dropped below 25 (oversold zone).
These signals help traders quickly identify potential reversal zones and overextended market conditions without having to monitor the RSI window separately.

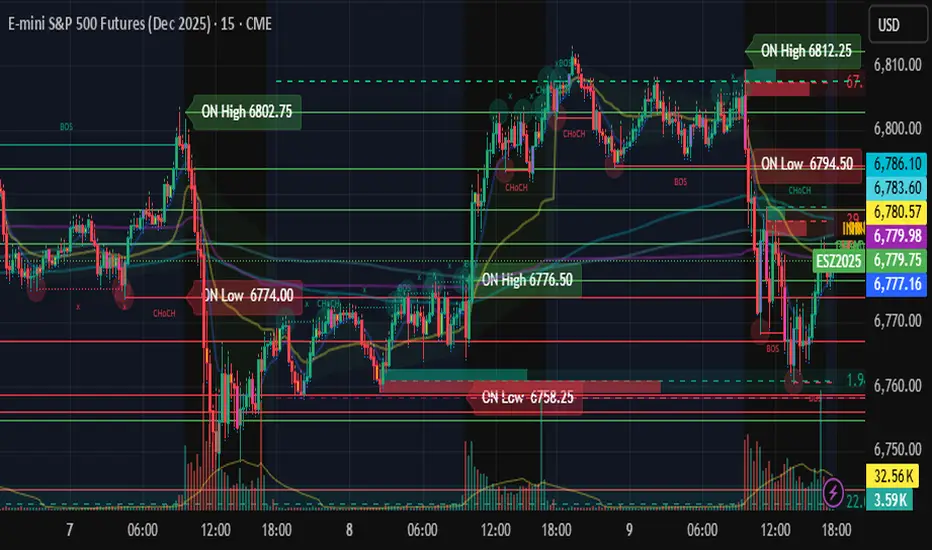
All in oneict trading session, silver bullet. perfect session of trading. help with timing to enter for max profit. also with high and low of previous day, week, month
