在脚本中搜索"low"
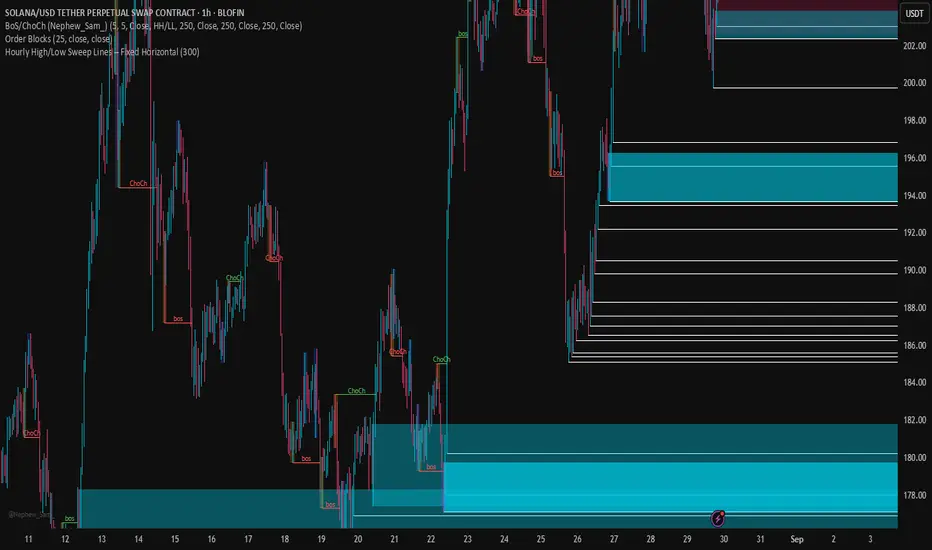
Hourly High/Low Sweep Lines – Fixed HorizontalMarks out the hourly high and lows for levels of liquidity for take profits
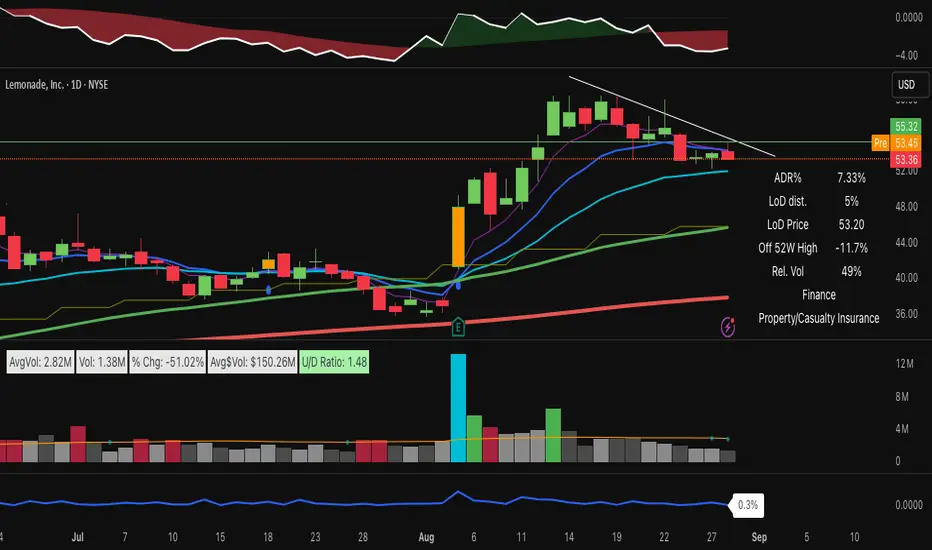
Live price distance from low of the dayThis simple indicator state the distance of the actual price from the low of the day - Simple tool to help position sizing :)
MTF Last Closed Highs & LowsThis indicator plots the most recent closed high and low levels from multiple timeframes (4H, Daily, Weekly, Monthly, etc.) directly on your chart. It helps traders quickly spot key support and resistance zones, track market structure across different timeframes, and identify breakout or reversal opportunities.

Auto Daily High/Low/50%This indicator automatically plots the current daily high and low, as well as the midrange.

Customisable Asia & London Session High/Low (UTC+1)london + asia high / low
can customise however you like. its not perfect but saves time
Daily High & Low - 200 bars (Historical)Daily highs and lows.
High marked with a red line.
Low marked with a green line.
plotted on the 5 min chart.

Previous Days High & Low RTH Session by TenAM TraderPurpose:
This indicator plots the high and low levels of previous trading days’ Regular Trading Hours (RTH), helping traders identify key support and resistance zones based on historical price action.
How to Use / Strategy:
Designed as a super simple trading strategy:
Buy when price breaks above and confirms the previous day’s high.
Sell when price breaks below and confirms the previous day’s low.
Alerts notify you when price interacts with these levels, helping traders act on confirmed breakout opportunities rather than premature moves.
*Traders can also look for reversal opportunities if price breaks back through one of the levels.
Note: Make sure RTH (Regular Trading Hours) is turned on for the chart, as the indicator is based on RTH highs and lows.
Features:
Tracks previous days’ highs and lows.
Provides clear visual reference for support and resistance.
Simple, actionable strategy based on breakout confirmations and reversal plays.
Alerts for confirmed price breaks.
Disclaimer:
This indicator is for educational and informational purposes only. It does not provide financial advice. Trading involves risk, and past performance does not guarantee future results. Users trade at their own risk.

Multiple Session Pre-market High/LowThis indicator marks each day’s pre-market range and projects it into the opening move so you can see how price reacts after the bell. It tracks the **pre-market high/low** within a user-defined window (default **04:00–09:29 ET**) and, at **09:30 ET**, draws two solid horizontal lines from **09:30 to 11:00 ET** at those levels. For additional context, you can optionally show matching **dotted lines** across the pre-market window itself. Everything is anchored to **America/New\_York** time (DST-safe), and colors/widths for both the RTH and pre-market lines are fully customizable.
It’s built for **back testing and review**: levels are finalized at 09:30 and **do not repaint**, so what you see historically is what you would have had live. Use it to study opening drive behavior, VWAP/OR confluence, gap fills, and rejection/acceptance around the pre-market extremes. Works on any intraday timeframe; for stocks, enable **Extended Hours** so the 04:00–09:29 bars are available (futures usually include them by default). Adjust the pre-market start/end inputs to match your playbook (e.g., 07:00–09:29) and evaluate your strategies consistently across months of data.

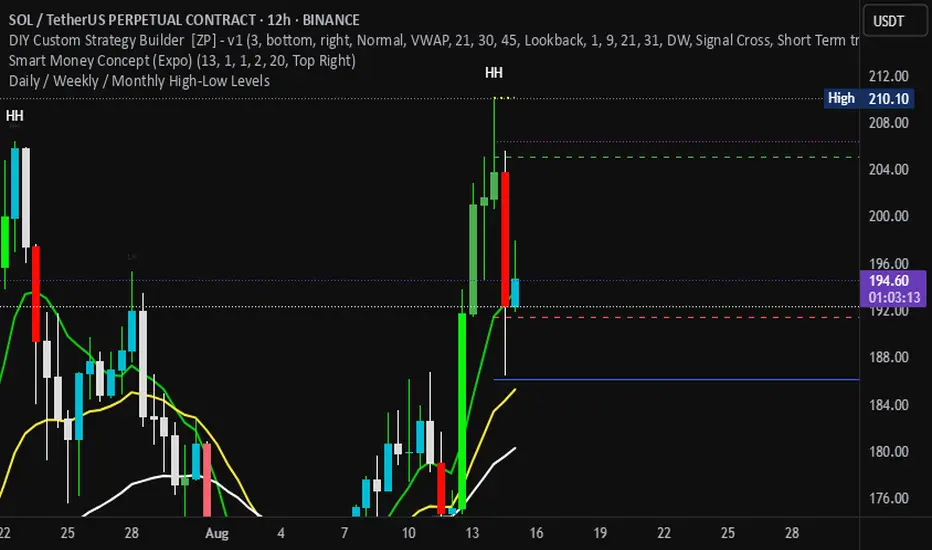
Daily / Weekly / Monthly High-Low Levels (Arindam )How it works:
Daily levels are taken from the previous day.
Weekly levels are from the previous week.
Monthly levels are from the previous month.
They extend across the chart for visual reference.
You can customize colors, line styles, or whether they reset each session.
Do you want me to also add labels on the right side (e.g., “Daily High”, “Weekly Low”) so the lines are clearly marked?
xmtr's session highs/lowsMarks Asia & London session highs/lows with precision + PDH/PDL for daily context. Fully customizable & perfect for all traders.

Intraday High/Low BandPlots an intraday high low band showing when the stock hits a new daily high/low.
Band can be defined as percentage of the daily range.

High/Low Premarket & Previous Day This scripts adds lines for previous day and premarket high/low with labels that you can toggle on and off. The lines extend through current premarket and trading session

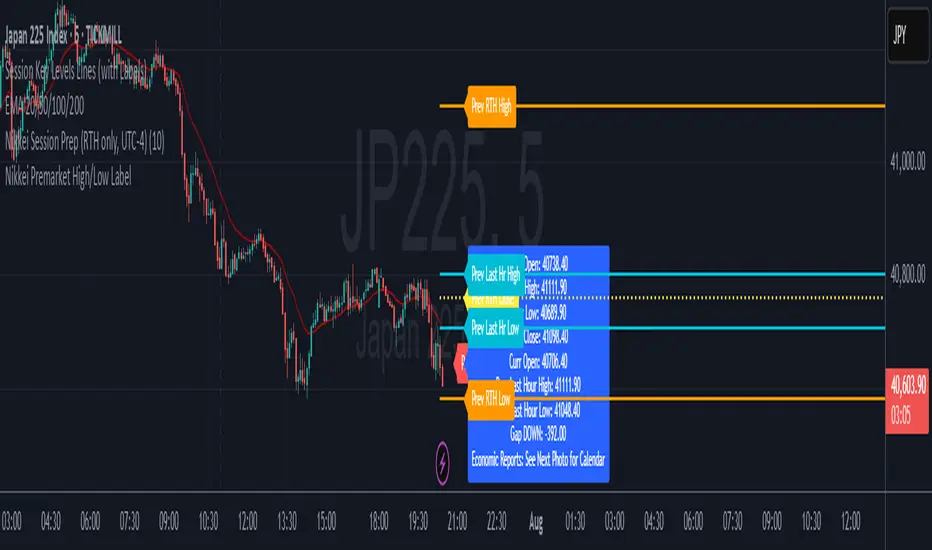
Nikkei Premarket High/Low LabelThis is Nikkei Premarket High/Low Label. shows you the premarket high and low. hope it helps :)

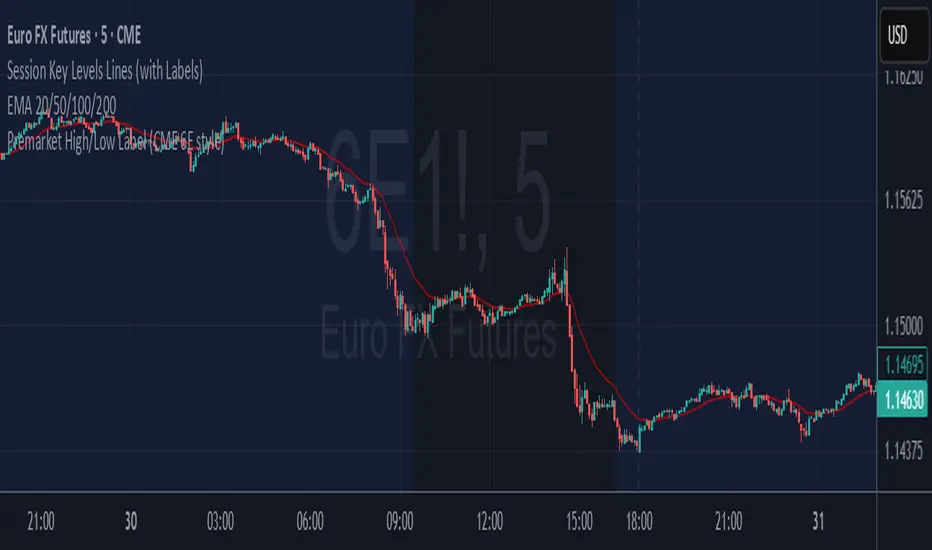
6E update Premarket High/Low Label (CME 6E style)6E update Premarket High/Low Label (CME 6E style). hope it helps :)
Premarket High/Low LabelThis is the premarket high low label that will persist through current trading session. hope it helps :)
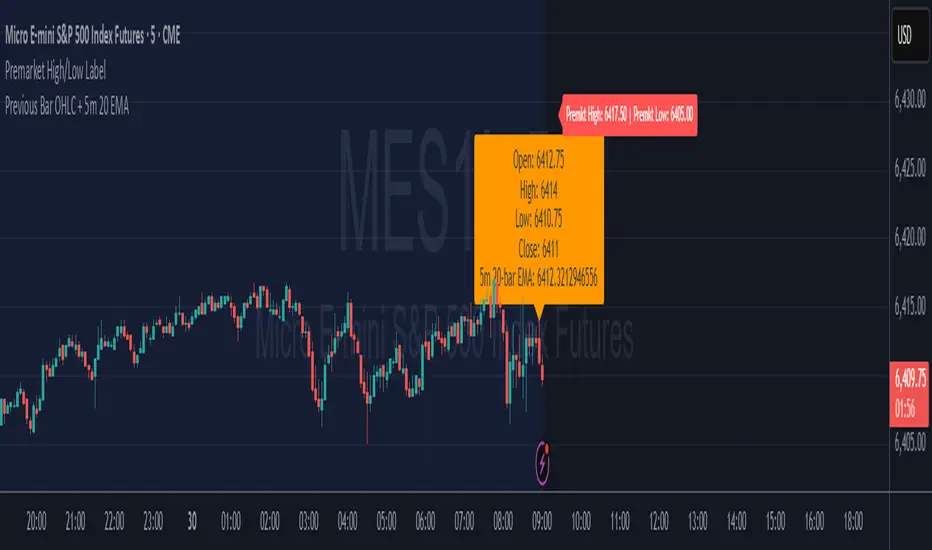
Premarket High/Low LabelThis is an indicator which shows premarket high/low label. so that you dont have to do it yourself. hope it helps :)

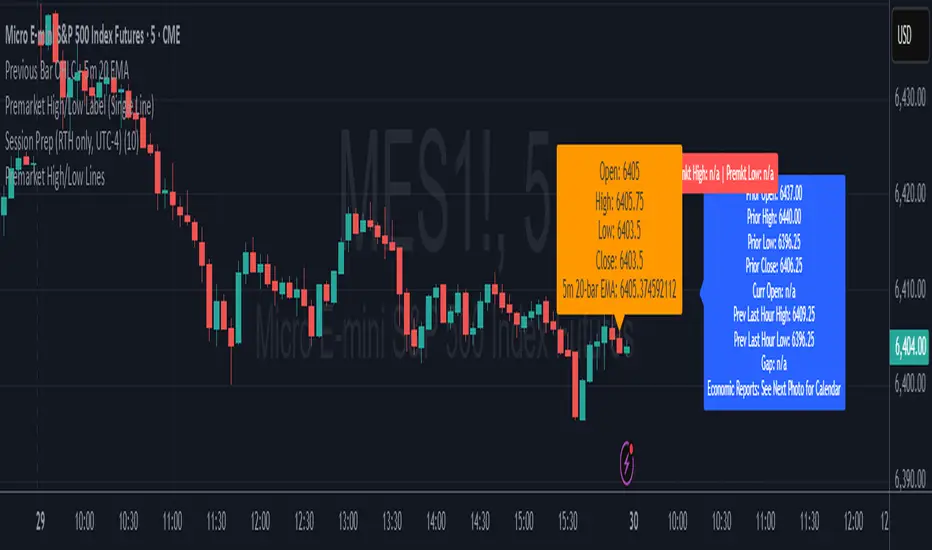
Premarket High/Low Label (Single Line)it shows you what the premarket high low label is on a single line, saving you the hassale of fidning it yourself. :) hope it helps.
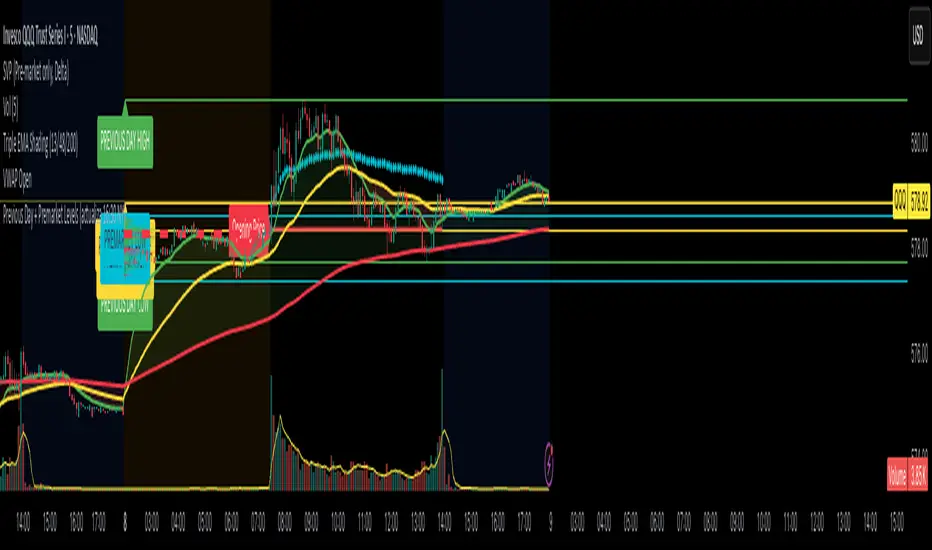
Previous Day Levels (High, Low, Open, Close)This TradingView Pine Script indicator plots the previous day’s price levels (High, Low, Open, and Close) as horizontal rays that extend across the current trading day.
Green lines mark the Previous Day High and Previous Day Low.
Yellow lines mark the Previous Day Open and Previous Day Close.
Labels are automatically displayed at the right edge of the chart, positioned above each line, making it easy to identify the corresponding level in real time.
The levels are updated daily and always begin at the start of the current day, ensuring that they cover the entire intraday session.
This tool helps traders quickly visualize key support and resistance levels from the previous trading day and incorporate them into intraday strategies.
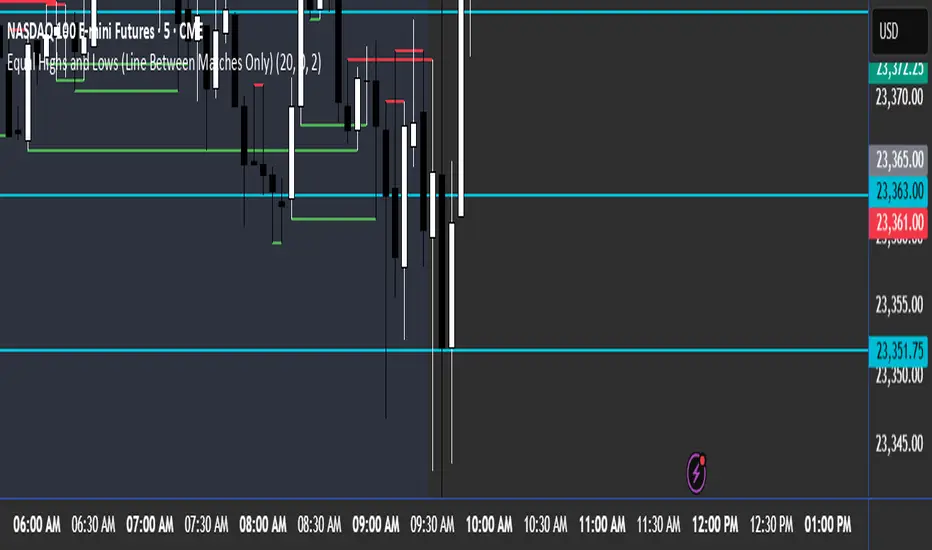
Equal Highs and Lows (Line Between Matches Only)marks out equal highs and lows with a solid red line and solid green line. Only marks out till the next candle
Previous Candle High/Low (Clean)✅ Creates one horizontal line for the previous candle’s high (green).
✅ Creates one horizontal line for the previous candle’s low (red).
✅ The lines update on each new candle, always following the most recent previous high/low.
✅ The lines are extended to the right — they don’t stack or clutter the chart.
✅ Works on all timeframes.

Opening Range + Full-Day High/Low + Prev Day LevelsDraws a box around the first 15min range with horizontal lines extending throughout the day, with faded lines of the previous day's highs and lows, also draws arrows for 5m breakouts of those levels
