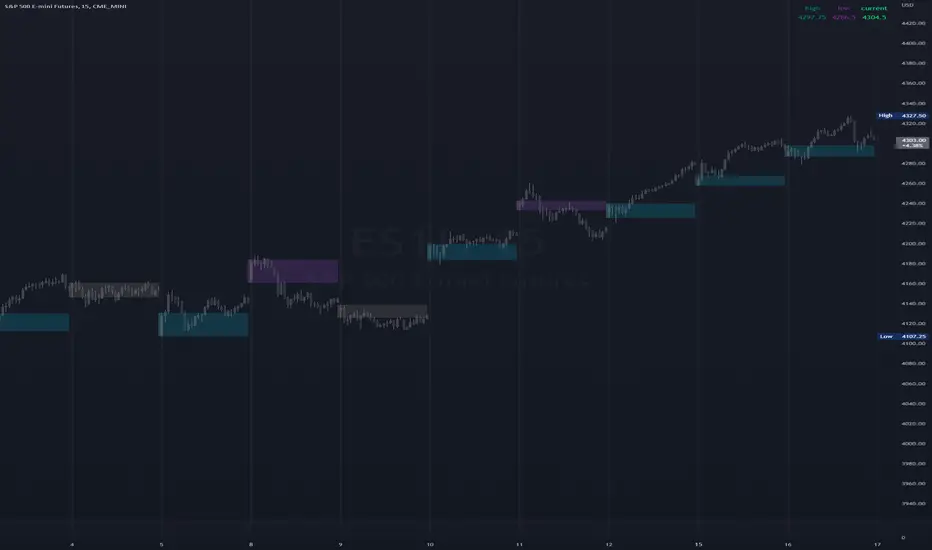
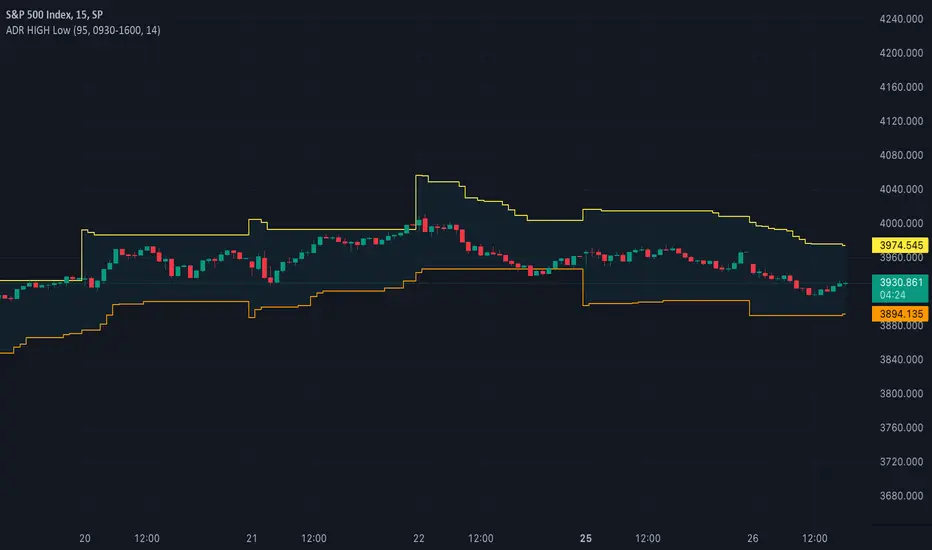
Visible Range High Low [vnhilton]Inspired by TradingView's "Chart VWAP". Thank you PineCoder for the "VisibleChart" library.
This indicator plots labels for the highest high & lowest low for the visible bars on the chart. TradingView does by default have an indicator similar to this, however it plots labels on the y-axis & cannot be customized.
在脚本中搜索"low"

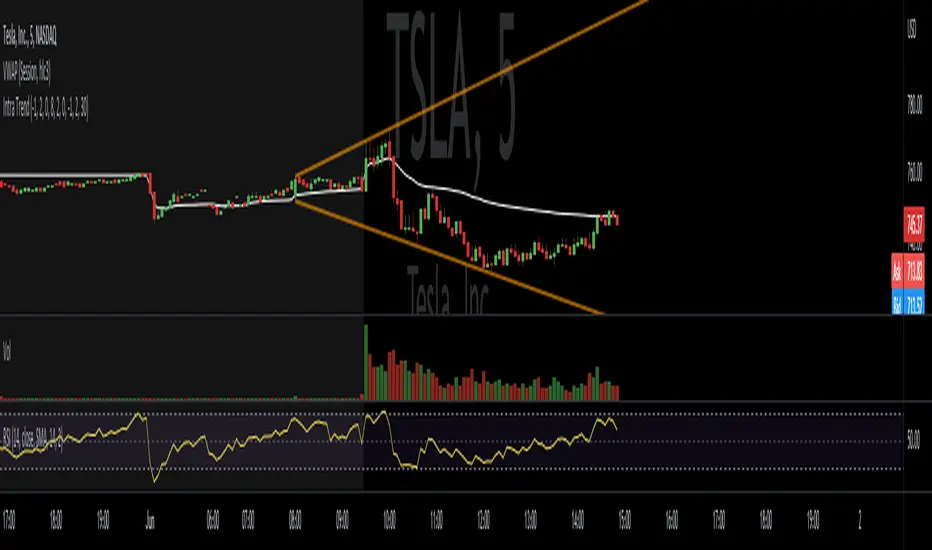
RSI Highs and LowsENG
RSI is usually used with closes but sometimes traders need to find out exact lows and highs while trading, therefore this script is written.
Green plot is the RSI value according to highs and red plot is the RSI value according to lows.
TR
RSI genellikle mum kapanışlarına göre kullanılıyor ama bazen alım satım yaparken en dip ve en tepeleri yakalamak istersek kapanışlara değil de bu en yüksek ve en düşük mum değerlerine ihtiyacımız oluyor. Bu nedenle bu kod yazılmıştır.
Yeşil grafik - en yükseklere göre
Kırmızı grafik - en düşüklere göre

Mark StructureMark Structure is building the market swing structure, minor and sub structure and marks all possible insignificant pivots
Building such structure is really complex task to do, that has a lot of obstacles and challenges. I'm doing my best to develop this indicator behaving in absolutely expectable and right way. Fill free to leave any comments or bug reports.
it supports:
- Marking all pivots with labels or join them continuously with trend lines.
- Marking minor and sub structured swings with labels or join them continuously with trend lines. Marking BOS or SMS BOS, which are mbos. Minor and substructure are structures inside swing structure and it can differ from the structure of lower timeframe
- Marking swings of swing structure with labels or join them continuously with trend lines. Marking BOS or SMS BOS of swing structure
- Changing bullish and bearish colors of each kind of structures
- Changing pivot labelings
- Changing colors of BOSs
Remarks:
- As I told you guys before, it has a lot of challenging cases. eg we have swing low and high on the same candle and in order to decide which pivot goes first I take lower time frame data to figure out what pivot is the first, but it happens that on lower time frame the same issue takes place, due to limitation of TradingView I can't go infinitely to lower timeframes to solve this issue, so I mark those cases with labels
- Another issue is very beginning of the trend its hard to detect swing structure there due to missing historical data. so skip a few waves in the very beginning
- Don't expect to have minor and sub structure in each swing waves, its totally fine when you don't have them at all
- Swing structure is the most significant structure and shows real price direction. Trend change is confirmed when for bull->bear the last HLbull LH>HH and HH-HL-HH are confirmed. You can change labelling for unconfirmed swing trend in the settings. By default its already done

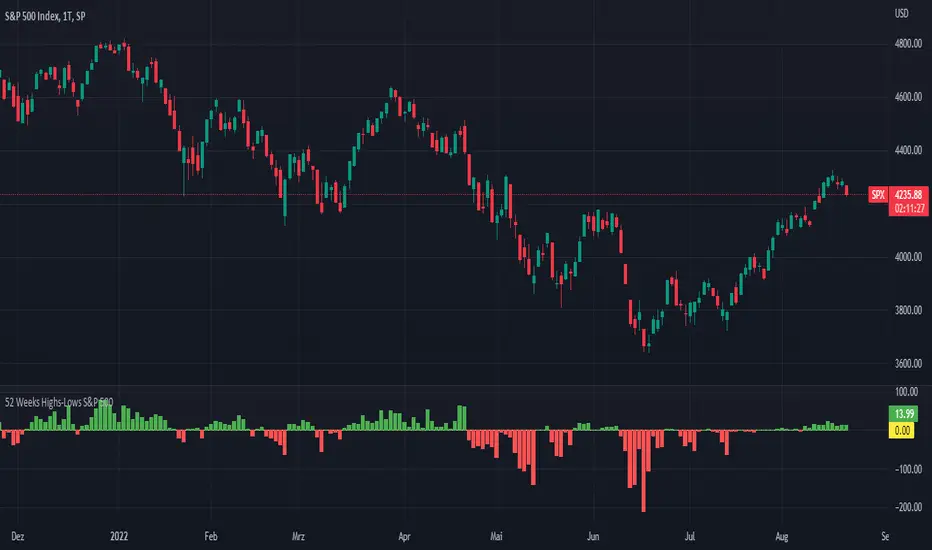
52 Weeks Highs-Lows S&P 500 - MugurThe script uses the MAHP and the MALP index and subtracts the second from the first. So you can see how many stocks in the S&P 500 make new highs or new lows on a 52 weeks basis and see the trend of the market.
5 Day Highs-Lows S&P 500 - MugurThe script uses the M5HP and the M5LP index and subtracts the second from the first. So you can see how many stocks in the S&P 500 make new highs or new lows on a 5 days basis and see the trend of the market.

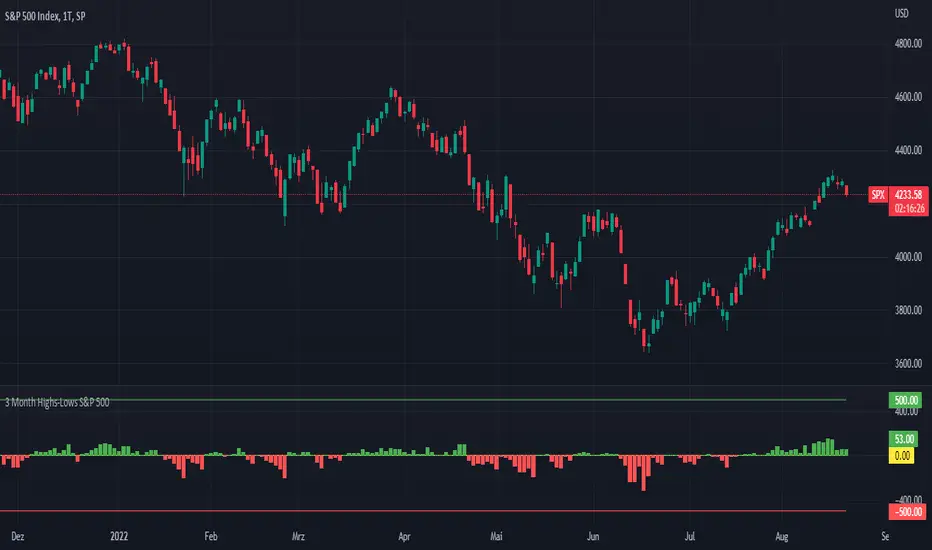
3 Month Highs-Lows S&P 500 - MugurThe script uses the M3HP and the M3LP index and subtracts the second from the first. So you can see how many stocks in the S&P 500 make new highs or new lows on a 3 month basis and see the trend of the market.
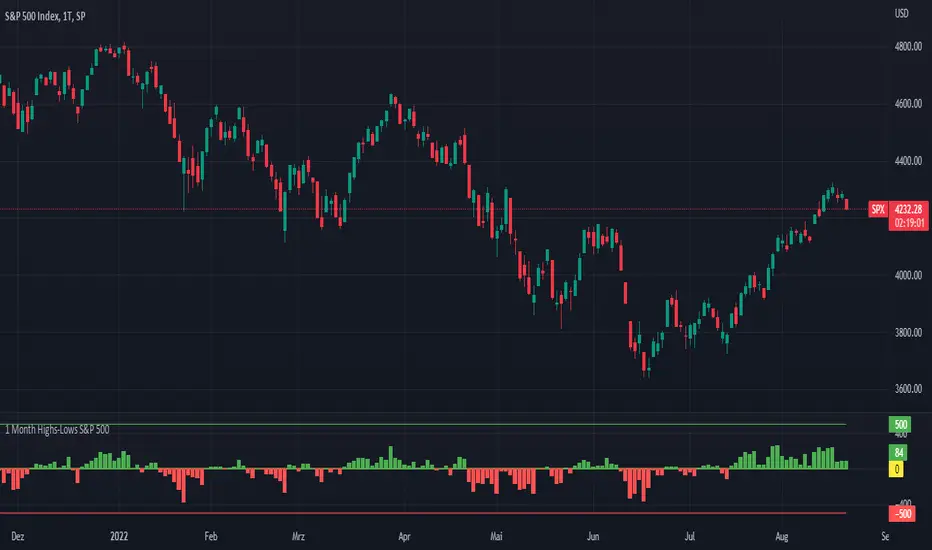
1 Month Highs-Lows S&P 500 - MugurThe script uses the M1HP and the M1LP index and subtracts the second from the first. So you can see how many stocks in the S&P 500 make new highs or new lows on a 1 month basis and see the trend of the market.
High & Low Of Custom SessionThis script boxes a custom session and sets the box at the high and low of the session and draws that box to the next session.
Box color is determined by price in relation to the box position. Box color is set at the start of the next session. This allows
user to lookback at multiple box sets to see how each day closed in relation to the session highlighted.
I have written this for backtesting purposes and intend to expand it to use with volume analysis and gradient color to change the box color based on how many times price tests
the box.
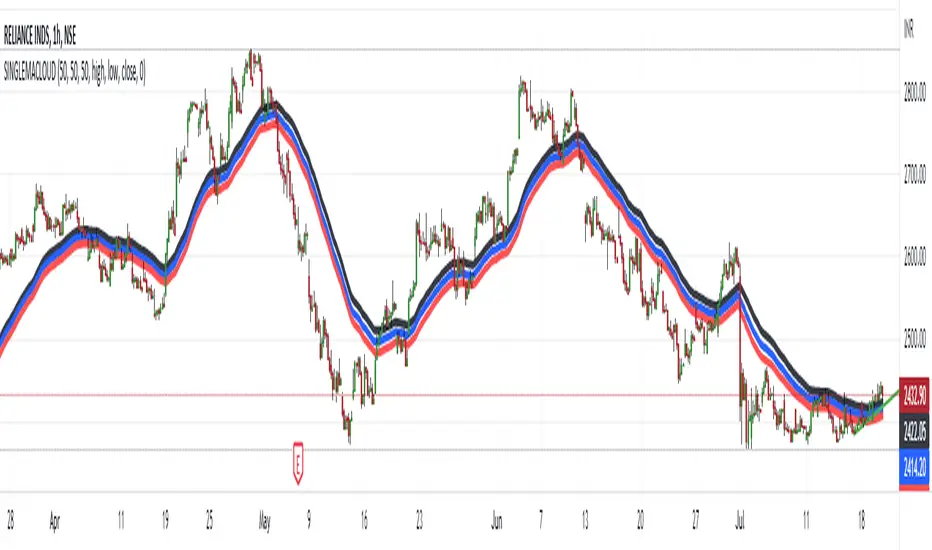
HIGH LOW CLOSE Moving Average ExponentialThe Script is prepared for testing purpose the Added single indicator for getting high low and close.
HLM Trend Line (High-Low-Midpoint / Ichimoku Line)Ichimoku style trend line .
Some strategies call for a custom Ichimoku style line (midpoint of range's high/low).
This allows you to use or replace a single line without having to customize a full Ichimoku setup.

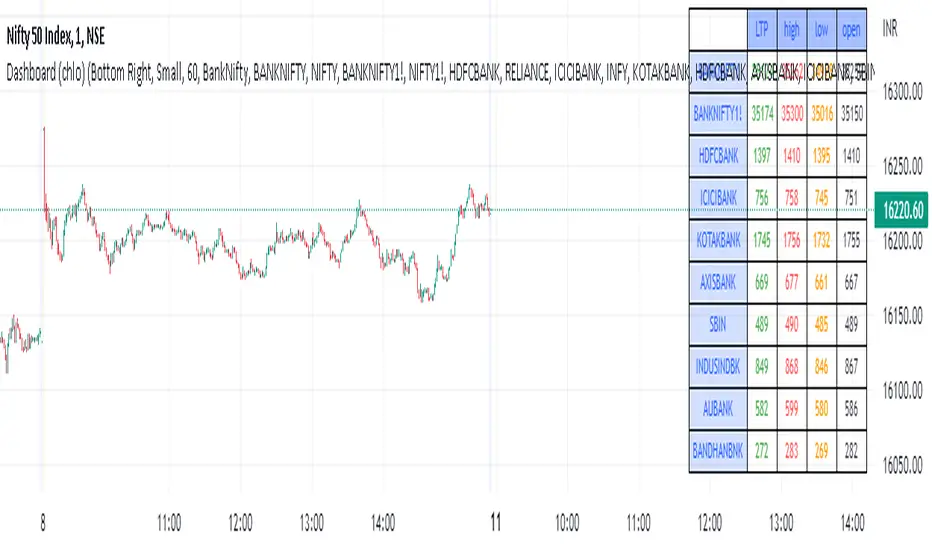
Dashboard (chlo) - v1I am an aircraft maintenance technician who is trying to get into software development in the financial sector.
This is a project in which a dashboard of other security(stocks) with open, close, high, and low will appear.
I could compile this after a detailed study of different dashboards and pine script for several hours
hope you like this.
EMA 50 HIGH LOW BANDHi
This indicator displays a band of EMA 50 having high and low of the same ema.
This script works well on 5 min chart or lower time frames in intraday.
When any price is above this band, you may consider a buy position and whenever any price is below this band, you may consider a sell position.
You may also take help of EMA 200, which is shown in red color. Whenever price is above EMA200, it is considered bullish and when ever it is below EMA 200, it is considered bearish.
This will remove a lot of noise from your chart.
I hope it helps.
Thanks

Time Anchored Intraday High/Low TrendlineOftentimes, intraday trendlines that are started at specific times, e.g. 8:00am or market open 9:30am, are well respected throughout the trading day.
This indicator draws up tp 3 intraday trendlines that are anchored at user defined times, respectively at the corresponding candle's high and low points.
From there, the line*s xy2 are connected in a way that all following candles are enclosed.
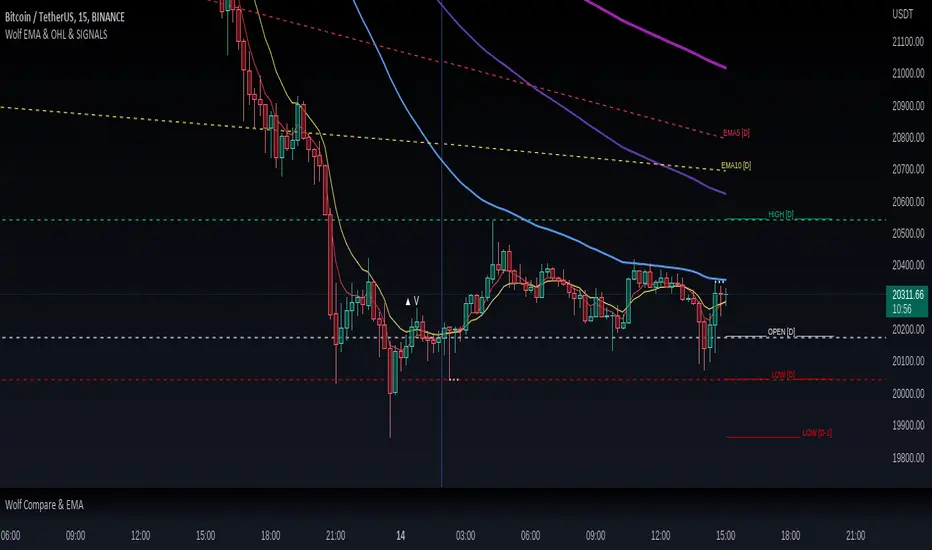
Wolf EMA & OHL & SIGNALSWolf EMA & OHL & SIGNALS
this indicator is mainly used for fast trading techniques (scalping). provides various tools for comprehensive trend analysis.
5 EMAs are used to have possible market entry or exit signals.
EMA
Thanks to the combination of the EMAs of different timeframes,
you can immediately get an idea of the resistances or supports
of the higher timeframes.
HOL
Lines are drawn on the right side indicating the maximum, minimum and opening
of the day, past day, week and past week respectively.
These levels are excellent as price acceleration points.
SIGNALS
There are three types of signals that are monitored by this indicator:
- Shimano
This signal is generated if the price remains compressed between two EMAs, more precisely between the third and the fifth, at the point where the price breaks one of these EMAs there can be a strong price movement.
- Viagra
This signal is generated if the price remains below the second EMA for a long time without ever closing above / below, at the point where it closes by climbing over the EMA there may be a change in trend.
-Bud
This signal is generated if a positive candle is formed and subsequently at least two that close within the high and low of the positive candle. Where the price breaks through the high of the positive candle is a great entry point.
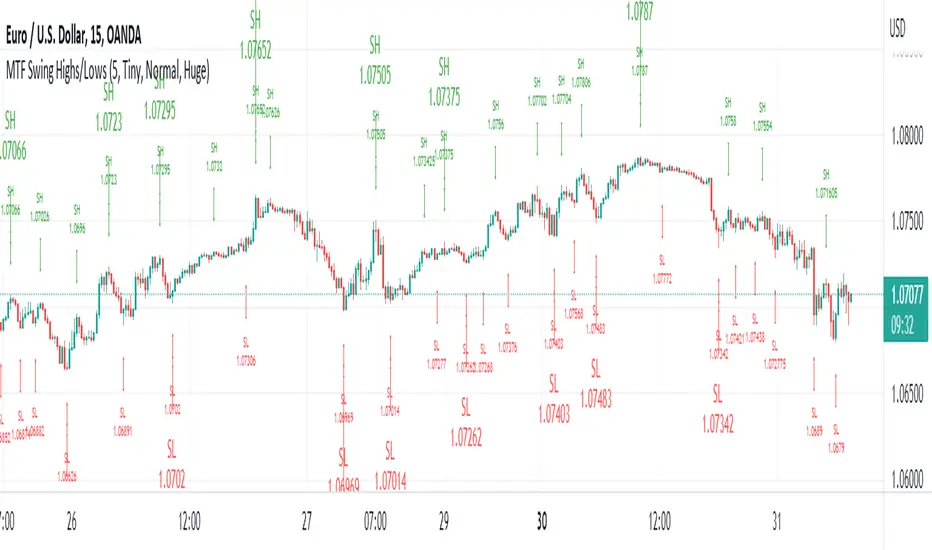
MTF Swing Highs/LowsI designed this indicator out of necessity for the Market structure/Price action trading strategy I use.
I thought I'd share. :)
This indicator displays Swing Highs and Lows an 3 timeframes based on the Chart timeframe, as follows:
Chart TF Higher TF Highest TF
1m 5m 15m
5m 15m 60m
15m 60m 240m
60m 240m Daily
You can change the font size of the labels as you'd prefer.
Lowest / Highest From WidgetRecent events inspired me to create a small widget that allows you to spot from when current value is lowest / highest.
Just add it to chart and script will compute most recent day when price was higher / lower than current and it will display:
Line coming from that value to the current one
A table with previous low/high information
Thanks to @MUQWISHI to help me coding it.
Disclaimer
Please remember that past performance may not be indicative of future results.
Due to various factors, including changing market conditions, the strategy may no longer perform as well as in historical backtesting.
This post and the script don’t provide any financial advice.

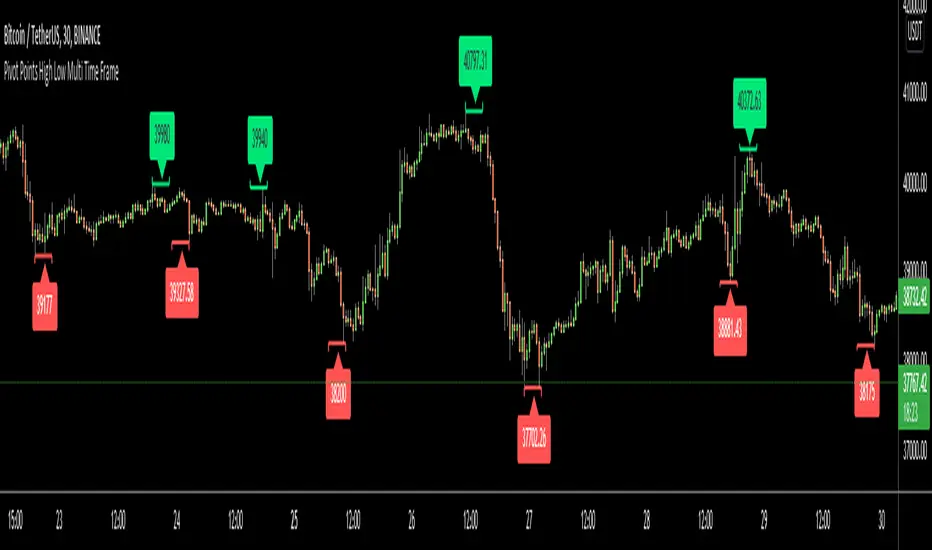
Pivot Points High Low Multi Time FrameHello All,
There are built-in and published Pivot Point High Low indicators in Public Library but as far as I see none of them is for Higher Time frames. so I decided to write & publish this script. I hope it would be useful while trading or developing your own scripts. I also did this to use in one of my future projects (we will see it in a few weeks/months ;) ).
I tried to make all settings optional, so you can play with them as you wish.
P.S. There is no control mechanism if the chart time frame is lower than the time frame in the options. So you better set higher time frame in the options than the chart time frame.
Enjoy!
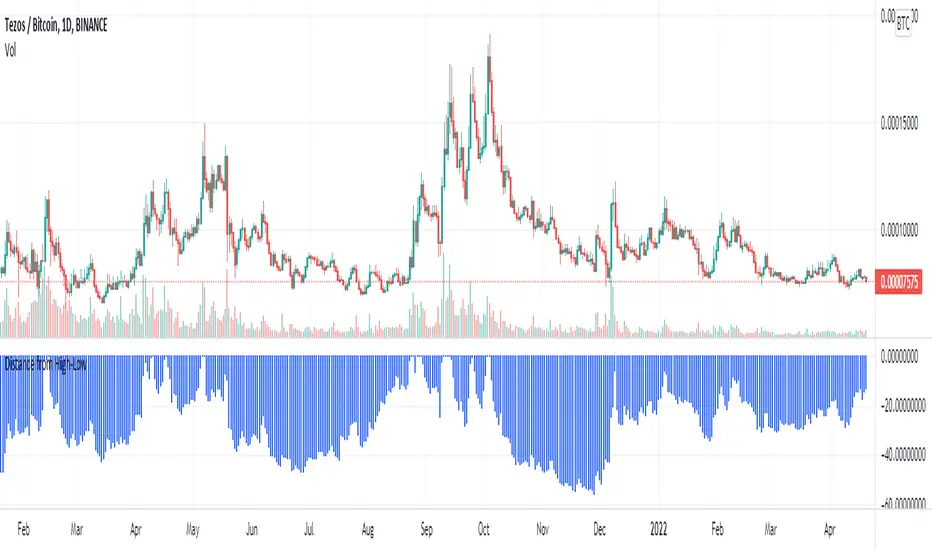
Distance/Drawdown from a period high/lowShow distance (%) from previous high/low in selected period.
daily high low close Levelsits different its day high and low indicator idgcaiucvai fUEFIFBIUE FWEFHEFBSD FSFHUFSIISDJHS DSDHSDINSDVJSD9 SDHSDVJNSDVSJDVH8S9DY SEFGSU BSIDVJBSDVIU S8DOHSDIVNSDV

Z Score (Close + High and Low bands)Basic z score with High and Low bands.
If z is positive = uptrend.
If z is negative = downtrend.
If z > +3 or z < -3 = reverse is possible.
H lines can act as a support/resistance.
Disclaimer:
Trading success is all about following your trading strategy and the indicators should fit within your trading strategy, and not to be traded upon solely
The script is for informational and educational purposes only. Use of the script does not constitute professional and/or financial advice. You alone have the sole responsibility of evaluating the script output and risks associated with the use of the script. In exchange for using the script, you agree not to hold dgtrd TradingView user liable for any possible claim for damages arising from any decision you make based on use of the script

Same high/low + DCA (only long)This is an update of the previous "same high/low" strategy. This strategy can be helpful for those who look for entrance price points after level retest based on the dollar cost averaging approach.
The retest of the level is defined by two candles with the same low.
4 entrance points were calculated based on volatility (not based on ATR though) and the weights were averaged in the middle of the volatility level.
As previously, stop loss is just one tick away from a level of support and take profit based on the ATR multiplier.

Open=High and Open=LowIndicates if the bar has Open=High or Open=Low
Colors and Description have been added as well
