All-Time High/Low WidgetIt's a pretty simple widget to track all-time high and all-time low values.
You can plot the levels and display some stats when all-time happened and how far away are we at this moment.
Also, you can create alerts to get notified on ATH/ATL breakout.
Thanks to @Verleiht for helping me with the code.
Disclaimer
Please remember that past performance may not be indicative of future results.
Due to various factors, including changing market conditions, the strategy may no longer perform as well as in historical backtesting.
This post and the script don’t provide any financial advice.
在脚本中搜索"low"

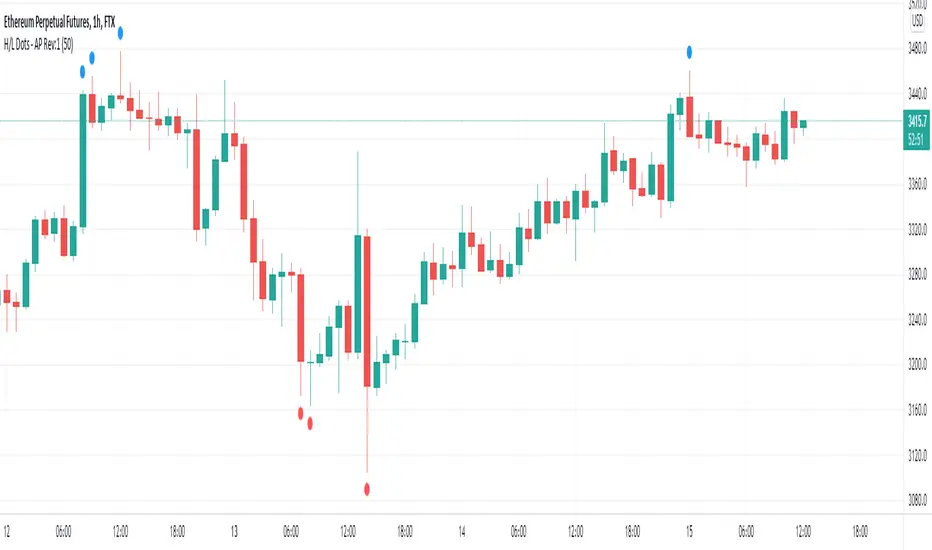
Recent High/Low Dots by Alejandro PSimple indicator that plots a dot in the chart when a candle breaks the high of the past X candles.
This is useful to easily visualize when the market is coming out of a range and making fresh highs or lows relative to the past X candles.
It can be used in trend following systems as an additional filter for validation.
Average Highest High and Lowest Low Swinger StrategyThis is a full price action strategy designed for trending markets such as crypto and stocks.
Its purely made on calculations for the highest high and lowest low using 2 different length , a faster and a slower one.
With those we make multiple averages.
Rules for entry:
For long: our close of the candle is above both the average using fast and slow line
For short: our close of the candle is below both the average using fast and slow line
Rules for exit
We always exit when we have an opposite order
Caution
This strategy use no risk management system, so be careful with it
If you have any questions, let me know

High/Low Channel Multi averages Crypto Swing strategyThis is a swing strategy designed for trending markets such as crypto and stock, with big timeframes , like 8h.
For this strategy we take SMA, EMA, VWMA, ALMA, SMMA, LSMA and VWMA and make an apply them all to both HIGH and LOW separately and make 2 averages, 1 applied to high and the other applied to low.
With them we make a channel.
Rules for entry
For long: close of a candle is above avg applied to high.
For short: close of a candle is below avg applied to low.
Rules for exit
We exit when we either hit TP or SL or when we receive a different condition than the entry one.(long- > short and viceversa)
If you have any questions, let me know !

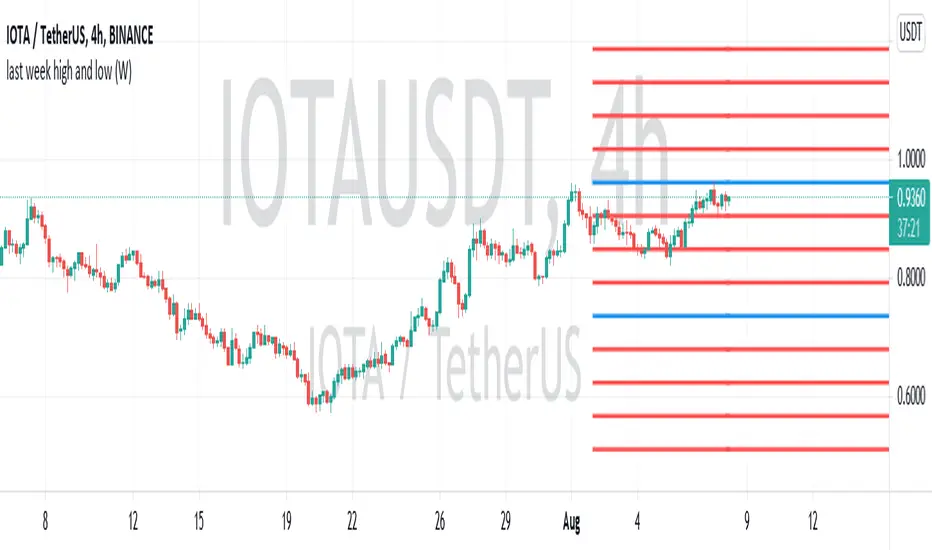
last week high and lowthis script defines the highest and the lowest values of the last week. then illustrate and extend them into current week and future. they are define by blue lines.
in addition, the distance between high and low divided by 4. interior and exterior regions are split by these lines (red lines)
all lines can be considered as static support/resistance.
[HuD] Yearly High Low1. Indicator will display highest and lowest price level within yearly period.
- Highest Yearly Price = green line
- Lowest Yearly Price = red line
2. User also has an option to display Monthly high and low level.
- Monthly Highest Price = Blue Line
- Monthly Lowest Price = Orange Line

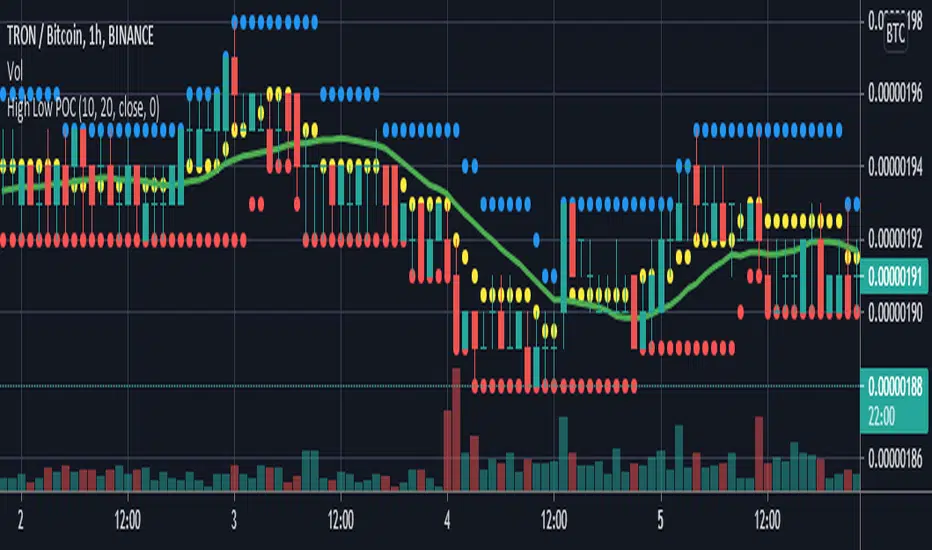
High Low POCGet centre point of highest high and lowest low from defined number of bar .
if POC above sma and price above POC then enter long .
if POC below sma and price below POC then enter short .
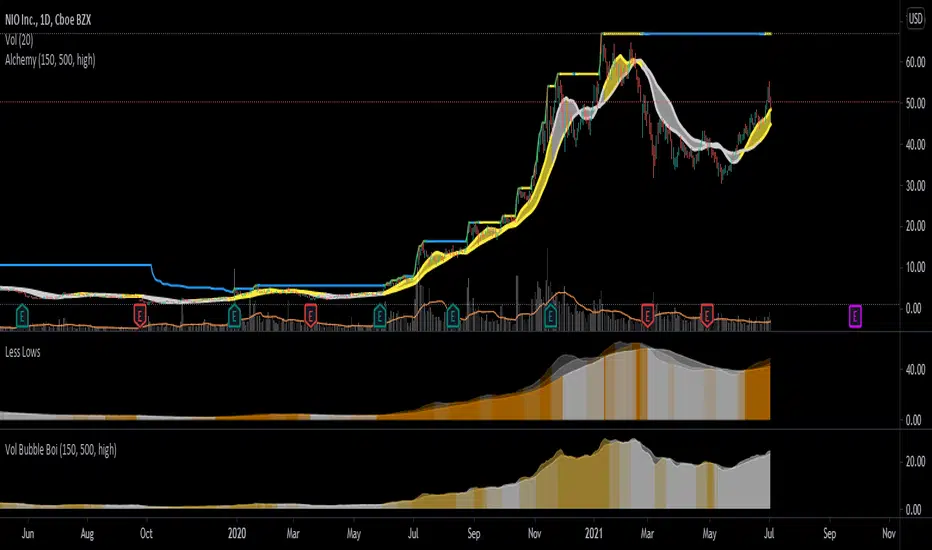
Less LowsIt attempts to measure based on prior bars whether or not lows are becoming increasingly less common, in other words, a flattening or rising of price.
Another way to do this would be to use vector calculus to get the curvature of the price, but unfortunately, I do not have enough IQ points for that.
nonoiraq indicator it's very strong i edit this indicator to connect it with my bot to auto trading and he take the info from the volume, so when he is give me a single the bot take just 0.50% to 1% for 3 - 5 trade in day and this perfect, if u use a manual trading this indicator can reach to from 10% to 80% in some point .
the indicator have 3 line
(Red , Purple, Yellow)
1- The yellow line it's high sensitivity this mean it's when rich to the -3 or 3 you can open the order when the bar is close and the signal be sure
and u need to watch the your order because in some case he is reach to 0.30% to 2% and the price reflected to loss and when you wait the price reflected to but my advice you take profit and close the order directly.
2- The purple circles it's medium sensitivity this mean when the purple hit the 2.5 or 3 from down or up in indicator with yellow line you open the order when bar close and the signal is be sure , like example in the photo
3- The red circles it's low sensitivity and this one when reach to 3.0 with any line (yellow or purple) you open directly short or long , like the example in the photo
i am sorry for my english it's not very good
please support me to share other idea or script

Example - Custom Defined Dual-State SessionThis script example aims to cover the following:
defining custom timeframe / session windows
gather a price range from the custom period ( high/low values )
create a secondary "holding" period through which to display the data collected from the initial session
simple method to shift times to re-align to preferred timezone
Articles and further reading:
www.investopedia.com - trading session
Reason for Study:
Educational purposes only.
Before considering writing this example I had seen multiple similar questions
asking how to go about creating custom timeframes or sessions, so it seemed
this might be a good topic to attempt to create a relatively generic example.

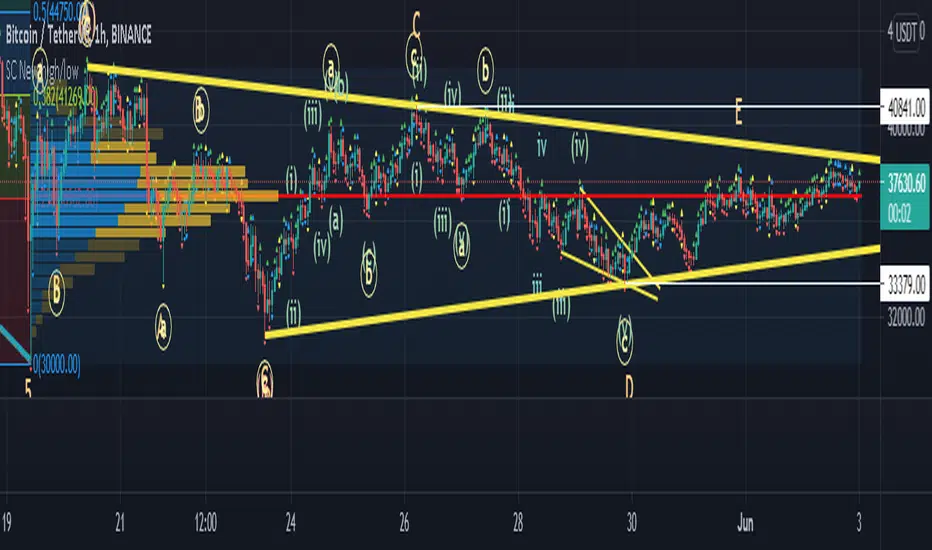
SC New high/lowPlots a triangle above/below the candle/bar whenever the current one breaks the high or the low of the previous one.
A green triangle indicates the breakout of the previous high.
A red triangle indicates the breakout of the previous low.
Two yellow triangles (above and below the candle) indicate an Outside bar/candle.
Two blue triangles indicate an Inside bar/candle.
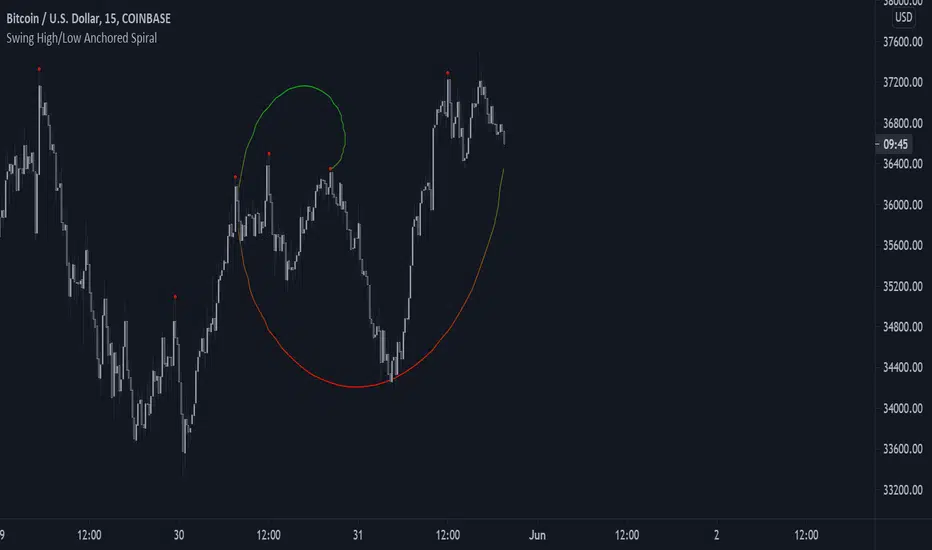
Swing High/Low Anchored SpiralFit the estimate of an Archimedean spiral to the price, with a central point determined by swing high/lows.
Users can determine which historical swing high/low to use as the spiral central point and can choose the number of turns it should make.
You can create cool shapes, cool enough to satisfy your apophenia needs.
If you are having issues just hide and unhide the script, or just lower the length/occurrence setting.
Posting is impossible without the support of my Patreons as well as @LuxAlgo, my scripts are dedicated to them.
OBV High / LOW (On-Balance Volume )This is a simple application of OBV indicator (On-Balance Volume ), to visually determine when a given stock current obv is near the highest or lowest based on the number of lookback bars.
Indicator examples:
### OBV value is near an all-time high ##
breakthrough , stock value could set new all-time highs.
rejection , stock value could come down or consolidate.
Example
Inputs
OBV High Lookback -> numbers of bars to look back for the obv high.
OBV LowLookback -> numbers of bars to look back for the obv low.
OBV EMA Length -> Ema length
Notes:
This script also comes with an ema indicator based on obv for smoothing the obv signal since it gets noise at lower timeframes (by default comes disabled)
OBV information
www.investopedia.com
Comments:
This is my first script any ideas, suggestions, or detected errors (language/script) don´t hesitate to send a message.
Best regards, Mauro.

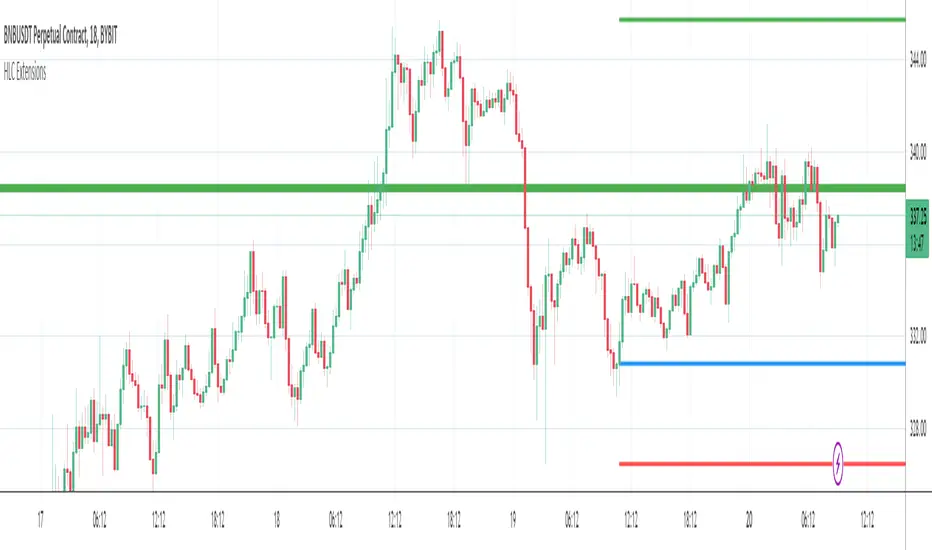
Yesterdays & Last Weeks High Low Close ExtensionsPlots the Extensions of Yesterdays and Last Weeks High Low Close
Unfortunately all of the levels wont always show therefore it is good use this in conjunction with my Levels script
I tried to combine the 2 scripts but doing so gave me memory overload errors in Tradingview thats why I have made them separate

Stochastic RVIBased on the Stochastic RSI but uses RVI (Relative Volatility Index) as source. Another great tool for finding market lows and entry points. This oscillator is also good for finding accurate diversions.

R-HL-PDWThis script doesn't give buy or sell signals. It gives a reference point to the previous day's high and low as well as the previous week's high/low. This will be helpful for intraday trading decisions.

Thang Sideway Low High ChannelDetect low high price of a channel with configurable length and offset.

FirstBarRangeFirstBarRange study displays lines for the high and low of the first bar/candle of the trading day, along with shaded areas for the range on top of the first bar high and below the first bar low.
This study is very useful for intraday traders to see when stocks trade above the first bar high, it shows strength, and many times the high of the first bar is also good support.
On the contrary, below the first bar high tends to be good area of weakness and many times it becomes a good resistance level.
Many times when the stock trades inside the first bar range, price will be choppy and range bound.

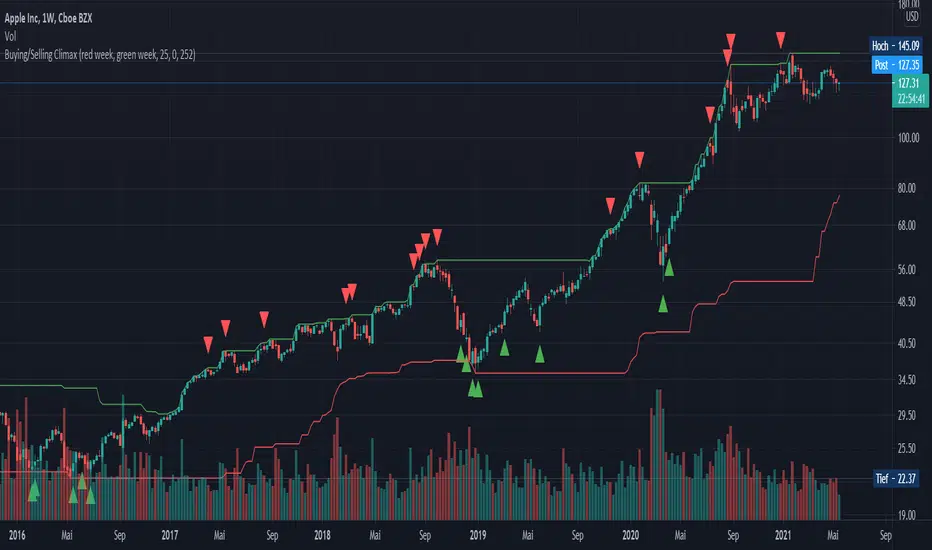
Buying/Selling ClimaxEnglish:
This indicator is designed for the stock market and marks potential buying or selling climaxes. If a "buying climax" or "selling climax" is marked, the probability is high that this price level will not be exceeded or undershot quickly. The indicator is used exclusively on the weekly time level.
Conditions for a "Buying Climax":
- New 52-week high
- The week closes in the loss "red week”
Alternative: The week closes below the opening price of the previous week
Conditions for a "Selling Climax":
- New 52-week low or crash (in the stock).
- The week closes in profit "green week”
- The 2 previous weeks are losing weeks
Alternative: The week closes above the opening price of the previous week
Deutsch:
Dieser Indikator ist für den Aktienmarkt ausgelegt und markiert potenzielle Kauf-/ bzw. Verkaufs-Höhepunkte. Wird ein „Buying-Climax“ bzw. „Selling-Climax“ markiert, ist die Wahrscheinlichkeit hoch, dass dieses Preisniveau nicht so schnell überschritten bzw. unterschritten wird. Der Indikator wird ausschließlich auf der wöchentlichen Zeitebene eingesetzt.
Bedingungen für einen „Buying Climax“:
- Neues 52-Wochen Hoch
- Die Woche schließt im Verlust „red week“
Alternative: Die Woche schließt unterhalb des Eröffnungspreises der Vorwoche
Bedingungen für einen „Selling Climax“:
- Neues 52-Wochen Tief oder Crash (in der Aktie)
- Die Woche schließt im Gewinn „green week“
- Die 2 Vorangegangenen Wochen sind Verlustwochen
Alternative: Die Woche schließt oberhalb des Eröffnungspreises der Vorwoche

EMA Ribbon - low clutter, configurable [aspiers]This script improves on many of the existing EMA ribbon scripts out there:
Reduces visual clutter with shorter labels / titles, and thinner, transparent lines which don't obscure the actual price chart
Two beautiful color gradients for up and down trends
All colors and EMA periods are fully configurable, using the new input grouping / inline features
Uses Pine Script v4, which makes it more future-proof and allows new functionality, e.g.
It allow configurable period resolution, e.g. so user can fix at day resolution even when chart is being viewed at hour or minute resolution (this is the default)
Code clean-up: remove redundant ternary conditionals, improve variable names
Allow smoothing threshold for changes in trend direction to be configurable

Highest high, Lowest low and Trend, MACD, RSI on CandlesticksHighest high, Lowest low and Trend, MACD, RSI on Candlesticks
