在脚本中搜索"low"
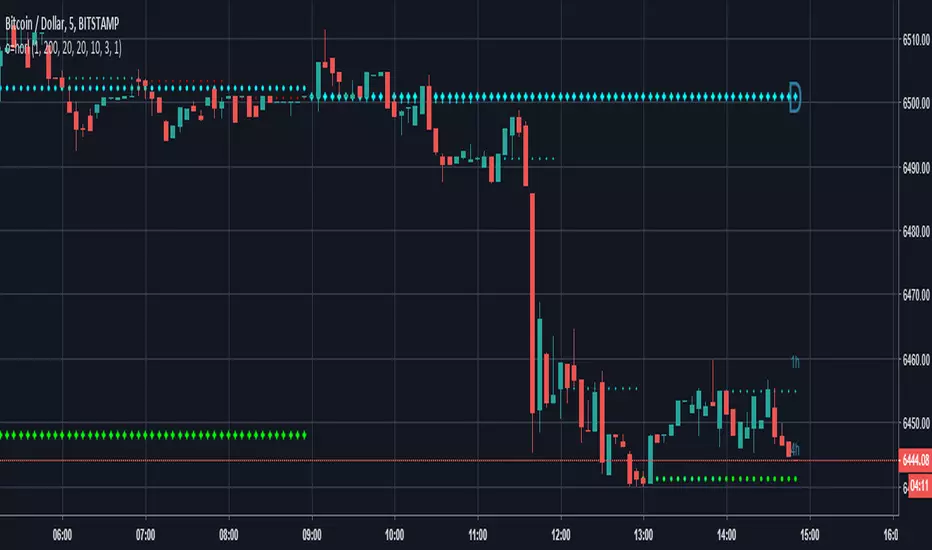
Pivot High Low Pointsby using this script you can find Pivot High-Low Points. This script works like Tradingview pivothigh & pivotlow functions.
If you find my works useful, please consider a donation
BTC: 16XRqyS3Vgh1knAU1tCcruqhUrVm4QWWmR
by LonesomeTheBlue

Highs and Lows (Previous Days Projected + Current Week & Month)Credit to Lachlan Smith created original on 31/03/15 - Edited by Elisa 30/3/19
Historical highs and lows
Includes three previous days projected onto today, plus current week and month.
Settings allow for data to be hidden after weekends for use in traditional markets. (i.e. prior 2 days not useful on a Monday)

Pivots High/Low [Simpelyfe]These are interconnected pivot highs and lows to help you determine the direction and magnitude of the next impulse. A hard pivot finishing off C or E of a corrective wave means there's a higher probability for price to reverse thereafter.
Cheers,
Simpelyfe

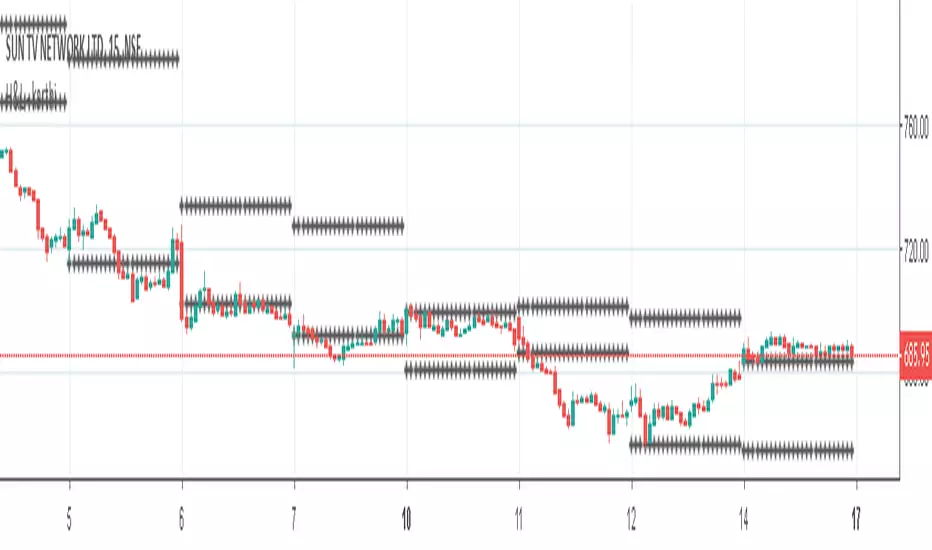
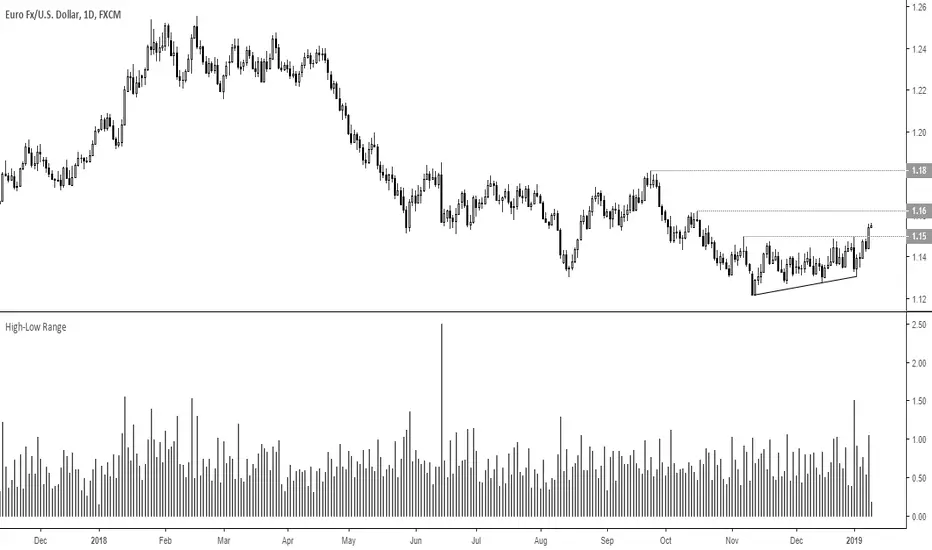
High Low LinesThis script allows you to see a line graph of the highs and lows. Useful for drawing trend lines.

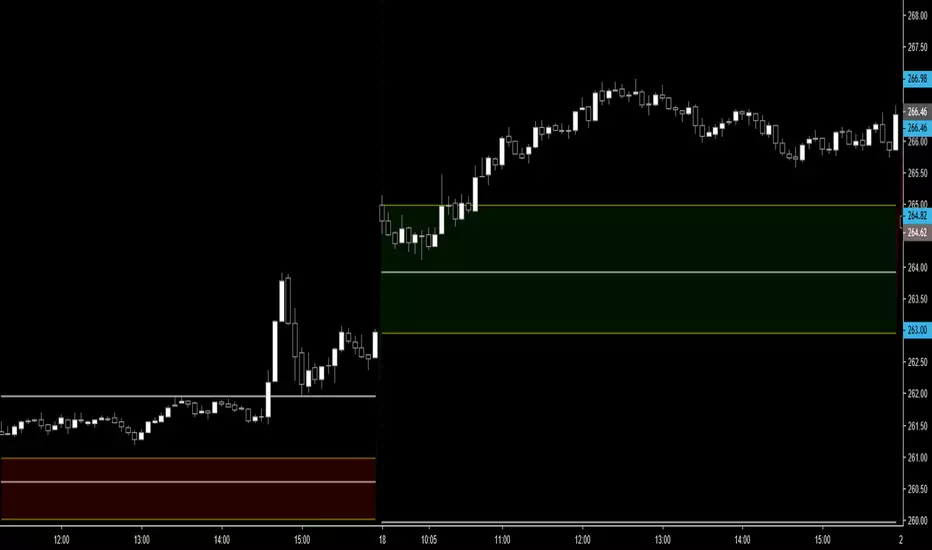
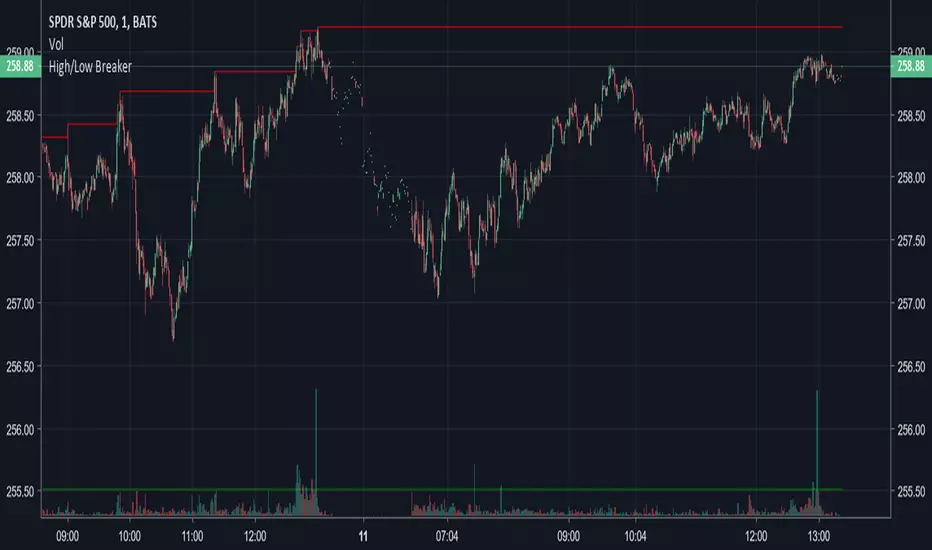
Current Open/Previous High Low Close. Gap HighlightedThis script plots the current open previous high low close. Also the area between the current open and previous close are highlighted to easily see the overnight gap. The idea is that after a significant gap the price will retest previous days levels before continuing in the direction of the gap.
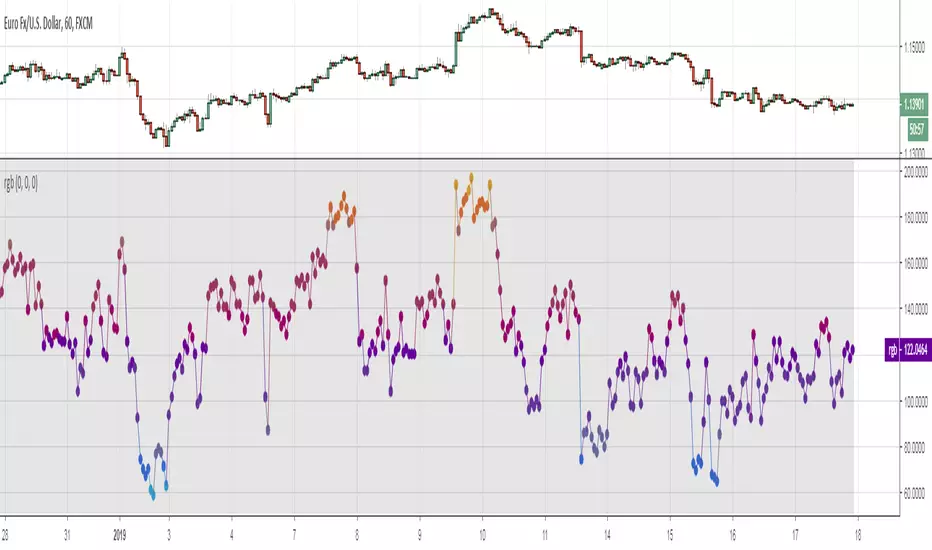
[RS]Function - RGB Color (low resolution)Function to handle rgb color selection, it has low resolution due to pinescript limitations.
included examples with manual background color selection via inputs and automatic color of a rsi plot based on its value.
let your rainbow dreams come true!! :D
New Highs-Lows AMEX-Buschi
English:
This indicator shows the AMEX's up volume (green) and down volume (red).
Extreme trading days with more than 90 % up or down volume are marked via lines (theoretically values) and triangles (breaches).
Deutsch:
Dieser Indikator zeigt das Aufwärts- (grün) und Abwärts-Volumen (rot) der AMEX.
Extreme Handelstage mit mehr als 90 % Aufwärts- oder Abwärts-Volumen ist gekennzeichnet über Linien (theoretische Werte) und Dreiecke (Überschreitungen).
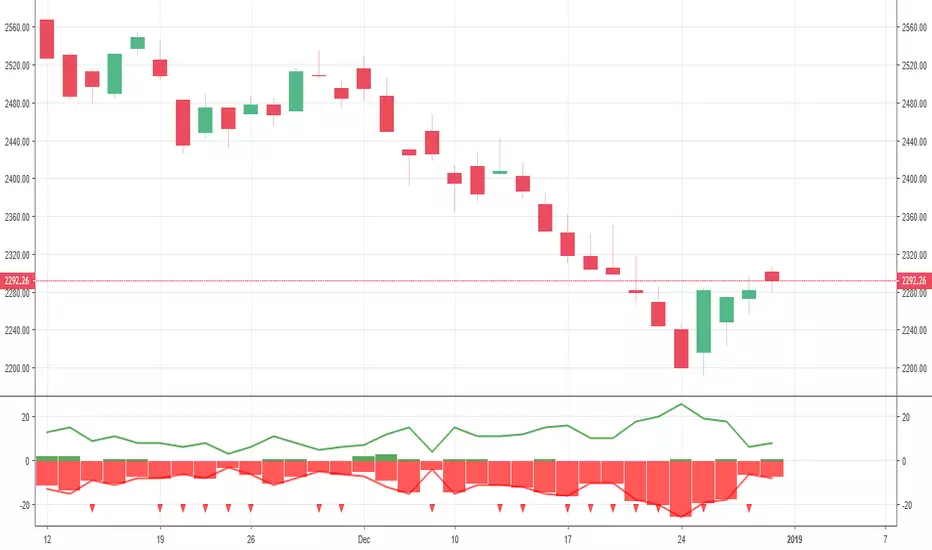
ccid (with high low histogram)So this indicator has the following : CCI where the buy and sell signal can be either cross of the fast the slow and vice versa or cross of CCI bellow -50 and cross down CCI +50
the histogram (blue and red) is made by high low like histogram the buy and sell is based on crossing of the 0 . since its MTF type . you can toon the TF either to the time frame or use lower graph time with higher TF
since both indicator complement each other then I put them together

Previous 2Days High/LowTesting simple range of highs/lows of previous 2 days, for reference, working on every timeframe.

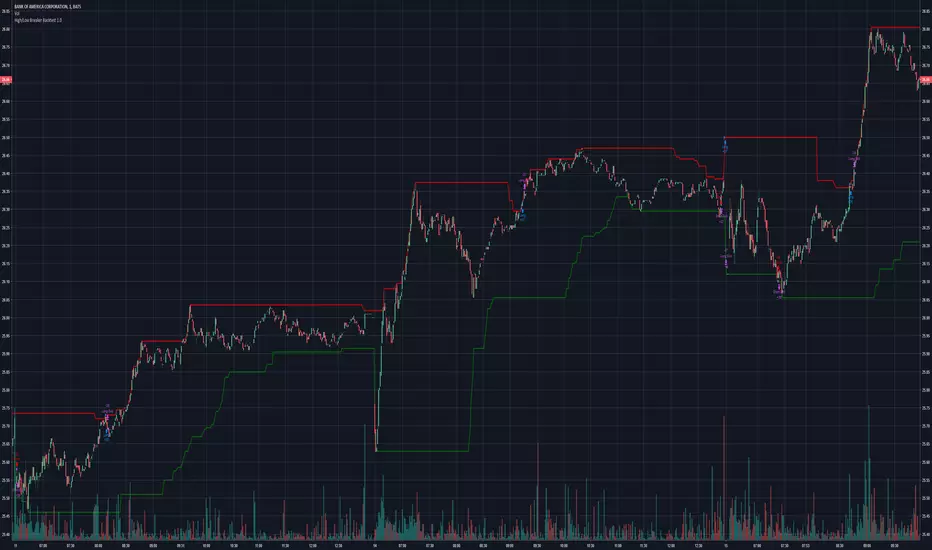
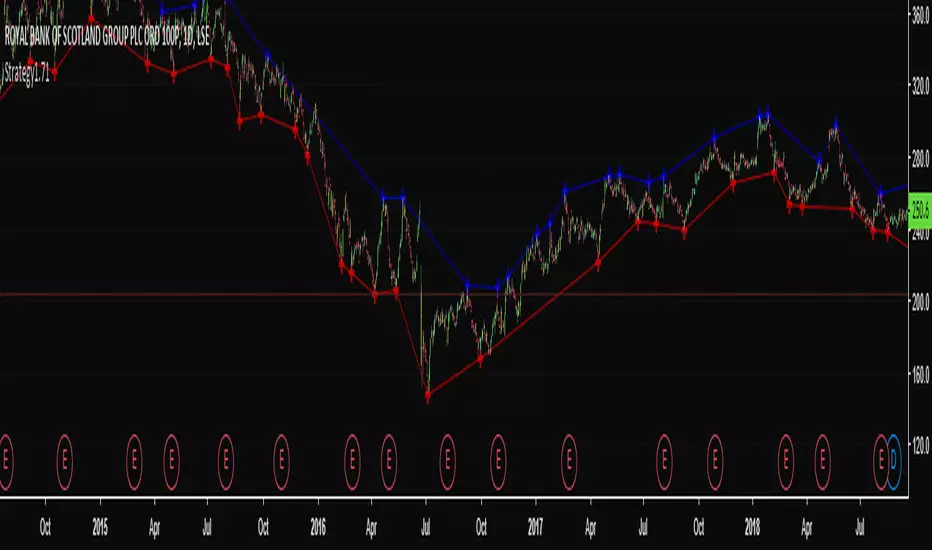
High & Low Pivot Strategy v1.0A system that determines what direction the market is trending by analysing previous high and low pivot points to set up an entry trade.
Previous High/Low Current OpenDisplays
Previous Monthly/Weekly/Daily High/Low over current prices
Current Monthly/Weekly/Daily Open over current prices

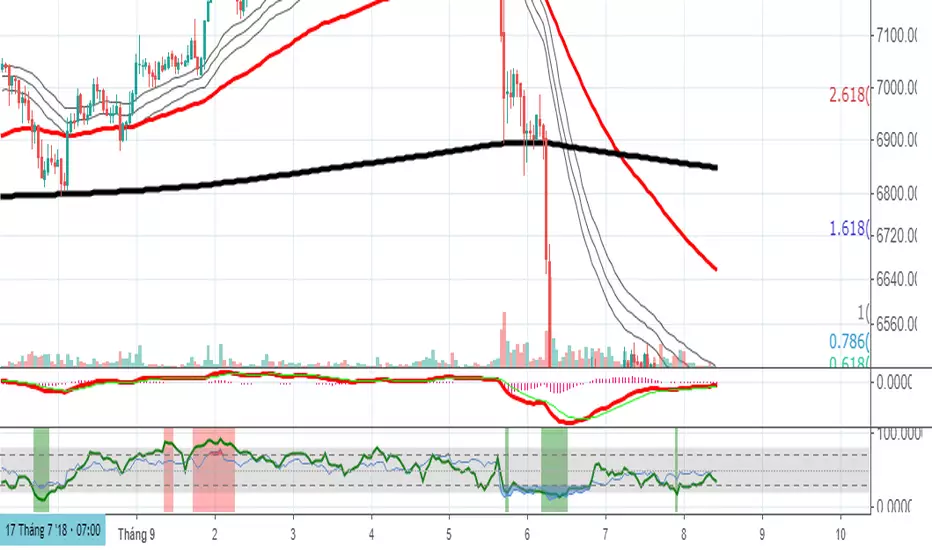
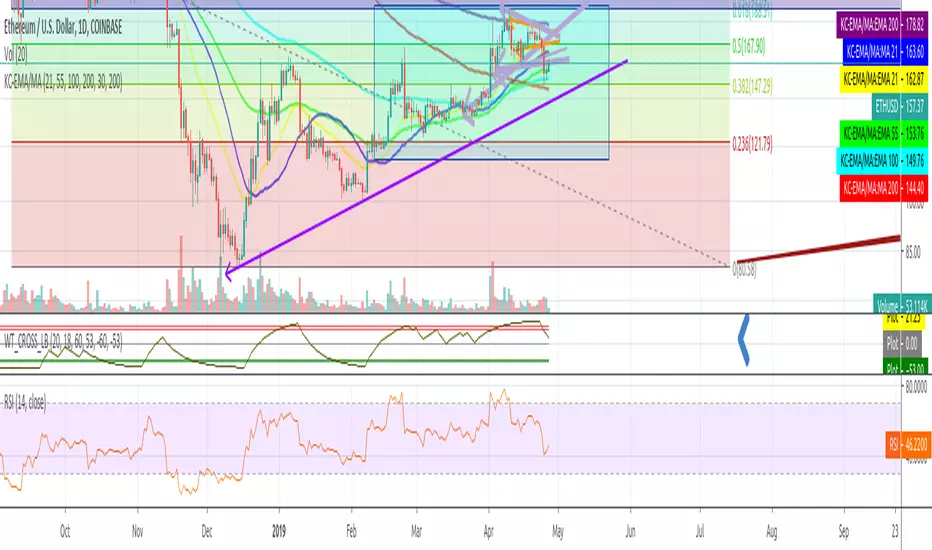
HI-LOW fibThis model show the price and its relation to fib levels in a diffrent way
also easy to put inside other indicator like rsi ,dmi stoch etc ...
the lines represents the fib level and the price will go from low to high fib and vice versa
so it a different way to look on the fibs in a graph

Is Open equal to High or LowMany people are watching opening price on each time axis. Opening price is very important.
This indicator displays OHLC Open as a line in multiple time frame.
If open is close to high or low, the color of the line changes.
The fact that they are close means the strength of the market flow and the firmness of that price range.
Note:
The color of the line will not be fixed until bar is closed.
And when using, please set arbitrary coefficient according to each market.
Coefficient e.g.
EURUSD: 0.00005
BTCUSD: 1
DJI: 5
BTCJPY: 100
USDJPY: 0.01
NI225: 2

Open = High or Low?Open = High or Low? (o=horl)
Coefficient e.g.
EURUSD: 0.0001
BTCJPY: 100
USDJPY: 0.01
BTCUSD: 1
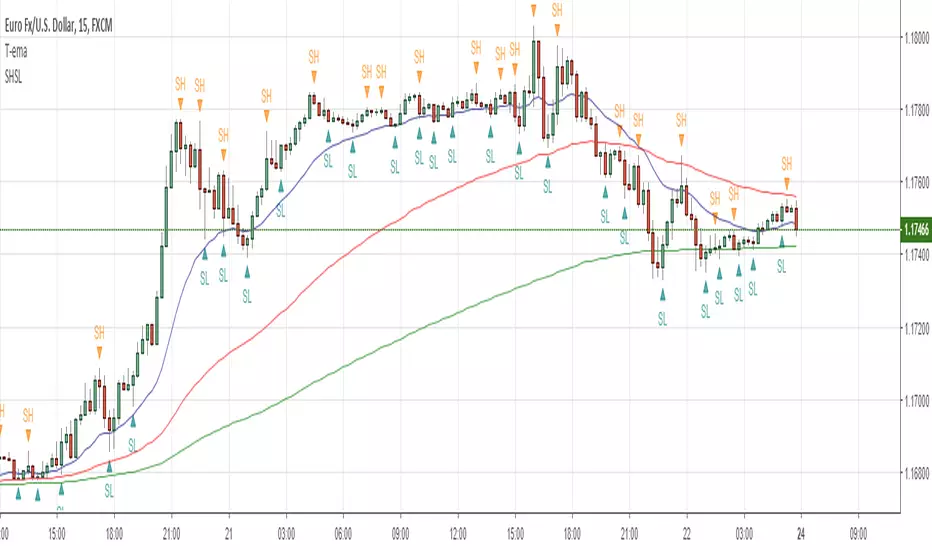
Swing Highs and LowsSimple script to overlay swing highs and lows.
A Swing High (SH): a price bar high preceded by two lower highs (LH) and followed by two lower highs (LH).