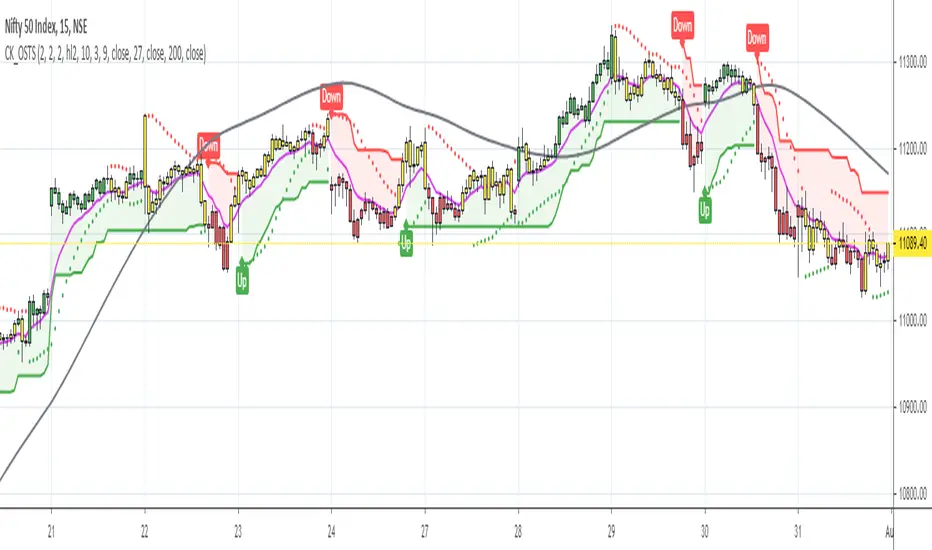
One-Stop Trading SetupOne-Stop Trading Setup:
This script designed to identify up, down, and sideways trends. 200 HMA, 9 EMA, PSAR, and ATR are used to identify the strength of any instrument.
Candle Colors - Simpler approach to follow:
Green color indicates for up side trade signals
Red color indicates for down side trade signals
Yellow color can be interpreted for stop, sideways, and counter trade trade signals
Multiple Trade Setups:
Green Zone - Trading green candles within green zone has better odds of long trades
Red Zone - Trading red candles within red zone has better odds of short trades
200 HMA - Candles above 200 HMA mostly for long trades. Candles below 200 HMA usually for short trades. But the zone also very important to consider
9 EMA - Cross over above 200 HMA in Green zone, look for long trades. Cross over below 200 HMA in red zone, look for short trades
PSAR - This can be used as potential initial warning sign. Also can be used to exit partial or wait for it goes to opposite side for taking trade decisions
Candle Above all - If Green candle and above all the indicators, then very good sign of long side. If red candle and below all indicators, then very good sign of short side.
Multiple Time Frame:
This works very well with any instrument and on any time frame. Always its better to do analysis on multi time frame before entry, exit, and trade execution. Back test it with this setup and also observe it on live market. That will give edge in taking trade decisions. All the best and happy trading.
Disclaimer:
This script and setup is written with the sole purpose of identifying the strength of any instrument. Interpretation, trade decisions, and changing inputs are up to each individual users/trades.
在脚本中搜索"one一季度财报"
One-Sided Gaussian Support & Resistance Rate [Loxx]One-Sided Gaussian Support & Resistance Rate is a mean reversion oscillator much like Fisher Transform. This indicator is built using a one-sided Gaussian filter. If you pair this with Fisher Transform and line up the settings, you'll notice similar outcomes. You'll notice that as the oscillator levels out at around zero or one that this signifies a zone of resistance or support. See here for more details on calculating the OS Gaussian Filter:
Included:
Bar coloring
Signals
Alerts
Ehlers 2-Pole Super Smoothing for smoothing source inputs

One White Soldier & One Black Crow DetectorOne white soldier & one black crow.
Blue and yellow highlights

All-In-One EMA Boll Cross SignalsThis one combines many commonly used indicators and signals into one.
1. EMA lines
2. SMA lines
3. Bolling Bands (EMA based)
4. Ichimoku cloud
5. 3/8, 10/20 EMA crosses
6. 5/10 SMA crosses
7. MACD crosses

One-Sided Gaussian Filter w/ Channels [Loxx]One-Sided Gaussian Filter w/ Channels is a Gaussian Moving Average that is calculated using a Fibonacci weighting function. Keltner channels have been added to show zones of exhaustion. A better name would be "Half Gaussian bell weighted" or "Half normal distribution weighted" indicator, since the weights for calculation of the average (similar to linear weighted average) are taken from a normal distribution curve like function--but only the half of the curve is used for calculation.
Information of the Gaussian distribution can be found here : en.wikipedia.org and once you take a look at the standard normal distribution curve, it will be much clearer what is exactly done in this indicator.
After the Gaussian Filter is applied to the source input, an Ehlers' 2-Pole Super Smoother is applied to reduce noise without significant lag.
Included:
Bar coloring
Signals
Alerts
Loxx's Expanded Source Types

One Shot One Kill ICT [TradingFinder] Liquidity MMXM + CISD OTE🔵 Introduction
The One Shot One Kill trading setup is one of the most advanced methods in the field of Smart Money Concept (SMC) and ICT. Designed with a focus on concepts such as Liquidity Hunt, Discount Market, and Premium Market, this strategy emphasizes precise Price Action analysis and market structure shifts. It enables traders to identify key entry and exit points using a structured Trading Model.
The core process of this setup begins with a Liquidity Hunt. Initially, the price targets areas like the Previous Day High and Previous Day Low to absorb liquidity. Once the Change in State of Delivery(CISD)is broken, the market structure shifts, signaling readiness for trade entry. At this stage, Fibonacci retracement levels are drawn, and the trader enters a position as the price retraces to the 0.618 Fibonacci level.
Part of the Smart Money approach, this setup combines liquidity analysis with technical tools, creating an opportunity for traders to enter high-accuracy trades. By following this setup, traders can identify critical market moves and capitalize on reversal points effectively.
Bullish :
Bearish :
🔵 How to Use
The One Shot One Kill setup is a structured and advanced trading strategy based on Liquidity Hunt, Fibonacci retracement, and market structure shifts (CISD). With a focus on precise Price Action analysis, this setup helps traders identify key market movements and plan optimal trade entries and exits. It operates in two scenarios: Bullish and Bearish, each with distinct steps.
🟣 Bullish One Shot One Kill
In the Bullish scenario, the process starts with the price moving toward the Previous Day Low, where liquidity is absorbed. At this stage, retail sellers are trapped as they enter short trades at lower levels. Following this, the market reverses upward and breaks the CISD, signaling a shift in market structure toward bullishness.
Once this shift is identified, traders draw Fibonacci levels from the lowest point to the highest point of the move. When the price retraces to the 0.618 Fibonacci level, conditions for a buy position are met. The target for this trade is typically the Previous Day High or other significant liquidity zones where major buyers are positioned, offering a high probability of price reversal.
🟣 Bearish One Shot One Kill
In the Bearish scenario, the price initially moves toward the Previous Day High to absorb liquidity. Retail buyers are trapped as they enter long trades near the highs. After the liquidity hunt, the market reverses downward, breaking the CISD, which signals a bearish shift in market structure. Following this confirmation, Fibonacci levels are drawn from the highest point to the lowest point of the move.
When the price retraces to the 0.618 Fibonacci level, a sell position is initiated. The target for this trade is usually the Previous Day Low or other key liquidity zones where major sellers are active.
This setup provides a precise and logical framework for traders to identify market movements and enter trades at critical reversal points.
🔵 Settings
🟣 CISD Logical settings
Bar Back Check : Determining the return of candles to identify the CISD level.
CISD Level Validity : CISD level validity period based on the number of candles.
🟣 LIQUIDITY Logical settings
Swing period : You can set the swing detection period.
Max Swing Back Method : It is in two modes "All" and "Custom". If it is in "All" mode, it will check all swings, and if it is in "Custom" mode, it will check the swings to the extent you determine.
Max Swing Back : You can set the number of swings that will go back for checking.
🟣 CISD Display settings
Displaying or not displaying swings and setting the color of labels and lines.
🟣 LIQUIDITY Display settings
Displaying or not displaying swings and setting the color of labels and lines.
🔵 Conclusion
The One Shot One Kill setup is one of the most effective and well-structured trading strategies for identifying and capitalizing on key market movements. By incorporating concepts such as Liquidity Hunt, CISD, and Fibonacci retracement, this setup allows traders to enter trades with high precision at optimal points.
The strategy emphasizes detailed Price Action analysis and the identification of Smart Money behavior, helping traders to execute successful trades against the general market trend.
With a focus on identifying liquidity in the Previous Day High and Low and aligning it with Fibonacci retracement levels, this setup provides a robust framework for entering both bullish and bearish trades.
The combination of liquidity analysis and Fibonacci retracement at the 0.618 level enables traders to minimize risk and exploit major market moves effectively.
Ultimately, success with the One Shot One Kill setup requires practice, patience, and strict adherence to its rules. By mastering its concepts and focusing on high-probability setups, traders can enhance their decision-making skills and build a sustainable and professional trading approach.

One Trading Setup for Life ICT [TradingFinder] Sweep Session FVG🔵 Introduction
ICT One Trading Setup for Life is a trading strategy based on liquidity and market structure shifts, utilizing the PM Session Sweep to determine price direction. In this strategy, the market first forms a price range during the PM Session (from 13:30 to 16:00 EST), which includes the highest high (PM Session High) and lowest low (PM Session Low).
In the next session, the price first touches one of these levels to trigger a Liquidity Hunt before confirming its trend by breaking the Change in State of Delivery (CISD) Level. After this confirmation, the price retraces toward a Fair Value Gap (FVG) or Order Block (OB), which serve as the best entry points in alignment with liquidity.
In financial markets, liquidity is the primary driver of price movement, and major market participants such as institutional investors and banks are constantly seeking liquidity at key levels. This process, known as Liquidity Hunt or Liquidity Sweep, occurs when the price reaches an area with a high concentration of orders, absorbs liquidity, and then reverses direction.
In this setup, the PM Session range acts as a trading framework, where its highs and lows function as key liquidity zones that influence the next session’s price movement. After the New York market opens at 9:30 EST, the price initially breaks one of these levels to capture liquidity.
However, for a trend shift to be confirmed, the CISD Level must be broken.
Once the CISD Level is breached, the price retraces toward an FVG or OB, which serve as optimal trade entry points.
Bullish Setup :
Bearish Setup :
🔵 How to Use
In this strategy, the PM Session range is first identified, which includes the highest high (PM Session High) and lowest low (PM Session Low) between 13:30 and 16:00 EST. In the following session, the price touches one of these levels for a Liquidity Hunt, followed by a break of the Change in State of Delivery (CISD) Level. The price then retraces toward a Fair Value Gap (FVG) or Order Block (OB), creating a trading opportunity.
This process can occur in two scenarios : bearish and bullish setups.
🟣 Bullish Setup
In a bullish scenario, the PM Session High and PM Session Low are identified. In the following session, the price first breaks the PM Session Low, absorbing liquidity. This process results in a Fake Breakout to the downside, misleading retail traders into taking short positions.
After the Liquidity Hunt, the CISD Level is broken, confirming a trend reversal. The price then retraces toward an FVG or OB, offering an optimal long entry opportunity.
The initial take-profit target is the PM Session High, but if higher timeframe liquidity levels exist, extended targets can be set.
The stop-loss should be placed below the Fake Breakout low or the first candle of the FVG.
🟣 Bearish Setup
In a bearish scenario, the market first defines its PM Session High and PM Session Low. In the next session, the price initially breaks the PM Session High, triggering a Liquidity Hunt. This movement often causes a Fake Breakout, misleading retail traders into taking incorrect positions.
After absorbing liquidity, the CISD Level breaks, indicating a shift in market structure. The price then retraces toward an FVG or OB, offering the best short entry opportunity.
The initial take-profit target is the PM Session Low, but if additional liquidity exists on higher timeframes, lower targets can be considered.
The stop-loss should be placed above the Fake Breakout high or the first candle of the FVG.
🔵 Setting
CISD Bar Back Check : The Bar Back Check option enables traders to specify the number of past candles checked for identifying the CISD Level, enhancing CISD Level accuracy on the chart.
Order Block Validity : The number of candles that determine the validity of an Order Block.
FVG Validity : The duration for which a Fair Value Gap remains valid.
CISD Level Validity : The duration for which a CISD Level remains valid after being broken.
New York PM Session : Defines the PM Session range from 13:30 to 16:00 EST.
New York AM Session : Defines the AM Session range from 9:30 to 16:00 EST.
Refine Order Block : Enables finer adjustments to Order Block levels for more accurate price responses.
Mitigation Level OB : Allows users to set specific reaction points within an Order Block, including: Proximal: Closest level to the current price. 50% OB: Midpoint of the Order Block. Distal: Farthest level from the current price.
FVG Filter : The Judas Swing indicator includes a filter for Fair Value Gap (FVG), allowing different filtering based on FVG width: FVG Filter Type: Can be set to "Very Aggressive," "Aggressive," "Defensive," or "Very Defensive." Higher defensiveness narrows the FVG width, focusing on narrower gaps.
Mitigation Level FVG : Like the Order Block, you can set price reaction levels for FVG with options such as Proximal, 50% OB, and Distal.
Demand Order Block : Enables or disables bullish Order Block.
Supply Order Block : Enables or disables bearish Order Blocks.
Demand FVG : Enables or disables bullish FVG.
Supply FVG : Enables or disables bearish FVGs.
Show All CISD : Enables or disables the display of all CISD Levels.
Show High CISD : Enables or disables high CISD levels.
Show Low CISD : Enables or disables low CISD levels.
🔵 Conclusion
The ICT One Trading Setup for Life is a liquidity-based strategy that leverages market structure shifts and precise entry points to identify high-probability trade opportunities. By focusing on PM Session High and PM Session Low, this setup first captures liquidity at these levels and then confirms trend shifts with a break of the Change in State of Delivery (CISD) Level.
Entering a trade after a retracement to an FVG or OB allows traders to position themselves at optimal liquidity levels, ensuring high reward-to-risk trades. When used in conjunction with higher timeframe bias, order flow, and liquidity analysis, this strategy can become one of the most effective trading methods within the ICT Concept framework.
Successful execution of this setup requires risk management, patience, and a deep understanding of liquidity dynamics. Traders can enhance their confidence in this strategy by conducting extensive backtesting and analyzing past market data to optimize their approach for different assets.

One Setup for Life ICTGuided by ICT tutoring, I create this versatile 'One Trading Set Up For Life' indicator
This indicator shows a different way of viewing the "Highs and Lows" of Previous Sessions, drawing from the current day until 09:30 AM, the time at which the Highs and Lows of the previous day's sessions can be taken into consideration for a Reversal or for a Take profit.
Levels tested after 9.30am will be blocked so you have a good and clear view of the levels affected
Timing Session =
London: 02:00 to 05:00
New York: 9.30am to 12.30pm
Lunch: 12.30pm to 1pm
PM Session: 1.30pm to 4pm
The user has the possibility to:
- Choose to view sessions or not
- Choose to show levels from previous sessions
- Choose to show today's session levels
- Choose between 08:30 and 09:30 the starting time for the Liquidity taken
- Choose to view High and Low only from the previous day
- See both the name of the Sessions and the price of the levels
The indicator must be used as ICT shows in its concepts, the indicator takes into consideration both previous sessions and today's sessions, and the session levels can be used both for a reversal and for a possible Take Profit like the example here under
Reversal =
Possible Take Profit =
If something is not clear, comment below and I will reply as soon as possible.


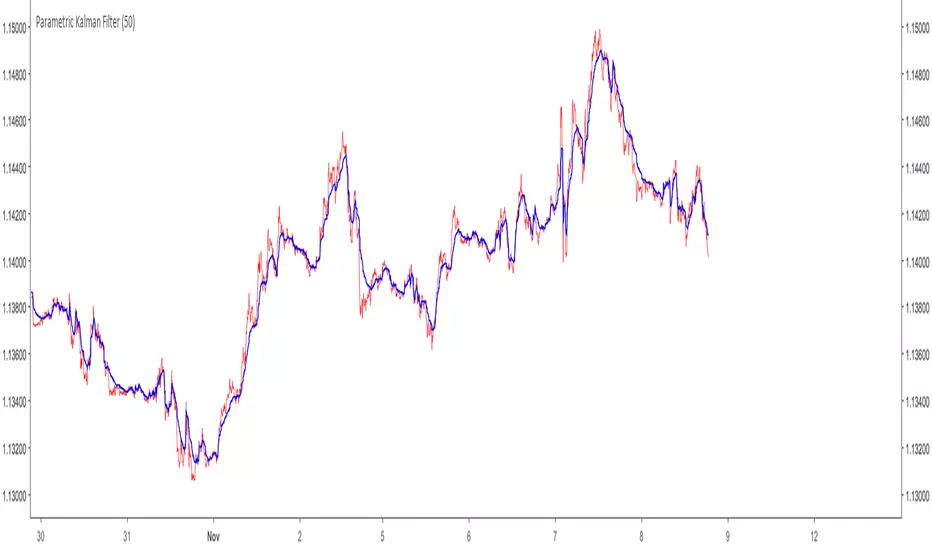
One Dimensional Parametric Kalman FilterA One Dimensional Kalman Filter, the particularity of Kalman Filtering is the constant recalculation of the Error between the measurements and the estimate.This version is modified to allow more/less filtering using an alternative calculation of the error measurement.
Camparison of the Kalman filter Red with a moving average Black of both period 50
Can be used as source for others indicators such as stochastic/rsi/moving averages...etc
For any questions/suggestions feel free to contact me
Gann Swing Chart [One-Bar]"Gann used three types of swings chart.
One-Bar Swing Chart (1-Bar Swing Chart): The One-Bar Swing Chart, or Minor Trend Chart, follows the one-bar movements of the market. From a low price, each time the market makes a higher-high than the previous bar, a One-Bar trend line moves up from the recent low to the new high. This action makes the previous low price a One-Bar bottom. From a high price each time the market makes a lower-low than the previous bar, a One-Bar swing line moves down from the recent high to the new low. This action makes the previous high price a One-Bar top.
The combination of One-Bar tops and bottoms forms the One-Bar trend indicator chart. The crossing of a One-Bar swing top changes the One-Bar trend to up. The penetration of a One-Bar swing bottom changes the One-Bar trend to down."
This Indicator only show Gann Swing Chart use One-Bar type.

Adaptive, One More Moving Average (OMA) [Loxx]Adaptive, One More Moving Average (OMA) is an adaptive moving average created by Mladen Rakic that changes shape with volatility and momentum
What is the One More Moving Average (OMA)?
The usual story goes something like this : which is the best moving average? Everyone that ever started to do any kind of technical analysis was pulled into this "game". Comparing, testing, looking for new ones, testing ...
The idea of this one is simple: it should not be itself, but it should be a kind of a chameleon - it should "imitate" as much other moving averages as it can. So the need for zillion different moving averages would diminish. And it should have some extra, of course:
The extras:
it has to be smooth
it has to be able to "change speed" without length change
it has to be able to adapt or not (since it has to "imitate" the non-adaptive as well as the adaptive ones)
The steps:
Smoothing - compared are the simple moving average (that is the basis and the first step of this indicator - a smoothed simple moving average with as little lag added as it is possible and as close to the original as it is possible) Speed 1 and non-adaptive are the reference for this basic setup.
Speed changing - same chart only added one more average with "speeds" 2 and 3 (for comparison purposes only here)
Finally - adapting : same chart with SMA compared to one more average with speed 1 but adaptive (so this parameters would make it a "smoothed adaptive simple average") Adapting part is a modified Kaufman adapting way and this part (the adapting part) may be a subject for changes in the future (it is giving satisfactory results, but if or when I find a better way, it will be implemented here)
Some comparisons for different speed settings (all the comparisons are without adaptive turned on, and are approximate. Approximation comes from a fact that it is impossible to get exactly the same values from only one way of calculation, and frankly, I even did not try to get those same values).
speed 0.5 - T3 (0.618 Tilson)
speed 2.5 - T3 (0.618 Fulks/Matulich)
speed 1 - SMA, harmonic mean
speed 2 - LWMA
speed 7 - very similar to Hull and TEMA
speed 8 - very similar to LSMA and Linear regression value
Parameters:
Length - length (period) for averaging
Source - price to use for averaging
Speed - desired speed (i limited to -1.5 on the lower side but it even does not need that limit - some interesting results with speeds that are less than 0 can be achieved)
Adaptive - does it adapt or not

TASC 2025.12 The One Euro Filter█ OVERVIEW
This script implements the One Euro filter, developed by Georges Casiez, Nicolas Roussel, and Daniel Vogel, and adapted by John F. Ehlers in his article "Low-Latency Smoothing" from the December 2025 edition of the TASC Traders' Tips . The original creators gave the filter its name to suggest that it is cheap and efficient, like something one might purchase for a single Euro.
█ CONCEPTS
The One Euro filter is an EMA-based low-pass filter that adapts its smoothing factor (alpha) based on the absolute values of smoothed rates of change in the source series. It was designed to filter noisy, high-frequency signals in real time with low latency. Ehlers simplifies the filter for market analysis by calculating alpha in terms of bar periods rather than time and frequency, because periods are naturally intuitive for a discrete financial time series.
In his article, Ehlers demonstrates how traders can apply the adaptive One Euro filter to a price series for simple low-latency smoothing. Additionally, he explains that traders can use the filter as a smoothed oscillator by applying it to a high-pass filter. In essence, similar to other low-pass filters, traders can apply the One Euro filter to any custom source to derive a smoother signal with reduced noise and low lag.
This script applies the One Euro filter to a specified source series, and it applies the filter to a two-pole high-pass filter or other oscillator, depending on the selected "Osc type" option. By default, it displays the filtered source series on the main chart pane, and it shows the oscillator and its filtered series in a separate pane.
█ INPUTS
Source: The source series for the first filter and the selected oscillator.
Min period: The minimum cutoff period for the smoothing calculation.
Beta: Controls the responsiveness of the filter. The filter adds the product of this value and the smoothed source change to the minimum period to determine the filter's smoothing factor. Larger values cause more significant changes in the maximum cutoff period, resulting in a smoother response.
Osc type: The type of oscillator to calculate for the pane display. By default, the indicator calculates a high-pass filter. If the selected type is "None", the indicator displays the "Source" series and its filtered result in a separate pane rather than showing the filter on the main chart. With this setting, users can pass plotted values from another indicator and view the filtered result in the pane.
Period: The length for the selected oscillator's calculation.

Emulating binary operations and several values in one variableBinary operations and storing several numbers in one variable.
It's useful when you need to pass a values numbers to another study. Study-on-study (SOS) in Tradingview allows passing only one value, which is not always convinient. So if we put all those numbers in one - we can pass more values from one study to another.
In Pine we can use up to 52 bits for our data. Because of that we can put 6 1-byte (8-bit) values in one float. Or 12 4-bit values. Or 52 1-bit values.

IIR One-Pole Price Filter [BackQuant]IIR One-Pole Price Filter
A lightweight, mathematically grounded smoothing filter derived from signal processing theory, designed to denoise price data while maintaining minimal lag. It provides a refined alternative to the classic Exponential Moving Average (EMA) by directly controlling the filter’s responsiveness through three interchangeable alpha modes: EMA-Length , Half-Life , and Cutoff-Period .
Concept overview
An IIR (Infinite Impulse Response) filter is a type of recursive filter that blends current and past input values to produce a smooth, continuous output. The "one-pole" version is its simplest form, consisting of a single recursive feedback loop that exponentially decays older price information. This makes it both memory-efficient and responsive , ideal for traders seeking a precise balance between noise reduction and reaction speed.
Unlike standard moving averages, the IIR filter can be tuned in physically meaningful terms (such as half-life or cutoff frequency) rather than just arbitrary periods. This allows the trader to think about responsiveness in the same way an engineer or physicist would interpret signal smoothing.
Why use it
Filters out market noise without introducing heavy lag like higher-order smoothers.
Adapts to various trading speeds and time horizons by changing how alpha (responsiveness) is parameterized.
Provides consistent and mathematically interpretable control of smoothing, suitable for both discretionary and algorithmic systems.
Can serve as the core component in adaptive strategies, volatility normalization, or trend extraction pipelines.
Alpha Modes Explained
EMA-Length : Classic exponential decay with alpha = 2 / (L + 1). Equivalent to a standard EMA but exposed directly for fine control.
Half-Life : Defines the number of bars it takes for the influence of a price input to decay by half. More intuitive for time-domain analysis.
Cutoff-Period : Inspired by analog filter theory, defines the cutoff frequency (in bars) beyond which price oscillations are heavily attenuated. Lower periods = faster response.
Formula in plain terms
Each bar updates as:
yₜ = yₜ₋₁ + alpha × (priceₜ − yₜ₋₁)
Where alpha is the smoothing coefficient derived from your chosen mode.
Smaller alpha → smoother but slower response.
Larger alpha → faster but noisier response.
Practical application
Trend detection : When the filter line rises, momentum is positive; when it falls, momentum is negative.
Signal timing : Use the crossover of the filter vs its previous value (or price) as an entry/exit condition.
Noise suppression : Apply on volatile assets or lower timeframes to remove flicker from raw price data.
Foundation for advanced filters : The one-pole IIR serves as a building block for multi-pole cascades, adaptive smoothers, and spectral filters.
Customization options
Alpha Scale : Multiplies the final alpha to fine-tune aggressiveness without changing the mode’s core math.
Color Painting : Candles can be painted green/red by trend direction for visual clarity.
Line Width & Transparency : Adjust the visual intensity to integrate cleanly with your charting style.
Interpretation tips
A smooth yet reactive line implies optimal tuning — minimal delay with reduced false flips.
A sluggish line suggests alpha is too small (increase responsiveness).
A noisy, twitchy line means alpha is too large (increase smoothing).
Half-life tuning often feels more natural for aligning filter speed with price cycles or bar duration.
Summary
The IIR One-Pole Price Filter is a signal smoother that merges simplicity with mathematical rigor. Whether you’re filtering for entry signals, generating trend overlays, or constructing larger multi-stage systems, this filter delivers stability, clarity, and precision control over noise versus lag, an essential tool for any quantitative or systematic trading approach.

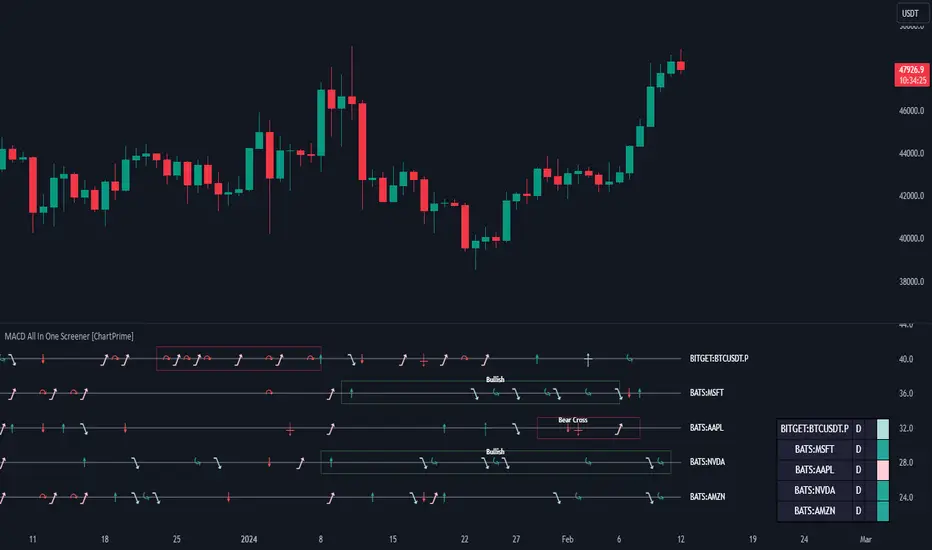
MACD All In One Screener [ChartPrime]INTRODUCTION
MACD All In One Screener (ChartPrime) is a multi instrument, multi timeframe indicator designed to provide traders with a comprehensive solution to monitoring the market. This indicator is designed to be easy to use and visually appealing while also being highly flexible and feature rich. Users can pick up to 10 symbols not including the chart's symbol and set up alerts for many different signals that the MACD produces. One standout feature of this indicator is its ability to display not only each symbol individually as a MACD but you can also view its chart from within this indicator. This removes the need to flip between symbols to see the price action for your basket.
On top of that we have designed this indicator to be friendly with "indicator on indicator" by providing outputs for all of the standards of price that users may want. Included is an overview section that shows all of the symbols signals symbolically over time. Additionally we have included a table for easy monitoring. This table includes the symbol, its timeframe, the current alert, and its histogram state. To make things as user friendly as possible we have also included rich error handling that tells you exactly what is wrong with your configuration.
HOW TO USE
To use this indicator, simply add it to your chart and navigate to the settings. From there select the symbols you want to monitor and the timeframes you want to use. Next you want to navigate down to the alerts section to select the what alerts you want to receive, and what symbols you want to get alerts for. Finally, you wan to create your alert using "Any alert() function call". Now your screener is all set up!
OVERVIEW OF INPUTS
View allows you to select what the indicator currently displays. You can pick from any one of the selected symbols, an overview of all of the symbols, or simply nothing. If you want to only use the table, "None" is provided so you can move the indicator into the chart panel.
View Toggle lets you pick from displaying the MACD for the selected symbol or the Price Action as a candle chart. To see your "indicator on indicator" you will have to select a symbol from the view list. There is a bug where if you select "Overview" while you are using "indicator on indicator" your added indicator will see the last symbol you viewed. To fix this, simply change the setting of your overlaid indicator and it will correct its self.
History Length is the number of historical bars to calculate over. This feature is here to prevent the indicator from breaking due to uneven historical data between the symbols.
Show Price Line toggles a dotted line that follows the current symbols closing price when "Price" is selected under the "View Toggle" dropdown.
Show Symbol Label toggles a label that displays the current symbols name and timeframe. This only impacts the single symbol view.
Overview Label Color adjusts the color of the symbol labels for both overview and single symbol view.
MA Type lets you pick what kind of moving average you want to use for the oscillator or signal. You can pick from the standard SMA or EMA.
Fast Length is a standard input for MACD. This lets you pick the period of the fast MA.
Slow Length , just like Fast Lenght, is a standard input for MACD. This lets you pick the period of the slow MA.
Signal Length is another standard input for MACD. This lets you configure the period of the signal MA.
MACD Cross Overlay Icon is a toggle to display MACD crosses when viewing a single symbol's MACD. When the MACD has a bullish cross it will plot a bullish dot, and when it has a bearish cross it will plot a bearish dot. This is purely visual.
Regular Bullish and Bearish toggles the visual display of the divergences on the single symbol view. This does not effect the indicators ability do send alerts.
Divergence Look Right adjusts the number of bars into the future to look for confirmation of a signal. This directly impacts lag but enhances stability.
Divergence Look Left adjusts the number of bars into the past to check for a signal. A longer period will filter out smaller moves
Maximum Lookback adjusts the maximum size of a divergence.
Minimum Lookback adjusts the minimum size of a divergence.
Divergence Drawings picks how you want to visualize the divergence. You can pick from displaying it as a line, a label, or both.
Enable Table toggles the overview table. When enabled it will show you the enabled symbols and their current state. From left to right: symbol name, timeframe, current alert, and histogram state.
Position picks where on the chart you want the table to be.
Text Color adjusts the text color of the table.
BG Color adjusts the background color of the table.
Frame Color adjust the frame color of the table.
Current Symbol Time Frame adjusts the timeframe of the chart's symbol.
Symbol 1 - 10 pick "Symbol's" symbol and timeframe. To use higher timeframes, the symbol's have to be the same type. You can't have a crypto and a stock using HTF at the same time as they don't have the same sessions and will result in an error. You can use unsafe mode (as described below) to potentially get around this.
Enable Symbol when enabled it will give you alerts for the symbol. This also enables the symbol in the overview. If this is disabled it won't send alerts, and it will not show up in overview, or the table.
Wait for Close enables waiting for the bar to close before printing an alert.
Alert Symbol Size picks what size you want the overview symbols to be.
Enable Cross Over 0 Alert: MACD crosses over the 0 line.
Enable Cross Under 0 Alert: MACD crosses under the 0 line.
Enable MACD Cross Bullish Alert: Bullish MACD cross.
Enable MACD Cross Bearish Alert: Bearish MACD cross.
Enable Histogram Bullish Turn Alert: MACD begins to turn bullish but hasn't crossed.
Enable Histogram Bearish Turn Alert: MACD begins to turn bearish but hasn't crossed.
Enable Histogram Bullish Continuation Alert: MACD is in a bullish cross state and it was declining but began rising again.
Enable Histogram Bearish Continuation Alert: MACD is in a bearish cross state and it was rising but began falling again.
Enable Bullish/Bearish Divergence Alert enables divergence alerts. Divergences are lagging, especially on a higher timeframe. These alerts will also tell you the time in the past when the divergence occurred.
Color Section is provided to allow for personalization of the indicator. Everything can be adjusted here.
Disable Error Checking: Only enable this if you want to bypass the built in error checking. This will enable 'Safe Requesting'. Safe Requesting will only request enabled symbols and you will not be able to view symbols that are not enabled in this mode. Only use this if you want to mix symbol types and you know it will work. (An example would be viewing stocks and SPY at the same time.)
CONCLUSION
The MACD All In One Screener (ChartPrime) is a versatile indicator designed to monitor multiple symbols across various timeframes. The flexibility in customization, from MACD settings to visual alerts and table presentations, allows users to tailor the screener to their needs and preferences. We hope you find this as useful and interesting as we do and wish you good luck in the market!
Enjoy
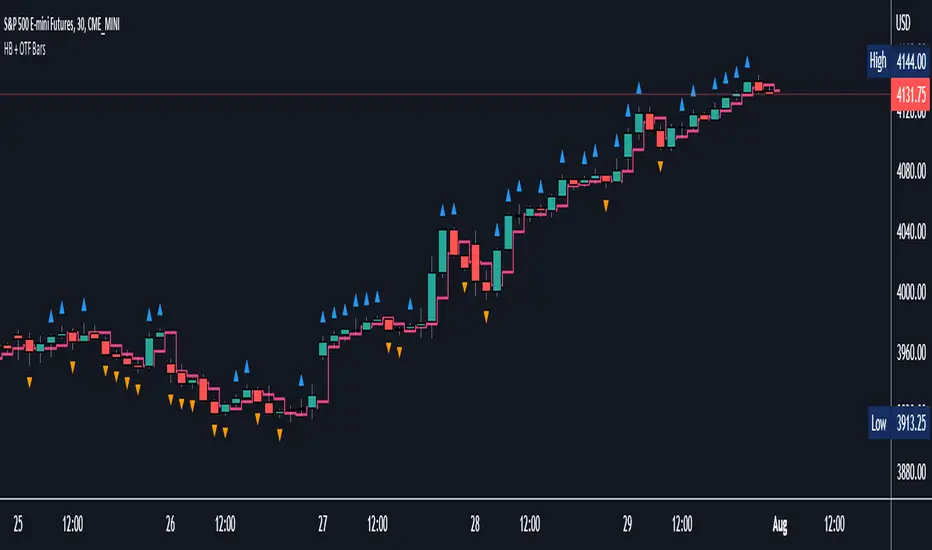
Halfback + One-Time-Framing BarsThis indicator is designed to be used with Market Profile / Volume Profile trading techniques on a 30min chart.
The halfback of a candle is the mid point between the high and the low of the candle. A halfback trade can be taken once price retraces into this point as support/resistance using the prevailing trend as your trade direction.
One-Time-Framing is a fancy term for trending in one direction. One-Time-Framing happens when a candle breaks the previous candle's high without testing the low or when a candle breaks the low of the previous candle without testing the high. This indicates that the trend is one directional and opposing pressure is very weak. Taking trades in the opposing direction of multiple OTF bars is typically a bad trade setup.
Halfback and OTF setups are typically used on a 30min timeframe combined with Market or Volume Profile, but you can experiment with these setups on any timeframe if you wish.
I hope you all enjoy this indicator, comment below if you have any questions.
OMA (One More Average) RSI Histogram [Loxx]OMA (One More Average) RSI Histogram is an RSI histogram built using the OMA adaptive moving average. This is meant to filter out the noise from regular RSI. You'll notice that it rarely signals, but the signals that do show up are perfectly set up for mean reversion/trend ATR-based trading.
What is the One More Moving Average (OMA)?
The usual story goes something like this : which is the best moving average? Everyone that ever started to do any kind of technical analysis was pulled into this "game". Comparing, testing, looking for new ones, testing ...
The idea of this one is simple: it should not be itself, but it should be a kind of a chameleon - it should "imitate" as much other moving averages as it can. So the need for zillion different moving averages would diminish. And it should have some extra, of course:
How to use
Green means buy
Red means sell
Included
Bar coloring

All in One Strategy no RSI Label - For higher dollar cryptoThis is the All in One Strategy without the RSI suggestion label that will work well for any of the crypto currencies trading above $500 so the overlay shows up better. I am using ETH as an example on this.
Based on some comments on my previously published script that has been replaced I have added Alert Conditions to this version that can be used in other bots. You can also copy and paste these alert conditions into the other All in One script I published for the lower priced cryptocurrencies.
To use the alert conditions I have in here, you will need to convert this strategy into a study to do so. Delete the entry and exit logic at the end (lines 299 through 351), delete line 18 and paste the following in place of line 18:
study(shorttitle='Ain1 No Label',title='All in One Strategy no RSI Label', overlay=true, scale=scale.left)
Here are the settings to mimic what you see here in the back test strategy I am publishing. Remember that previous results do not guarantee future results.
Chart Time = 30 Minutes (if you didn't read my original All in One post, read it. Shorter isn't better. You lose your money faster in a shorter amount of time and I learned that the hard way)
Start Time = 1 April 2021 00:00
End Time = 31 December 2021 00:00
Trade Type = Long/Short
Stop Loss % = 20.1
Take Profit % = 14.57
RSI Length = 20
Overbought = 44
Oversold = 45
EMA Fast Length = 5
EMA Slow Length = 15
Overbought Lookback Minimum Value = 62
Overbought Lookback Bars = 3
Oversold Minimum Value = 43
Oversold Lookback Bars = 5
Source = Close
Max Lookback Period = 5
Use EMA Only = True (check the box)
K = 9
D = 17
K Mode = SMA
High Source = ohlc4
Low Source = ohlc4
Properties - Starting Amount is $3500, everything else is the same.
Any questions, feel free to ask. I will answer as soon as I can.

AB=CD Fibonacci Strategy (One Trade at a Time)
AB=CD Fibonacci Strategy - Harmonic Pattern Trading Bot
Description
An automated trading strategy that identifies and trades the classic AB=CD harmonic pattern, one of the most reliable geometric price formations in technical analysis. This strategy detects perfectly proportioned Fibonacci retracement setups and executes trades with precise risk-reward management.
How It Works
The indicator scans for the AB=CD pattern structure:
Leg AB: Initial swing from pivot point A to pivot point B
Leg BC: Retracement to point C (customizable Fibonacci levels)
Leg CD: Mirror projection equal to the AB leg length
When price touches point D, the strategy automatically enters a position with predefined take-profit and stop-loss levels based on your risk-reward ratio.
Key Features
One Trade at a Time: Ensures disciplined position management by allowing only one active trade per pattern
Customizable Fibonacci Retracement: Set your preferred retracement range for point C (default 50% - 78.6%)
Risk-Reward Control: Adjust stop-loss and take-profit multiples to match your trading plan
Visual Pattern Display: Clear labeling of A, B, C, D points with pattern lines for easy identification
Both Directions: Identifies bullish and bearish AB=CD patterns automatically
Ideal For
Swing traders on higher timeframes (4H, Daily, Weekly)
Harmonic pattern traders seeking automation
Traders wanting precise entry and exit rules based on Fibonacci geometry
Those looking to reduce emotional trading and increase consistency
Default Settings Optimized For
NASDAQ futures and currency pairs
Medium timeframe analysis
Conservative risk management (10% position size per trade)

All-in-One Indicator**All-in-One Trading Indicator** 🛠️
This powerful and versatile TradingView indicator combines multiple popular technical tools into a single, easy-to-use script. Designed for traders who want a comprehensive view of the market, it includes:
* **MACD** – with optional lines and histogram for momentum analysis
* **Multiple Moving Averages (MA1/MA2/MA3)** – SMA or EMA, fully customizable
* **RSI** – short or long-term momentum indicator
* **VWAP** – volume-weighted average price for intraday trend spotting
* **Supertrend** – clear trend direction signals
* **ADX & DMI** – trend strength and directional movement
* **Stochastic** – %K and %D lines with overbought/oversold zones
* **Bollinger Bands** – upper and lower bands for volatility analysis
✅ All components are optional and fully configurable
✅ Designed to give a complete market overview in one pane or overlay
✅ Perfect for intraday, swing, and position traders
**Make smarter trading decisions by combining trend, momentum, and volatility insights in one place!**
---
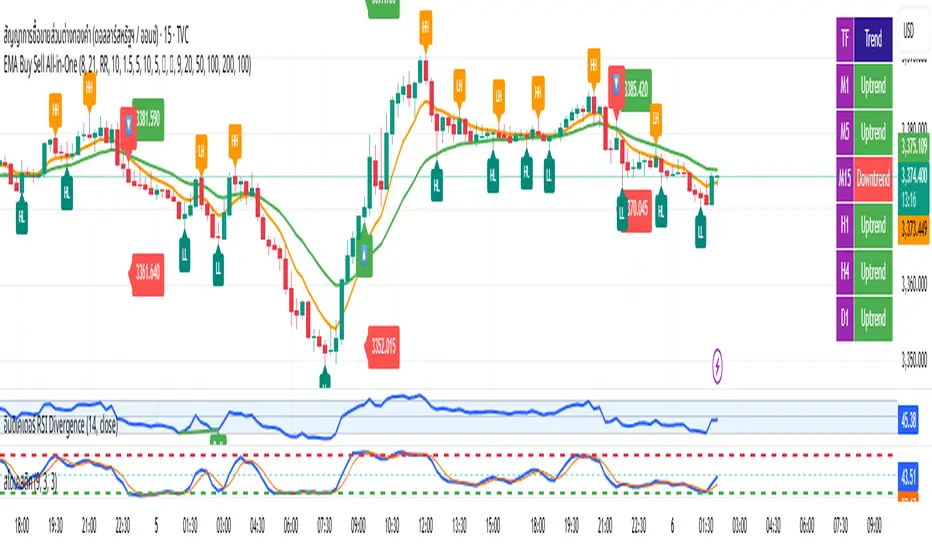
EMA Buy Sell All-in-One✨ Description (แนะนำให้ใช้ตอนกด Publish):
This all-in-one indicator combines several powerful trading tools into one script:
• EMA Cross Entry System: Customizable fast/slow EMA cross for buy/sell signals
• Dynamic SL/TP System: Choose between swing-based or custom SL/TP; auto-calculated RR support
• HH, HL, LH, LL Labels: Market structure points marked directly on chart (toggle ON/OFF)
• Multi-Timeframe Trend Table: Visual overview of EMA trends across D1 → M1 timeframes
• H1 Trend Change Icons: Alerts when the hourly trend flips direction
➤ Clean and responsive display
➤ Fully customizable via input panel
➤ Great for intraday or swing traders following trend + structure alignment
Feel free to fork or modify. Made for those who want clarity and confluence in one view.
[Strategy Alert Webhook Demo] Buy One Sell One Buy One Sell One
Two Options to send Alert Order via Webhook
1. Order fill events with `alert_message` on strategy.close(), strategy.entry(), strategy.exit() and strategy.order()
NOTE: Need to fill the Alert Creation box with `{{strategy.order.alert_message}}`
2. Send Alert through `alert()`
