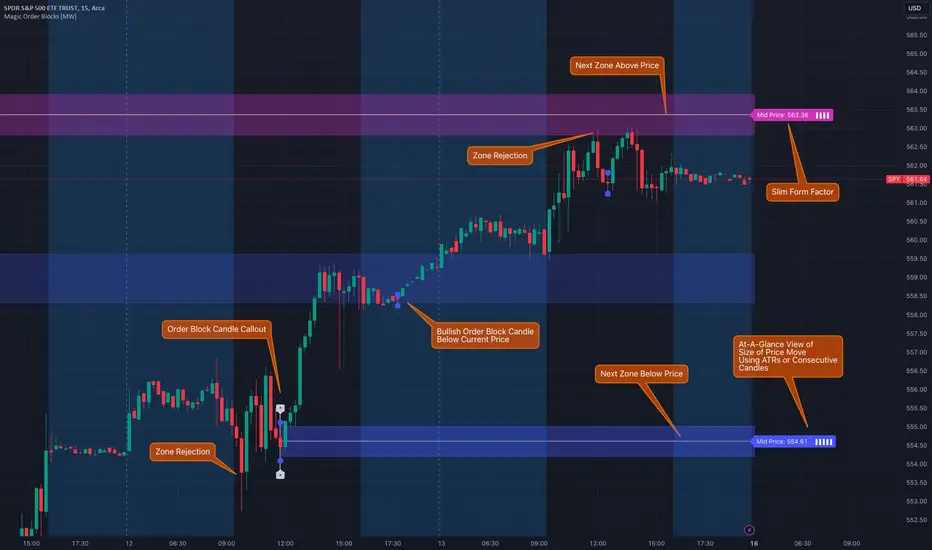
Magic Order Blocks [MW]Add a slim design, minimalist view of the most relevant higher and lower order blocks to your chart. Use our novel method of filtering that uses both the the number of consecutive bullish or bearish candles that follow the order block, and the number of ATRs that the asset’s price changed following the order block. View just the order blocks above and below the current price, or view the backgrounds for each and every one. And, if you're up to it, dig into a comprehensive view of the data for each order block candle.
Settings:
General Settings
Minimum # of Consecutive Bars Following Order Block
Show Bullish Order Blocks Below / Hide Last Bullish Block
Show Bearish Order Blocks Above / Hide Last Bearish Block
Use ATR Filter - Select # of ATRs Below
Closest Order Block is Followed by This Many ATRs
Preferences
Right Offset of Indicator Label
Show Mid-Line from Recent Order Block Indicator Label
Use ATRs Instead of Consecutive Candles in Label Indicator
Show Timestamp of Recent Order Block
Show Large Order Block Detail Labels
Show Small Order Block Labels
Background Settings
Show Background for Recent Order Block Indicator Label
# of Backgrounds to Show Before Now
Show All Bullish Order Block Backgrounds
Show All Bearish Order Block Backgrounds
Calculations
This indicator creates a matrix of each order block that is followed by the user-specified number of consecutive bullish or bearish candles. The data can be further filtered by the number of ATRs that the price moves after the order block - also user-defined. The most recent bearish order block above the current price takes arrays from the initial filtered matrix of arrays, filters once more by the “mid-price” of the order block (the average between the order block candle high and low) and selects the last element from this order block matrix. The same follows for the latest bearish order block above the current price.
How to Use
An order block refers to a price range or zone on a chart where large institutional orders have been placed, causing a significant shift in market direction. These zones are crucial because they often indicate areas of strong buying or selling interest, which can lead to future support or resistance levels. Traders use order blocks to identify potential points of market reversal or continuation.
The Magic Order Blocks default view shows the most recent overhead bearish order block above the current price, and the most recent bullish order block below. These can presumably act as support or resistance levels, because they reflect the last price where a significant price move occurred. “Significant” meaning that the order block candle was followed by many consecutive bullish or bearish candles. Based on the user-defined settings, it can also mean that price moved multiples of the asset's average true range (ATR). More consecutive candles means that the duration of the move lasted a long time. A higher ATR move indicates that the price moved impulsively in one direction.
The default view also shows a label to the right of the current price that provides the price level, the time stamp of the order block (optional), and a sequence of bars that show the significance of the level. By default, these bars represent the number of ATRs that price rose or fell following the order block, but they can be toggled to show the number of consecutive bullish or bearish candles that followed the order block.
Although the default view provides the zones that are most relevant to the current price, past order block candles can also be identified visually with labels as well with translucent backgrounds color-coded for bullish or bearish bias. Overlapping backgrounds can identify an area that has been repeatedly been an area of support or resistance.
A detailed view of each order block can also be viewed the includes the following data points:
Bar Index
Timestamp
Consecutive Accumulated Volume
Consecutive Bars
Price Change over Consecutive Bars
Price/Volume Ratio Over Consecutive Bars
Mid Price of Order Block
High Price of Order Block
Low Price of Order Block
ATRs over Consecutive Bars
- Other Usage Notes and Limitations:
The calculations used only provide an estimated relationship or a close approximation, and are not exact.
It's important for traders to be aware of the limitations of any indicator and to use them as part of a broader, well-rounded trading strategy that includes risk management, fundamental analysis, and other tools that can help with reducing false signals, determining trend direction, and providing additional confirmation for a trade decision. Diversifying strategies and not relying solely on one type of indicator or analysis can help mitigate some of these risks.
Things to keep in mind. Longer timeframes don’t necessarily have a as many consecutive candle drops or gains as with shorter timeframes, so be sure to adjust your settings when moving to 1 hour, 1 day, or 1 week timeframes from 1 minute, 5 minute, or 15 minute timeframes.
在脚本中搜索"order"
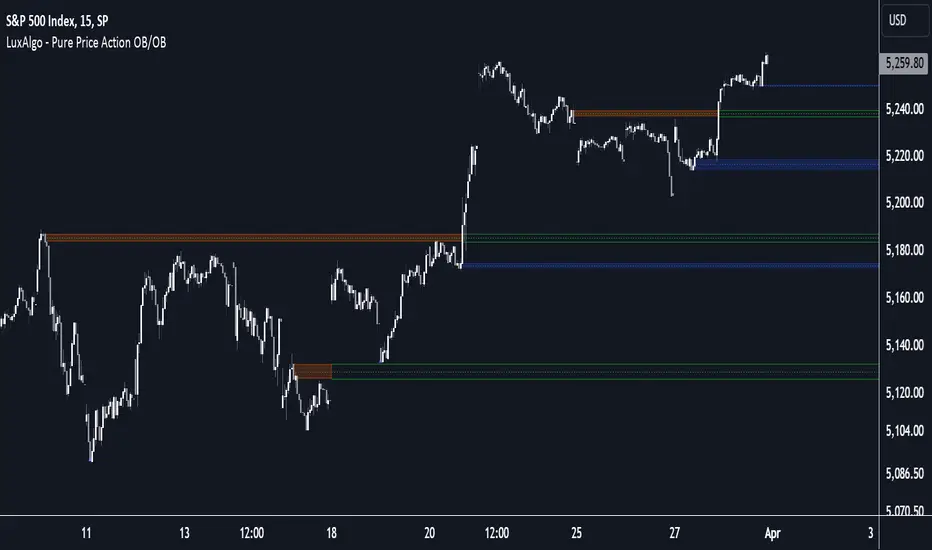
Pure Price Action Order & Breaker Blocks [LuxAlgo]The Pure Price Action Order & Breaker Blocks indicator is a pure price action adaptation of our previously published and highly popular Order-Blocks-Breaker-Blocks script.
Similar to its earlier version, this indicator detects order blocks that can automatically turn into breaker blocks on the chart once mitigated. However, the key difference/uniqueness is that the pure price action version relies solely on price patterns, eliminating the need for length definitions. In other words, it removes the limitation of user-defined inputs, ensuring a robust and objective analysis of market dynamics.
🔶 USAGE
An order block is a significant area on a price chart where there was a notable accumulation or distribution of orders, often identified by a strong price move followed by consolidation. Traders use order blocks to identify potential support or resistance levels.
A mitigated order block refers to an order block that has been invalidated due to subsequent market movements. It may no longer hold the same significance in the current market context. However, when the price mitigates an order block, a breaker block is confirmed. It is possible that the price might trade back to this breaker block, potentially offering a new trading opportunity.
Users can optionally enable the "Historical Polarity Changes" labels within the settings menu to see where breaker blocks might have previously provided effective trade setups.
This feature is most effective when using replay mode. Please note that these labels are subject to backpainting.
🔶 DETAILS
The swing points detection feature relies exclusively on price action, eliminating the need for numerical user-defined settings.
The first step involves detecting short-term swing points, where a short-term swing high (STH) is identified as a price peak surrounded by lower highs on both sides. Similarly, a short-term swing low is recognized as a price trough surrounded by higher lows on both sides.
Intermediate-term swing and long-term swing points are detected using the same approach but with a slight modification. Instead of directly analyzing price candles, we now utilize the previously detected short-term swing points. For intermediate-term swing points, we rely on short-term swing points, while for long-term swing points, we use the intermediate-term ones.
🔶 SETTINGS
Detection: Market structure used to detect swing points for creating order blocks.
Show Last Bullish OB: Number of the most recent bullish order/breaker blocks to display on the chart.
Show Last Bearish OB: Number of the most recent bearish order/breaker blocks to display on the chart.
Use Candle Body: Allows users to use candle bodies as order block areas instead of the full candle range.
🔹 Style
Show Historical Polarity Changes: Allows users to see labels indicating where a swing high/low previously occurred within a breaker block.
🔶 RELATED SCRIPTS
Pure-Price-Action-Structures.
Order-Blocks-Breaker-Blocks.
Scaled Order Sizing and Take Profit Target ArraysWOAH Order Scaling!
This Provides a user with methods to create a list of profit targets and order sizes which grow or shrink. For size, the will add up to specific sum. for Targets they will include the first and last, and can lean towards either, to scale the order grid.
And thanks to @Hoanghetti for the markdown, i've included a basic usage example within the hover , o you don't need to search for the usage example, simply import, and when writing, the code hint contains a full example.
scaled_sizes(total_size, count, weight, min_size, as_percent)
create an array of sizes which grow or shrink from first to last
which add up to 1.0 if set the as_percent flag , or a total value / sum.
Parameters:
total_size : (float) total size to divide ito split
count : (int ) desired number of splits to create
weight : (float) a weight to apply to grow or shrink the split either towards the last being most, or the first being most, or 1.0 being each is equally sized as 1/n count
min_size : (float) a minimum size for the smallest value (in value of ttotal_size units)
as_percent : (float) a minimum size for the smallest value (in value of total_size units)
Returns: Array of Sizes for each split
scaled_targets(count, weight, minimum, maximum)
create a list of take profitt targets from the smallest to larget distance
Parameters:
count : (int ) number of targets
weight : (float) weight to apply to growing or shrinking
minimum : (float) first value of the output
maximum : (float) last value of the output
Returns: Array of percentage targets

Automatic Order Block + Imbalance by D. BrigagliaThis script combines automatic orderblock and imbalance tracking.
Bullish OB - Blue
Bullish Imbalance - Green
Bearish OB - Red
Bearish Imbalance - Orange
Please note that the actual definitions of orderblock and imbalance are not respected in this script for the sake of simplicity. Scripts that are too complex may overfit some particular chart. Since there is no way to translate the actual ob and imb definitions into pinescript language, I decided to keep it simple.
Ideally, you want to see a bullish OB followed by buy side imbalance, or viceversa. OBs that are broken weakly are generally invalidated, ones that are broken strongly generally become breakers, and you can use them as good support/resistance levels.
Also, a good thing you can do when an OB and an imbalance match, is going in the lower timeframes and catching the structure reversal in the OB or imbalance zone. That may provide excellent RR trades. Always trade with OB that confirm the HTF trend.
Nothing in my content on tradingview is considerable investment advice.

Supply and Demand - Order Block - Energy CandlesSupply and Demand - Order Block - Energy Candles
Description
An experimental script, designed as a visual aid, to highlight the last up or down candle before a fractal break. We can assume these candles where the point of origin that generated enough strength to break recent structure. By using them as reference points, traders are expected to follow their own set of rules and mark higher probability supply and demand zones in the area.
How to use:
Expect a potential retest in these areas, and if they fail, a potential retest in the opposite direction. The greater the number of times a zone is tested, the more likely it is to break. A fresh zone that has not yet been tested will have a higher probability of a bounce.
Fractal period and candle break type can be personalised in settings. Can be used on all timeframes (higher the better).
Indicator in use:
Extras:
An option to flip candle colours if current price is above or below them has been added.

Institutional Orderflow Pro — VWAP, Delta, and Liquidity
Institutional Orderflow Pro is a next-generation order flow analysis indicator designed to help traders identify institutional participation, directional bias, and exhaustion zones in real time.
Unlike traditional volume-based indicators, it merges VWAP dynamics, cumulative delta, relative volume, and liquidity proximity into a single unified dashboard that updates tick-by-tick — without repainting.
The indicator is open-source, transparent, and educational. It aims to provide traders with a clearer read on who controls the market — buyers or sellers — and where liquidity lies.
The indicator combines multiple institutional-grade analytics into one framework:
RVOL (Relative Volume) = Compares current volume against the average of recent bars to identify strong institutional participation.
zΔ (Delta Z-Score) = Normalizes the buying/selling delta to reveal unusually aggressive market behavior.
CVDΔ (Cumulative Volume Delta Change) = Shows which side (buyers/sellers) is dominating this bar’s order flow.
VWAP Direction & Slope = Determines whether price is trading above/below VWAP and whether VWAP is trending or flat.
PD Distance (Prev Day Confluence) = Measures the current price’s distance from previous day’s high, low, close, and VWAP in ATR units — highlighting liquidity zones.
ABS/EXH Detection = Identifies institutional absorption and exhaustion patterns where momentum may reverse.
Bias Computation = Combines VWAP direction + slope to give a simplified regime signal: UP, DOWN, or FLAT.
All metrics are displayed through a color-coded, non-repainting HUD:
🟢 = bullish / favorable conditions
🔴 = bearish / weak conditions
⚫ = neutral / flat
🟡 = absorption (potential trap zone)
🟠 = exhaustion (momentum fading)
| Metric | Signal | Meaning |
| ---------------------- | ------- | ---------------------------------------------- |
| **RVOL ≥ 1.3** | 🟢 | High institutional activity — valid setup zone |
| **zΔ ≥ 1.2 / ≤ -1.2** | 🟢 / 🔴 | Unusual buy/sell aggression |
| **CVDΔ > 0** | 🟢 | Buyers dominate this bar |
| **VWAP dir ↑ / ↓** | 🟢 / 🔴 | Institutional bias long/short |
| **Slope ok = YES** | 🟢 | Trending market |
| **PD dist ≤ 0.35 ATR** | 🟢 | Near key liquidity zones |
| **Bias = UP/DOWN** | 🟢 / 🔴 | Trend-aligned environment |
| **ABS/EXH active** | 🟡 / 🟠 | Caution — possible reversal zone |
How to Use
Confirm Volume Context → RVOL > 1.2
Align with Bias → Take longs only when Bias = UP, shorts only when Bias = DOWN.
Check Slope and VWAP Dir → Ensure trending context (Slope = YES).
Confirm CVD and zΔ → Flow should agree with price direction.
Avoid ABS/EXH Triggers → These signal exhaustion or absorption by large players.
Enter Near PD Zones → Ideal trade zones are within 0.35 ATR of prior-day levels.
This multi-factor confirmation reduces noise and focuses only on high-probability institutional setups.
Originality
This script was written from scratch in Pine v6.
It does not reuse existing public indicators except for standard built-ins (ta.vwap, ta.atr, etc.).
The unique combination of delta z-scoring, VWAP slope filtering, and real-time confluence zones distinguishes it from typical orderflow tools or cumulative delta overlays.
The core innovation is its merged real-time HUD that integrates institutional metrics and natural-language feedback directly on the chart, allowing traders to read market context intuitively rather than decode multiple subplots.
Notes & Disclaimers
This indicator does not repaint.
It’s intended for educational and analytical purposes only — not as financial advice or a guaranteed signal system.
Works best on liquid instruments (Futures, Indices, FX majors).
Avoid non-standard chart types (Heikin Ashi, Renko, etc.) for accurate readings.
Open-source, modifiable, and compatible with Pine v6.
Recommended Use
Apply it with clean charts and standard candles for the best clarity.
Use alongside a basic structure or volume profile to contextualize institutional bias zones.
Author: Dhawal Ranka
Category - Orderflow / VWAP / Institutional Analysis
Version: Pine Script™ v6
License: Open Source (Educational Use)

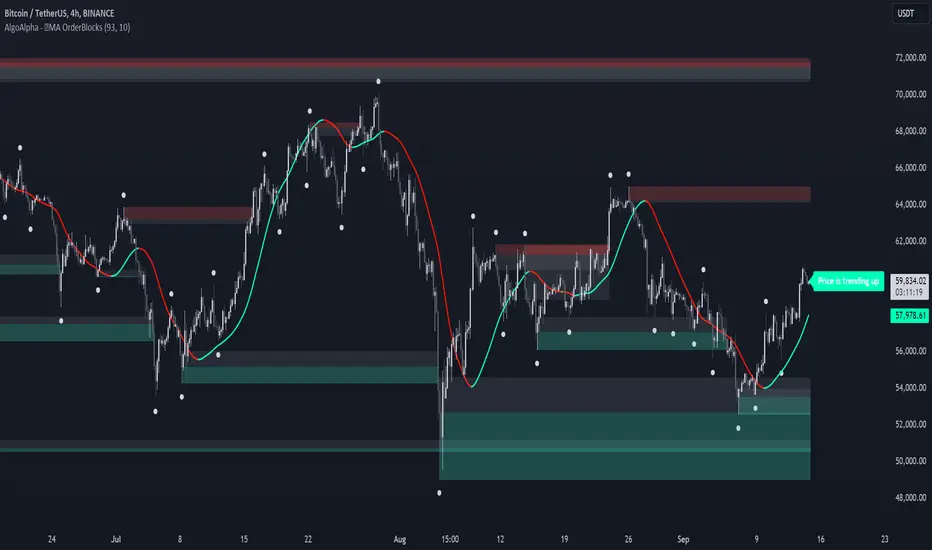
MA OrderBlocks [AlgoAlpha]🟨 HMA OrderBlocks by AlgoAlpha is a powerful tool designed to help traders visualize key pivot zones and order blocks based on the Hull Moving Average (HMA). By dynamically identifying bullish and bearish pivot points, this script provides insights into potential price reversals and trend continuations. With customizable settings, it allows traders to tweak the behavior of the indicator to match their strategies. Plus, it comes packed with built-in alerts for trend changes, making it easier to spot potential trade opportunities.
Key Features :
📊 Trend Detection : Utilizes Hull Moving Average to detect the current trend.
🟢🔴 Bullish & Bearish Zones : Automatically plots bullish and bearish order blocks, using customizable colors for clear visual cues.
🎯 Pivot Points : Detects and marks pivot highs and lows, helping traders spot key price reversals.
🚨 Alerts : Built-in alert system for when the price approaches key bullish or bearish zones, or when the trend changes.
🔨 Customizable MA: Choose from various moving averages (SMA, HMA, EMA, etc.) to suit your strategy.
How to Use :
⭐ Add the Indicator : Add the indicators to favourites by pressing the star icon. Once added, configure settings like the Hull MA period and pivot detection period.
📈 Analyze the Chart : Watch for the plotted order blocks and pivot points to identify possible price action strategies.
🔔 Enable Alerts : Set up alerts to be notified of potential trend reversals or when the price nears a bullish/bearish block.
How It Works :
The script starts by calculating the Hull Moving Average (HMA) based on the user-defined length, which is used to determine the market trend direction. It compares the current HMA value with the previous one to confirm whether the price is trending upwards or downwards. Once a trend change is detected, it plots bullish or bearish order blocks based on recent pivot highs and lows. These zones are extended in real-time as long as they remain invalidated. Zones are invalidated are invalidated when price completely closes through them. If the price gets close to a zone in the opposing direction, a warning system alerts the user that the block may not hold. Additionally, customizable alerts trigger whenever the price trend shifts or the price gets near important bullish/bearish blocks. The script’s logic ensures that order blocks are cleared if price violates them, keeping the chart clean and updated.
Calculate Order Entry Units based on set Dollar ValuesFUNCTIONS
- Calculate UNITS quantity based on user's input dollar values.
- Show Units in table
USAGE
- Enter 6 usual order $ values
- Use units value in order entry
Tradingview doesn't have order entry in dollar value for most connections/exchanges so it's really tedious to calculate Units some other way every time.
This gives you the Units based on your most used order value sizes in a quick way.
Possible future updates
- Allow user settings for number of values to display
- Allow user option to set titles for each row
Note:
Tradingview really need to get off their butts and give us a real DOM panel and working dollar value order entry for all exchanges among other order entry panel updates.
I hope everyone is suggesting this to them.

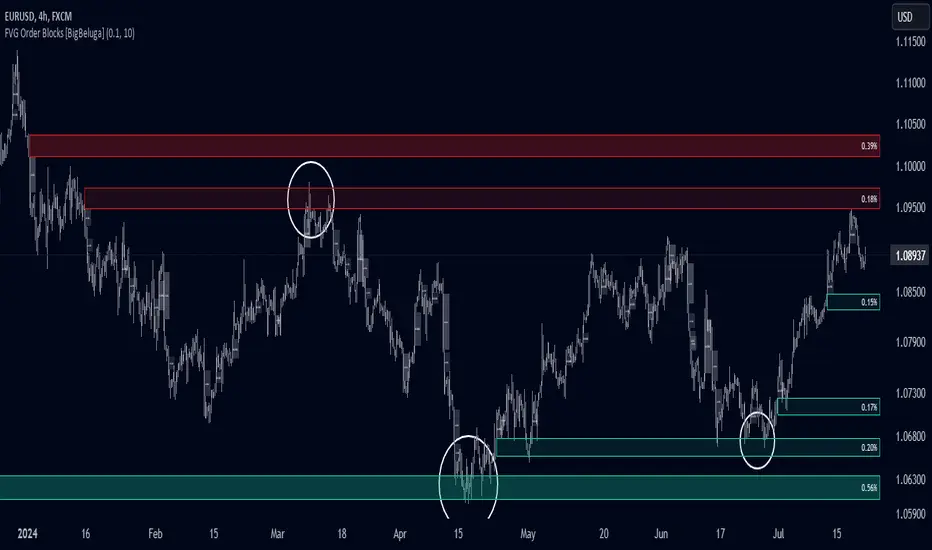
FVG Order Blocks [BigBeluga]This indicator is an advanced tool designed to detect and visualize market FVGs with order blocks, where the price action has created gaps due to strong buying or selling pressure. These FVG often act as critical support and resistance levels, giving traders strategic points for potential entries and exits. The indicator not only identifies these imbalances but also displays their relative strength by size %, helping traders prioritize order blocks that are more likely to hold or break.
The indicator works on various pairs and stocks, it also works on charts that do not provide volume data
Forex (JPY/USD):
Stocks (NVDA):
🔵 KEY FEATURES & USAGE
● FVGs Detection and Visualization:
The indicator detects bullish and bearish FVGs. Bullish FVG occur when there is significant buying, and order block is plotted below the FVG zone:
Conversely, bearish FVG are plotted with an order block above the zone, indicating potential resistance.
Traders can use these order blocks to anticipate price reactions when the market revisits these areas, making them ideal for setting up trades.
● FVG Filtering:
The indicator includes a FVG % filter that allows traders to only display strong order blocks. This ensures that only significant FVG order blocks are shown, reducing noise and focusing on the most impactful areas.
● Highlighting Broken Levels:
When an imbalance level is broken—either breached by price action or no longer relevant—the indicator can either delete the level or mark it with a gray color areas. This provides a clear visual cue that the level has been compromised, allowing traders to adjust their strategies accordingly.
● Order Blocks Signals:
When price retest the blocks, indicator display potential sell or buy signals. Which can be an opportunity for trades
🔵 CUSTOMIZATION
● FVG Filter:
Adjust the strength filter to control which FVGs are displayed based on their percentage size. This filter helps in focusing only on significant blocks that are likely to impact price action.
● Order Blocks Amount Displayed:
Set the maximum number of Order Blocks to be displayed on the chart. This customization helps keep the chart clean and ensures that only the most important blocks are in view.
● Broken Order Blocks Display:
Choose whether to display order blocks that have been broken by the price. This feature helps in maintaining a focus on blocks that are still valid while filtering out those that are no longer relevant.
● Color Customization:
You can customize the colors for bullish and bearish Order Blocks to match your chart's overall color scheme. Additionally, strength bars can be color-coded based on their percentage to quickly identify high-priority order blocks.
Traders who are confident in the settings of the indicator can confidently use it on various types of markets
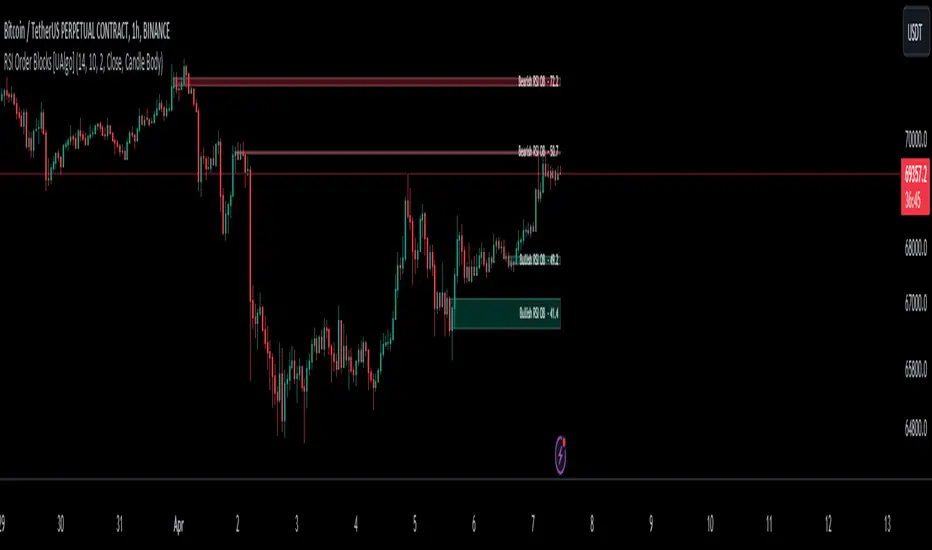
RSI Order Blocks [UAlgo]The "RSI Order Blocks " identifies and visualizes potential order blocks based on the Relative Strength Index (RSI) indicator. These zones may indicating potential support or resistance levels.
🔶 Key Features :
RSI-based Order Block Identification: The script utilizes the RSI indicator to identify potential order blocks. It detects pivot highs and lows in the RSI, which are indicative of potential reversal points, and marks these areas as potential order blocks.
Order Block Visualization: Identified order blocks are visually represented on the chart, making it easy for traders to recognize and interpret these significant price zones. Both bullish and bearish order blocks are differentiated by color, enhancing clarity and ease of analysis. Additionally, within each order block, the RSI value of that block is also shown.
RSI Overbought/Oversold Filter: Optionally, users can apply a filter based on RSI levels to refine the detection of order blocks. This filter prevents the creation of order blocks when the RSI is within specified overbought or oversold conditions (default between 30 and 70), helping traders focus on areas of potentially significant price action.
An Example with the OB/OS Filter Feature Turned Off:
An Example with the OB/OS Filter Feature Turned On:
Mitigation of Broken Order Blocks: Provides flexibility in selecting the mitigation method (based on close or wick) for determining order block breaches.
Customizable Parameters: The script offers a range of customizable parameters to tailor the detection and visualization of order blocks to suit individual trading preferences. Users can adjust parameters such as RSI Length, Order Block Detection Sensitivity, Mitigation Method, and order block style to fine-tune the analysis according to their trading strategy.
🔶 Disclaimer :
Not Financial Advice: This indicator is intended for educational and informational purposes only. It does not constitute financial advice or recommendations to buy, sell, or hold any financial instruments.
Use at Own Risk: Trading involves substantial risk of loss and is not suitable for all investors. Users of this indicator should exercise caution and conduct their own research and analysis before making any trading decisions.
Performance Not Guaranteed: Past performance is not indicative of future results. While the indicator aims to assist traders in analyzing market trends, there is no guarantee of accuracy or success in trading operations.
Volume Profile Bar-Magnified Order Blocks [MyTradingCoder]Introducing "Volume Profile Bar-Magnified Order Blocks", an innovative and unique trading indicator designed to provide traders with a comprehensive understanding of market dynamics. This tool takes the concept of identifying order blocks on your chart and elevates it by integrating a detailed volume profile within each order block zone.
Unlike standard order block indicators, Volume Profile Bar-Magnified Order Blocks pulls data from lower timeframe bars and assigns it to various segments of the order block. By providing this volume profile inside the order block, the indicator supplies a deeper, multi-dimensional view of market activity that can enhance your trading decisions.
Crucially, users have the ability to fine-tune the detection of order blocks. This is made possible through a single input setting called "Tuning". This integer value allows you to control the significance and frequency of the order blocks. Higher numbers will produce more significant order blocks, though they will appear less frequently. Lower numbers, on the other hand, will yield less significant order blocks, but they will occur more often. This enables you to adjust the sensitivity of the indicator according to your specific trading strategy and style.
Key Settings:
Number of Segments: Customize the level of detail in your volume profile by selecting the number of segments you want inside each order block.
Tuning: Adjust the sensitivity of order block detection to align with your trading strategy. Higher values produce more significant but less frequent order blocks, while lower values yield less significant but more frequent order blocks.
Color Inputs: Personalize the look of your chart by selecting the colors for various elements of the indicator. This ensures a seamless integration with your current chart aesthetics and improves visual clarity.
Here is a s creenshot that beautifully demonstrates the power of this indicator. You'll see how the price rejects perfectly off the highest volume segment in an order block, showcasing the indicator's potential for pinpointing high-impact price levels.
While Volume Profile Bar-Magnified Order Blocks offers many unique features, it should be used in conjunction with other indicators and forms of analysis for a complete trading strategy. As with all tools, it does not guarantee profitable trades but is intended to give traders more information to base their decisions on. Use it to complement your existing analysis and enhance your understanding of market behavior.
Experience a new level of clarity in your trading with Volume Profile Bar-Magnified Order Blocks - an indicator that goes beyond the surface to help you navigate the markets more effectively.

Simple ICT Order Blocks and Fair Value Gaps by Gowtham KannakajeThis scripts identifies ICT Order Block and ICT Fair Value Gaps
Fair Value Gap:
- Fair Value Gap toggle is off by default
- Users can choose to color the bars having Fair Value Gaps or can select to define the Fair Value Gap using boxes.
- Bar color and box colors can be customized
Order Blocks:
- Order Block box and candle color toggle is on by default
- Users can choose to color the Order Block candles or can select to define the Order Blocks using boxes.
- Bar color and box colors can be customized for bullish and bearish Order Block separately
Note:
- Order Blocks are considered valid only if the candle forming the Fair Value Gap closes away from the Order Block.
- Since Trading View limits the number of boxes to 500, it is advised to use the Color Candle option to identify the Order Blocks or Fair Value Gaps which are very old.
New concept Definitions:
Naked OB : An order block whose immediate next candle forms a Fair Value Gap. Here, the Order Block high or low contributes to the formation of Fair Value Gap.
Covered OB : An order block whose immediate next candle doesn't form a Fair Value Gap. Here, the Order Block high or low doesn't contribute to the formation of Fair Value Gap. Instead it will have other candles in between the Order Block and Fair Value Gap.
Disclaimer: The usage of this indicator might or might not contribute to your profits and losses and the author is not responsible for the same.
Happy Trading.

Volume Order Block Scanner [BOSWaves]Volume Order Block Scanner - Dynamic Detection of High-Volume Supply and Demand Zones
Overview
The Volume Order Block Scanner introduces a refined approach to institutional zone mapping, combining volume-weighted order flow, structural displacement, and ATR-based proportionality to identify regions of aggressive participation from large entities.
Unlike static zone mapping or simplistic body-size filters, this framework dynamically evaluates each candle through a multi-layer model of relative volume, candle structure, and volatility context to isolate genuine order block formations while filtering out market noise.
Each identified zone represents a potential institutional footprint, defined by significant volume surges and efficient body-to-ATR relationships that indicate purposeful positioning. Once mapped, each order block is dynamically adjusted for volatility and tracked throughout its lifecycle - from creation to mitigation to potential invalidation - producing an evolving liquidity map that adapts with price.
This adaptive behavior allows traders to visualize where liquidity was absorbed and where it remains unfilled, revealing the structural foundation of institutional intent across timeframes.
Theoretical Foundation
At its core, the Volume Order Block Scanner is built on the interaction between volume displacement and structural imbalance. Traditional order block systems often rely on fixed candle formations or simple engulfing logic, neglecting the fundamental driver of institutional activity: volume concentration relative to volatility.
This framework redefines that approach. Each candle is filtered through two comparative ratios:
Relative Volume Ratio (RVR) - the candle’s volume compared to its rolling average, confirming genuine transactional surges.
Body-ATR Ratio (BAR) - a measure of displacement efficiency relative to recent volatility, ensuring structural strength.
Only when both conditions align is an order block validated, marking a displacement event significant enough to create a lasting imbalance.
By embedding this logic within a volatility-adjusted environment, the system maintains scalability across asset classes and volatility regimes - equally effective in crypto, forex, or index markets.
How It Works
The Volume Order Block Scanner operates through a structured multi-stage process:
Displacement Detection - Identifies candles whose body and volume exceed dynamic thresholds derived from ATR and rolling volume averages. These represent the origin points of institutional aggression.
Zone Construction - Each qualified candle generates an order block with ATR-proportional dimensions to ensure consistency across instruments and timeframes. The zone includes two regions: Body Zone (the precise initiation point of displacement) and Wick Imbalance (the residual inefficiency representing unfilled liquidity).
Lifecycle Tracking - Each zone is continuously monitored for market interaction. Reactions within a defined window are classified as respected, mitigated, or invalidated, giving traders a data-driven sense of ongoing institutional relevance.
Volume Confirmation Layer - Reinforces signal integrity by ensuring that all detected blocks correspond with meaningful increases in transactional activity.
Temporal Decay Control - Zones that remain untested beyond a set period gradually lose visual and analytical weight, maintaining chart clarity and contextual precision.
Interpretation
The Volume Order Block Scanner visualizes how institutional participants interact with the market through zones of accumulation and distribution.
Bullish order blocks denote demand imbalances where price displaced upward under high volume; bearish order blocks signify supply regions formed by concentrated selling pressure.
Price revisiting these areas often reflects institutional re-entry or liquidity rebalancing, offering actionable insights for both continuation and reversal scenarios.
By continuously monitoring interaction and expiry, the framework enables traders to distinguish between active institutional footprints and historical liquidity artifacts.
Strategy Integration
The Volume Order Block Scanner integrates naturally into advanced structural and order-flow methodologies:
Liquidity Mapping : Identify high-volume regions that are likely to influence future price reactions.
Break-of-Structure Confirmation : Validate BOS and CHOCH signals through aligned order block behavior.
Volume Confluence : Combine with BOSWaves volume or momentum indicators to confirm real institutional intent.
Smart-Money Frameworks : Utilize order block retests as precision entry zones within SMC-based setups.
Trend Continuation : Filter zones in line with higher-timeframe bias to maintain directional integrity.
Technical Implementation Details
Core Engine : Dual-filter mechanism using Relative Volume Ratio (RVR) and Body-ATR Ratio (BAR).
Volatility Framework : ATR-based scaling for cross-asset proportionality.
Zone Composition : Body and wick regions plotted independently for visual clarity of imbalance.
Lifecycle Logic : Real-time monitoring of reaction, mitigation, and invalidation states.
Directional Coloring : Distinct bullish and bearish shading with adjustable transparency.
Computation Efficiency : Lightweight structure suitable for multi-timeframe or multi-asset environments.
Optimal Application Parameters
Timeframe Guidance:
5m - 15m : Reactive intraday zones for short-term liquidity engagement.
1H - 4H : Medium-term structures for swing or intraday trend mapping.
Daily - Weekly : Macro accumulation and distribution footprints.
Suggested Configuration:
Relative Volume Threshold : 1.5× - 2.0× average volume.
Body-ATR Threshold : 0.8× - 1.2× for valid displacement.
Zone Expiry : 5 - 10 bars for intraday use, 15 - 30 for swing/macro contexts.
Parameter optimization should be asset-specific, tuned to volatility conditions and liquidity depth.
Performance Characteristics
High Effectiveness:
Markets exhibiting clear displacement and directional flow.
Environments with consistent volume expansion and liquidity inefficiencies.
Reduced Effectiveness:
Range-bound markets with frequent false impulses.
Low-volume sessions lacking institutional participation.
Integration Guidelines
Confluence Framework : Pair with structure-based BOS or liquidity tools for validation.
Risk Management : Treat active order blocks as contextual areas of interest, not guaranteed reversal points.
Multi-Timeframe Logic : Derive bias from higher-timeframe blocks and execute from refined lower-timeframe structures.
Volume Verification : Confirm each reaction with concurrent volume acceleration to avoid false liquidity cues.
Disclaimer
The Volume Order Block Scanner is a quantitative mapping framework designed for professional traders and analysts. It is not a predictive or guaranteed system of profit.
Performance depends on correct configuration, market conditions, and disciplined risk management. BOSWaves recommends using this indicator as part of a comprehensive analytical process - integrating structural, volume, and liquidity context for accurate interpretation.

High Probability Order Blocks [AlgoAlpha]🟠 OVERVIEW
This script detects and visualizes high-probability order blocks by combining a volatility-based z-score trigger with a statistical survival model inspired by Kaplan-Meier estimation. It builds and manages bullish and bearish order blocks dynamically on the chart, displays live survival probabilities per block, and plots optional rejection signals. What makes this tool unique is its use of historical mitigation behavior to estimate and plot how likely each zone is to persist, offering traders a probabilistic perspective on order block strength—something rarely seen in retail indicators.
🟠 CONCEPTS
Order blocks are regions of strong institutional interest, often marked by large imbalances between buying and selling. This script identifies those areas using z-score thresholds on directional distance (up or down candles), detecting statistically significant moves that signal potential smart money footprints. A bullish block is drawn when a strong up-move (zUp > 4) follows a down candle, and vice versa for bearish blocks. Over time, each block is evaluated: if price “mitigates” it (i.e., closes cleanly past the opposite side and confirmed with a 1 bar delay), it’s considered resolved and logged. These resolved blocks then inform a Kaplan-Meier-like survival curve, estimating the likelihood that future blocks of a given age will remain unbroken. The indicator then draws a probability curve for each side (bull/bear), updating it in real time.
🟠 FEATURES
Live label inside each block showing survival probability or “N.E.D.” if insufficient data.
Kaplan-Meier survival curves drawn directly on the chart to show estimated strength decay.
Rejection markers (▲ ▼) if price bounces cleanly off an active order block.
Alerts for zone creation and rejection signals, supporting rule-based trading workflows.
🟠 USAGE
Read the label inside each block for Age | Survival% (or N.E.D. if there aren’t enough samples yet); higher survival % suggests blocks of that age have historically lasted longer.
Use the right-side survival curves to gauge how probability decays with age for bull vs bear blocks, and align entries with the side showing stronger survival at current age.
Treat ▲ (bullish rejection) and ▼ (bearish rejection) as optional confluence when price tests a boundary and fails to break.
Turn on alerts for “Bullish Zone Created,” “Bearish Zone Created,” and rejection signals so you don’t need to watch constantly.
If your chart gets crowded, enable Prevent Overlap ; tune Max Box Age to your timeframe; and adjust KM Training Window / Minimum Samples to trade off responsiveness vs stability.

Multitimeframe Order Block Finder (Zeiierman)█ Overview
The Multitimeframe Order Block Finder (Zeiierman) is a powerful tool designed to identify potential institutional zones of interest — Order Blocks — across any timeframe, regardless of what chart you're viewing.
Order Blocks are critical supply and demand zones formed by the last opposing candle before an impulsive move. These areas often act as magnets for price and serve as smart-money footprints — ideal for anticipating reversals, retests, or breakouts.
This indicator not only detects such zones in real-time, but also visualizes their mitigation, bull/bear volume pressure, and a smoothed directional trendline based on Order Block behavior.
█ How It Works
The script fetches OHLCV data from your chosen timeframe using request.security() and processes it using strict pattern logic and volume-derived strength conditions. It detects Order Blocks only when the structure aligns with dominant pressure and visually extends valid zones forward for as long as they remain unmitigated.
⚪ Bull/Bear Volume Power Visualization
Each OB includes proportional bars representing estimated buy/sell effort:
Buy Power: % of volume attributed to buyers
Sell Power: % of volume attributed to sellers
This adds a visual, intuitive layer of intent — showing who controlled the price before the OB formed.
⚪ Order Block Trendline (Butterworth Filtered)
A smoothed trendline is derived from the average OB value over time using a two-pole Butterworth low-pass filter. This helps you understand the broader directional pressure:
Trendline up → favor bullish OBs
Trendline down → favor bearish OBs
█ How to Use
⚪ Trade From Order Blocks Like Institutions
Use this tool to find institutional footprints and reaction zones:
Enter at unmitigated OBs
⚪ Volume Power
Volume Pressure Bars inside each OB help you:
Confirm strong buyer/seller dominance
Detect possible traps or exhaustion
Understand how each zone formed
⚪ Find Trend & Pullbacks
The trendline not only helps traders detect the current trend direction, but the built-in trend coloring also highlights potential pullback areas within these trends.
█ Settings
Timeframe – Selects which timeframe to scan for Order Blocks.
Lookback Period – Defines how many bars back are used to detect bullish or bearish momentum shifts.
Sensitivity – When enabled, the indicator uses smoothed price (RMA) with rising/falling logic instead of raw candle closes. This allows more flexible detection of trend shifts and results in more Order Blocks being identified.
Minimum Percent Move – Filters out weak moves. Higher = only strong price shifts.
Mitigated on Mid – OB is removed when price touches its midpoint.
Show OB Table – Displays a panel listing all active (unmitigated) Order Blocks.
Extend Boxes – Controls how far OB boxes stretch into the future.
Show OB Trend – Toggles the trendline derived from Order Block strength.
Passband Ripple (dB) – Controls trendline reactivity. Higher = more sensitive.
Cutoff Frequency – Controls smoothness of trendline (0–0.5). Lower = smoother.
-----------------
Disclaimer
The content provided in my scripts, indicators, ideas, algorithms, and systems is for educational and informational purposes only. It does not constitute financial advice, investment recommendations, or a solicitation to buy or sell any financial instruments. I will not accept liability for any loss or damage, including without limitation any loss of profit, which may arise directly or indirectly from the use of or reliance on such information.
All investments involve risk, and the past performance of a security, industry, sector, market, financial product, trading strategy, backtest, or individual's trading does not guarantee future results or returns. Investors are fully responsible for any investment decisions they make. Such decisions should be based solely on an evaluation of their financial circumstances, investment objectives, risk tolerance, and liquidity needs.

Volume Block Order AnalyzerCore Concept
The Volume Block Order Analyzer is a sophisticated Pine Script strategy designed to detect and analyze institutional money flow through large block trades. It identifies unusually high volume candles and evaluates their directional bias to provide clear visual signals of potential market movements.
How It Works: The Mathematical Model
1. Volume Anomaly Detection
The strategy first identifies "block trades" using a statistical approach:
```
avgVolume = ta.sma(volume, lookbackPeriod)
isHighVolume = volume > avgVolume * volumeThreshold
```
This means a candle must have volume exceeding the recent average by a user-defined multiplier (default 2.0x) to be considered a significant block trade.
2. Directional Impact Calculation
For each block trade identified, its price action determines direction:
- Bullish candle (close > open): Positive impact
- Bearish candle (close < open): Negative impact
The magnitude of impact is proportional to the volume size:
```
volumeWeight = volume / avgVolume // How many times larger than average
blockImpact = (isBullish ? 1.0 : -1.0) * (volumeWeight / 10)
```
This creates a normalized impact score typically ranging from -1.0 to 1.0, scaled by dividing by 10 to prevent excessive values.
3. Cumulative Impact with Time Decay
The key innovation is the cumulative impact calculation with decay:
```
cumulativeImpact := cumulativeImpact * impactDecay + blockImpact
```
This mathematical model has important properties:
- Recent block trades have stronger influence than older ones
- Impact gradually "fades" at rate determined by decay factor (default 0.95)
- Sustained directional pressure accumulates over time
- Opposing pressure gradually counteracts previous momentum
Trading Logic
Signal Generation
The strategy generates trading signals based on momentum shifts in institutional order flow:
1. Long Entry Signal: When cumulative impact crosses from negative to positive
```
if ta.crossover(cumulativeImpact, 0)
strategy.entry("Long", strategy.long)
```
*Logic: Institutional buying pressure has overcome selling pressure, indicating potential upward movement*
2. Short Entry Signal: When cumulative impact crosses from positive to negative
```
if ta.crossunder(cumulativeImpact, 0)
strategy.entry("Short", strategy.short)
```
*Logic: Institutional selling pressure has overcome buying pressure, indicating potential downward movement*
3. Exit Logic: Positions are closed when the cumulative impact moves against the position
```
if cumulativeImpact < 0
strategy.close("Long")
```
*Logic: The original signal is no longer valid as institutional flow has reversed*
Visual Interpretation System
The strategy employs multiple visualization techniques:
1. Color Gradient Bar System:
- Deep green: Strong buying pressure (impact > 0.5)
- Light green: Moderate buying pressure (0.1 < impact ≤ 0.5)
- Yellow-green: Mild buying pressure (0 < impact ≤ 0.1)
- Yellow: Neutral (impact = 0)
- Yellow-orange: Mild selling pressure (-0.1 < impact ≤ 0)
- Orange: Moderate selling pressure (-0.5 < impact ≤ -0.1)
- Red: Strong selling pressure (impact ≤ -0.5)
2. Dynamic Impact Line:
- Plots the cumulative impact as a line
- Line color shifts with impact value
- Line movement shows momentum and trend strength
3. Block Trade Labels:
- Marks significant block trades directly on the chart
- Shows direction and volume amount
- Helps identify key moments of institutional activity
4. Information Dashboard:
- Current impact value and signal direction
- Average volume benchmark
- Count of significant block trades
- Min/Max impact range
Benefits and Use Cases
This strategy provides several advantages:
1. Institutional Flow Detection: Identifies where large players are positioning themselves
2. Early Trend Identification: Often detects institutional accumulation/distribution before major price movements
3. Market Context Enhancement: Provides deeper insight than simple price action alone
4. Objective Decision Framework: Quantifies what might otherwise be subjective observations
5. Adaptive to Market Conditions: Works across different timeframes and instruments by using relative volume rather than absolute thresholds
Customization Options
The strategy allows users to fine-tune its behavior:
- Volume Threshold: How unusual a volume spike must be to qualify
- Lookback Period: How far back to measure average volume
- Impact Decay Factor: How quickly older trades lose influence
- Visual Settings: Labels and line width customization
This sophisticated yet intuitive strategy provides traders with a window into institutional activity, helping identify potential trend changes before they become obvious in price action alone.

Predictive Order Blocks [CryptoSea]The Predictive Order Blocks Indicator is a unique and innovative tool that enhances market analysis by identifying support and resistance blocks based on standard deviations from a median line. Unlike traditional indicators that rely solely on the close price, this indicator leverages the median line and standard deviations to form areas of interest, rather than targeting a single price point. This approach provides a more accurate representation of market structure, especially during periods of consolidation and expansion.
Key Features
Multi-Term Length Analysis: The indicator offers short, medium, and long-term settings, allowing traders to customise the analysis based on their preferred trading strategy and timeframe. This flexibility ensures that the tool is adaptable to various market conditions and trading styles.
Standard Deviation-Based Order Blocks: The core functionality of the indicator revolves around calculating standard deviations from a median line to form support and resistance blocks. These blocks provide a clearer and more reliable picture of market structure compared to single-point levels. By focusing on areas rather than exact price levels, the indicator helps traders identify zones where price is likely to react, leading to more informed trading decisions.
Dynamic Box Creation: The indicator dynamically creates breakout boxes based on user-selected standard deviation ranges. These boxes are formed at the start of market expansion following periods of consolidation. This feature is particularly useful because it highlights key levels where price is likely to retrace after breaking out, providing traders with actionable insights during market transitions.
Proximity-Based Gradient Colors: The indicator features gradient colors that change based on the price's proximity to the standard deviation bands. This visual aid helps traders quickly assess the current market condition and the potential significance of the support and resistance blocks.
Adaptive Display Options: To accommodate different trading preferences, the indicator includes options to toggle the display of the trend line (median line) and the standard deviation bands. This flexibility allows traders to customise their chart view to match their analysis style, whether they prefer a more clutter-free view or a detailed breakdown of market levels.
In the example below, the indicator shows the bands compressing during a period of consolidation, highlighting the potential for a breakout.
How it Works
Median Line Calculation: The indicator calculates the median line using a user-defined period. This line serves as the central reference point from which the standard deviations are calculated. By using the median line instead of just the close price, the indicator provides a more stable and reliable baseline for identifying support and resistance areas.
Standard Deviation Bands: Around the median line, the indicator calculates multiple standard deviation bands. These bands represent areas where price is statistically likely to find support or resistance. By focusing on these areas, traders can better anticipate where price might react, rather than relying on arbitrary levels.
Dynamic Box Creation and Expansion Detection: The indicator monitors the compression and expansion of the standard deviation bands. During periods of low volatility (squeeze), the bands compress, indicating consolidation. Once the bands start expanding, it signals the potential for a breakout. At this point, the indicator dynamically creates predictive order blocks based on the selected standard deviation range. These blocks highlight key levels where price might retrace or react, providing traders with valuable entry and exit points.
Color-Coded Proximity Alerts: To further enhance usability, the indicator uses color gradients to indicate how close the current price is to the calculated bands. This visual representation helps traders quickly assess the potential significance of the price's current position relative to the support and resistance areas.
In the example below, the indicator shows the bands expanding with the price, triggering the formation of the predictive order block.
In the final example, the price retraces into the order block before bouncing back to the upside, demonstrating the effectiveness of the identified support area.
Alerts
Trend Line Alerts: The indicator provides alerts when the price crosses above or below the trend line (median line). This feature is crucial for traders looking to identify potential trend changes early, allowing them to act quickly on emerging opportunities.
Band Alerts: Alerts are also triggered when the price crosses above or below the upper or lower bands for each standard deviation level. This helps traders identify potential breakout or breakdown scenarios, ensuring they are notified of significant market movements as they happen.
Customisable Alert Conditions: To cater to different trading strategies, the indicator allows users to set alert conditions for each standard deviation band and the trend line. This level of customisation ensures that traders receive alerts that are relevant to their specific trading style and market analysis.
Application
Strategic Decision-Making: The Predictive Order Blocks Indicator assists traders in making informed decisions by providing detailed analysis of potential breakout zones. By identifying key support and resistance areas, the indicator helps traders plan their entries and exits with greater precision.
Trend Confirmation: The indicator reinforces trading strategies by identifying key levels where price is likely to react. This confirmation is crucial for traders looking to enter trades with higher confidence.
Customized Analysis: The indicator adapts to various trading styles with extensive input settings that control the display and calculation of order blocks. Whether you're a day trader, swing trader, or long-term investor, the indicator can be tailored to meet your specific needs.
Visual Clarity: With customizable color settings and display options, the indicator enhances chart readability, allowing traders to quickly and easily interpret market data.
The Predictive Order Blocks Indicator by CryptoSea is an invaluable addition to a trader's toolkit, offering depth and precision in market trend analysis to navigate complex market conditions effectively.

ICT Single Candle Order Block (SCOB) [UAlgo]The "ICT Single Candle Order Block (SCOB) " designed for traders who utilize the concept of Order Blocks in their trading strategy. Order Blocks are significant price levels where institutions or smart money have placed their trades, leading to potential future price reactions when these levels are revisited. This indicator focuses on identifying and highlighting Single Candle Order Blocks (SCOBs), allowing traders to visually analyze key price levels on their charts.
🔶 What is Single Candle Order Block (SCOB) ?
A Single Candle Order Block (SCOB) is a specific type of Order Block that is identified based on a single candlestick pattern. These patterns indicate potential areas where significant buying or selling interest has occurred, often leading to a notable price reaction when revisited. In the context of this indicator, a bullish SCOB is identified when a specific bullish candlestick pattern is met, and a bearish SCOB is identified based on a bearish candlestick pattern.
Bullish SCOB: Detected when the open price of two bars ago is higher than its close, the close price of the previous bar is higher than its open, the current close price is higher than the open, the low of the previous bar is lower than the low of two bars ago, and the current close is higher than the high of the previous bar.
Bearish SCOB: Detected when the open price of two bars ago is lower than its close, the close price of the previous bar is lower than its open, the current close price is lower than the open, the high of the previous bar is higher than the high of two bars ago, and the current close is lower than the low of the previous bar.
🔶 Key Features
Show Single Candle Order Block (SCOB): Toggle the visibility of the Single Candle Order Blocks on the chart.
Mitigation Method: Choose between "Close" and "Wick" methods for determining whether a SCOB has been mitigated (price has interacted with the block).
Show Last X SCOBs: Control the number of most recent SCOBs displayed on the chart, allowing you to focus on the most relevant price levels.
Volatility Filter: Enable or disable the volatility filter, which uses the Average True Range (ATR) to filter out less significant SCOBs. When enabled, only SCOBs with an ATR above the mean value of the ATR are displayed.
Customizable Colors: Configure the colors for bullish and bearish SCOBs to enhance visual clarity. The indicator uses cooler RGB values to ensure the blocks are distinct and easily noticeable.
🔶 Disclaimer
The "ICT Single Candle Order Block (SCOB) " indicator is provided for educational and informational purposes only. Trading involves significant risk and may not be suitable for all investors.
Past performance is not indicative of future results. Users should use this indicator in conjunction with their own research and trading strategy.

MTF Order Block FinderAn Order Block is a special type of pivot point that satisfies the following requirement:
A Bull/Bear candle followed by X consecutive candles in the opposite direction.
Order Blocks are interesting areas that are frequently revisited and can be treated as Support/Resistance levels.
Often, you can see explosive price rejection of these areas via long wicks, high volume, and rapid price change.
Features
Choose from two themes:
- LIGHT: a classic Red and Green representing Bearish and Bullish OBs, respectively
- DARK: a clean Blue and White scheme
Choose from two drawing styles:
- LINE: three lines representing the High, Low, and Mid price levels of the OB candle
- BOX: a bounded area similar to the "rectangle" tool
Chose a custom timeframe:
- From 1 Minute (useful for Seconds interval) up to 1 Month
Note, this setting is experimental and choosing a timeframe that is extraordinarily large may not function properly.
Filter order blocks with two settings:
- Number of consecutive bars
- Minimum % change of the potential OB bar (default 0.25%)
Keep your charts clean and show only relevant OBs
- Maximum number of Bullish zones to show
- Maximum number of Bearish zones to show
FAQ
Q: How do I trade with this indicator?
A:Personally, I use a fast entry indicator to confirm Long/Short position when price is rejected. I set my SL and TP based on the current Zone and the next one, if available.
Q: Does this repaint?
A:Yes and this is okay! The "Bear" and "Bull" signals are not meant for taking positions, only showing which candle reveals the Order Block. The Zone is much more useful to us and can result in several successful trades in the near future when treated as a support/resistance area.
Q What's the winrate?
A:Hard to say - this isn't a standalone strategy and I haven't been able to properly backtest it quite yet.

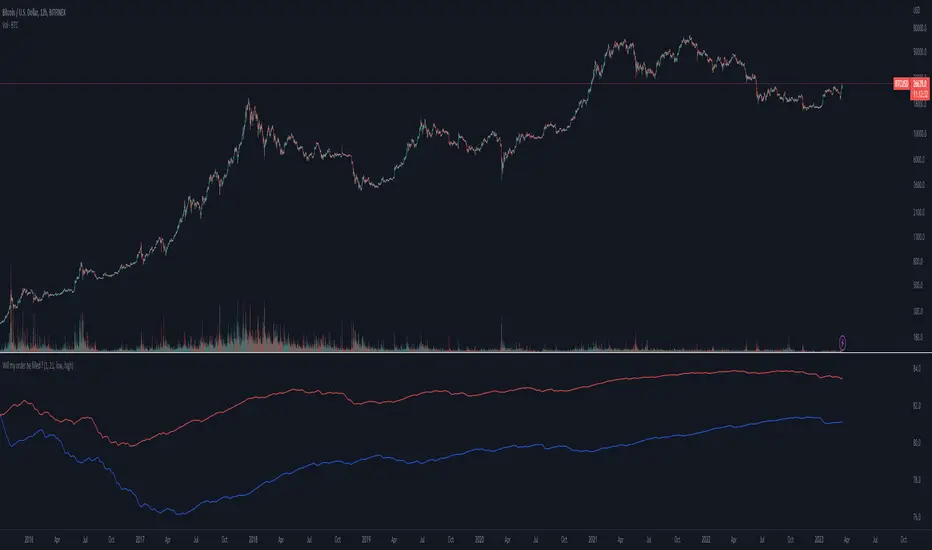
Will my limit order be filled ?Hi
This is a small script that tries to assess the probability that a limit order sent at x % from the last close will be filled in the next y bars.
It is based on historical data and can be useful to decide where to place your limit orders and to determine how far from the price you can put the limit order to get an X% chance of getting filled.
It displays this result for both long and short entries and you can specify if you want to fill orders with wicks or not.
Auto Order Block by D. BrigagliaThis indicator finds trend following engulfings, and draws order blocks based on the 1st candle's range (the first candle of the engulfing pattern).
It does filter the trend with simple moving averages of 21 and 55 periods, but it doesn't filter for retracements in the trend (you should consider only the order blocks that are coming from engulfings after a retracement)

Smart Structure Breaks & Order BlocksOverview (What it does)
The indicator “Smart Structure Breaks & Order Blocks” detects market structure using swing highs and lows, identifies Break of Structure (BOS) events, and automatically draws order blocks (OBs) from the origin candle. These zones extend to the right and change color/outline when mitigated or invalidated. By formalizing and automating part of discretionary analysis, it provides consistent zone recognition.
Main Components
Swing Detection: ta.pivothigh/ta.pivotlow identify confirmed swing points.
BOS Detection: Determines if the recent swing high/low is broken by close (strict mode) or crossover.
OB Creation: After a BOS, the opposite candle (bearish for bullish BOS, bullish for bearish BOS) is used to generate an order block zone.
Zone Management: Limits the number of zones, extends them to the right, and tracks tagged (mitigated) or invalidated states.
Input Parameters
Left/Right Pivot (default 6/6): Number of bars required on each side to confirm a swing. Higher values = smoother swings.
Max Zones (default 4): Maximum zones stored per direction (bull/bear). Oldest zones are overwritten.
Zone Confirmation Lookback (default 3): Ensures OB origin candle validity by checking recent highs/lows.
Show Swing Points (default ON): Displays triangles on swing highs/lows.
Require close for BOS? (default ON): Strict BOS (close required) vs loose BOS (line crossover).
Use candle body for zones (default OFF): Zones drawn from candle body (ON) or wick (OFF).
Signal Definition & Logic
Swing Updates: Latest confirmed pivots update lastHighLevel / lastLowLevel.
BOS (Break of Structure):
Bullish – close breaks last swing high.
Bearish – close breaks last swing low.
Only one valid BOS per swing (avoids duplicates).
OB Detection:
Bullish BOS → previous bearish candle with lowest low forms the OB.
Bearish BOS → previous bullish candle with highest high forms the OB.
Zones: Bull = green, Bear = red, semi-transparent, extended to the right.
Zone States:
Mitigated: Price touches the zone → border highlighted.
Invalidated:
Bull zone → close below → turns red.
Bear zone → close above → turns green.
Chart Appearance
Swing High: red triangle above bar
Swing Low: green triangle below bar
Bull OB: green zone (border highlighted on touch)
Bear OB: red zone (border highlighted on touch)
Invalid Zones: Bull zones turn reddish, Bear zones turn greenish
Practical Use (Trading Assistance)
Trend Following Entries: Buy pullbacks into green OBs in uptrends, sell rallies into red OBs in downtrends.
Focus on First Touch: First mitigation after BOS often has higher reaction probability.
Confluence: Combine with higher timeframe trend, volume, session levels, key price levels (previous highs/lows, VWAP, etc.).
Stops/Targets:
Bull – stop below zone, partial take profit at swing high or resistance.
Bear – stop above zone, partial take profit at swing low or support.
Parameter Tuning (per market/timeframe)
Pivot (6/6 → 4/4/8/8): Lower for scalping (3–5), medium for day trading (5–8), higher for swing trading (8–14). Increase to reduce noise.
Strict Break: ON to reduce false breaks in ranging markets; OFF for earlier signals.
Body Zones: ON for assets with long wicks, OFF for cleaner OBs in liquid instruments.
Zone Confirmation (default 3): Increase for stricter OB origin, fewer zones.
Max Zones (default 4 → 6–10): Increase for higher volatility, decrease to avoid clutter.
Strengths
Standardizes BOS and OB detection that is usually subjective.
Tracks mitigation and invalidation automatically.
Adaptable: allows body/wick zone switching for different instruments.
Limitations
Pivot-based: Signals appear only after pivots confirm (slight lag).
Zones reflect past balance: Can fail after new events (news, earnings, macro data).
Range-heavy markets: More false BOS; consider stricter settings.
Backtesting: This script is for drawing/visual aid; trading rules must be defined separately.
Workflow Example
Identify higher timeframe trend (4H/Daily).
On lower TF (15–60m), wait for BOS and new OB.
Enter on first mitigation with confirmation candle.
Stop beyond zone; targets based on R multiples and swing points.
FAQ
Q: Why are zones invalidated quickly?
A: Flow reversal after BOS. Adjust pivots higher, enable Strict mode, or switch to Body zones to reduce noise.
Q: What does “tagged” mean?
A: Price touched the zone once = mitigated. Implies some orders in that zone may have been filled.
Q: Body or Wick zones?
A: Wick zones are fine in clean markets. For volatile pairs with long wicks, body zones provide more realistic areas.
Customization Tips (Code perspective)
Zone storage: Currently ring buffer ((idx+1) % zoneLimit). Could prioritize keeping unmitigated zones.
Automated testing: Add strategy.entry/exit for rule-based backtests.
Multi-timeframe: Use request.security() for higher timeframe swings/BOS.
Visualization: Add labels for BOS bars, tag zones with IDs, count touches.
Summary
This indicator formalizes the cycle Swing → BOS → OB creation → Mitigation/Invalidation, providing consistent structure analysis and zone tracking. By tuning sensitivity and strictness, and combining with higher timeframe context, it enhances pullback/continuation trading setups. Always combine with proper risk management.

CANX Supply and Demand - Order Block - Candle Identification© CanxStixTrader
CANX Supply and Demand - Order Block - Candle Identification
Description
Designed as a visual aid, to highlight the last up or down candle before a fractal break. We can assume these candles where the point of origin that generated enough strength to break recent structure. By using them as reference points, traders are expected to follow their own set of rules and mark higher probability supply and demand zones in the area.
How to use:
Expect price to retest in these areas, and if they fail, a potential retest in the opposite direction . The greater the number of times a zone is tested, the more likely it is to break. A fresh zone that has not yet been tested will have a higher probability of a bounce.
Fractal period and candle break type can be customized in the settings. This works on all time frames.
**The indicator is set to my optimal settings for the 5 minute or 15 minute time frame** Please mess around to find your comfort zone and back test the results.
The lower the period number the more noise this creates on the market. The higher the number the less noise and more potential for a stronger zone.
Keep it simple