KINSKI Flexible Volume OscillatorThe Volume Oscillator is a trend-oriented indicator that shows the strength or weakness of price trends. This indicator calculates the volume from two moving averages (MA). The value of the slow volume MA is then subtracted from the value of the fast moving average. The Volume Oscillator measures volume by analyzing the relationship between these two moving averages.
The special feature of this indicator is that the type of moving average can be selected as the basis for calculation. Currently, it is possible to choose between the following MA variants:
"COVWMA", "DEMA", "EMA", "EHMA", "FRAMA", "HMA", "KAMA", "RMA", "SMA", "SMMA", "VIDYA", "VWMA", "WMA".
Upward and downward movements are represented in different colors. The following color variants are available:
Color green: Strong upward trend
Color green/dark: weakening upward trend
Color red: strong downward trend
Color red/dark: weakening downward trend
The colors, as well as the style can be adjusted in the settings according to your own needs.
在脚本中搜索"oscillator"

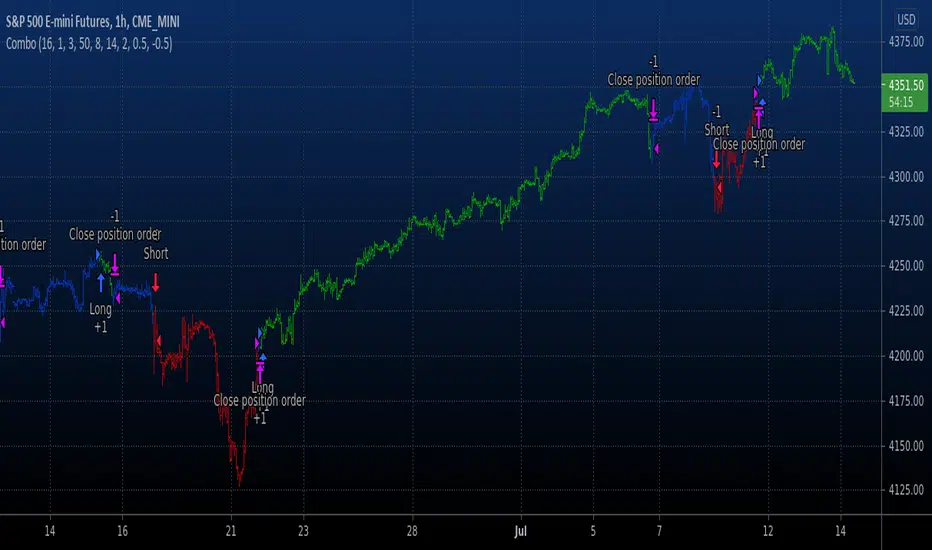
Combo Backtest 123 Reversal & SMI Ergodic Oscillator This is combo strategies for get a cumulative signal.
First strategy
This System was created from the Book "How I Tripled My Money In The
Futures Market" by Ulf Jensen, Page 183. This is reverse type of strategies.
The strategy buys at market, if close price is higher than the previous close
during 2 days and the meaning of 9-days Stochastic Slow Oscillator is lower than 50.
The strategy sells at market, if close price is lower than the previous close price
during 2 days and the meaning of 9-days Stochastic Fast Oscillator is higher than 50.
Second strategy
The SMI Ergodic Indicator is the same as the True Strength Index (TSI) developed by
William Blau, except the SMI includes a signal line. The SMI uses double moving averages
of price minus previous price over 2 time frames. The signal line, which is an EMA of the
SMI, is plotted to help trigger trading signals. Adjustable guides are also given to fine
tune these signals. The user may change the input (close), method (EMA), period lengths
and guide values.
WARNING:
- For purpose educate only
- This script to change bars colors.
Combo Backtest 123 Reversal & Prime Number Oscillator This is combo strategies for get a cumulative signal.
First strategy
This System was created from the Book "How I Tripled My Money In The
Futures Market" by Ulf Jensen, Page 183. This is reverse type of strategies.
The strategy buys at market, if close price is higher than the previous close
during 2 days and the meaning of 9-days Stochastic Slow Oscillator is lower than 50.
The strategy sells at market, if close price is lower than the previous close price
during 2 days and the meaning of 9-days Stochastic Fast Oscillator is higher than 50.
Second strategy
Determining market trends has become a science even though a high number or people
still believe it’s a gambling game. Mathematicians, technicians, brokers and investors
have worked together in developing quite several indicators to help them better understand
and forecast market movements.
Developed by Modulus Financial Engineering Inc., the prime number oscillator indicates the
nearest prime number, be it at the top or the bottom of the series, and outlines the
difference between that prime number and the respective series.
WARNING:
- For purpose educate only
- This script to change bars colors.
Combo Backtest 123 Reversal & Pivot Detector Oscillator Copyright by HPotter v1.0 20/04/2021
This is combo strategies for get a cumulative signal.
First strategy
This System was created from the Book "How I Tripled My Money In The
Futures Market" by Ulf Jensen, Page 183. This is reverse type of strategies.
The strategy buys at market, if close price is higher than the previous close
during 2 days and the meaning of 9-days Stochastic Slow Oscillator is lower than 50.
The strategy sells at market, if close price is lower than the previous close price
during 2 days and the meaning of 9-days Stochastic Fast Oscillator is higher than 50.
Second strategy
The Pivot Detector Oscillator, by Giorgos E. Siligardos
The related article is copyrighted material from Stocks & Commodities 2009 Sep
WARNING:
- For purpose educate only
- This script to change bars colors.
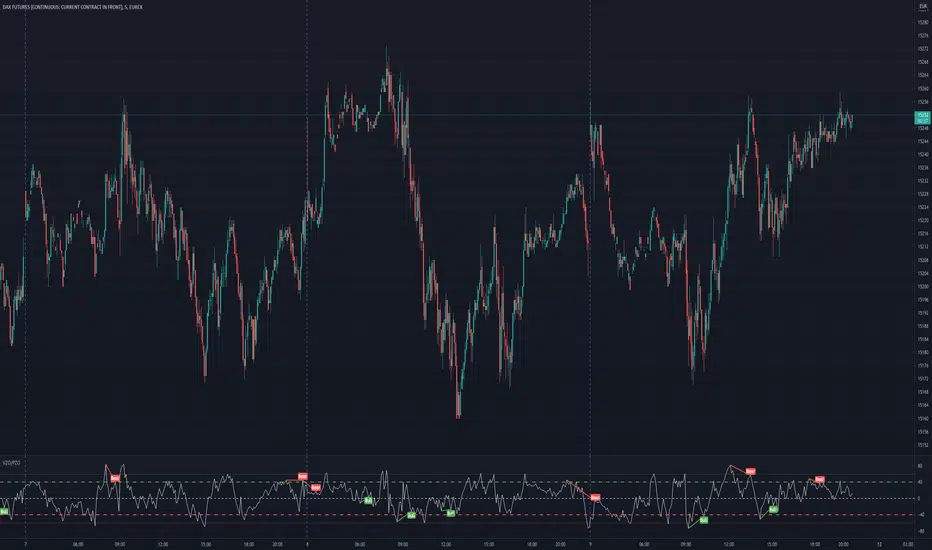
Volume Zone Oscillator and Price Zone Oscillator (VZO/PZO)Credits go to @NeoButane as basis is taken from his open-source code and I modified it - changes described below.
Usage:
Positive -> bullish, negative -> bearish
-60/60 is seen as the limit of the oscillator range, and a pullback should be expected from there
-40/40 are in general Oversold/Overbought levels
Modifications:
added alerts
added Divergences formula
added additional types of smoothing
added signal display based on described above usage (extreme levels of oscillations and bounce back)
Uber Strength OscillatorThis is my Uber Oscillator applied to RSI essentially. So its like an Ultimate Oscillator with more lengths added, but instead of MAs its RSIs. So its a multi-momentum index of sorts. Part of my efforts in realizing the amazing potential of using multiple lengths of an oscillator to get a bigger picture, while also recognizing that simply stacking them on top of eachother is so ugly and hard to read that it can easily result in mistakes if you arent super careful. So this is an attempt to make that clearer.

Uber Oscillator with DivergencesThis is a simple mod of the Uber Oscillator with more periods added to the mix and combined with a the Tradingview Divergence spotter.
Compare it to the standard Ultimate Oscillator and see the difference. Good to even overlay them even.
It basically just adds more detail. You won't always need it but sometimes it can catch big drops/peaks earlier then the standard AO while still retaining relative relaxedness during other periods.

Combo Backtest 123 Reversal & Klinger Volume Oscillator This is combo strategies for get a cumulative signal.
First strategy
This System was created from the Book "How I Tripled My Money In The
Futures Market" by Ulf Jensen, Page 183. This is reverse type of strategies.
The strategy buys at market, if close price is higher than the previous close
during 2 days and the meaning of 9-days Stochastic Slow Oscillator is lower than 50.
The strategy sells at market, if close price is lower than the previous close price
during 2 days and the meaning of 9-days Stochastic Fast Oscillator is higher than 50.
Second strategy
The Klinger Oscillator (KO) was developed by Stephen J. Klinger. Learning
from prior research on volume by such well-known technicians as Joseph Granville,
Larry Williams, and Marc Chaikin, Mr. Klinger set out to develop a volume-based
indicator to help in both short- and long-term analysis.
The KO was developed with two seemingly opposite goals in mind: to be sensitive
enough to signal short-term tops and bottoms, yet accurate enough to reflect the
long-term flow of money into and out of a security.
The KO is based on the following tenets:
Price range (i.e. High - Low) is a measure of movement and volume is the force behind
the movement. The sum of High + Low + Close defines a trend. Accumulation occurs when
today's sum is greater than the previous day's. Conversely, distribution occurs when
today's sum is less than the previous day's. When the sums are equal, the existing trend
is maintained.
Volume produces continuous intra-day changes in price reflecting buying and selling pressure.
The KO quantifies the difference between the number of shares being accumulated and distributed
each day as "volume force". A strong, rising volume force should accompany an uptrend and then
gradually contract over time during the latter stages of the uptrend and the early stages of
the following downtrend. This should be followed by a rising volume force reflecting some
accumulation before a bottom develops.
WARNING:
- For purpose educate only
- This script to change bars colors.

BankNifty Modified McClellan OscillatorThe McClellan Oscillator developed by Marian McClellan is a useful breadth indicator because it describes the acceleration that takes place in the breadth numbers.
How to read McClellan Oscillator
A positive or negative value gives a simplistic bullish or bearish statement about the short-term trend of the market
Very low readings show oversold conditions
Very high readings show overbought conditions
Divergences are also important to look for as a sign that the strength of a trend is waning
Here same oscillator is rebuilded for BANKNIFTY using the difference between Capital weighted Up Volume and Down Volume instead of Advance - Decline.

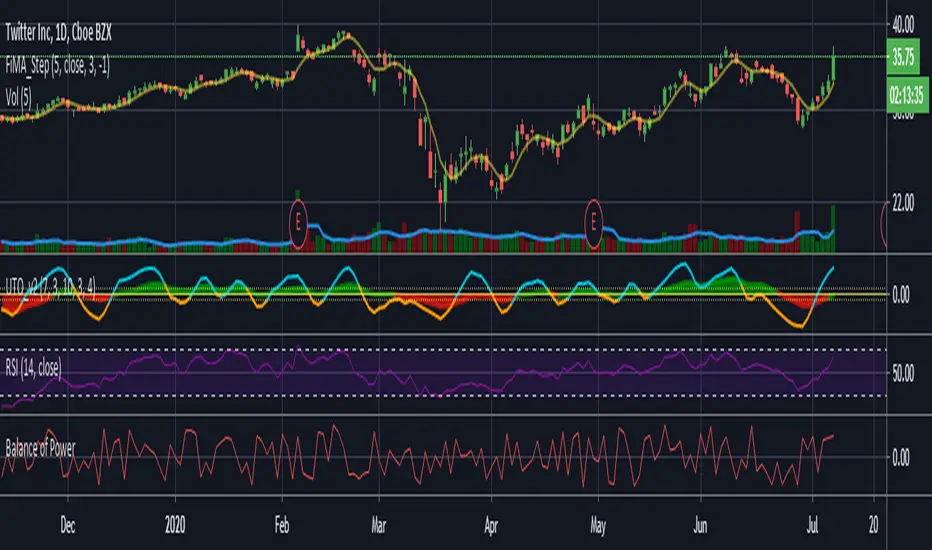
Ultimate Trader Oscillator - UTO v1Note; this is experimental / learning work -- has nothing to do with the existing "Ultimate Oscillator" -- i call this project UTOpia :)
This is based on some research work i was doing around the Balance Of Power - which i posted about in the past
the conclusion form there was a questions of, what would we get if we create an indicator that takes into consideration other factors that may be affecting momentum - so while the classic Balance of Power formula looks at where the open and close of a bar are compared to the full bar range, this is only a small part of the insight we need - when we visually inspect a price chart, we also look at many other factors. for example, how the bar closes compared to previous bar(s), how much did the bulls (or bears) managed to move the high (or low) of the bar compared to previous one, how much volume, how is the price spread ...etc
so i wanted to build an indicator that does exactly that - we will give a score of +100 / -100 to each bar based on these factors (some were identified in the linked post) -- imagine here that we are a judge in a tug of war contest (or a beauty contest if you would :)) and we give a score to the participating teams - the scores are given in different "categories" as these teams make effort to win the game (each bar) - to be totally fair, in some scoring categories, we choose to take the average of 3 points for a fair assessment - the final score is calculated based on the average from all judges - and then and average over the desired length is calculated. this score should be very fair and represents the true effort from all angles, right? that would be our UTOPIA :)
in our case, we don't use an average of total score after each category is evaluated, but rather create a directional index (similar to RSI) -- so we can avoid big spikes in the resulting numbers, and maintain a oscillator -like result.
-- the code is commented to explain the various pieces - and how the scoring happen.
the results are interesting - and you can see how the UTO stacks against the classic RSI and BoP - but it's more of a work to build on, rather than a usable indicator - although i do use it in my own trading :)
one final thought here, i came to learn after few years that the best indicators do not necessarily lead to profitable trading. from an indicator standpoint, if everyone else is trading using (for example) a moving average crossover or RSI, then a successful trader should be looking at these classic indicators too, cause these common indicators will drive the mass behavior - and will at many times trigger "self- fulfilling prophesies" in price action - but that's not the only or the biggest reason - the big reasons have to do with the fact that trading needs a lot of effort outside the charts, in researching markets, learning the discipline, then managing positions and managing the portfolio. these are all big topics to put in such short words.
i hope some will find this work inspiring.
RedK_AvgMoneyFlow Oscillator v1This is a compact & simple study that tracks the short-term average price change and the (average) volume associated with it, to generate a very clear signal when a change of buying/selling flow is detected. these buy/sell cycles can happen within a longer "demand / trend-up" or "supply / trend down" phases as we know.
this concept is a bit different from MFI or CMF. The math we use here is simpler, and more "relative" and short-term focused, deliberately.
how does it work
===============
once the average price change and the average volumes are calculated for the specified length, we then turn that into a +100/-100 oscillator format - using the stoch() function - which helps to generate a clearly identifiable unambiguous signal (crossing the zero line up or down) that help traders (mainly with entries)
-- the stoch() function also makes the oscillator "relative" to the specified period length, meaning, we can be in a uptrend (demand mode) and the MFO is showing flow "out" (negative) - that's specific to the short-term period - and that's exactly what i was trying to see
- the thinking here is that the best spot to go long is when the existing selling has been depleted and no more supply exists (during an uptrend), and vice verca.
- other stuff: i use WMA() throughout the script -- and we apply a smoothing for the final plot. keep smoothing to a minimum to avoid unnecessary lag in the signals
- the signal should be considered *after* a bar is fully closed.
Suggested Use
==============
i suggest you use this in combination with other indicators that can show the overall short-term and long-term bias (for example, i use the Ribbon here for that) - and take only entry signals in the same direction - a signal to go long, for example, would be when the bias / trend is up *and* the MFO crosses the zero line *going up* .. you may need to wait for that setup to show before you hit the trigger.
another benefit here, is that MFO will also detect strengths and weaknesses - when we see diversion with price movement. this shows couple of times in the example below
Please Note
============
i do not do short-term trading / scalping - those who do, i hope may find this useful - if you decide to use it and you do find it useful, please post feedback here for the common learning
Good luck!

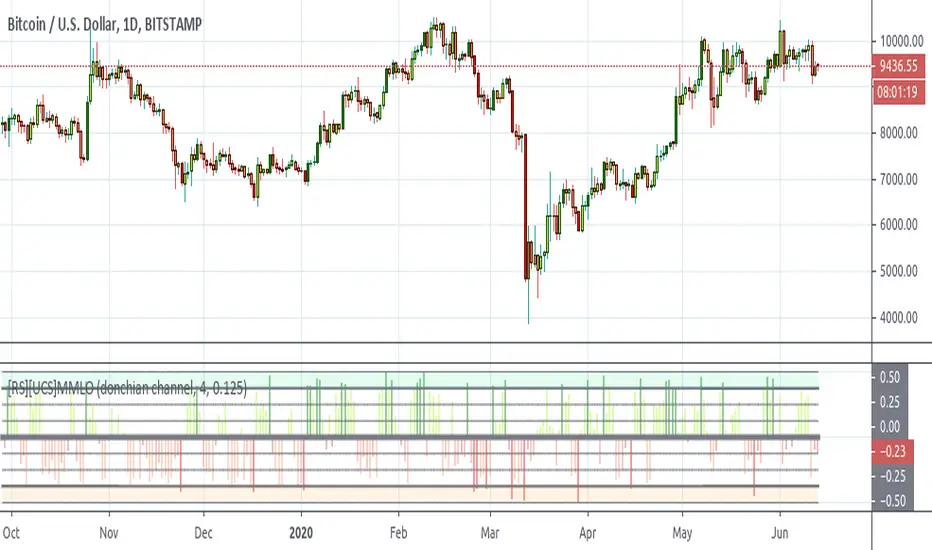
[RS][UCS]Murrey's Math Oscillator ModificationExperimental:
modifications includes 2 extra channel types to read volatility's range.
this is a update and modification to the Murrey's Math Lines Oscillator published by UCSgears here:
Mass Thrust OscillatorThis is a custom indicator that turns my Mass Thrust Indicator into an oscillator which is loosely based on Tushar S. Chande's Market Thrust Oscillator (Stocks & Commodities V. 10:8 (347-350))
Let me know if you would like a custom script or if you want to see me publish any other indicators!

1337 OscillatorThis script is inspired by the Awesome Oscillator by Bill Williams. The 1337 Oscillator uses a faster and more reactive hull moving average.
Signals could be from the 0 line crosses or rising/falling.

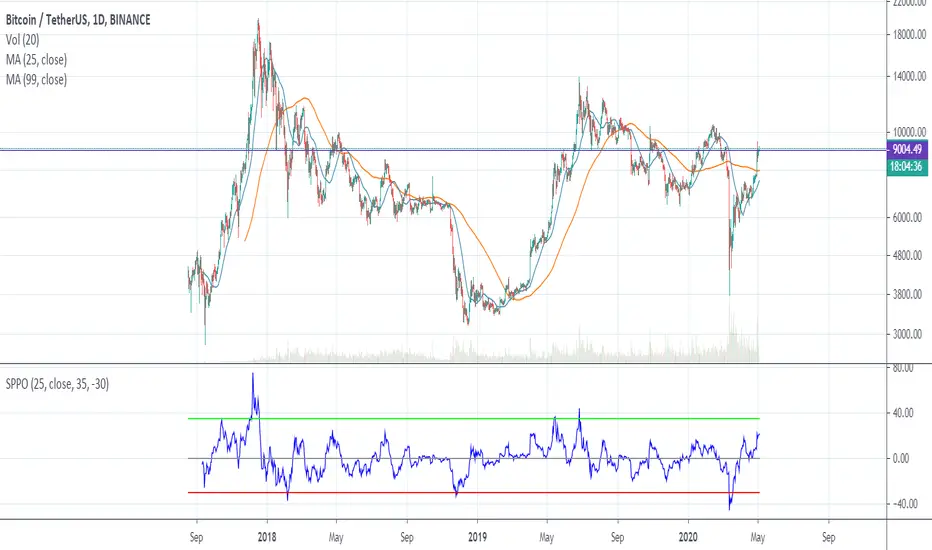
SPPO — Simple Percentage Price Oscillator SPPO is Simple Percentage Price Oscillator .
SPPO is calculated as the ratio of the current price to the moving average.
This indicator is used in the trading strategy to determine overbought and oversold markets. Chart period D1.
I use this oscillator on the BTCUSD and ETHUSD pairs. It can also be used on other top crypto symbols.
If SPPO on the BTCUSDT chart > 35%, this means that in the Bitcoin market pamp . So it’s time to close long positions.
If SPPO on the bitcoin chart is <-30%, then bitcoin is oversold and you need to think about starting to buy it.
Recommended timeframe: 1d
Input parameters:
MA Length — number of bars for moving average. Default = 25.
Source — type of price used to calculate the MA. Default = close.
High Level — upper horizontal constant on the SPPO chart. Default = 35.
Low Level — lower horizontal constant on the SPPO chart. Default = -35.
Simple MA(Oscillator) — type of MA indicator used. If false = Exponential Moving Average , if true = Simple Moving Average . Default = true.
Price/Volume Normalized OscillatorIt can be interesting to have an indicator displaying two rescaled measures, thus ending with an indicator that allow the creation of more complex trading rules (conditions), this is what is intended with the price/volume normalized oscillator (PVNO) who normalize both volume and price in order to display them together.
Volume is considered an important factor as it show the trading activity of a security, securities with higher volume are more attractive to trade as higher volume is in general present with larger price variations, higher volume can also indicate a better trade execution.
THE INDICATOR
In the PVNO, the rescaled volume is represented by the blue plot while the rescaled price is represented by the (green/red) plot. The rescaling method used here is simply based on the sum of the current and past momentum output of a series of observations divided by the sum of the current and past absolute value of this momentum, this allow to have a smooth output with values reaching 1 and -1 instead of converging toward 0.
The indicator has two settings, Volume Length who control the length of the sum of the rescaled volume, while Price Length control the sum length of the rescaled price. When the rescaled volume is positive it means that the sum of the current and past Volume Length - 1 positive volume momentum values is greater than the sum of negative ones, this indicate a more active market. The same apply to the rescaled price, with a positive rescaled price value indicating an uptrend and negative values indicating a downtrend.
Because of the stationary and periodic nature of volume, low values for Volume Length are recommended.
INTERPRETATIONS AND USAGES
As you can see the rescaled price plot can have two colors, and the area between the rescaled volume and price plot is filled with two possible colors as well, the color depend on the following simple condition:
green: once rescaled price > 0 and rescaled volume > 0 until condition for red don't happen
red: once rescaled price < 0 and rescaled volume > 0 until condition for green don't happen
Therefore no signals are triggered if the rescaled price is greater/lower then 0 but the rescaled volume is lower than 0, this could allow to filter various false signals (at the cost of reactivity). A more interesting use-case of the indicator can be based on the upper and lower constant levels displayed in order to spot points where volume will fall or rise.
Volume can also be used to spot potential reversals, therefore the levels can also be used to this end as well.
SUMMARY
A normalized oscillator plotting rescaled price and volume values has been presented, the indicator posses its own trading rules but can easily modified. This is not an indicator i'am super proud of, even after passing some time on it lol. You can use the code freely without asking for permission, mention is appreciated.
Next indicators should be more pertinent and interesting, thanks for reading !

DT-OscillatorThis is Robert C. Miner's DT Oscillator, a version of the Stochastics & RSI.
See his book, High Probability Trading Strategies
There are four possible parameter combinations for this indicator:
8,5,3,3 Monthly,Weekly,Daily
13,8,5,5 Weekly,Daily,H4
21,13,8,8 Daily,H4,H1
34,21,13,13 H4,H1,M15

Combo Backtest 123 Reversal & DiNapoli Detrended Oscillator This is combo strategies for get a cumulative signal.
First strategy
This System was created from the Book "How I Tripled My Money In The
Futures Market" by Ulf Jensen, Page 183. This is reverse type of strategies.
The strategy buys at market, if close price is higher than the previous close
during 2 days and the meaning of 9-days Stochastic Slow Oscillator is lower than 50.
The strategy sells at market, if close price is lower than the previous close price
during 2 days and the meaning of 9-days Stochastic Fast Oscillator is higher than 50.
Second strategy
DiNapoli Detrended Oscillator Strategy
WARNING:
- For purpose educate only
- This script to change bars colors.

Combo Strategy 123 Reversal & DiNapoli Detrended Oscillator This is combo strategies for get a cumulative signal.
First strategy
This System was created from the Book "How I Tripled My Money In The
Futures Market" by Ulf Jensen, Page 183. This is reverse type of strategies.
The strategy buys at market, if close price is higher than the previous close
during 2 days and the meaning of 9-days Stochastic Slow Oscillator is lower than 50.
The strategy sells at market, if close price is lower than the previous close price
during 2 days and the meaning of 9-days Stochastic Fast Oscillator is higher than 50.
Second strategy
DiNapoli Detrended Oscillator Strategy
WARNING:
- For purpose educate only
- This script to change bars colors.

Premium Stochastic OscillatorThe PSO is a rewired version of a short-period stochastic. Unlike a standard stochastic oscillator, this indicator is normalized to register neutral values at zero while providing greater sensitivity to short-term price moves. This indicator uses a central zero line as a reference point and will oscillate above and below this point as price fluctuates. In addition, the PSO is smoothed by using a double exponential moving average to provide a more even response to turns in the market.
(from TASC magazine, August 2008 issue).
The Premium Stochastic Oscillator was introduced by technical analyst Lee Leibfarth.

Reflex Oscillator - Dr. John EhlersHot off the press, I present this NEW "Reflex Oscillator" employing PSv4.0, originally formulated by Dr. John Ehlers for TASC - February 2020 Traders Tips. John Ehlers might describe it's novel characteristics as being a reversal sensitive near zero-lag averaging indicator retaining the CYCLE component. Also, I would add that irregardless of the sampling interval, this indicator has a bound range between +/-2.0 on "1 second" candles all the way up to "1 month" candle durations. This indicator also has a companion indicator entitled "TrendFlex Oscillator". I have published it in tandem with this one in my scripts profile.
One notable difference between this and the original formulation is that I have added an independent control for the Super Smoother. This "tweak" is enabled by applying the override and adjusting it's period. There is a "Post Smooth" input() that "tweaks" the internal Reflex EMA too. Keep in mind that my intention of adding tweaks is solely for experimentation with the original formulation.
I also added adjustable levels for those of you that may wish to employ alertcondition()s to this indicator somehow. Providing a more utilitarian approach, I created this with an easy to use reusable function named reflex(). As always, I have included advanced Pine programming techniques that conform to proper "Pine Etiquette". Being this is one of John Ehlers' first two simultaneously released indicators for 2020, I felt a few more bells and whistles were appropriate as a proper contribution to the Tradingview community.
Features List Includes:
Dark Background - Easily disabled in indicator Settings->Style for "Light" charts or with Pine commenting
AND much, much more... You have the source!
The comments section below is solely just for commenting and other remarks, ideas, compliments, etc... regarding only this indicator, not others. When available time provides itself, I will consider your inquiries, thoughts, and concepts presented below in the comments section, should you have any questions or comments regarding this indicator. When my indicators achieve more prevalent use by TV members, I may implement more ideas when they present themselves as worthy additions. As always, "Like" it if you simply just like it with a proper thumbs up, and also return to my scripts list occasionally for additional postings. Have a profitable future everyone!

PVT Osc - Price Volume Trend Oscillator [UTS]The oscillator version of the Price Volume Trend indicator (PVT) can be considered as a leading indicator of future price movements. The PVT Indicator is similar to the On Balance Volume indicator as it is also used to measure the strength of a trend.
The difference between the OBV and the PVT is that where the OBV adds all volumes when price achieves higher daily closes and subtracts them when price registers a lower daily close, the PVT adds or subtracts only a portion of the volume from the cumulative total in relation to a percentage change in price.
The general market consensus is that this difference enables the PVT to more accurately represent money flow volumes in and out of a stock or commodity.
The PVT has been designed so that it is capable of forecasting directional changes in price. For instance, if the price of a stock is rising and the PVT begins to fall, then this is indicative that a price reversal could occur very soon.
The general consensus is that the PVT is more accurate at detecting new trading opportunities than the OBV because of the differences in their construction. The OBV is designed so that it adds the same amount of volume whether the price closes upwards by just a small fraction or by multiples of its day opening value. On the other hand, the PVT adds volume proportional to the amount the price closed higher.
General Usage
Plain old PVT can be used to confirm trends, as well as spot possible trading signals due to divergences.
A benefit of the oscillator version is that it can produce LONG or SHORT signals on zero line cross.
Or controversy, disallow LONG trades in bearish territory and disallow SHORT trades in bullish territory.
Moving Averages
4 different Moving Averages are available:
EMA (Exponential Moving Average)
SMA (Simple Moving Average)
VWMA (Volume Weighted Moving Average)
WMA (Weighted Moving Average)

Multi-Oscillator Divergence StrategyNote: This is a modified version of TradingView's built-in "Divergence Indicator" and applied in "Strategy" format to show back testing results
It finds bullish and bearish divergence in a selection of well known MA formulas: MACD, RSI, STOCH, DETRENDED PRICE OSCILLATOR, MOMENTUM.
I've found good results even on 1 minute charts!
In this example the chart backtest is utilizing the detrended price oscillator (DPO)
There are multiple variables, so the ability to find good back test can sometimes be "time consuming"
And please note that if you increase "Pivot LookBack Right" variable too high, then you will increase chance of repaint. Keep this variable as low as possible
I've also drawn my own solutions on the chart (red and green trend lines) to find good take profit and safe stop loss. In order to study this properly you need the own the chart. Scripts don't give you this option.
See private chart publication link to "own" the chart for yourself. Simply click on the "Share" button (it's the megaphone icon) and click on "Make it Mine"
I've found the best approach is to create 5 copies of indicator on 1 chart and have each running with different MA formula. This will give you a majority consensus type environment.
I will post study with alert conditions next
Good luck and enjoy!
