Pattern Finder Pro [M/W Recognition]Description PatternFinder detects M patterns (bearish) and W patterns (bullish) with three variants each. Now includes **optional volume confirmation** to filter for higher-probability setups.Pine Script®指标由Making_Trades_Matter提供43
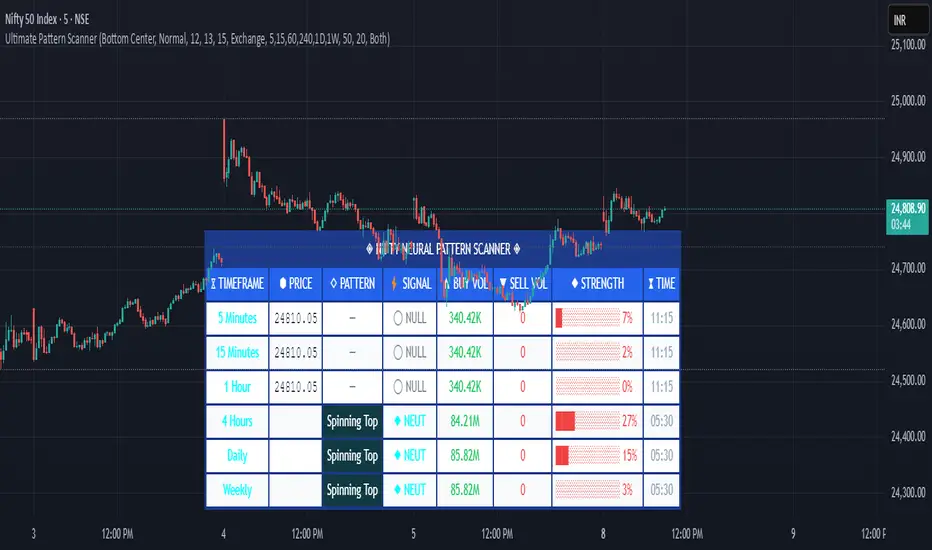
Pattern ScannerUltimate Pattern Scanner — multi-timeframe candlestick discovery tool (educational use only). Purpose: This script scans user-selected timeframes for classical candlestick patterns (for example: engulfing, morning/evening stars, hammers, dojis, tasuki gaps, three soldiers/crows, tweezers, marubozu, and others) and reports pattern name, detection price, directional signal (Bull / Bear / Neutral), and a simple volume participation metric. It is intended as an idea-generation and training tool to help traders learn pattern mechanics, not as an automated trading system. Main modules and rationale: 1) Pattern engine — applies classical candle structure rules to detect formations; 2) SMA trend filter (configurable length) — provides a directional bias to favor trade-with-trend setups; 3) Volume heuristic — approximates participation by separating candles into buy-like and sell-like volume and comparing total volume to a moving average; 4) Multi-timeframe aggregator — collects and presents pattern results from multiple timeframes; 5) Alerts — optional alerts list detected patterns and TFs. Combining these modules is intentional: patterns provide structure, SMA provides context, and volume supplies participation confirmation. Together they improve the educational value and practical relevance of each detected pattern. How to use: Choose timeframes and SMA length that match your trading horizon. Use the scanner to locate pattern candidates, then confirm with higher-timeframe agreement and volume ratio before considering trade entry. Use structural stops (recent swing highs/lows or ATR-based stops) and define risk:reward rules. For learning, replay alerted bars and record outcomes over fixed horizons to build empirical statistics. Limitations: Volume classification (close>open) is a heuristic and not a true bid/ask tape. SMA is a lagging trend proxy. Multi-timeframe agreement reduces but does not eliminate false signals, especially around news or in low-liquidity instruments. Use demo accounts and backtesting before live trading. Inputs you can adjust: timeframe list, SMA length, volume MA length, which patterns to enable/disable, display options. Compliance notes: This description explains why modules are combined and what the script does without exposing source code logic; it is non-promotional and contains no contact links. Remove any trademark symbols unless registration details are provided. Risk Disclaimer: This tool is provided for education and analysis only. It is not financial advice and does not guarantee returns. Users assume all risk for trades made based on this script. Backtest thoroughly and use proper risk management. Pine Script®指标由aiTrendview-Charting-System提供33124
VPE Candle Patterns with Volume ConfirmationPattern Detection Logic: Doji — Body is ≤10% of the candle range (adjustable) Hammer — Body in upper third, lower wick ≥2x body size, minimal upper wick Shooting Star — Body in lower third, upper wick ≥2x body size, minimal lower wick Volume Confirmation: Patterns only trigger signals when volume > volume (current candle volume exceeds previous) Alerts: Four alert conditions you can configure in TradingView: Doji Detected Hammer Detected Shooting Star Detected Any Pattern Detected (combined) Visual Elements: Labels on chart (D, H, SS) — toggleable Optional background highlighting Info table showing current bar status To set up alerts in TradingView: Add the indicator to your chart Right-click → Add Alert Select the indicator and choose which alert condition Configure your notification method (webhook, email, app push, etc.) The input parameters let you tune sensitivity — tighten the dojiBodyRatio for stricter doji detection, or adjust wick ratios if you're getting too many/few signals.Pine Script®指标由kschwende提供17
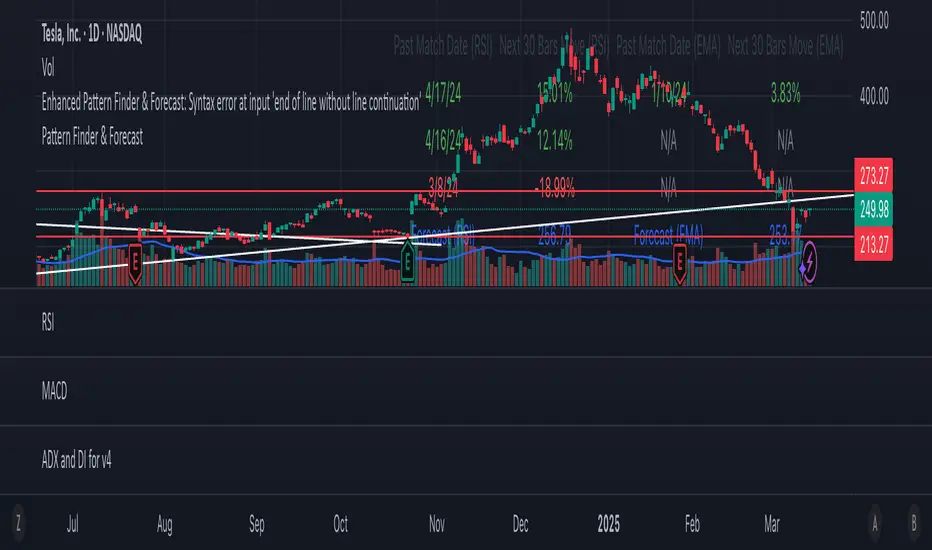
Pattern Finder & ForecastThis script is a pattern-finding and forecasting tool that analyzes historical price data based on EMA (Exponential Moving Averages) and RSI (Relative Strength Index). It identifies past occurrences where the last 30 bars of data resemble the most recent 30 bars and predicts the future price movement based on those past patterns.Pine Script®指标由cooldudebuffet提供已更新 25
S&P Options Patterns Detector (6-20 Candles)Pattern detector for S&P options. Detects alerts for bullish or bearish signals for any stock in S&P 500Pine Script®指标由mwilliamson8792提供已更新 3
Pattern Atlas Smart Panel Alerts Toni Ventura MaltaThe Pattern Atlas in 1 Indicator Not fool proof but helps understanding what the discord traders are talking about ;) Pine Script®指标由toniventuramalta提供30
Pattern indicatorRules are pretty simple for this indicator .we are searching candlestick pattern on current day high and low .. *** Candlestick we are looking for *** 1) Bullish/Bearish Engulfing 2) Bearish/Bullish Harami 3)Hammer/Inverted Hammer Rule for searching bullish candlestick ====> 1) searching for current day high and day low 2) looking for candlestick as Bullish Engulfing or Bullish Harami or Hammer 3) if we got both rule 1 and rule 2 we are getting label ex- bullish engulfing 4) we can Enable/Disable Candlestick we don't want to search Rule for bearish candles ====> 1) searching for current day high and day low 2) looking for candlestick as Bearish Engulfing or Bearish Harami or inverted hammer 3) if we got both rule 1 and rule 2 we are getting label ex- bullish engulfing 4) we can Enable/Disable Candlestick we don't want to search Note -- i have created all indicator calculation .... Disclaimer: market involves significant risks, including complete possible loss of funds. Consequently trading is not suitable for all investors and traders. By increasing leverage risk increases as well.With the demo account you can test any trading strategies you wish in a risk-free environment. Please bear in mind that the results of the transactions of the practice account are virtual, and do not reflect any real profit or loss or a real trading environment, whereas market conditions may affect both the quotation and execution Pine Script®指标由samscripter提供已更新 1616408
Pattern Recognition: "The Voice" [racer8]The voice is based on pattern recognition. Enjoy ;)Pine Script®指标由racer8提供79
Chart Patterns [ActiveQuants]The Chart Patterns indicator is a comprehensive tool designed to automatically identify a variety of common chart patterns directly on your price chart. By detecting sequences of pivot highs and lows , this indicator helps traders spot potential trend continuations , reversals , and key market structures such as Double Tops and Double Bottoms . Enhance your technical analysis by quickly recognizing these formations as they emerge. How It Works The indicator operates in a two-stage process: Pivot Point Detection: It first identifies significant swing highs and swing lows (pivot points) based on a user-defined Period . These pivots form the fundamental building blocks for pattern recognition. Pattern Recognition: Using the sequence of these detected pivot points, the script then applies logical rules to identify the following patterns: Lower Low (LL) Lower Low & Lower High (LL & LH) Higher High (HH) Higher High & Higher Low (HH & HL) Double Tops Double Bottoms Patterns are drawn on the chart with connecting lines and labeled for easy identification. Double Tops and Double Bottoms also feature a status system: " Active " while forming, " Confirmed " upon neckline breakout, or " Invalid " if specific conditions negate the pattern before confirmation. █ KEY FEATURES Comprehensive Pattern Detection: Identifies six distinct types of chart patterns, offering insights into both trend continuation and potential reversals. Pivot-Based Analysis: Uses a robust method of identifying pivot highs and lows as the foundation for pattern formation. Pattern Status for Double Tops/Bottoms: - Active: A Double Top or Double Bottom pattern has formed its two peaks/troughs and the intervening neckline point, but the price has not yet broken beyond the neckline. The pattern is developing . - Confirmed: The price has decisively closed beyond the neckline (below for Double Top, above for Double Bottom), signaling a potential entry or validation of the pattern. - Invalid: An " Active " Double Top or Double Bottom pattern can be invalidated if, before a neckline breakout occurs, a new pivot point forms that negates the pattern’s structural integrity. For example, if a new pivot low forms above or at the neckline of an Active Double Top, the pattern is considered invalid because the market failed to break down and instead showed relative strength. Customizable Visuals: Allows users to define colors for bullish and bearish patterns, line widths, and the visibility of pivot points. Selective Pattern Display: Users can choose to display all patterns or filter by status (Active, Confirmed, Invalid) for Double Tops/Bottoms. Individual pattern types can also be toggled on or off. Historical Analysis Control: The Show Last History (Bars) input allows users to specify how far back the indicator should plot patterns, optimizing performance and chart readability. Clear Labeling: Patterns are clearly labeled on the chart, with Double Tops/Bottoms also showing " Top 1 ," " Top 2 ," or " Bottom 1 ," " Bottom 2 " labels. █ PATTERNS DETECTED Lower Low (LL): Indicates a potential bearish continuation or the start of a downtrend. Forms when price makes a lower low during an uptrend. Lower Low & Lower High (LL & LH): A stronger confirmation of a bearish trend, where the market forms a lower low followed by a lower high . Higher High (HH): Signals a potential bullish continuation or the start of an uptrend. Forms when price makes a higher high during a downtrend. Higher High & Higher Low (HH & HL): A stronger confirmation of a bullish trend, where the market forms a higher high followed by a higher low . Double Top: A bearish reversal pattern characterized by two distinct peaks at roughly the same price level, separated by a trough (neckline). Confirmation occurs when price breaks below the neckline. Double Bottom: A bullish reversal pattern featuring two distinct troughs at roughly the same price level, separated by a peak (neckline). Confirmation occurs when price breaks above the neckline. █ EXAMPLE: DOUBLE TOP INVALIDATION Understanding how a Double Top or Double Bottom can be invalidated is crucial. Here's an example for a Double Top: Formation: The indicator identifies two peaks (Top 1, Top 2) at a similar price level, with a corrective trough (Neckline Pivot P5) in between. The pattern is labeled " Double Top " and is in an " Active " state. ( Imagine points P4 and P6 are the two tops, and P5 is the low point of the neckline between them ). Pre-Breakout Condition: The price action continues, but before it breaks decisively below the P5 neckline level, a new significant swing low (a new pivot low) forms. Invalidation Check: The indicator checks the price level of this new pivot low. If this new pivot low occurs at a price equal to or higher than the P5 neckline level, the " Active " Double Top pattern is re-labeled as " Invalid Double Top ". ( See image below for a visual representation of this scenario ) In this example, the Double Top formed with Top 1 (P4) and Top 2 (P6). The neckline is at P5. Before price broke below P5, a new pivot low formed at the red circle. Since this new pivot low is above the P5 neckline, the Double Top is marked " Invalid ". The logic is that the market failed to break the neckline support and instead established a higher low (or a low at the support level), suggesting that the immediate bearish pressure has waned, thus invalidating the bearish reversal implication of the Double Top before it could confirm. A similar logic applies to Double Bottoms (a new pivot high forming below or at the neckline before an upside breakout). █ USER INPUTS Visibility and Common Styling - Show Last History (Bars): Specifies the number of recent bars the indicator will analyze and plot patterns on. Default: 3000 bars. Min: 10. - Patterns: Filters which patterns are displayed based on their status. Options: All, Active, Confirmed, Invalid. Default: All. - Pattern Line Width: Sets the thickness of the lines used to draw the patterns. Default: 1. Min: 1, Max: 10. - Bearish Color: Color for bearish patterns (LL, LL & LH, Double Tops). Default: Red. - Bullish Color: Color for bullish patterns (HH, HH & HL, Double Bottoms). Default: Green. Pivot Points - Period: The lookback period on either side of a bar to qualify it as a pivot high or low. Higher values detect more significant pivots. Default: 10 bars. Min: 2. - Show Pivot Highs: Toggles the visibility of detected pivot high markers. Default: Enabled. - Show Pivot Lows: Toggles the visibility of detected pivot low markers. Default: Enabled. - Pivot Highs Color: Color for the pivot high markers. Default: #ff5252 (Reddish). - Pivot Lows Color: Color for the pivot low markers. Default: #089981 (Greenish). Patterns (Toggles) - Lower Low: Enable/disable detection and display of Lower Low patterns. Default: Enabled. - Lower Low & Lower High: Enable/disable detection and display of Lower Low & Lower High patterns. Default: Enabled. - Higher High: Enable/disable detection and display of Higher High patterns. Default: Enabled. - Higher High & Higher Low: Enable/disable detection and display of Higher High & Higher Low patterns. Default: Enabled. - Double Tops: Enable/disable detection and display of Double Top patterns. Default: Enabled. - Double Bottoms: Enable/disable detection and display of Double Bottom patterns. Default: Enabled. █ CONCLUSION The Chart Patterns indicator is a versatile and powerful assistant for traders who utilize classical chart pattern analysis. By automating the detection of key formations and providing clear visual cues along with status updates for patterns like Double Tops and Bottoms, it allows traders to focus on strategy development and execution. With its customizable settings, it can be adapted to various instruments and timeframes, making it a valuable addition to any technical trader's toolkit. █ IMPORTANT NOTES ⚠ Pivot Period Sensitivity: The Period setting for pivot detection is crucial. A shorter period will identify more frequent, smaller swings, while a longer period will focus on more significant turning points. Adjust this setting based on the asset's volatility, the timeframe you are trading and your trading style. ⚠ Confirmation is Key: While the indicator identifies patterns, always wait for pattern confirmation (e.g., neckline breaks for Double Tops/Bottoms) and consider other factors like volume and market context before making trading decisions. ⚠ Confirmed Bars for Detection: Patterns are identified based on confirmed pivot points, which means a pivot is recognized period bars after it has formed. Status updates for Double Tops/Bottoms (Active, Confirmed, Invalid) also occur on confirmed bars. This approach enhances reliability and reduces the likelihood of repainting based on intra-bar price fluctuations. ⚠ Not a Standalone System: Chart patterns provide valuable insights, but they should be used in conjunction with other technical analysis tools (e.g., trendlines, moving averages, oscillators) and a sound risk management plan. ⚠ Lagging Nature: By their very definition, chart patterns are lagging indicators as they require a sequence of price action and several pivot points to complete their formation. █ RISK DISCLAIMER Trading involves a substantial risk of loss and is not suitable for every investor. The information provided by the Chart Patterns indicator is for educational and informational purposes only. It should not be considered as financial advice or a recommendation to buy or sell any security. Chart patterns indicate potential price movements but do not guarantee future results. Always perform your own due diligence and consult with a qualified financial advisor before making any investment decisions. Past performance is not indicative of future results. 📈 Happy trading! 🚀Pine Script®指标由ActiveQuants提供44897
PinBar and Bloom Pattern Concept (Zeiierman)█ Overview The Precision PinBar and Bloom Pattern Concept by Zeiierman introduces two new patterns, which we call the Bloom Pattern and the Precision PinBar Pattern. These patterns are used in conjunction with market open, high, and low values from different periods and timeframes. Together, they form the basis of the "PinBar and Bloom Pattern Concept." The main idea is to identify key bullish and bearish candlestick patterns around key levels plotted on the chart. The key levels are the Open, High, and Low from the current and previous periods of the selected timeframe. Users can choose how many previous periods to be drawn on the chart. █ How It Works The indicator operates by analyzing market data over selected timeframes. It uses inputs such as previous period open-high-low lines, timeframe selections, and pattern detection settings like Symmetry Precision and Range Threshold. These parameters allow the indicator to identify specific market conditions, including symmetrical movements in price and significant price range deviations, which form the basis of the Bloom and Precision PinBar patterns. Symmetry Signal: Purpose: To detect symmetry in price movements based on a precision threshold. How It Works: This function calculates the symmetry of high and low prices within the specified precision. It returns two boolean values indicating whether the high and low prices are within the symmetry precision. BaselineBound Pattern: Purpose: To identify bullish or bearish patterns based on a range factor. How It Works: The function calculates whether the current close price is within a certain range of the high-low difference of the previous period. It returns bullish and bearish signals based on these calculations. █ ● Bloom Pattern The Bloom Pattern is a unique candlestick pattern designed to identify significant trend reversals or continuations. It's not a single candlestick formation but a combination of a few elements that signal a potential strong move in the market. ⚪ Previous and Current Candle Analysis: The Bloom Pattern looks at the relationship between the current candle and the previous one. It checks whether the current candle's body (the range between its opening and closing prices) fully encompasses the body of the previous candle. This condition is known as "embodying." ⚪ Baseline Bound: The Baseline Bound concept involves comparing the closing price to a range established by the high and low of the previous candle, adjusted by a factor (the rangeFactor). This helps in identifying if the current price is showing a bullish or bearish tendency relative to the previous period's price movement. ⚪ Symmetry Signal: Additionally, it uses the Symmetry Signal, which measures the symmetry between the high and low prices of two consecutive candles. ⚪ Bullish and Bearish Signals: The combination of these conditions (embodying, baseline bound, and symmetry) results in either a bullish or bearish signal. A bullish signal suggests a potential upward trend, while a bearish signal indicates a possible downward trend. █ ● Precision PinBar Pattern The Precision PinBar Pattern is a refined version of the traditional Pin Bar, a well-known candlestick pattern used in trading. This pattern focuses on identifying market reversals with a high degree of accuracy. ⚪ Identification of Pin Bars: The function first identifies a pin bar, characterized by a small body and a long wick. The long wick indicates a rejection of certain price levels, and the small body shows little change between the opening and closing prices. ⚪ Tail and Body Length Analysis: The script calculates the length of the bar's tail (wick) and compares it to the length of the body. A qualifying pin bar typically has a tail at least three times longer than its body, suggesting a strong rejection of prices. ⚪ Positioning and Thresholds: Open-Close Position: The function checks whether the opening and closing prices are within a certain threshold of the high or low of the bar, which helps in distinguishing between bullish and bearish pin bars. ⚪ Baseline Bound and Symmetry: Like the Bloom Pattern, it incorporates Baseline Bound and Symmetry Signal concepts to validate the significance of the pin bar. ⚪ Bullish and Bearish Signals: Depending on these factors, a bullish or bearish pin bar is identified. A bullish PinBar suggests potential upward price movement, while a bearish PinBar indicates possible downward price movement. █ How to Use Using the Bloom and Precision PinBar patterns in conjunction with key market levels, such as previous highs and lows, can be a powerful strategy for traders. These market levels often act as significant points of support and resistance, and combining them with the patterns can offer strong trade signals. Here's how traders can effectively utilize these patterns: Identifying Key Market Levels Previous Highs and Lows: These are the highest and lowest points reached in previous trading periods and are often considered strong levels of resistance (in the case of previous highs) and support (in the case of previous lows). Using the Bloom Pattern Near Previous Highs (Resistance): If a Bloom Pattern emerges near a previous high, it could indicate a potential bearish reversal. Traders might interpret this as a signal to consider short positions, especially if the pattern shows bearish characteristics. Near Previous Lows (Support): Conversely, a bullish Bloom Pattern near a previous low could suggest a trend reversal to the upside. This could be a signal for traders to consider long positions. Using the Precision PinBar Pattern Precision PinBar at Resistance: A bearish Precision PinBar appearing near a previous high can be a strong signal for a potential downward move. This setup is often used by traders to enter short positions, anticipating a price rejection at this resistance level. Precision PinBar at Support: Similarly, a bullish Precision PinBar at or near a previous low suggests that the market is rejecting lower prices, indicating potential upward momentum. This is typically used by traders as a cue to go long. █ Settings Previous Open-High-Low Lines: Determine the number of historical periods to analyze. Settings include toggling the visibility of lines and labels and specifying the number of periods. Timeframe & Current Period: Select the timeframe for current market analysis. Options include different timeframes (e.g., 1H, 1D) and customization of line styles and colors. Pattern Settings: Adjust the Symmetry Precision and Range Threshold to fine-tune the indicator's sensitivity to specific market movements. Bloom & Precision PinBar Pattern: Enable or disable the detection of specific patterns and customize the visual representation of these patterns on the chart. ----------------- Disclaimer The information contained in my Scripts/Indicators/Ideas/Algos/Systems does not constitute financial advice or a solicitation to buy or sell any securities of any type. I will not accept liability for any loss or damage, including without limitation any loss of profit, which may arise directly or indirectly from the use of or reliance on such information. All investments involve risk, and the past performance of a security, industry, sector, market, financial product, trading strategy, backtest, or individual's trading does not guarantee future results or returns. Investors are fully responsible for any investment decisions they make. Such decisions should be based solely on an evaluation of their financial circumstances, investment objectives, risk tolerance, and liquidity needs. My Scripts/Indicators/Ideas/Algos/Systems are only for educational purposes!Pine Script®指标由Zeiierman提供已更新 1717 2.9 K
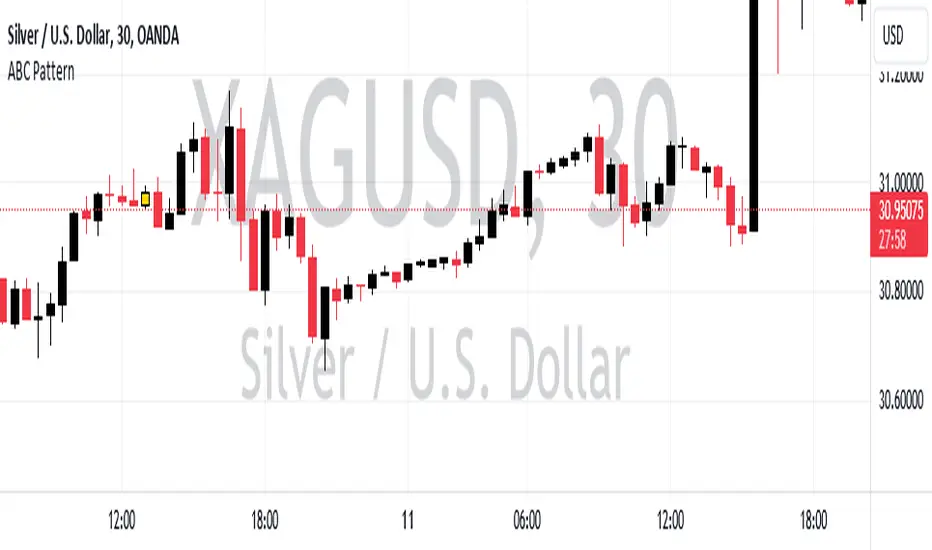
ABC PatternThe indicator, named "ABC Pattern," is designed to identify specific bullish and bearish patterns on a price chart. Here's a simple explanation of what it does: What the Indicator Does: 1. Identifies Bullish Patterns: - The indicator looks for a sequence of candles where certain conditions are met to form a bullish pattern. - When it detects a bullish pattern, it colors the candle that occurred three periods ago in gold. 2. Identifies Bearish Patterns: - Similarly, it looks for a sequence of candles where certain conditions are met to form a bearish pattern. - When it detects a bearish pattern, it colors the candle that occurred three periods ago in pinkish. 3. Creates Alerts: - Whenever a bullish or bearish pattern is identified, the indicator generates an alert. - The alert message includes the type of pattern (bullish or bearish), the price level at the time of detection, and the date and time of the pattern formation. Detailed Conditions: - Bullish Pattern: - The current candle closes higher than it opened. - The previous candle also closes higher than it opened. - Two candles ago, the candle closed lower than it opened. - Three candles ago, the candle closed higher than it opened. - The highest price of two candles ago is below the current close. - The lowest price of three candles ago is above the close of two candles ago. - The highest price of three candles ago is below the current close. - Bearish Pattern: - The current candle closes lower than it opened. - The previous candle also closes lower than it opened. - Two candles ago, the candle closed higher than it opened. - Three candles ago, the candle closed lower than it opened. - The lowest price of two candles ago is above the current close. - The highest price of three candles ago is below the close of two candles ago. - The lowest price of three candles ago is above the current close. Visual Representation: - Gold Color: Indicates a detected bullish pattern. - Pinkish Color: Indicates a detected bearish pattern. Alerts: - Alert Message: "ABC Pattern has appeared!" - Detailed Alerts: Include the type of pattern, price level, and timestamp for better analysis and decision-making. This indicator helps traders visually and audibly detect potential bullish and bearish patterns on their charts, aiding in making more informed trading decisions.Pine Script®指标由anodrr2提供63
Wolfe Waves [BigBeluga]🔵 OVERVIEW The Wolfe Waves pattern was first introduced by Bill Wolfe , a trader and analyst in the 1980s–1990s who specialized in market geometry and natural rhythm cycles. Wolfe observed that price often forms symmetrical wave structures that anticipate equilibrium points where supply and demand meet. These formations, called Wolfe Waves , gained popularity as a reliable pattern for forecasting both short- and long-term reversals. The Wolfe Waves indicator automatically detects these patterns in real time. It tracks sequences of five pivots (points 1 through 5) and connects them with wave lines. Users can select either Bullish or Bearish Wolfe Waves depending on their trading bias. When the pattern fails, the lines automatically turn red to highlight invalidation. 🔵 CONCEPTS Five-Point Structure – Wolfe Waves are defined by five pivots (1–5), which together form the basis of the wave pattern. Bullish Pattern – Occurs when price compresses downward into point 5, signaling a potential upside reversal. Bearish Pattern – Occurs when price extends upward into point 5, forecasting a downside reversal. Validation & Failure – The pattern is considered valid once all five pivots form; if price fails to respect the expected breakout, the indicator marks the structure as broken with red lines. 🔵 FEATURES Automatic detection of Bullish and Bearish Wolfe Waves. Labels each pivot (1–5) on the chart for clarity. Draws connecting lines between pivots to visualize the wave structure. Projects target/dashed lines (EPA/ETA) based on Wolfe Wave geometry. Lines automatically turn red when the pattern is broken, giving immediate feedback. Customizable color scheme for bullish (lime) and bearish (orange) waves. Adjustable sensitivity for pivot detection. 🔵 HOW TO USE Choose between Bullish or Bearish mode depending on your analysis. Watch for the formation of all five pivots; the indicator labels them clearly. Look for potential entries near point 5, with the expectation that price will travel toward the projected EPA line. Use invalidation (lines turning red) as a risk management warning to exit failed setups. Combine with momentum, volume, or higher-timeframe analysis to increase reliability. 🔵 CONCLUSION The Wolfe Waves brings the classic Wolfe Wave theory into an automated TradingView tool. Inspired by Bill Wolfe’s original concept of natural market cycles, this indicator detects, labels, and validates Wolfe Waves in real time. With automatic invalidation marking and customizable settings, it offers traders a structured way to harness one of the most well-known geometric reversal patterns.Pine Script®指标由BigBeluga提供88 2.3 K
Island Reversal [LuxAlgo]The Island Reversal tool allows traders to identify reversal patterns directly on the chart. These patterns signal a potential change in trend, either from bullish to bearish or vice versa. The tool enables traders to filter these patterns by trend, volume, and range, making it easy to display pure or less constrained island reversals. 🔶 USAGE An island reversal pattern may indicate a change in trend. It occurs when prices change direction from an uptrend to a downtrend, or vice versa. This pattern is a great tool for timing the market. Traders should be aware of when these patterns develop and watch how prices behave after the pattern forms. Now, let's take a closer look at one of these island reversal patterns to highlight its different components. The different parts are depicted in the image above. 1. A trend prior to the pattern 2. A gap starts the pattern. 3. A range of prices 4. A final gap, opposite to the first one, closes the pattern. 5. In this case, the pattern leads to a bearish trend, which is opposite to the trend in the first step. 🔹 Trend, Volume and Range Filters Enabling the trend filter causes the tool to only detect top island reversals during a bullish trend and bottom island reversals during a bearish trend. Traders can adjust the size of the detected trend in the settings panel. The larger the trend size, the more relevant the reversal patterns can be. The volume filter only detects reversal patterns if there is more volume within the range of the pattern than in the preceding trend. The idea is that more people tend to participate at the top and bottom of a trend as it changes direction. The tool has two range filters that discriminate the range within the island reversal pattern: Horizontality Filter (R2): Based on the R-squared statistic from linear regression, it detects whether the price is moving sideways within the range. Volatility Filter: Based on long-term volatility, it detects the size of the range within the pattern. The smaller the value in the Horizontality Filter, the more horizontal the prices will be within the range. A larger value will detect more reversal patterns. The larger the value in the Volatility Filter, the larger the ranges will be. A smaller value will detect fewer reversal patterns. 🔶 SETTINGS 🔹 Trend Filter Trend Filter: Enable or disable the trend filter. Trend Length: Select the size of the detected trend. 🔹 Volume Filter Volume Filter: Enable or disable the volume filter. 🔹 Range Filter Horizontality Filter (R2): Enable or disable the Horizontality filter and select a threshold value. Volatility Filter: Enable or disable the Volatility filter and select the multiplier value. 🔹 Style Bullish: Select a color for bullish sessions. Bearish: Select a color for bearish sessions. Transparency: Select a transparency level from 100 to 0. Pine Script®指标由LuxAlgo提供3232 3.2 K
N-Pattern Detector (Advanced Logic)Introduction The N-Pattern Detector (Advanced Logic) is a powerful Pine Script-based tool designed to identify a specific price structure known as the "N-pattern", which often indicates trend continuation or potential breakout points in the market. This pattern combines zigzag pivot logic, retracement filters, volume confirmation, and trend alignment, offering high-probability trading signals. It is ideal for traders who want to automate pattern detection while applying smart filters to reduce false signals in various markets — including stocks, forex, crypto, and indices. What is the N-Pattern? The N-pattern is a 3-leg price formation consisting of points A-B-C-D. It typically follows this structure: Bullish N-Pattern: A → Low Pivot B → Higher High (Impulse) C → Higher Low (Retracement) D → Breakout above B (Confirmation) Bearish N-Pattern: A → High Pivot B → Lower Low (Impulse) C → Lower High (Retracement) D → Breakdown below B (Confirmation) The pattern essentially reflects a trend–pullback–breakout structure, making it suitable for continuation trades. Key Features 1. Intelligent ZigZag Pivot Detection Uses pivot highs/lows to define key swing points (A, B, C). Adjustable ZigZag depth to control pattern sensitivity. Filters noise and avoids false signals in volatile markets. 2. Retracement Validation Validates the B→C leg as a proper pullback using Fibonacci-based thresholds. User-defined min and max retracement settings (e.g., 38.2% to 78.6% of A→B leg). 3. Trend Filter via EMA Filters patterns based on trend direction using a customizable EMA (e.g., 200 EMA). Only detects bullish patterns above EMA and bearish patterns below EMA (optional). 4. Volume Confirmation Ensures that impulse legs (A→B, C→D) are supported by stronger volume than the correction leg (B→C). Adds another layer of confirmation and reliability to detected patterns. 5. Target Projections Automatically draws 100% A→B projected target from point C. Optional Fibonacci extensions at 1.272 and 1.618 levels for take-profit planning. Visually plotted on the chart with colored dashed/dotted lines. 6. Clear Visuals & Labels Connects all pattern points with colored lines. Clearly labels points A, B, C, D on the chart. Uses customizable colors for bullish and bearish patterns. Includes real-time alerts when a valid pattern is detected. How to Use It Add to Chart Apply the indicator to any chart and time frame. It works across all asset classes. Adjust Inputs (Optional) Set ZigZag Depth to control pivot detection sensitivity. Define Min/Max Retracement levels to match your trading style. Enable or disable Trend and Volume filters for cleaner signals. Customize EMA length (default: 200) for trend validation. Wait for Pattern Confirmation The indicator constantly scans for valid N-patterns. A pattern is confirmed only after point D forms (breakout or breakdown). You’ll see the full pattern drawn with target levels. Set Alerts Alerts trigger automatically on confirmation of a bullish or bearish pattern. You can customize these in TradingView’s alerts panel.Pine Script®指标由Stable_Logic提供11127
[SGM Ordinal Patterns]An ordinal pattern is a concept used in mathematics and time series analysis. It is a way of describing the relative order of values in a sequence. Rather than focusing on the exact values, we are interested in how they compare to each other. An ordinal pattern will tell you how these values are positioned relative to each other. We do not look at the exact values, but only their order. Concrete Example • 4 (position 1 in the original sequence) is in position 2 in the ordered sequence. • 7 (position 2 in the original sequence) is in position 3 in the ordered sequence. • 2 (position 3 in the original sequence) is in position 1 in the ordered sequence. The ordinal pattern for this sequence is then (2,3,1)(2, 3, 1)(2,3,1). Script Explanation This script analyzes ordinal patterns based on the closing prices of the last three bars and calculates the future gains associated with each ordinal pattern. The main elements of the script are: 1. ordinal_pattern Function: o Determines the ordinal pattern based on three past closing values. o Returns an index (from 0 to 5) corresponding to one of the six possible ordinal patterns. 2. Calculations and Storage: o For each new bar, the last three closes are used to identify the ordinal pattern. o Future gains are calculated and associated with the previous ordinal pattern. o Return statistics (mean, standard deviation and Sharpe ratio) are calculated for each pattern. 3. Visualization: o Draws lines connecting the last three closes. o Tables displaying the number of occurrences, distributions, and return statistics for each ordinal pattern. What the Script Shows: • Table motifs_table : Number of occurrences and distribution of each ordinal pattern. An uneven distribution between patterns (different by one sixth for each pattern) can indicate market inefficiency. • Table pattern_analysis : Analysis of returns (mean, standard deviation, Sharpe ratio) for each ordinal pattern. • Table current_motif_table : Ordinal pattern of the last bar. This script helps to understand and visualize how ordinal patterns influence future returns of financial asset prices. An uneven distribution of patterns can indicate market inefficiencies.Pine Script®指标由Sigaud提供已更新 3341
Impactful pattern and candles pattern AlertThe Alertion indicator! impactful pattern: pattern that happen near the zone or in the zone at lower timeframe and give us entry and stop limit price. It is helpful for price action traders and those who want to decrease their risk. There are 3 IP patterns: Quasimodo Head and shoulder whipsaw engulfing These patterns may occur near the zone or may not occur but by them, you can decrease your trading risk for example you can trade with half lot before IP pattern and enter with other half after pattern. how to use? for example: you find zone at 1h timeframe for short position when price enter to your zone you run this indicator and choose your lower timeframe, for example 15m and click on short position. Then make the alert by right-click on your chart and choose the add alert and at condition box choose the impactful pattern and then click on create now wait for message :) Candles pattern: like reversal bar, key reversal bar, exhaustion bar, pin bar, two-bar reversal, tree-bar reversal, inside bar, outside bar these occur when the trend turn, so it is usable when the price enter to your zone or near your zone. This pattern can decrease your risk. Inside bar and outside bar: if this pattern engulf up, it is bullish pattern and if engulf down, it is bearish pattern. what does this indicator do? this indicator is for making alert it helps you to decrease your risk and failure. You optimize it to alert you when IP pattern happen or candle pattern happen or inside bar or outside bar engulfing or all of them. For IP pattern, it will message you entry and stop limit price. It works at 2 different timeframes, so you can make alert for example in 1h TF for candles pattern and 15m TF for IP pattern. Indicator will alert you for candles pattern at your chart timeframe and for IP pattern at timeframe you've chosen when you run the indicator, and it is changeable in setting. setting options TIMEFRAME IP: select the timeframe for IP patterns it means when IP pattern happen at that timeframe the indicator will alert you example = your TF is 1h, you found the supply zone and want to trade, note that IP pattern happen in lower TF, so you select 15m TF or TF lower than 1h. Short position: select it if you want to make short position. BUFFERING indicator send you entry and stop limit price you can change it by amount of percent it is your strategy to change your entry and stop loss or not example= in head and shoulder pattern at short position, the stop limit is high price of head in pattern so the indicator will message you the exact price but if you want to put your stop limit 5 percent upper than exact price you can enter 5 in front of stop loss or you want to enter 5 percent lower than exact high price of shoulder, you can optimize it. ALERTION you choose what alert you want IP alert or candle alert or inside and outside bar alert type your text for alert you can write additional text for your message ADVANCE IP alert frequency option: 1. Once per bar : indicator will alert you for IP pattern once at your chat timeframe bar, and you should wait til next bar for next alert. 2. Once per bar close : alert you when your chart timeframe bar closed and next alert will happen when next bar is closed. 3. All: alert you all the times IP pattern happen pivot left and right bars: lower will find smaller pattern at the END: this indicator is not strategy it is part of your strategy that help you to increase your winning rate. It is helpful for scalping and candle patterns finding. After you make an alert, you can delete the indicator or change your timeframe or make another alert, your previous alert won’t change. Thank you all. Pine Script®指标由erfan_abedi提供已更新 11499
Reversal Candlestick PatternsReversal Candlestick Patterns Reversal Candlestick Patterns is an indicator designed to detect classic candlestick reversal patterns with additional market context filtering. The indicator identifies ten well-known reversal candlestick patterns and displays them directly on the chart as visual blocks. Each pattern is detected using its own logic, based on candle structure, position relative to local extremes, and the direction of the current trend. Bullish patterns: > Bullish Engulfing > Morning Star > Hammer > Inverted Hammer > Three White Soldiers Bearish patterns: > Bearish Engulfing > Evening Star > Hanging Man > Shooting Star > Three Black Crows Pattern configuration Detection of each individual pattern, its short name displayed on the chart, and the color of the highlighting block can be configured separately in the first two settings groups: Bullish Patterns and Bearish Patterns . This allows you to fully customize which patterns are used, how they are labeled, and how they are visually represented. Trend filtering The indicator includes an optional trend filter based on two Simple Moving Averages. It is enabled using the Check Trend setting. The Trend Detection Length parameter is used simultaneously for several calculations: > Length of the fast moving average > Half of the slow moving average length > Number of consecutive bars required to confirm trend direction This approach helps filter out reversal patterns that form against a well-established trend. External filters The indicator supports external confirmation filters for bullish and bearish patterns. External filter settings are located in the External Filters group. For each filter, you can specify the value of an external indicator that must be met for a pattern to be confirmed. This allows flexible integration with oscillators, volume-based indicators, or custom scripts. Visualization settings Visualization settings control: > Pattern name display > Text size > Block fill transparency These settings affect only the visual presentation and do not influence the detection logic. Alerts The indicator provides two types of alerts: 1. Global alert for any detected pattern. Created by selecting “Any alert() function call” when setting up an alert. 2. Dedicated alert conditions for: > Each individual pattern > Any bullish pattern > Any bearish pattern Please note: if detection of a specific pattern is disabled in the settings, alerts for that pattern will not trigger. Important note Candlestick patterns should not be used as standalone trading signals. This indicator is intended to be used as part of a broader analysis, together with trend structure, key levels, volume, and other analytical tools.Pine Script®指标由Pechka_Rider提供44770
Pivot Candle PatternsPivot Candle Patterns Indicator Overview The PivotCandlePatterns indicator is a sophisticated trading tool that identifies high-probability candlestick patterns at market pivot points. By combining Williams fractals pivot detection with advanced candlestick pattern recognition, this indicator targets the specific patterns that statistically show the highest likelihood of signaling reversals at market tops and bottoms. Scientific Foundation The indicator is built on extensive statistical analysis of historical price data using a 42-period Williams fractal lookback period. Our research analyzed which candlestick patterns most frequently appear at genuine market reversal points, quantifying their occurrence rates and subsequent success in predicting reversals. Key Research Findings: At Market Tops (Pivot Highs): - Three White Soldiers: 28.3% occurrence rate - Spinning Tops: 13.9% occurrence rate - Inverted Hammers: 11.7% occurrence rate At Market Bottoms (Pivot Lows): - Three Black Crows: 28.4% occurrence rate - Hammers: 13.3% occurrence rate - Spinning Tops: 13.1% occurrence rate How It Works 1. Pivot Point Detection The indicator uses a non-repainting implementation of Williams fractals to identify potential market turning points: - A pivot high is confirmed when the middle candle's high is higher than surrounding candles within the lookback period - A pivot low is confirmed when the middle candle's low is lower than surrounding candles within the lookback period - The default lookback period is 2 candles (user adjustable from 1-10) 2. Candlestick Pattern Recognition At identified pivot points, the indicator analyzes candle properties using these parameters: - Body percentage threshold for Spinning Tops: 40% (adjustable from 10-60%) - Shadow percentage threshold for Hammer patterns: 60% (adjustable from 40-80%) - Maximum upper shadow for Hammer: 10% (adjustable from 5-20%) - Maximum lower shadow for Inverted Hammer: 10% (adjustable from 5-20%) 3. Pattern Definitions The indicator recognizes these specific patterns: Single-Candle Patterns: - Spinning Top : Small body (< 40% of total range) with significant upper and lower shadows (> 25% each) - Hammer : Small body (< 40%), very long lower shadow (> 60%), minimal upper shadow (< 10%), closing price above opening price - Inverted Hammer : Small body (< 40%), very long upper shadow (> 60%), minimal lower shadow (< 10%) Multi-Candle Patterns: - Three White Soldiers : Three consecutive bullish candles, each closing higher than the previous, with each open within the previous candle's body - Three Black Crows : Three consecutive bearish candles, each closing lower than the previous, with each open within the previous candle's body 4. Visual Representation The indicator provides multiple visualization options: - Highlighted candle backgrounds for pattern identification - Text or dot labels showing pattern names and success rates - Customizable colors for different pattern types - Real-time alert functionality on pattern detection - Information dashboard displaying pattern statistics Why It Works 1. Statistical Edge Unlike traditional candlestick pattern indicators that simply identify patterns regardless of context, PivotCandlePatterns focuses exclusively on patterns occurring at statistical pivot points, dramatically increasing signal quality. 2. Non-Repainting Design The pivot detection algorithm only uses confirmed data, ensuring the indicator doesn't repaint or provide false signals that disappear on subsequent candles. 3. Complementary Pattern Selection The selected patterns have both: - Statistical significance (high frequency at pivots) - Logical market psychology (reflecting institutional supply/demand changes) For example, Three White Soldiers at a pivot high suggests excessive bullish sentiment reaching exhaustion, while Hammers at pivot lows indicate rejection of lower prices and potential buying pressure. Practical Applications 1. Reversal Trading The primary use is identifying potential market reversals with statistical probability metrics. Higher percentage patterns (like Three White Soldiers at 28.3%) warrant more attention than lower probability patterns. 2. Confirmation Tool The indicator works well when combined with other technical analysis methods: - Support/resistance levels - Trend line breaks - Divergences on oscillators - Volume analysis 3. Risk Management The built-in success rate metrics help traders properly size positions based on historical pattern reliability. The displayed percentages reflect the probability of the pattern successfully predicting a reversal. Optimized Settings Based on extensive testing, the default parameters (Body: 40%, Shadow: 60%, Shadow Maximums: 10%, Lookback: 2) provide the optimal balance between: - Signal frequency - False positive reduction - Early entry opportunities - Pattern clarity Users can adjust these parameters based on their timeframe and trading style, but the defaults represent the statistically optimal configuration. Complementary Research: Reclaim Analysis Additional research on "reclaim" scenarios (where price briefly breaks a level before returning) showed: - Fast reclaims (1-2 candles) have 70-90% success rates - Reclaims with increasing volume have 53.1% success rate vs. decreasing volume at 22.6% This complementary research reinforces the importance of candle patterns and timing at critical market levels. Pine Script®指标由mindyourbuisness提供45
Advanced Candlestick Pattern DetectorWhat Does This Indicator Do? This indicator looks at the way price moves in the market using candlesticks (those red and green bars you see on charts). It tries to find special patterns like Bullish Engulfing, Hammer, Doji, and others. When one of these patterns shows up, the indicator checks a bunch of filters to decide if the pattern is strong enough to be a signal to buy or sell. The Main Parts of the Indicator 1. Candlestick Pattern Detection Bullish Engulfing: Imagine you see a small down candle (red) and then a big up candle (green) that completely “covers” the red one. That’s a bullish engulfing pattern. It can signal that buyers are taking over. Bearish Engulfing: The opposite of bullish engulfing. A small up candle (green) is followed by a big down candle (red) that covers the previous candle. This suggests sellers might be in control. Hammer & Shooting Star: Hammer: A candle with a very short body and a long shadow at the bottom. It shows that buyers stepped in after a drop. Shooting Star: Similar to the hammer but with a long shadow on top. It can indicate that sellers are starting to push the price down. Doji: A candle with almost no body. This means the opening and closing prices are very close. It shows indecision in the market. Harami Patterns (Bullish & Bearish): These are two-candle patterns where the second candle is completely inside the body of the first candle. They signal that the previous trend might be about to change. Morning Star & Evening Star: These are three-candle patterns. Morning Star: Often seen at the bottom of a downtrend, it can signal a reversal to an uptrend. Evening Star: Seen at the top of an uptrend, it can signal that the price may soon go down. 2. Filters: Making the Signals Smarter The indicator doesn’t just rely on patterns. It uses several “filters” to decide if a pattern is strong enough to trade on. Here’s what each filter does: a. Adaptive Thresholds (ATR-Based) What It Is: The indicator uses something called ATR (Average True Range) to see how much the price is moving (volatility). How It Works: Instead of using fixed numbers to decide if a candle is a Hammer or a Doji, it adjusts these numbers based on current market activity. User Settings: Use Adaptive Thresholds: Turn this on to let the indicator adjust automatically. Body Factor, Shadow Factor, Doji Factor: These numbers are multipliers that decide how small or big the body and shadows of the candle should be. You can change them if you want the indicator to be more or less sensitive. b. Volume Filter What It Is: Volume shows how many trades are happening. How It Works: The filter checks if the current volume is higher than the average volume (multiplied by a set factor). This helps ensure that the signal isn’t coming from a very quiet market. User Settings: Use Volume Filter: Turn this on if you want to ignore signals when there’s not much trading. Volume MA Period & Volume Multiplier: These settings determine what “normal” volume is and how much higher the current volume must be to count. c. Multi-Timeframe Trend Filter What It Is: This filter looks at a bigger picture by using a moving average (MA) from a higher timeframe (for example, daily charts). How It Works: For a bullish (buy) signal, the indicator checks if the price is above this MA. For a bearish (sell) signal, the price must be below the MA. User Settings: Use Multi-Timeframe Trend Filter: Enable or disable this filter. Higher Timeframe for Trend: Choose which timeframe (like Daily) to use. Trend MA Type (SMA or EMA) & Trend MA Period: Choose the type of moving average and how many candles to average. d. Additional Trend Filters (ADX & RSI) ADX Filter: What It Is: ADX stands for Average Directional Index. It measures how strong a trend is. How It Works: If the ADX is above a certain threshold, it means the trend is strong. User Setting: ADX Threshold: Set the minimum strength the trend should have. RSI Filter: What It Is: RSI (Relative Strength Index) tells you if the price is overbought (too high) or oversold (too low). How It Works: For a buy signal, RSI should be low (under a set threshold). For a sell signal, RSI should be high (above a set threshold). User Settings: RSI Buy Threshold & RSI Sell Threshold: These set the levels for buying or selling. 3. How the Final Signal Is Determined For a signal (buy or sell) to be generated, the indicator first checks if one of the candlestick patterns is present. Then it goes through all these filters (trend, volume, ADX, RSI). Only if everything is in line will it show: A BUY signal when all bullish conditions are met. A SELL signal when all bearish conditions are met. 4. Visual Elements on the Chart Trend MA Line: A blue line is drawn on your chart showing the moving average from the higher timeframe (if you enable the trend filter). This helps you see the overall direction of the market. Labels on the Chart: When a signal is detected, you’ll see: A BUY label below the candle (green). A SELL label above the candle (red). Background Colors: The chart background might change slightly (green for bullish and red for bearish) to give you a quick visual cue. Histogram: At the bottom, there is a histogram that shows +1 for bullish signals, -1 for bearish signals, and 0 when there’s no clear signal. 5. Alerts Alerts are built into the indicator so you can get a notification when a signal appears. The alert messages are fixed strings, meaning they always say something like “BUY signal on at price .” You can set up these alerts in TradingView to be notified via sound, email, or pop-up. How to Use and Adjust the Filters Deciding on Patterns: You can choose which candlestick patterns you want to detect by toggling the options (e.g., Bullish Engulfing, Hammer, etc.). Adjusting Adaptive Thresholds: If you feel that the indicator is too sensitive (or not sensitive enough) during volatile times, adjust the Body Factor, Shadow Factor, and Doji Factor. These change how the indicator recognizes different candle shapes based on market movement. Volume Filter Settings: Use Volume Filter: Turn this on if you want to ignore signals when there’s not enough trading activity. Adjust the Volume MA Period and Volume Multiplier to change what “normal” volume is for your chart. Multi-Timeframe Trend Filter Settings: Choose a higher timeframe (like Daily) to see the bigger picture trend. Select the type of moving average (SMA or EMA) and its period. This filter ensures you only trade in the direction of the overall trend. ADX & RSI Filters: ADX: Adjust the ADX Threshold if you want to change the minimum strength of the trend needed for a signal. RSI: Set the RSI Buy Threshold (for oversold conditions) and RSI Sell Threshold (for overbought conditions) to refine when a signal is valid. Summary This indicator is like having a smart assistant that not only looks for specific price patterns (candlesticks) but also checks if the overall market conditions are right using several filters. By combining: Pattern Detection Adaptive thresholds (based on ATR) Volume Checks Multi-Timeframe Trend Analysis Additional Trend Strength and Overbought/Oversold Indicators (ADX & RSI) ...it helps you decide if it might be a good time to buy or sell. You can customize each part to fit your trading style, and with the built-in alerts, you can be notified when everything lines up. Feel free to adjust the settings to see how each filter changes the signals on your chart. Experimenting with these will help you learn how the market behaves and how you can best use the indicator for your own strategy! Pine Script®指标由kiemonline2016提供已更新 1153
Harmonic Patterns Library [TradingFinder]🔵 Introduction Harmonic patterns blend geometric shapes with Fibonacci numbers, making these numbers fundamental to understanding the patterns. One person who has done a lot of research on harmonic patterns is Scott Carney.Scott Carney's research on harmonic patterns in technical analysis focuses on precise price structures based on Fibonacci ratios to identify market reversals. Key patterns include the Gartley, Bat, Butterfly, and Crab, each with specific alignment criteria. These patterns help traders anticipate potential market turning points and make informed trading decisions, enhancing the predictability of technical analysis. 🟣 Understanding 5-Point Harmonic Patterns In the current library version, you can easily draw and customize most XABCD patterns. These patterns often form M or W shapes, or a combination of both. By calculating the Fibonacci ratios between key points, you can estimate potential price movements. All five-point patterns share a similar structure, differing only in line lengths and Fibonacci ratios. Learning one pattern simplifies understanding others. 🟣 Exploring the Gartley Pattern The Gartley pattern appears in both bullish (M shape) and bearish (W shape) forms. In the bullish Gartley, point X is below point D, and point A surpasses point C. Point D marks the start of a strong upward trend, making it an optimal point to place a buy order. The bearish Gartley mirrors the bullish pattern with inverted Fibonacci ratios. In this scenario, point D indicates the start of a significant price drop. Traders can place sell orders at this point and buy at lower prices for profit in two-way markets. 🟣 Analyzing the Butterfly Pattern The Butterfly pattern also manifests in bullish (M shape) and bearish (W shape) forms. It resembles the Gartley pattern but with point D lower than point X in the bullish version. The Butterfly pattern involves deeper price corrections than the Gartley, leading to more significant price fluctuations. Point D in the bullish Butterfly indicates the beginning of a sharp price rise, making it an entry point for buy orders. The bearish Butterfly has inverted Fibonacci ratios, with point D marking the start of a sharp price decline, ideal for sell orders followed by buying at lower prices in two-way markets. 🟣 Insights into the Bat Pattern The Bat pattern, appearing in bullish (M shape) and bearish (W shape) forms, is one of the most precise harmonic patterns. It closely resembles the Butterfly and Gartley patterns, differing mainly in Fibonacci levels. The bearish Bat pattern shares the Fibonacci ratios with the bullish Bat, with an inverted structure. Point D in the bearish Bat marks the start of a significant price drop, suitable for sell orders followed by buying at lower prices for profit. 🟣 The Crab Pattern Explained The Crab pattern, found in both bullish (M shape) and bearish (W shape) forms, is highly favored by analysts. Discovered in 2000, the Crab pattern features a larger final wave correction compared to other harmonic patterns. The bearish Crab shares Fibonacci ratios with the bullish version but in an inverted form. Point D in the bearish Crab signifies the start of a sharp price decline, making it an ideal point for sell orders followed by buying at lower prices for profitable trades. 🟣 Understanding the Shark Pattern The Shark pattern appears in bullish (M shape) and bearish (W shape) forms. It differs from previous patterns as point C in the bullish Shark surpasses point A, with unique level measurements. The bearish Shark pattern mirrors the Fibonacci ratios of the bullish Shark but is inverted. Point D in the bearish Shark indicates the start of a sharp price drop, ideal for placing sell orders and buying at lower prices to capitalize on the pattern. 🟣 The Cypher Pattern Overview The Cypher pattern is another that appears in both bullish (M shape) and bearish (W shape) forms. It resembles the Shark pattern, with point C in the bullish Cypher extending beyond point A, and point D forming within the XA line. The bearish Cypher shares the Fibonacci ratios with the bullish Cypher but in an inverted structure. Point D in the bearish Cypher marks the start of a significant price drop, perfect for sell orders followed by buying at lower prices. 🟣 Introducing the Nen-Star Pattern The Nen-Star pattern appears in both bullish (M shape) and bearish (W shape) forms. In the bullish Nen-Star, point C extends beyond point A, and point D, the final point, forms outside the XA line, making CD the longest wave. The bearish Nen-Star has inverted Fibonacci ratios, with point D indicating the start of a significant price drop. Traders can place sell orders at point D and buy at lower prices to profit from this pattern in two-way markets. The 5-point harmonic patterns, commonly referred to as XABCD patterns, are specific geometric price structures identified in financial markets. These patterns are used by traders to predict potential price movements based on historical price data and Fibonacci retracement levels. Here are the main 5-point harmonic patterns : Gartley Pattern Anti-Gartley Pattern Bat Pattern Anti-Bat Pattern Alternate Bat Pattern Butterfly Pattern Anti-Butterfly Pattern Crab Pattern Anti-Crab Pattern Deep Crab Pattern Shark Pattern Anti- Shark Pattern Anti Alternate Shark Pattern Cypher Pattern Anti-Cypher Pattern 🔵 How to Use To add "Order Block Refiner Library", you must first add the following code to your script. import TFlab/Harmonic_Chart_Pattern_Library_TradingFinder/1 as HP 🟣 Parameters XABCD(Name, Type, Show, Color, LineWidth, LabelSize, ShVF, FLPC, FLPCPeriod, Pivot, ABXAmin, ABXAmax, BCABmin, BCABmax, CDBCmin, CDBCmax, CDXAmin, CDXAmax) => Parameters: Name (string) Type (string) Show (bool) Color (color) LineWidth (int) LabelSize (string) ShVF (bool) FLPC (bool) FLPCPeriod (int) Pivot (int) ABXAmin (float) ABXAmax (float) BCABmin (float) BCABmax (float) CDBCmin (float) CDBCmax (float) CDXAmin (float) CDXAmax (float) 🟣 Genaral Parameters Name : The name of the pattern. Type: Enter "Bullish" to draw a Bullish pattern and "Bearish" to draw an Bearish pattern. Show : Enter "true" to display the template and "false" to not display the template. Color : Enter the desired color to draw the pattern in this parameter. LineWidth : You can enter the number 1 or numbers higher than one to adjust the thickness of the drawing lines. This number must be an integer and increases with increasing thickness. LabelSize : You can adjust the size of the labels by using the "size.auto", "size.tiny", "size.smal", "size.normal", "size.large" or "size.huge" entries. 🟣 Logical Parameters ShVF : If this parameter is on "true" mode, only patterns will be displayed that they have exact format and no noise can be seen in them. If "false" is, the patterns displayed that maybe are noisy and do not exactly correspond to the original pattern. FLPC : if Turned on, you can see this ability of patterns when their last pivot is formed. If this feature is off, it will see the patterns as soon as they are formed. The advantage of this option being clear is less formation of fielded patterns, and it is accompanied by the lateest pattern seeing and a sharp reduction in reward to risk. FLPCPeriod : Using this parameter you can determine that the last pivot is based on Pivot period. Pivot : You need to determine the period of the zigzag indicator. This factor is the most important parameter in pattern recognition. ABXAmin : Minimum retracement of "AB" line compared to "XA" line. ABXAmax : Maximum retracement of "AB" line compared to "XA" line. BCABmin : Minimum retracement of "BC" line compared to "AB" line. BCABmax : Maximum retracement of "BC" line compared to "AB" line. CDBCmin : Minimum retracement of "CD" line compared to "BC" line. CDBCmax : Maximum retracement of "CD" line compared to "BC" line. CDXAmin : Minimum retracement of "CD" line compared to "XA" line. CDXAmax : Maximum retracement of "CD" line compared to "XA" line. 🟣 Function Outputs This library has two outputs. The first output is related to the alert of the formation of a new pattern. And the second output is related to the formation of the candlestick pattern and you can draw it using the "plotshape" tool. Candle Confirmation Logic : Example : import TFlab/Harmonic_Chart_Pattern_Library_TradingFinder/1 as HP PP = input.int(3, 'ZigZag Pivot Period') ShowBull = input.bool(true, 'Show Bullish Pattern') ShowBear = input.bool(true, 'Show Bearish Pattern') ColorBull = input.color(#0609bb, 'Color Bullish Pattern') ColorBear = input.color(#0609bb, 'Color Bearish Pattern') LineWidth = input.int(1 , 'Width Line') LabelSize = input.string(size.small , 'Label size' , options = ) ShVF = input.bool(false , 'Show Valid Format') FLPC = input.bool(false , 'Show Formation Last Pivot Confirm') FLPCPeriod =input.int(2, 'Period of Formation Last Pivot') //Call function = HP.XABCD('Bullish Bat', 'Bullish', ShowBull, ColorBull , LineWidth, LabelSize ,ShVF, FLPC, FLPCPeriod, PP, 0.382, 0.50, 0.382, 0.886, 1.618, 2.618, 0.85, 0.9) = HP.XABCD('Bearish Bat', 'Bearish', ShowBear, ColorBear , LineWidth, LabelSize ,ShVF, FLPC, FLPCPeriod, PP, 0.382, 0.50, 0.382, 0.886, 1.618, 2.618, 0.85, 0.9) //Alert if BearAlert alert('Bearish Harmonic') if BullAlert alert('Bulish Harmonic') //CandleStick Confirm plotshape(BearCandleConfirm, style = shape.arrowdown, color = color.red) plotshape(BullCandleConfirm, style = shape.arrowup, color = color.green, location = location.belowbar ) Pine Script®库由TFlab提供已更新 88217
W and M Pattern with Trend AlertThis script detects W and M patterns in price action and alerts the trader when these patterns occur, providing potential trading opportunities. W Pattern: A W pattern forms when the price creates two bottoms, separated by a higher low in the middle. It often indicates a reversal from a downtrend to an uptrend. The script plots a green line at the neckline of the W pattern. M Pattern: An M pattern forms when the price creates two tops, separated by a lower high in the middle. It often indicates a reversal from an uptrend to a downtrend. The script plots a red line at the neckline of the M pattern. Key Features: Alerts: The script generates alerts when W or M patterns are detected, allowing traders to stay informed of potential trading opportunities. Recent Breakout: W and M pattern lines are drawn only after the recent breakout of support or resistance levels, helping traders focus on current market conditions. Visual Representation: The script visually represents W and M patterns with vertical lines at the neckline, making it easier for traders to identify potential reversal points. Usage: Watch for alerts indicating the detection of W or M patterns. Verify the pattern visually on the chart, paying attention to recent support or resistance levels. Consider entering a trade based on the direction suggested by the pattern (e.g., long on W pattern, short on M pattern), using additional technical analysis to confirm the trade setup.Pine Script®指标由luin05提供55333
Auto Chart Patterns [Trendoscope®]🎲 Introducing our most comprehensive automatic chart pattern recognition indicator. Last week, we published an idea on how to algorithmically identify and classify chart patterns. This indicator is nothing but the initial implementation of the idea. Whatever we explained in that publication that users can do manually to identify and classify the pattern, this indicator will do it for them. 🎲 Process of identifying the patterns. The bulk of the logic is implemented as part of the library - chartpatterns . The indicator is a shell that captures the user inputs and makes use of the library to deliver the outcome. 🎯 Here is the list of steps executed to identify the patterns on the chart. Derive multi level recursive zigzag for multiple base zigzag length and depth combinations. For each zigzag and level, check the last 5 pivots or 6 pivots (based on the input setting) for possibility of valid trend line pairs. If there is a valid trend line pair, then there is pattern. 🎯 Rules for identifying the valid trend line pairs There should be at least two trend lines that does not intersect between the starting and ending pivots. The upper trend line should touch all the pivot highs of the last 5 or 6 pivots considered for scanning the patterns The lower trend line should touch all the pivot lows of the last 5 or 6 pivots considered for scanning the patterns. None of the candles from starting pivot to ending pivot should fall outside the trend lines (above upper trend line and below lower trend line) The existence of a valid trend line pair signifies the existence of pattern. What type of pattern it is, to identify that we need to go through the classification rules. 🎲 Process of classification of the patterns. We need to gather the following information before we classify the pattern. Direction of upper trend line - rising, falling or flat Direction of lower trend line - rising, falling or flat Characteristics of trend line pair - converging, expanding, parallel 🎯 Broader Classifications Broader classification would include the following types. 🚩 Classification Based on Geometrical Shapes This includes Wedges - both trend lines are moving in the same direction. But, the trend lines are either converging or diverging and not parallel to each other. Triangles - trend lines are moving in different directions. Naturally, they are either converging or diverging. Channels - Both trend lines are moving in the same direction, and they are parallel to each other within the limits of error. 🚩 Classification Based on Pattern Direction This includes Ascending/Rising Patterns - No trend line is moving in the downward direction and at least one trend line is moving upwards Descending/Falling Patterns - No trend line is moving in the upward direction, and at least one trend line is moving downwards. Flat - Both Trend Lines are Flat Bi-Directional - Both trend lines are moving in opposite direction and none of them is flat. 🚩 Classification Based on Formation Dynamics This includes Converging Patterns - Trend Lines are converging towards each other Diverging Patterns - Trend Lines are diverging from each other Parallel Patterns - Trend Lines are parallel to each others 🎯 Individual Pattern Types Now we have broader classifications. Let's go through in detail to find out fine-grained classification of each individual patterns. 🚩 Ascending/Uptrend Channel This pattern belongs to the broader classifications - Ascending Patterns, Parallel Patterns and Channels. The rules for the Ascending/Uptrend Channel pattern are as below Both trend lines are rising Trend lines are parallel to each other 🚩 Descending/Downtrend Channel This pattern belongs to the broader classifications - Descending Patterns, Parallel Patterns and Channels. The rules for the Descending/Downtrend Channel pattern are as below Both trend lines are falling Trend lines are parallel to each other 🚩 Ranging Channel This pattern belongs to the broader classifications - Flat Patterns, Parallel Patterns and Channels. The rules for the Ranging Channel pattern are as below Both trend lines are flat Trend lines are parallel to each other 🚩 Rising Wedge - Expanding This pattern belongs to the broader classifications - Rising Patterns, Diverging Patterns and Wedges. The rules for the Expanding Rising Wedge pattern are as below Both trend lines are rising Trend Lines are diverging. 🚩 Rising Wedge - Contracting This pattern belongs to the broader classifications - Rising Patterns, Converging Patterns and Wedges. The rules for the Contracting Rising Wedge pattern are as below Both trend lines are rising Trend Lines are converging. 🚩 Falling Wedge - Expanding This pattern belongs to the broader classifications - Falling Patterns, Diverging Patterns and Wedges. The rules for the Expanding Falling Wedge pattern are as below Both trend lines are falling Trend Lines are diverging. 🚩 Falling Wedge - Contracting This pattern belongs to the broader classifications - Falling Patterns, Converging Patterns and Wedges. The rules for the Converging Falling Wedge are as below Both trend lines are falling Trend Lines are converging. 🚩 Rising/Ascending Triangle - Expanding This pattern belongs to the broader classifications - Rising Patterns, Diverging Patterns and Triangles. The rules for the Expanding Ascending Triangle pattern are as below The upper trend line is rising The lower trend line is flat Naturally, the trend lines are diverging from each other 🚩 Rising/Ascending Triangle - Contracting This pattern belongs to the broader classifications - Rising Patterns, Converging Patterns and Triangles. The rules for the Contracting Ascending Triangle pattern are as below The upper trend line is flat The lower trend line is rising Naturally, the trend lines are converging. 🚩 Falling/Descending Triangle - Expanding This pattern belongs to the broader classifications - Falling Patterns, Diverging Patterns and Triangles. The rules for the Expanding Descending Triangle pattern are as below The upper trend line is flat The lower trend line is falling Naturally, the trend lines are diverging from each other 🚩 Falling/Descending Triangle - Contracting This pattern belongs to the broader classifications - Falling Patterns, Converging Patterns and Triangles. The rules for the Contracting Descending Triangle pattern are as below The upper trend line is falling The lower trend line is flat Naturally, the trend lines are converging. 🚩 Converging Triangle This pattern belongs to the broader classifications - Bi-Directional Patterns, Converging Patterns and Triangles. The rules for the Converging Triangle pattern are as below The upper trend line is falling The lower trend line is rising Naturally, the trend lines are converging. 🚩 Diverging Triangle This pattern belongs to the broader classifications - Bi-Directional Patterns, Diverging Patterns and Triangles. The rules for the Diverging Triangle pattern are as below The upper trend line is rising The lower trend line is falling Naturally, the trend lines are diverging from each other. 🎲 Indicator Settings - Auto Chart Patterns 🎯 Zigzag Settings Zigzag settings allow users to select the number of zigzag combinations to be used for pattern scanning, and also allows users to set zigzag length and depth combinations. 🎯 Scanning Settings Number of Pivots - This can be either 5 or 6. Represents the number of pivots used for identification of patterns. Error Threshold - Error threshold used for initial trend line validation. Flat Threshold - Flat angle threshold is used to identify the slope and direction of trend lines. Last Pivot Direction - Filters patterns based on the last pivot direction. The values can be up, down, both, or custom. When custom is selected, then the individual pattern specific last pivot direction setting is used instead of the generic one. Verify Bar Ratio - Provides option to ignore extreme patterns where the ratios of zigzag lines are not proportionate to each other. Avoid Overlap - When selected, the patterns that overlap with existing patterns will be ignored while scanning. Meaning, if the new pattern starting point falls between the start and end of an existing pattern, it will be ignored. 🎯 Group Classification Filters Allows users to enable disable patterns based on group classifications. 🚩 Geometric Shapes Based Classifications Wedges - Rising Wedge Expanding, Falling Wedge Expanding, Rising Wedge Contracting, Falling Wedge Contracting. Channels - Ascending Channel, Descending Channel, Ranging Channel Triangles - Converging Triangle, Diverging Triangle, Ascending Triangle Expanding, Descending Triangle Expanding, Ascending Triangle Contrcting and Descending Triangle Contracting 🚩 Direction Based Classifications Rising - Rising Wedge Contracting, Rising Wedge Expanding, Ascending Triangle Contracting, Ascending Triangle Expanding and Ascending Channel Falling - Falling Wedge Contracting, Falling Wedge Expanding, Descending Triangle Contracting, Descending Triangle Expanding and Descending Channel Flat/Bi-directional - Ranging Channel, Converging Triangle, Diverging Triangle 🚩 Formation Dynamics Based Classifications Expanding - Rising Wedge Expanding, Falling Wedge Expanding, Ascending Triangle Expanding, Descending Triangle Expanding, Diverging Triangle Contracting - Rising Wedge Contracting, Falling Wedge Contracting, Ascending Triangle Contracting, Descending Triangle Contracting, Converging Triangle Parallel - Ascending Channel, Descending Channgel and Ranging Channel 🎯 Individual Pattern Filters These settings allow users to enable/disable individual patterns and also set last pivot direction filter individually for each pattern. Individual Last Pivot direction filters are only considered if the main "Last Pivot Direction" filter is set to "custom" 🎯 Display Settings These are the settings that determine the indicator display. The details are provided in the tooltips and are self explanatory. 🎯 Alerts A basic alert message is enabled upon detection of new pattern on the chart.Pine Script®指标由Trendoscope提供已更新 139139 19 K
Custom Pattern DetectionOverview Chart Patterns is a major tool for many traders. Pattern formation at specific location on the chart is used for investment/trading decisions. This indicator is designed in a way to allow investors/traders to define patterns of their choice based on certain input parameters and then detect defined pattern on the chart. Investors/traders can use their own creativity to create and detect patterns. This indicator works in 2 modes Create Pattern: One can define a pattern and verify sample pattern formation visually Detect Pattern: Detect and mark patterns on the chart Settings Create Custom Pattern: Show Custom Pattern – This will mark the pattern lines on the chart so that one can verify how pattern appears based on the input’s parameters provided for lines XA, AB, BC, CD, DE, EF Offset – Used while pattern creation. Offset is horizonal distance between 2 lines. XA Points – Used to draw XA line when sample pattern is drawn. XA points can be a negative or position number. XA line is drawn based on Offset and XA Points. E.g. Offset = 5 and XA Points = -20. In this line would be drawn from last candle high to high – 20 (these are y1 and y2 points of a line). While drawing line distance of 5 candles would be placed between 2 line points (these are x1 and x2 points of a line). In XA line X forms start point and A forms end point of the line. Line AB – Line AB is drawn from point X. To derive the end point of AB, average Fib% is derived based on From Fib% and To Fib% parameters. Finally end point is derived by applying Fib Retracement on Line XA based on average Fib%. Line AB to Line EF – These points are derived as explained in Line AB. The indicator can be used to define/create patterns up to 6 legs/lines. The line would be named as XA -> AB -> BC -> CD -> DE -> EF. If one wish to create pattern consisting 3 legs then it can be achieved by unchecking/deselecting Line CD, DE and EF or by checking only Line AB and BC. Based on the parameters above indicator draws a sample pattern after last candle/bar on the chart. Sample pattern helps to visually see how pattern will appear on the chart. Pattern Identification Indicator derive the swing high/low points based on the Pivot lookback and use as reference points while detecting patterns. Use of From Fib% and To Fib% - While detecting pattern, retracement price points are derived for From Fib% and To Fib%. Price points between from Fib% and To Fib% are treated as valid retracement points. How to configure and use indicator for detecting patterns Sample Pattern 1 Sample Pattern 2 Sample Pattern 3 Sample Pattern 4 Pine Script®指标由Sharad_Gaikwad提供3434 4.1 K