Enigma Sniper 369The "Enigma Sniper 369" is a custom-built Pine Script indicator designed for TradingView, tailored specifically for forex traders seeking high-probability entries during high-volatility market sessions.
Unlike generic trend-following or scalping tools, this indicator uniquely combines session-based "kill zones" (London and US sessions), momentum-based candle analysis, and an optional EMA trend filter to pinpoint liquidity grabs and reversal opportunities.
Its originality lies in its focus on liquidity hunting—identifying levels where stop losses are likely clustered (around swing highs/lows and wick midpoints)—and providing visual entry zones that are dynamically removed once price breaches them, reducing clutter and focusing on actionable signals.
The name "369" reflects the structured approach of three key components (session timing, candle logic, and trend filter) working in harmony to snipe precise entries.
What It Does
"Enigma Sniper 369" identifies potential buy and sell opportunities by drawing two types of horizontal lines on the chart during user-defined London and US
session kill zones:
Solid Lines: Mark the swing low (for buys) or swing high (for sells) of a trigger candle, indicating a potential entry point where stop losses might be clustered.
Dotted Lines: Mark the 50% level of the candle’s wick (lower wick for buys, upper wick for sells), serving as a secondary confirmation zone for entries or tighter stop-loss placement.
These lines are plotted only when specific candle conditions are met within the kill zones, and they are automatically deleted once the price crosses them, signaling that the liquidity at that level has likely been grabbed. The indicator also includes an optional EMA filter to ensure trades align with the broader trend, reducing false signals in choppy markets.
How It Works
The indicator’s logic is built on a multi-layered approach:
Kill Zone Timing: Trades are only considered during user-defined London and US session hours (e.g., London from 02:00 to 12:00 UTC, as seen in the screenshots). These sessions are known for high volatility and liquidity, making them ideal for capturing institutional moves.
Candle-Based Momentum Logic:
Buy Signal: A candle must close above its midpoint (indicating bullish momentum) and have a lower low than the previous candle (suggesting a potential liquidity grab below the previous swing low). This is expressed as close > (high + low) / 2 and low < low .
Sell Signal: A candle must close below its midpoint (bearish momentum) and have a higher high than the previous candle (indicating a potential liquidity grab above the previous swing high), expressed as close < (high + low) / 2 and high > high .
These conditions ensure the indicator targets candles that break recent structure to hunt stop losses while showing directional momentum.
Optional EMA Filter: A 50-period EMA (customizable) can be enabled to filter signals based on trend direction.
Buy signals are only generated if the EMA is trending upward (ema_value > ema_value ), and sell signals require a downward EMA trend (ema_value < ema_value ). This reduces noise by aligning entries with the broader market trend.
Liquidity Levels and Deletion Logic:
For a buy signal, a solid green line is drawn at the candle’s low, and a dotted green line at the 50% level of the lower wick (from the candle body’s bottom to the low).
For a sell signal, a solid red line is drawn at the candle’s high, and a dotted red line at the 50% level of the upper wick (from the body’s top to the high).
These lines extend to the right until the price crosses them, at which point they are deleted, indicating the liquidity at that level has been taken (e.g., stop losses triggered).
Alerts: The indicator includes alert conditions for buy and sell signals, notifying traders when a new setup is identified.
Underlying Concepts
The indicator is grounded in the concept of liquidity hunting, a strategy often employed by institutional traders. Markets frequently move to levels where stop losses are clustered—typically just beyond swing highs or lows—before reversing in the opposite direction. The "Enigma Sniper 369" targets these moves by identifying candles that break structure (e.g., a lower low or higher high) during high-volatility sessions, suggesting a potential sweep of stop losses. The 50% wick level acts as a secondary confirmation, as this midpoint often represents a zone where tighter stop losses are placed by retail traders. The optional EMA filter adds a trend-following element, ensuring entries are taken in the direction of the broader market momentum, which is particularly useful on lower timeframes like the 15-minute chart shown in the screenshots.
How to Use It
Here’s a step-by-step guide based on the provided usage example on the GBP/USD 15-minute chart:
Setup the Indicator: Add "Enigma Sniper 369" to your TradingView chart. Adjust the London and US session hours to match your timezone (e.g., London from 02:00 to 12:00 UTC, US from 13:00 to 22:00 UTC). Customize the EMA period (default 50) and line styles/colors if desired.
Identify Kill Zones: The indicator highlights the London session in light green and the US session in light purple, as seen in the screenshots. Focus on these periods for signals, as they are the most volatile and likely to produce liquidity grabs.
Wait for a Signal: Look for solid and dotted lines to appear during the kill zones:
Buy Setup: A solid green line at the swing low and a dotted green line at the 50% lower wick level indicate a potential buy. This suggests the market may have grabbed liquidity below the swing low and is now poised to move higher.
Sell Setup: A solid red line at the swing high and a dotted red line at the 50% upper wick level indicate a potential sell, suggesting liquidity was taken above the swing high.
Place Your Trade:
For a buy, set a buy limit order at the dotted green line (50% wick level), as this is a more conservative entry point. Place your stop loss just below the solid green line (swing low) to cover the full swing. For example, in the screenshots, the market retraces to the dotted line at 1.32980 after a liquidity grab below the swing low, triggering a buy limit order.
For a sell, set a sell limit order at the dotted red line, with a stop loss just above the solid red line.
Monitor Price Action: Once the price crosses a line, it is deleted, indicating the liquidity at that level has been taken. In the screenshots, after the buy limit is triggered, the market moves higher, confirming the setup. The caption notes, “The market returns and tags us in long with a buy limit,” highlighting this retracement strategy.
Additional Context: Use the indicator to identify liquidity levels that may be targeted later. For example, the screenshot notes, “If a new session is about to open I will wait for the grab liquidity to go long,” showing how the indicator can be used to anticipate future moves at session opens (e.g., London open at 1.32980).
Risk Management: Always set a stop loss below the swing low (for buys) or above the swing high (for sells) to protect against adverse moves. The 50% wick level helps tighten entries, improving the risk-reward ratio.
Practical Example
On the GBP/USD 15-minute chart, during the London session (02:00 UTC), the indicator identifies a buy setup with a solid green line at 1.32901 (swing low) and a dotted green line at 1.32980 (50% wick level). The market initially dips below the swing low, grabbing liquidity, then retraces to the dotted line, triggering a buy limit order. The price subsequently rises to 1.33404, yielding a profitable trade. The user notes, “The logic is in the last candle it provides new level to go long,” emphasizing the indicator’s ability to identify fresh levels after a liquidity sweep.
Customization Tips
Adjust the EMA period to suit your timeframe (e.g., a shorter period like 20 for faster signals on lower timeframes).
Modify the session hours to align with your broker’s timezone or specific market conditions.
Use the alert feature to get notified of new setups without constantly monitoring the chart.
Why It’s Useful for Traders
The "Enigma Sniper 369" stands out by combining session timing, momentum-based candle analysis, and liquidity hunting into a single tool. It provides clear, actionable levels for entries and stop losses, removes invalid signals dynamically, and aligns trades with high-probability market conditions. Whether you’re a scalper looking for quick moves during London open or a swing trader targeting session-based reversals, this indicator offers a structured, data-driven approach to trading.
在脚本中搜索"price action"

[TehThomas] - ICT Inversion Fair value Gap (IFVG) The Inversion Fair Value Gap (IFVG) indicator is a powerful tool designed for traders who utilize ICT (Inner Circle Trader) strategies. It focuses on identifying and displaying Inversion Fair Value Gaps, which are critical zones that emerge when traditional Fair Value Gaps (FVGs) are invalidated by price action. These gaps represent key areas where price often reacts, making them essential for identifying potential reversals, trend continuations, and liquidity zones.
What Are Inversion Fair Value Gaps?
Inversion Fair Value Gaps occur when price revisits a traditional FVG and breaks through it, effectively flipping its role in the market. For example:
A bullish FVG that is invalidated becomes a bearish zone, often acting as resistance.
A bearish FVG that is invalidated transforms into a bullish zone, serving as support.
These gaps are significant because they often align with institutional trading activity. They highlight areas where large orders have been executed or where liquidity has been targeted. Understanding these gaps provides traders with a deeper insight into market structure and helps them anticipate future price movements with greater accuracy.
Why This Strategy Works
The IFVG concept is rooted in ICT principles, which emphasize liquidity dynamics, market inefficiencies, and institutional order flow. Traditional FVGs represent imbalances in price action caused by gaps between candles. When these gaps are invalidated, they become inversion zones that can act as magnets for price. These zones frequently serve as high-probability areas for price reversals or trend continuations.
This strategy works because it aligns with how institutional traders operate. Inversion gaps often mark areas of interest for "smart money," making them reliable indicators of potential market turning points. By focusing on these zones, traders can align their strategies with institutional behavior and improve their overall trading edge.
How the Indicator Works
This indicator simplifies the process of identifying and tracking IFVGs by automating their detection and visualization on the chart. It scans the chart in real-time to identify bullish and bearish FVGs that meet user-defined thresholds for inversion. Once identified, these gaps are dynamically displayed on the chart with distinct colors for bullish and bearish zones.
The indicator also tracks whether these gaps are mitigated or broken by price action. When an IFVG is broken, it extends the zone for a user-defined number of bars to visualize its potential role as a new support or resistance level. Additionally, alerts can be enabled to notify traders when new IFVGs form or when existing ones are broken, ensuring timely decision-making in fast-moving markets.
Key Features
Automatic Detection: The indicator automatically identifies bullish and bearish IFVGs based on user-defined thresholds.
Dynamic Visualization: It displays IFVGs directly on the chart with customizable colors for easy differentiation.
Real-Time Updates: The status of each IFVG is updated dynamically based on price action.
Zone Extensions: Broken IFVGs are extended to visualize their potential as support or resistance levels.
Alerts: Notifications can be set up to alert traders when key events occur, such as the formation or breaking of an IFVG.
These features make the tool highly efficient and reduce the need for manual analysis, allowing traders to focus on execution rather than tedious chart work.
Benefits of Using This Indicator
The IFVG indicator offers several advantages that make it an indispensable tool for ICT traders. By automating the detection of inversion gaps, it saves time and reduces errors in analysis. The clearly defined zones improve risk management by providing precise entry points, stop-loss levels, and profit targets based on market structure.
This tool is also highly versatile and adapts seamlessly across different timeframes. Whether you’re scalping lower timeframes or swing trading higher ones, it provides actionable insights tailored to your trading style. Furthermore, by aligning your strategy with institutional logic, you gain a significant edge in anticipating market movements.
Practical Applications
This indicator can be used across various trading styles:
Scalping: Identify quick reversal points on lower timeframes using real-time alerts.
Day Trading: Use inversion gaps as key levels for intraday support/resistance or trend continuation setups.
Swing Trading: Analyse higher timeframes to identify major inversion zones that could act as critical turning points in larger trends.
By integrating this tool into your trading routine, you can streamline your analysis process and focus on executing high-probability setups.
Conclusion
The Inversion Fair Value Gap (IFVG) indicator is more than just a technical analysis tool—it’s a strategic ally for traders looking to refine their edge in the markets. By automating the detection and tracking of inversion gaps based on ICT principles, it simplifies complex market analysis while maintaining accuracy and depth. Whether you’re new to ICT strategies or an experienced trader seeking greater precision, this indicator will elevate your trading game by aligning your approach with institutional behavior.
If you’re serious about improving your trading results while saving time and effort, this tool is an essential addition to your toolkit. It provides clarity in chaotic markets, enhances precision in trade execution, and ensures you never miss critical opportunities in your trading journey.
__________________________________________
Thanks for your support!
If you found this idea helpful or learned something new, drop a like 👍 and leave a comment, I’d love to hear your thoughts! 🚀
Make sure to follow me for more price action insights, free indicators, and trading strategies. Let’s grow and trade smarter together! 📈

G. Santostasi Power Law Cycle Comparison
G. Santostasi Power Law Cycle Comparison Indicator
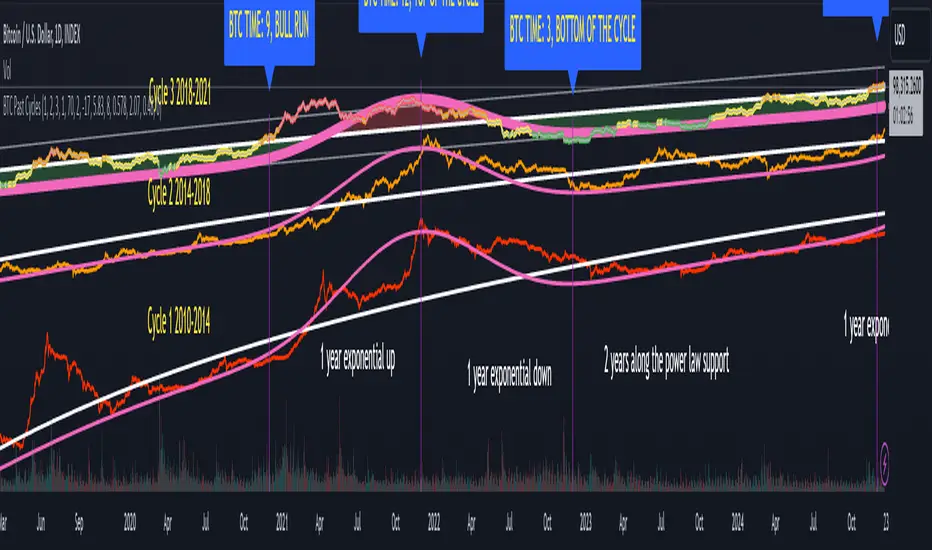
The "G. Santostasi Power Law Cycle Comparison" indicator is a revolutionary tool designed to provide deep insights into Bitcoin's historical price behavior, based on the renowned G. Santostasi power law model. This indicator goes beyond simple trend analysis, leveraging the power law model to analyze Bitcoin's cyclical patterns by shifting and superimposing past cycles onto the current price action.
Key Features and Insights:
Cycle-Based Comparison:
The indicator divides each Bitcoin cycle into three distinct phases:
Exponential Growth Phase (Year 1): A year of near-exponential price appreciation, often associated with the post-halving effect and the inflow of new market participants.
Exponential Correction Phase (Year 2): A sharp, quasi-exponential price decline as the market corrects from speculative highs.
Power Law Growth Phase (Years 3 and 4): A steady and predictable price increase along the power law support line, representing Bitcoin’s intrinsic long-term value trajectory.
Visual Clarity:
By overlaying past cycles onto the current cycle, the indicator highlights recurring patterns, making it easy for investors to identify similarities and deviations in price behavior. This visual comparison helps pinpoint where we are within the current cycle.
Orientation Tool for Investors:
Provides a "map" of Bitcoin's price action across cycles, enabling investors to orient themselves and make more informed decisions.
Helps distinguish between short-term noise and long-term trends, offering a broader perspective on Bitcoin’s price trajectory.
Consistency and Coherence:
The indicator’s ability to show how Bitcoin cycles adhere to a consistent framework underscores its robustness and reliability. The distinct phases of growth, correction, and stabilization align perfectly with the power law model, offering a coherent narrative of Bitcoin’s market dynamics.
Utility for Risk Management and Strategy:
Investors can use this indicator to anticipate major price movements, identify overbought or oversold conditions within the context of the cycle, and plan entry or exit points based on historical patterns.
Uniqueness of the Indicator:
Unlike traditional indicators that focus solely on momentum or trend, the G. Santostasi Power Law Cycle Comparison is rooted in a scientific approach. By applying the power law model to Bitcoin's cyclical behavior, this tool offers unparalleled insights into the underlying mechanics of price action. The ability to compare current price dynamics with past cycles provides a unique perspective, revealing patterns that are often missed by conventional technical analysis.
Who Should Use This Indicator?
Long-Term Investors: Gain confidence in understanding Bitcoin’s price action over its multi-year cycles.
Active Traders: Identify key phases within the cycle to time market entries and exits.
Analysts and Researchers: Explore the fundamental consistency of Bitcoin’s power law behavior across cycles.
The "G. Santostasi Power Law Cycle Comparison" indicator is not just a tool; it’s a lens through which Bitcoin’s intricate market cycles can be viewed, understood, and navigated. By aligning historical context with current price action, this indicator empowers investors with clarity, foresight, and actionable insights.
SiCInside Sweep Close (ISC):
This concept captures a specific price action behavior and can help refine trading strategies for better precision. Here's a detailed explanation:
Inside:
The closing price of the candle stays within the range of the previous candle.
This indicates a containment of price action, suggesting indecision or preparation for a significant move.
Sweep:
The wick of the candle takes out (or "sweeps") the low (or high) of the previous candle.
This sweep can trigger stop-losses of retail traders or activate pending orders, often used by smart money strategies.
Close:
The candle ultimately closes inside the range of the previous candle.
This close signifies that the sweep was a liquidity grab rather than a genuine breakout, providing an actionable trading signal.
How ISC Can Be Used in Trading:
Liquidity Grab Recognition:
ISC can indicate when liquidity is swept from the market, making it an ideal entry point for traders anticipating a reversal or continuation.
Smart Money Concept (SMC) Synergy:
If you follow SMC principles, ISC aligns with key concepts like liquidity sweeps, order blocks, and mitigation zones.
Risk Management:
By identifying the ISC setup, you can place tighter stop-loss levels just outside the sweep, optimizing risk-reward ratios.
Entry Signals:
When you spot an ISC, you can enter trades at the close of the candle, anticipating a move in the direction opposite to the sweep.
Example of ISC in Action:
Imagine a bearish candle:
The wick sweeps the low of the previous candle, possibly triggering stop-losses.
However, the close stays inside the previous candle’s range.
This setup might indicate a reversal, where price moves upward after grabbing liquidity.
Why This Name Works:
It’s concise, professional, and directly linked to the trading action you’re describing.
The short form, ISC, is easy to remember and discuss within trading circles or while teaching others.
It ties into widely known concepts like smart money, price action, and liquidity sweeps, making it relatable yet unique.
Does this align with how you envision using the concept? Let me know if you’d like more refinements or visual examples!

Artaking 2Components of the Indicator:
Moving Averages:
Short-Term Moving Average (MA): This is a 50-period Simple Moving Average (SMA) applied to the closing price. It is used to track the short-term trend of the market.
Long-Term Moving Average (MA): This is a 200-period SMA used to track the long-term trend.
Day Trading Moving Average: A 20-period SMA is used specifically for day trading signals, focusing on shorter-term price movements.
Purpose:
The crossing of these moving averages (short-term crossing above or below long-term) provides basic buy and sell signals, indicative of potential trend reversals or continuations.
ADX (Average Directional Index) for Trend Strength:
ADX Calculation: The ADX is calculated using a 14-period length with 14-period smoothing. The ADX value indicates the strength of a trend, regardless of direction.
Strong Trend Condition: The indicator considers a trend to be strong if the ADX value is above 25. This threshold helps filter out trades during weak or sideways markets.
Purpose:
To ensure that the strategy only generates signals when there is a strong trend, thus avoiding whipsaws in low volatility or range-bound conditions.
Support Levels:
Support Level Calculation: The indicator calculates the lowest close over the last 100 periods. This level is used to identify significant support zones where the price might find a floor.
Purpose:
Support levels are critical in identifying potential areas where the price might bounce, making them ideal for setting stop losses or identifying buy opportunities.
Volatility Spike (Proxy for News Trading):
ATR (Average True Range) Calculation: The indicator uses a 14-period ATR to measure market volatility. A volatility spike is identified when the ATR is greater than 1.5 times the 14-period SMA of the ATR.
Purpose:
This serves as a proxy for news events or other sudden market movements that could make the market unpredictable. The indicator avoids generating signals during these periods to reduce the risk of being caught in a volatile, potentially news-driven move.
Fibonacci Retracement Levels:
61.8% Fibonacci Level: Calculated from the highest high and lowest low over the long MA period, this retracement level is widely regarded as a significant support or resistance level.
Purpose:
Position traders often use Fibonacci levels to identify potential reversal points. The indicator incorporates the 61.8% level to fine-tune entries and exits.
Candlestick Patterns for Price Action Trading:
Bullish Engulfing Pattern: A bullish reversal pattern where a green candle fully engulfs the previous red candle.
Bearish Engulfing Pattern: A bearish reversal pattern where a red candle fully engulfs the previous green candle.
Purpose:
These patterns are classic signals used in price action trading to identify potential reversals at key levels, especially when they align with other conditions like support/resistance or Fibonacci levels.
Signal Generation:
The indicator generates buy and sell signals by combining the above elements:
Buy Signal:
A buy signal is triggered when:
The short-term MA crosses above the long-term MA (indicating a potential uptrend).
The trend is strong (ADX > 25).
The current price is near or below the 61.8% Fibonacci retracement level, suggesting a potential reversal.
No significant volatility spike is detected, ensuring the market isn’t reacting unpredictably to news.
Sell Signal:
A sell signal is triggered when:
The short-term MA crosses below the long-term MA (indicating a potential downtrend).
The trend is strong (ADX > 25).
The current price is near or above the 61.8% Fibonacci retracement level, suggesting potential resistance.
No significant volatility spike is detected.
Day Trading Signals:
Independent of the main trend signals, the indicator also generates intraday buy and sell signals when the price crosses above or below the 20-period day trading MA.
Price Action Signals:
The indicator can trigger buy or sell signals based purely on price action, such as the occurrence of bullish or bearish engulfing patterns. This is optional and can be enabled or disabled.
Alerts:
The indicator includes built-in alert conditions that notify the trader when a buy or sell signal is generated. This allows traders to act immediately without having to constantly monitor the charts.
Practical Application:
This indicator is versatile and can be used across various trading styles:
Position Trading: The long-term MA, Fibonacci retracement, and ADX provide a solid foundation for identifying long-term trends and potential entry/exit points.
Day Trading: The short-term MA and day trading MA offer quick signals for intraday trading.
Price Action: Candlestick pattern recognition allows for precise entry points based on market sentiment and behavior.
News Trading: The volatility spike filter helps avoid trading during periods of market instability, often driven by news events.
Conclusion:
The Comprehensive Trading Strategy Indicator is a robust tool designed to help traders navigate various market conditions by integrating multiple strategies into a single, coherent framework. It provides clear, actionable signals while filtering out potentially dangerous trades during volatile or weak market conditions. Whether you're a long-term trader, a day trader, or someone who relies on price action, this indicator can be a valuable addition to your trading toolkit.

FxASTLite Strategy[ALLDYN]This strategy can be used on ANY instrument (Forex, Stocks, Cryptocurrency, etc.) AND on ANY TF (Time Frame). The purpose of me sharing this is to show people the power of using a Fibonacci-based trading system combined with Institutional market looks and how associated price action reacts and responds at these levels within the market. This is nothing new with the work that Charles Dow did with the Dow Theory and what Ralph Nelson Elliott expanded upon with the Elliott Wave principle. It is about synergism and simplicity with what works. There is no "holy grail" in trading except the one between your ears. This is just a tool to give you a confirmation with multiple built-in confluences that can be tied with an oscillator for additional confluence.
It is helpful to know Supply & Demand Zones as well as candlestick patterns and where these reversal patterns happen within the market. They are more meaningful if they happen within Supply & Demand Zones. The 4 candlestick patterns I look for in Supply & Demand Zones are Hammer/Hanging Man (Pinbar), Engulfing Candle Pattern (blended lines), Dark Cloud Cover/Piercing Candle Pattern (blended lines), and Tweezer Tops/Bottoms.
I through The Ichimoku Cloud on top of this so you can see the transitions as the market moves in its fractal nature. I use the MACD, TDI, and RSI for confirmation of what associated price action is doing on the chart. I say associated price action because nothing happens without volume. There are some built-in Volume tools in TV that give some good insight into what is happening (overall volume - VPVR, at price - session volume, & overtime - vol. )
***PURPOSE of the RIBBON***:
-The Ribbon allows you to get in at the START/BEGINNING of a Correction/Trend Change (Associated price action should always be the ENTRY condition).
-If the associated price action stays above the Ribbon, then this allows you to stay in the BUY trade longer.
*Note - Exit of the BUY trade would be if associated price action BELOW the Ribbon.
-If associated price actions stay below the Ribbon, this allows you to stay in the SELL trade longer (Associated price action should always be the ENTRY condition).
*Note - Exit of the SELL trade would be if associated price action closed ABOVE the Ribbon.
***PURPOSE of the Oracle (Solid purple line)***
-The Oracle will act as Trend confirmation and associated price action target as the Trend is TRANSITIONING
***SYSTEM FEATURES***
-Inputs (Style, Visibility = NA):
You are able to toggle ALLDYN FxASTLite from the chart.
You are able to toggle PSARs from the chart.
You are able to toggle background (Affects White/Black line)
If you suffer from any type of Color Blindness you can select different options to help.
*****DISCLAIMER*****
I am not a financial advisor or commodity trade advisor. This "TOOL" is for EDUCATIONAL PURPOSES ONLY. Any use of this financial educational tool in ANY demo/live market you do so at your own RISKS. Trading in leveraged financial markets has inherent RISKS associated with such actions. Do Not Trade Money YOU Can't Afford to LOSE.
Liquidity ToolkitKey Points:
Liquidity Toolkit is your liquidity companion for monitoring and anticipating price action.
Liquidity Toolkit combined the power of the Liquidity Status indicator with the potency of Price Triggers.
Liquidity Status indicates if the current current liquidity environment is bullish or bearish.
Price triggers highlight price levels where supports, resistances, and trend-changes are likely to occur.
Together, they create a comprehensive and actionable view of the market.
Summary
The Liquidity Toolkit (TK) is designed as a one-stop-shop indicator by combining novel liquidity metrics with traditional and impactful price measurements. In combination, TK grants unparalleled views of the market through effective yet simple displays.
The TK indicator contains two separate by synergistic algorithms: the Liquidity Status algorithm, which measures liquidity to determine if outlooks are bearish or bullish; and the Price Triggers algorithm which analyzes price-action to determine points of support and resistances.
Example 1 :
Example 2 :
Example 3 :
Details
Liquidity Status
Liquidity Status (LS) measures liquidity and produces either `Bullish` or `Bearish` indications depending on the current liquidity status.
Bullish indications indicate that the overall flow of liquidity is supportive of bullish price and bearish indications indicate that the overall flow of liquidity is supportive of bearish price action.
LS is displayed in two ways:
Candle-Coloring: if candles are green, liquidity status is bullish and if candles are red, liquidity status is bearish.
Text Display: Bearish and/or Bullish is displayed via text as well.
Price Triggers
Price Triggers (PT) measure price action and report their findings on several timeframes:
1-Minute
5-Minute
60-Minute
1-Day
1-Week
TK graphs the PTs based on the chart interval – only the higher PTs are display (i.e.: On the 1-Hour chart, the 5-, and 1-Min PTs will not be displayed).
Example 4
In additional to showing price-levels of support and resistance, Price Triggers also display the relative strength of these supports and resistances by displaying the Trigger Strengths. These represent areas of influence.
Opportunities often arise when PTs squeeze each other, often forcing spot to make a large move – as can be seen below:
Example 5
Frequently Asked Questions
How can I get access to the Liquidity Toolkit?
Please see the Author’s Instructions section at the top of the page for more details and information.
How can I get additional information on the indicators used?
Please see the Author’s Instructions section at the top of the page for more details and information.
I added the Liquidity Toolkit but I do not see all of the PT lines – where are they?
Depending on the chart interval, not all PT lines will be displayed. Those lower than the chart’s timeframe are hidden for clarity.
I added Liquidity Toolkit but the chart’s candles are not being filled by LS.
The chart will try to color over LS’ candles if you do not disable them. To disable, go to the Chart Settings then to Symbol and de-select Body, Borders and Wick.
MACD Trading System - Professional V2# MACD Trading System - Professional V2
## Executive Summary
**MACD Pro V2** is an institutional-grade trading indicator combining classical MACD analysis with advanced risk management, multi-timeframe confirmation, and comprehensive performance metrics. Designed for both manual traders and algorithmic systems, this indicator provides actionable signals with built-in stop loss calculation, take profit targets, position sizing, and trailing stop logic.
This indicator is NOT just a signal generator—it's a complete trading system with risk/reward management, performance tracking, and market regime detection.
---
## Core Features
### 1. Advanced MACD Calculation
- **Customizable EMAs**: Fast (default 8), Slow (default 21), Signal (default 5)
- **Confirmed Signals**: Uses barstate.isconfirmed to prevent repainting
- **Zero-Line Position**: Shows MACD above/below zero for momentum context
### 2. Multi-Timeframe Analysis
- **4 Simultaneous Timeframes**: 4H, 1H, 15M, 5M analyzed in parallel
- **MTF Alignment Score**: 0-100% showing consensus across timeframes
- **Smart Requests**: Uses lookahead=barmerge.lookahead_off for accuracy
### 3. Market Regime Detection
Automatically identifies current market conditions:
- **TRENDING** - ADX > 25, strong directional movement
- **RANGING** - ADX < 20, choppy sideways movement
- **VOLATILE** - ATR > 1.5x average, high uncertainty
- **NORMAL** - Default market state
### 4. Integrated Risk Management
Complete position management system:
- **Stop Loss Calculation**: Automatic SL placement based on ATR × multiplier
- **Take Profit Targets**: Calculated using Risk:Reward ratio (default 2:1)
- **Position Sizing**: Scales position size based on account risk percentage
- **Trailing Stop**: Dynamically adjusts SL as price moves in your favor
- **Drawdown Monitoring**: Tracks maximum drawdown vs account
### 5. Advanced Signal Scoring
0-100 point system weighing:
- **MTF Alignment (35%)**: Multi-timeframe confirmation strength
- **Momentum (25%)**: RSI conditions + Divergence detection
- **Volume (20%)**: Volume profile and confirmation
- **Volatility (20%)**: Market regime adjustment
**Signal Classifications:**
- **STRONG (70+)**: High confidence, tight stops, optimal entry
- **MEDIUM (50-69)**: Valid signals, confirm with price action
- **WEAK (<50)**: Low conviction, skip or use tight risk management
### 6. Professional Performance Metrics
Real-time trading statistics:
- **Win Rate**: Percentage of winning trades
- **Max Drawdown**: Largest peak-to-trough decline
- **Sharpe Ratio**: Risk-adjusted returns (anualized)
- **Profit Factor**: Gross profit / Gross loss ratio
- **Consecutive Losses**: Psychological stress indicator
### 7. Advanced Filtering System
- **Divergence Detection**: Automatic bullish/bearish divergence identification
- **Support/Resistance**: Pivot-based dynamic S/R levels
- **Volume Confirmation**: Only takes signals with volume > 1.0x average
- **Session Filter**: Optional trading hours restriction
- **Volatility Adjustment**: Reduces entries in extremely high volatility
---
## How It Works
### Signal Generation Process
**Step 1: MACD Crossover**
- Crossover of MACD above/below signal line triggers base signal
- Uses confirmed values to prevent false signals
**Step 2: Multi-Timeframe Confirmation**
- Checks trend alignment on 4H, 1H, 15M, 5M
- Calculates MTF alignment percentage
- Higher alignment = higher confidence
**Step 3: Advanced Scoring**
Signal is scored on 100-point scale:
- MTF alignment contribution (35 pts max)
- RSI + Divergence (25 pts max)
- Volume profile (20 pts max)
- Volatility regime adjustment (20 pts max)
**Step 4: Filter Application**
- Session filter (if enabled)
- Support/Resistance proximity bonus
- Volume confirmation requirement
- Drawdown check (if risk mgmt enabled)
**Step 5: Risk Calculation**
- Stop Loss placed 2 ATR below entry (customizable)
- Take Profit calculated using 2:1 risk/reward ratio
- Position size scaled to risk 1% per trade
- Trailing stop activated after 1R profit
**Step 6: Signal Output**
- Buy Signal: Green triangle (Strong) or circle (Medium)
- Sell Signal: Red triangle (Strong) or circle (Medium)
- Dashboard shows complete trade details
---
## Trading Scenarios
### Scenario 1: Strong Buy Setup
```
Requirements met:
✓ MACD crosses above signal line
✓ 3/4 timeframes bullish (4H, 1H, 15M)
✓ RSI oversold (< 30)
✓ Volume spike confirmed
✓ Score: 78/100 → STRONG BUY
System provides:
- Entry: Current price
- Stop Loss: 2 ATR below entry
- Take Profit: 2× risk distance above
- Position Size: Adjusted to 1% account risk
- Trailing Stop: Activates at 1R profit
```
### Scenario 2: Medium Buy with Divergence
```
Requirements met:
✓ MACD crosses above signal line
✓ 2/4 timeframes bullish (4H, 1H)
✓ Bullish divergence detected
✓ Price near support level
✓ Score: 62/100 → MEDIUM BUY
Considerations:
- Lower confidence → tighter risk management
- Use smaller position size
- Require additional confirmation
- Better as counter-trend entry
```
### Scenario 3: Ranging Market Filter
```
Market condition detected: RANGING
ADX < 20, sideways movement
System response:
- Reduces signal score by volatility adjustment
- May skip signals entirely
- Prioritizes higher confluence
- Warns of low trend probability
Best action: Wait for trending market
```
---
## Risk Management Deep Dive
### Stop Loss Calculation
```
Stop Loss Distance = ATR × ATR Multiplier (default 2.0)
Example:
- Current price: 1.0850
- ATR(14): 0.0045
- SL Distance: 0.0045 × 2.0 = 0.009
- BUY SL: 1.0850 - 0.009 = 1.0760
```
### Position Sizing
```
Position Size = (Account Risk % / Price Risk %)
Example:
- Risk per trade: 1% of account
- Stop distance: 0.009 on price of 1.0850
- Price risk: 0.009 / 1.0850 = 0.83%
- Position size: 1.0% / 0.83% = 1.2x (capped at 1.0x max)
```
### Trailing Stop Logic
```
Normal SL: 2 ATR below entry
Trigger Level: Entry + (Entry - SL) × Trail Activation (1.0R)
Trailing Mechanism:
- If price hits trigger, trailing SL activates
- SL moves up to: Close - 2 ATR
- SL never moves down, only up (for longs)
- Protects profits while allowing upside
```
### Drawdown Protection
```
Tracks:
- Peak equity reached
- Current drawdown from peak
- Maximum drawdown recorded
- Stops trading if max DD exceeded
Example:
- Peak: $10,000
- Current: $9,200
- Drawdown: 8%
- Max allowed: 10%
- Status: CONTINUE TRADING
```
---
## Dashboard Metrics Explained
### Market Section
- **Market Regime**: Current state (Trending/Ranging/Volatile/Normal)
- **ADX Value**: Trend strength indicator (0-100)
### Position Section
- **Current Position**: LONG, SHORT, or NONE
- **P&L**: Unrealized profit/loss percentage if in position
### Timeframe Section
- Individual 4H/1H/15M trend status
- **Alignment**: Percentage of bullish timeframes
### Risk Management Section
- **Stop Loss %**: Distance from current price
- **Take Profit %**: Target profit distance
- **Position Size**: Capital allocation multiplier
- **Risk %**: Per-trade risk percentage
### Performance Section
- **Win Rate**: % of winning trades (>60% is excellent)
- **Max DD**: Maximum drawdown experienced
- **Sharpe Ratio**: Risk-adjusted return metric
- **Profit Factor**: Ratio of profits to losses
### Indicators Section
- **RSI**: Momentum and overbought/oversold levels
- **Volume**: Current vs. average volume ratio
- **Divergence**: Active divergence detection
---
## Advanced Features
### Divergence Detection
```
Bullish Divergence:
- Price makes lower low
- MACD makes higher high
- Signals potential reversal UP
Bearish Divergence:
- Price makes higher high
- MACD makes lower low
- Signals potential reversal DOWN
Lookback: 20 bars (customizable)
```
### Support & Resistance
```
Method: Pivot High/Low detection
- Pivot Left/Right: 10 bars
- Dynamic S/R levels update as new pivots form
- Bonus score if entry near identified levels
```
### Performance Tracking
Real-time statistics calculated from:
- Win/loss signals
- Profit/loss per trade
- Consecutive losing trades
- Cumulative returns
- Standard deviation (Sharpe calculation)
Stores last 100 trades in memory for statistics.
---
## Input Parameters Explained
### MACD Settings
- **Fast EMA** (5-13): Lower = more responsive, more false signals
- **Slow EMA** (20-26): Higher = smoother, misses faster moves
- **Signal EMA** (5-9): Crossover sensitivity
### Risk Management
- **ATR Period** (default 14): Volatility measurement period
- **SL ATR Multiplier** (1.5-3.0): Stop loss tightness
- **Risk:Reward Ratio** (1-5): Profit target calculation
- **Trail Activation** (0.5-2.0): When to start trailing stop
- **Risk Per Trade** (0.1-5.0): Account risk percentage
- **Max Drawdown** (5-30%): Trading pause threshold
### Scoring Weights
Customize signal emphasis:
- **MTF Alignment** (35%): How important is multi-timeframe
- **Momentum** (25%): RSI and divergence weight
- **Volume** (20%): Volume confirmation priority
- **Volatility** (20%): Regime adjustment strength
### Advanced Filters
- **Check Divergence**: Enable/disable divergence scoring
- **Session Filter**: Restrict to specific hours
- **Min Volume Ratio**: Minimum volume for signal
### Display
- **Show Dashboard**: Main metrics table
- **Show Performance**: Trading statistics
- **Show S/R Levels**: Support/resistance visualization
---
## Best Practices
1. **Backtest Before Trading**: Test parameters on your preferred pairs
2. **Start with Strong Signals**: Use only 70+ scored signals initially
3. **Position Size**: Never risk more than 1-2% per trade
4. **Market Regime Awareness**: Skip ranging market entries
5. **Volume Confirmation**: Always check volume spikes
6. **Profit Taking**: Lock in profits at TP, don't let winners die
7. **Loss Management**: Honor stop losses, don't move them
8. **Performance Review**: Check metrics weekly, adjust if needed
---
## Trading Strategy Examples
### Conservative Strategy (Win-Rate Focus)
```
Settings:
- Signal Score Minimum: 70+ (Strong only)
- Risk Per Trade: 0.5%
- Risk:Reward: 3:1
- Position Size: 0.5x (smaller)
Targets:
- Win Rate > 65%
- Max DD < 5%
- Profit Factor > 2.0
```
### Aggressive Strategy (Profit Focus)
```
Settings:
- Signal Score Minimum: 50+ (Medium+)
- Risk Per Trade: 2%
- Risk:Reward: 1.5:1
- Position Size: 1.0x (maximum)
Targets:
- Win Rate > 55%
- Max DD < 10%
- Profit Factor > 1.5
```
### Trend Trading Strategy
```
Settings:
- Only trade when ADX > 25 (Trending)
- MTF Alignment: 3+ timeframes
- Use Trailing Stop: Yes
- Risk:Reward: 2.5:1
Focus on: Riding large moves
Best on: 4H timeframe
Pairs: Trending majors (EURUSD, GBPUSD)
```
### Divergence Trading Strategy
```
Settings:
- Signal Score Minimum: 60+
- Enable Divergence: Yes
- Volume Confirmation: Required
- Position Size: 0.75x
Focus on: Reversal entries
Best setup: Divergence at resistance/support
Risk management: Tight stops (1.5 ATR)
```
---
## Advantages
✓ Complete trading system, not just signals
✓ Built-in risk management and position sizing
✓ Real-time performance tracking
✓ Multi-timeframe confirmation reduces false signals
✓ Advanced filtering and divergence detection
✓ Market regime awareness
✓ Customizable scoring weights
✓ Professional dashboard display
✓ Support/resistance integration
✓ Trailing stop logic for profit protection
---
## Limitations
- Lagging indicator (uses confirmed bars)
- Works best on trending markets
- Not optimized for news/event trading
- Requires parameter optimization per pair
- Performance varies by timeframe
- Past performance doesn't guarantee future results
- Can produce whipsaw signals in ranging markets
---
## System Requirements
- TradingView Premium or higher (for advanced charting)
- Recommended: 4H or 1H timeframe
- Historical data: Minimum 100 bars
- Currency pairs: Works on all FX pairs, stocks, commodities
---
## Disclaimer
This indicator is provided for educational and informational purposes only. It is not financial advice and does not guarantee profits. Past performance does not predict future results.
**Important Notices:**
- Always use proper risk management
- Trade only with capital you can afford to lose
- Backtest thoroughly before live trading
- Combine with your own analysis
- Consider external market factors and news
- Monitor positions actively
- Keep emotional discipline
---
## Support & Optimization
For best results:
1. Test on your preferred instrument (6-12 months history)
2. Adjust MACD parameters to your timeframe
3. Optimize scoring weights to your style
4. Set risk management per your account size
5. Document your trade results and review weekly
6. Adapt parameters if performance degrades
This is a powerful system when used correctly. Respect the rules and let statistics work in your favor.

VWAP Momentum Oscillator How It Works
Core Calculation Method
The oscillator combines four key market measurements into a single, normalized reading:
1. Price-VWAP Deviation: `(Close - VWAP) / VWAP × 100`
2. VWAP-MA Momentum: `(VWAP - MovingAverage) / MovingAverage × 100`
3. Anchored VWAP Strength: Average of high/low anchor deviations from rolling VWAP
4. Range Position: `(Close - PeriodLow) / (PeriodHigh - PeriodLow) × 100 - 50`
Dynamic Signal Line
The signal line uses an EMA that automatically adjusts its length based on your chart timeframe:
- Futures: Always covers 23 hours of trading (1,380 minutes)
- Stocks: Always covers 6.5 hours of trading (390 minutes)
- Examples: 276 periods on 5-min futures chart, 1,380 periods on 1-min futures chart
Trading Signals
🟢 Buy Signals
- Condition: Main oscillator crosses above signal line while below zero
- Logic: Momentum turning bullish from oversold conditions
- Visual: Green "BUY" label below price action
🔴 Sell Signals
- Condition: Main oscillator crosses below signal line while above zero
- Logic: Momentum turning bearish from overbought conditions
- Visual: Red "SELL" label above price action
⚠️ Extreme Warnings
- Extreme Overbought: Red triangle when oscillator crosses above +4.0
- Extreme Oversold: Green triangle when oscillator crosses below -4.0
- Purpose: Risk management alerts, not entry/exit signals
Oscillator Zones
Interpretation Guide
- Above +2.0: Strong bullish momentum zone (green background)
- 0 to +2.0: Mild bullish territory
- 0 to -2.0: Mild bearish territory
- Below -2.0: Strong bearish momentum zone (red background)
- Above +4.0: Extreme overbought (caution advised)
- Below -4.0: Extreme oversold (potential reversal zone)
Customization Options
Moving Average Settings
- EMA/SMA Toggle: Choose between exponential or simple moving average
- Color Customization: Adjust MA line color and width
Visual Controls
- Bullish/Bearish Colors: Customize momentum zone colors
- Signal Line: Toggle visibility and adjust color
- Line Widths: Control thickness of all plot lines
Anchor Modes
- NY Session Only: Anchors reset at NY market open (9:30 AM ET)
- 24H NY Day: Anchors reset at NY calendar day change (midnight ET)
Best Practices
Timeframe Selection
- Scalping: 1-5 minute charts for quick momentum changes
- Day Trading: 5-15 minute charts for clearer trend signals
- Swing Trading: 1-4 hour charts for major momentum shifts
Signal Confirmation
- Wait for crossovers: Don't trade on oscillator position alone
- Respect extreme levels: Exercise caution above +4 or below -4
- Use with price action: Combine with support/resistance levels
Risk Management
- Extreme zones: Reduce position size when oscillator is extended
- Failed signals: Exit quickly if momentum doesn't follow through
- Market context: Consider overall trend direction and market volatility
Technical Specifications
Calculation Components
- Base Length: 1,380 periods (futures) / 390 periods (stocks)
- Signal Line: Dynamic EMA covering one full trading day
- Smoothing: 3-period SMA on raw oscillator (adjustable)
- Update Frequency: Real-time on every price tick
Performance Notes
- Resource Efficient: Optimized calculations minimize CPU usage
- Memory Friendly: Uses incremental VWAP calculations
- Fast Loading: Minimal historical data requirements
Version History & Development
This oscillator evolved from advanced VWAP overlay strategies, transforming complex multi-line analysis into a single, actionable momentum gauge. The indicator maintains the sophistication of institutional VWAP analysis while providing the clarity needed for retail trading decisions.
Core Philosophy
Traditional VWAP indicators show where price is relative to volume-weighted averages, but they don't quantify momentum or provide clear entry/exit signals. This oscillator solves that problem by normalizing all VWAP relationships into a single, bounded indicator that works consistently across all timeframes and asset classes.
---
Open Source License: This indicator is provided free for the TradingView community. Feel free to modify and enhance according to your trading needs.

ADX Tide ZonesADX Tide Zones – Adaptive Momentum & Trend Strength Framework
Overview
ADX Tide Zones – Professional is a dynamic trend-strength visualizer designed for traders who want to interpret momentum with precision and context. By combining the Average Directional Index (ADX) with adaptive threshold logic, the indicator segments price action into distinct “tide zones” that reflect varying levels of market strength: Calm, Rising, Strong, and Falling Tides. These zones transform raw ADX readings into an interpretable framework that highlights when markets are consolidating, building momentum, trending strongly, or losing strength.
Unlike standard ADX readings, which can be difficult to interpret in real time, ADX Tide Zones translate momentum shifts into a continuous, color-coded system that traders can instantly read. Whether applied to scalping, intraday, or swing trading, the indicator offers a consistent methodology for identifying actionable opportunities across assets and timeframes.
How It Works
The foundation of ADX Tide Zones lies in momentum analysis via the ADX. By measuring the strength (not direction) of a trend, ADX provides an objective read on when markets are gaining or losing energy. ADX Tide Zones enhances this by applying threshold logic to classify ADX values into four distinct states:
Calm Tide : Low ADX values indicate sideways or consolidating conditions.
Rising Tide : ADX increases past a threshold, signaling momentum building.
Strong Tide : ADX remains elevated, confirming robust and sustained trend strength.
Falling Tide : ADX declines after strength, hinting at exhaustion or early reversal setups.
These states are displayed on the chart through adaptive visualizations (zones, bar colors, or overlays), offering real-time clarity on when to expect expansion, continuation, or contraction in price action.
Interpretation
Trend Analysis : By mapping transitions between tides, traders can instantly gauge whether markets are in accumulation, expansion, or exhaustion phases. Rising/Strong Tides reinforce trend continuation, while Falling Tides highlight weakening conditions.
Volatility & Risk Assessment : Shifts between Calm → Rising Tide often precede volatility expansions. Falling Tides can signal a period of compression or corrective moves, warning traders to manage risk proactively.
Market Context : The indicator does not dictate direction; instead, it overlays strength on top of price action, allowing traders to combine it with directional tools such as moving averages, order blocks, or liquidity zones for confirmation.
Strategy Integration
ADX Tide Zones adapts seamlessly to a wide range of trading strategies by translating momentum dynamics into actionable frameworks:
Trend Following : Traders can align with dominant flows by entering positions when the indicator confirms a Rising Tide or Strong Tide. These conditions signal persistent directional strength, making them ideal for continuation setups. Combining directional bias with ADX confirmation reduces the risk of trading against prevailing momentum.
Breakout Trading : When the market transitions from Calm Tide into a Rising Tide, it often precedes a volatility expansion. This shift highlights breakout conditions where accumulation gives way to impulsive price movement. Traders can use this transition as a timing tool to catch early entries into new momentum phases.
Exhaustion Reversals : Strong Tide phases don’t last forever—when they begin to fade into Falling Tide, it can mark trend fatigue or liquidity exhaustion. This offers contrarian traders an early edge in spotting overextended moves and positioning for corrective pullbacks or full reversals.
Multi-Timeframe Analysis : By overlaying higher timeframe tide zones on intraday or scalping charts, traders can filter noise and trade in alignment with larger flows. For example, combining a daily Rising Tide bias with a 15-minute breakout confirmation can significantly improve entry precision while reducing exposure to false signals.
Advanced Techniques
For traders seeking an extra edge, ADX Tide Zones can be pushed further with advanced methods:
Volume & Liquidity Confirmation : Pair the tide transitions with volume spikes, order flow, or liquidity sweep tools. When directional strength confirmed by the ADX coincides with institutional activity, it validates setups and increases probability of follow-through.
Cross-Asset Synchronization : Momentum rarely exists in isolation. Monitoring tide shifts across correlated instruments (e.g., majors vs. USD, or indices vs. risk assets) can uncover synchronized volatility events. These correlations help traders identify whether a move is isolated noise or part of a broader systemic trend.
Threshold Optimization : The sensitivity of ADX Tide Zones can be fine-tuned for different trading objectives. Lower thresholds heighten responsiveness, capturing micro-moves suitable for scalpers. Higher thresholds filter minor fluctuations, isolating major structural swings that align with swing or position trading.
Contextual Trade Management : Instead of using static stops or targets, traders can adapt risk management dynamically by tracking tide progression. For example, a trade initiated during Rising Tide may remain valid as long as conditions sustain, but partial profits or tighter stops can be applied once the zone shifts to Calm Tide.
Inputs & Customization
ADX Length : Define the lookback period for ADX calculation.
Threshold Levels : Adjust sensitivity for Calm, Rising, Strong, and Falling Tides.
Zone Visualization : Choose between bar coloring, background shading, or overlays.
Color Customization : Configure bullish, bearish, neutral, and tide-specific colors.
Multi-Timeframe Options : Enable tide readings from higher timeframes for confirmation.
Why Use ADX Tide Zones
ADX Tide Zones turns the complexity of momentum analysis into a visual system that highlights when markets are gearing up for moves, trending with conviction, or running out of steam. By combining adaptive ADX interpretation with customizable thresholds, traders can:
Anticipate breakouts before volatility expands.
Confirm the strength behind price trends.
Spot exhaustion phases early to secure profits or prepare for reversals.
Adapt strategies seamlessly between scalping, intraday, and swing trading.
With its balance of simplicity and depth, ADX Tide Zones provides a structured lens for reading market momentum, equipping traders with the clarity needed to execute with discipline and confidence.

TFPS - TradFi Pressure ScoreThe Data-Driven Answer to a New Market Reality.
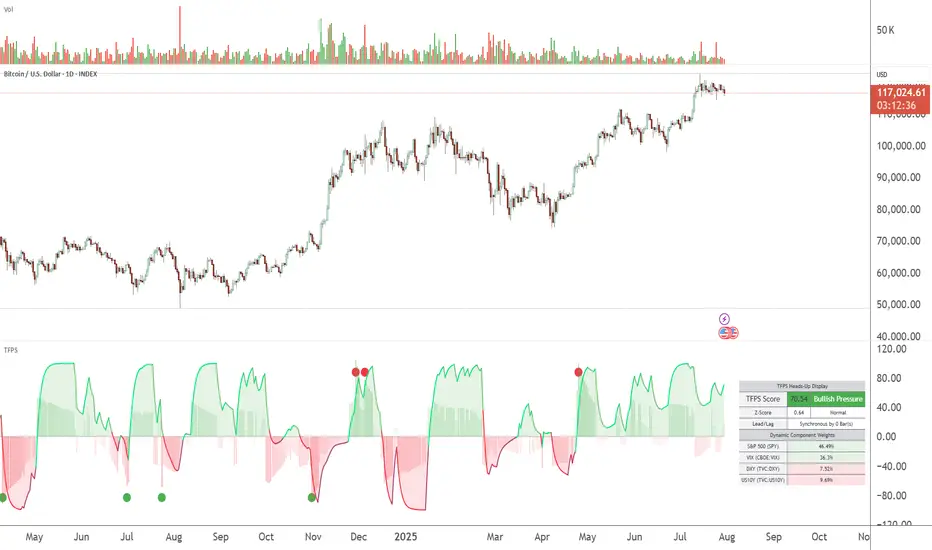
This indicator quantifies the pressure exerted by Wall Street on the crypto market across four critical dimensions: Risk Appetite, Fear, Liquidity Flows, and the Opportunity Cost of Capital. Our research has found that the correlation between this 4-dimensional pressure vector and crypto price action reaches peak values of 0.87. This is your decisive macro edge, delivered in real-time.
The Irreversible Transformation
A fundamental analysis of the last five years of market data proves an irreversible transformation: The crypto market has matured into a high-beta risk asset, its fate now inextricably linked to Traditional Finance (TradFi).
The empirical data is clear:
Bitcoin increasingly behaves like a leveraged version of the S&P 500.
The correlation to major stock indices is statistically significant and persistent.
The "digital gold" narrative is refuted by the data; the correlation to gold is virtually non-existent.
This means standard technical indicators are no longer sufficient. Tools like RSI or MACD are blind to the powerful, external macro context that now dominates price action. They see the effect, but not the cause.
The Solution: A 4-Dimensional Macro-Lens
The TradFi Pressure Score (TFPS) is the answer. It is an institutional-grade dashboard that aggregates the four most dominant external forces into a single, actionable score:
S&P 500 (SPY): The Pulse of Risk Appetite. A rising S&P signals a "risk-on" environment, fueling capital flows into crypto.
VIX: The Market's Fear Gauge. A rising VIX signals a "risk-off" flight to safety, draining liquidity from crypto.
DXY (US-Dollar Index): The Anchor of Global Liquidity. A strong Dollar (rising DXY) tightens financial conditions, creating powerful headwinds for risk assets like Bitcoin.
US 10Y Yield: The Opportunity Cost of Capital. Rising yields make risk-free assets more attractive, pulling capital away from non-yielding assets like crypto.
What makes the TFPS truly unique?
1. Dynamic Weighting (The Secret Weapon):
Which macro factor matters most right now? Is it a surging Dollar or a collapsing stock market? The TFPS answers this automatically. It continuously analyzes the correlation of all four components to your chosen asset (e.g., Bitcoin) and adjusts their influence in real-time. The dashboard shows you the exact live weights, ensuring you are always focused on the factor that is currently driving the market.
2. Adaptive Engine:
The forces driving a 15-minute chart are different from those driving a daily chart. The TFPS engine automatically recalibrates its internal lookback periods to your chosen timeframe. This ensures the score is always optimally relevant, whether you are a day trader or a swing trader.
3. Designed for Actionable Insights
The Pressure Line: The indicator's core output. Is its value > 0 (tailwind) or < 0 (headwind)? This provides an instant, unambiguous read on the macro environment for your trade.
The Z-Score (The Contrarian Signal): The background "Stress Cloud" and the discrete dots provide early warnings of extreme macro greed or fear. Readings above +2 or below -2 have historically pinpointed moments of market exhaustion that often precede major trend reversals.
Lead/Lag Status: Gain a critical edge by knowing who is in the driver's seat. The dashboard tells you if TradFi is leading the price action or if crypto is moving independently, allowing you to validate your trade thesis against the dominant market force.
This is a public indicator with protected source code
Access is now available for traders who understand the new market reality at the intersection of crypto and traditional finance.
You are among the first to leverage what is a new standard for macro analysis in crypto trading. Your feedback is highly valued as I continue to refine this tool.
Follow for updates and trade with the full context!
Signalgo XSignalgo X
Signalgo X is a sophisticated indicator crafted for traders who demand a disciplined, multi-layered approach to market analysis and trade management. This overview will help you understand its capabilities, logic, and how it can elevate your trading.
Core Concept
Signalgo X is built to:
Scan multiple timeframes simultaneously for price, volume, and volatility patterns.
Filter out unreliable signals during periods of market hype or manipulation.
Automate trade management with dynamic take-profit (TP), stop-loss (SL), and trailing logic.
Deliver actionable, visual signals and alerts for timely, confident decisions.
Inputs & Controls
Preset System Parameters:
News Sensitivity: Determines how responsive the indicator is to price moves.
Hype Filter Strength: Sets how aggressively the system avoids volatile, manipulated, or news-driven periods.
User-Configurable:
Show TP/SL Logic: Turn on/off the display of take-profit and stop-loss levels directly on your chart.
How Signalgo X Works
1. Multi-Timeframe Market Analysis
Signalgo X continuously monitors:
Closing price
Trading volume
Volatility (ATR)
across six distinct timeframes, from 1 hour to 3 months. This layered approach ensures that signals are validated by both short-term momentum and long-term trends.
2. Price, Volume, and Volatility Synthesis
Price Change: The system tracks percentage changes over each timeframe to gauge momentum.
Volume Ratio: By comparing current volume to a moving average, it detects unusual spikes that may signal institutional activity or manipulation.
Volatility: Measures the intensity of price movements relative to average ranges, helping to identify breakout or exhaustion scenarios.
3. Proprietary Anti-Hype Filter
A unique scoring mechanism evaluates:
Volume spikes without corresponding price action
Sudden jumps in volatility
Conflicting signals across timeframes
Social hype proxies (e.g., sharp moves on low volume)
If the market is deemed “hyped,” all trading signals are suppressed and a clear warning is shown, keeping you out of unpredictable conditions.
4. Signal Classification & Mapping
Significant Moves: Only price actions that exceed a sensitivity threshold and are confirmed by volume/volatility are considered.
Bullish/Bearish Signals: Generated for each timeframe.
Signal Strength: Categorized as regular, or strong based on multi-timeframe agreement.
Entry & Exit Strategy
Entry Logic
Long (Buy) Entry: Triggered when bullish signals are detected (of any strength) and no hype is present.
Short (Sell) Entry: Triggered when bearish signals are detected and no hype is present.
Exit & Trade Management
Stop Loss (SL): Placed at a calculated distance from entry, adapting to recent volatility.
Take Profits (TP1, TP2, TP3): Three profit targets, each at a greater reward multiple.
Trailing Stop: After the first take-profit is hit, the stop-loss moves to breakeven and a trailing stop is activated to protect further gains.
Event Tracking: The indicator visually marks when each TP or SL is hit, providing real-time feedback.
Chart Plots: All relevant SL, TP, and trailing stop levels are clearly marked for both long and short trades.
Labels: Entry, exit, and signal strength events are color-coded and visually prominent.
Alerts: Built-in alert conditions allow you to set up TradingView notifications for strong/regular buy/sell signals and hype warnings.
Trading Strategy Application
Multi-Timeframe Confirmation: Only strong signals confirmed by several timeframes are acted upon, reducing false positives.
Volume & Volatility Awareness: The indicator avoids low-quality, “fakeout” signals by requiring confirmation from both price and volume/volatility.
Hype Avoidance: Keeps you out of the market during news-driven or manipulated periods, helping to protect your capital.
Automated Discipline: The TP/SL logic enforces a rules-based exit strategy, helping you lock in profits and limit losses without emotional interference.
Who Should Use Signalgo X?
Signalgo X is ideal for traders who want:
Systematic, high-confidence signals
Automated and disciplined trade management
Protection against unpredictable market events
Clear, actionable visuals and alerts

[JHF] SQZMOMPRO SQZMOMPRO is a sophisticated, momentum-based technical indicator designed for traders seeking to identify potential trend reversals, momentum shifts, and periods of market consolidation (squeezes) across multiple timeframes. By combining a momentum oscillator, Bollinger Bands, Keltner Channels, and a Percentage Volume Oscillator (PVO), it provides a comprehensive view of price momentum and volume dynamics.
Overview
The SQZMOMPRO indicator is a powerful tool that integrates momentum analysis, volatility-based squeeze detection, and volume confirmation to help traders identify high-probability trading opportunities. It combines:
A momentum oscillator based on price deviations from a linear regression and moving average.
Bollinger Bands and Keltner Channels to detect periods of low volatility (squeezes), signaling potential breakouts.
A Percentage Volume Oscillator (PVO) to confirm momentum signals with volume trends.
A Rate of Change (ROC) line to highlight the speed of momentum shifts.
Visual cues like reversal signals and confluence backgrounds for actionable insights.
This indicator is ideal for swing traders, day traders, and those analyzing trends across multiple timeframes (hourly, 4-hour, daily, weekly, monthly). It is plotted below the price chart (non-overlay) and includes customizable alerts for key conditions.
Key Features
Multi-Timeframe Support: Automatically adjusts parameters for hourly, 4-hour, daily, weekly, and monthly charts, ensuring optimal settings for each timeframe.
Squeeze Detection: Identifies periods of low volatility (squeezes) using Bollinger Bands and Keltner Channels, categorized as Wide, Normal, Narrow, or Very Narrow.
Momentum Oscillator: Tracks price momentum relative to a baseline, with a signal line to highlight trend reversals.
PVO Confluence: Optionally integrates the Percentage Volume Oscillator to confirm momentum signals with volume trends.
Rate of Change (ROC): Displays the smoothed rate of change of momentum for enhanced readability.
Visual Cues: Includes color-coded squeeze dots, momentum/signal lines, reversal markers, and optional confluence backgrounds.
Alerts: Configurable alerts for squeeze conditions, trend reversals, and volume-confirmed signals.
How It Works
1. Momentum Oscillator
The momentum oscillator is calculated as follows:
Source: Closing price.
Baseline: A combination of the midpoint of the highest high and lowest low over a specified period, adjusted by a simple moving average (SMA).
Momentum: Linear regression of the price deviation from this baseline over a timeframe-specific period (shorter for smaller timeframes to be more responsive).
Signal Line: A 5-period SMA of the momentum value, used to identify crossovers.
Interpretation:
Momentum > Signal: Bullish momentum (plotted in green by default).
Momentum < Signal: Bearish momentum (plotted in red by default).
Crossovers: Momentum crossing above the signal line suggests a bullish reversal; crossing below suggests a bearish reversal.
2. Squeeze Detection
Squeezes occur when volatility contracts, often preceding significant price moves. The indicator compares:
Bollinger Bands: Calculated using an SMA and 2 standard deviations of the closing price.
Keltner Channels: Calculated using an SMA and multiples of the Average True Range (ATR) for different squeeze thresholds (Wide, Normal, Narrow, Very Narrow). This method steers away from the likes of classical SQZPRO which only uses an approximation of the Average True Range and heavily affects the squeeze sensitivity due to the way they calculate their Keltner Channel (our Keltner Channel are true to the way they are supposed to be calculated).
Squeeze Conditions:
Wide Squeeze: Bollinger Bands are inside Keltner Channels with a high ATR multiplier.
Normal Squeeze: Bollinger Bands are inside Keltner Channels with a moderate ATR multiplier.
Narrow Squeeze: Bollinger Bands are inside Keltner Channels with a low ATR multiplier.
Very Narrow Squeeze: Bollinger Bands are inside Keltner Channels with a very low ATR.
No Squeeze: Bollinger Bands are outside Keltner Channels, indicating higher volatility.
Depending on the timeframe, each squeeze level has been manually tweaked to gain an edge, whether you're scalping, in swings or in Leaps.
Visuals: Squeeze conditions are plotted as colored dots on the zero line:
Green: No Squeeze
Black: Wide Squeeze
Red: Normal Squeeze
Yellow: Narrow Squeeze
Purple: Very Narrow Squeeze
3. Percentage Volume Oscillator (PVO)
The PVO measures volume momentum, similar to the MACD but applied to volume through a 14 and 28 ema with volume as the srouce.
Interpretation:
PVO > 0: Increasing volume momentum (bullish).
PVO < 0: Decreasing volume momentum (bearish).
When enabled (Show PVO Confluence), the indicator highlights periods where momentum and PVO align (e.g., bullish momentum with PVO > 0).
4. Rate of Change (ROC)
Formula: Smoothed difference between momentum and signal line, multiplied by a user-defined factor (ROC Multiplier).
Purpose: Enhances readability of momentum shifts, plotted as a blue (positive) or orange (negative) line when enabled.
5. Reversal Signals
Bullish Reversal: Momentum crosses above the signal line, optionally confirmed by PVO > 0. Marked with a green vertical line.
Bearish Reversal: Momentum crosses below the signal line, optionally confirmed by PVO < 0. Marked with a red vertical line.
6. Confluence Background
When Show PVO Confluence is enabled, the background is colored to highlight alignment:
Bullish Confluence: Momentum > Signal and PVO > 0 (green background, darker if ROC is positive).
Bearish Confluence: Momentum < Signal and PVO < 0 (red background, darker if ROC is negative).
Inputs
Basic Configuration:
Display Reversals: Show/hide reversal markers for momentum/signal crossovers (default: true).
Show PVO Confluence: Enable/disable background coloring for momentum and PVO alignment (default: false).
Rate of Change:
Show Rate of Change Line: Display the ROC line (default: false).
ROC Smoothing Length: Smoothing period for ROC (default: 1, min: 1).
ROC Multiplier: Scales ROC for readability (default: 1, min: 1).
Plotline Colors:
Bullish Momentum: Green (default: RGB(0, 255, 0)).
Bearish Momentum: Red (default: RGB(255, 0, 0)).
Signal Line: White (default: RGB(255, 255, 255)).
Squeeze Colors:
No Squeeze: Green.
Wide Squeeze: Black.
Normal Squeeze: Red.
Narrow Squeeze: Yellow.
Very Narrow Squeeze: Purple.
Timeframe-Specific Parameters
The indicator adapts to the chart’s timeframe, using predefined settings.
Hourly, 4-Hour, Daily, Weekly and Monthly (and everything in between) all have custom, tweaked momentum length, ATR length, and squeeze multiplier threshold to suit the sensitivity needed for the current timeframe.
Trading Applications
Squeeze Breakouts:
A transition from a Very Narrow or Narrow Squeeze to No Squeeze often signals a breakout. Combine with momentum crossovers for confirmation.
Example: Enter a long position when a Narrow Squeeze (yellow dots) turns to No Squeeze (green dots) and momentum crosses above the signal line.
Trend Reversals:
Bullish reversal (green line) with PVO > 0 confirms strong buying volume, increasing the likelihood of a sustained uptrend.
Bearish reversal (red line) with PVO < 0 suggests strong selling pressure.
Confluence Trading:
Use confluence backgrounds to trade only when momentum and volume align, reducing false signals.
Example: A bullish confluence (green background) with positive ROC indicates a high-probability long setup.
Divergences:
Look for divergences between price and momentum or PVO. For instance, a higher low in momentum/PVO with a lower low in price suggests a bullish reversal.
Trend Confirmation:
Use the momentum oscillator and ROC to confirm price trends. A rising momentum and positive ROC validate an uptrend.
Alerts
Squeeze Alerts:
🟢 No Squeeze: Volatility is expanding.
⚫ Low Squeeze: Wide squeeze detected.
🔴 Normal Squeeze: Moderate squeeze detected.
🟡 Tight Squeeze: Narrow squeeze detected.
🟣 Very Tight Squeeze: Very narrow squeeze detected.
Reversal Alerts:
🐂 Bullish Trend Reversal: Momentum crosses above signal.
🐻 Bearish Trend Reversal: Momentum crosses below signal.
🐂 Bullish Trend Reversal + 📊 PVO Confluence: Momentum crossover with PVO > 0.
🐻 Bearish Trend Reversal + 📊 PVO Confluence: Momentum crossover with PVO < 0.
Limitations
Lagging Nature: The momentum oscillator and PVO rely on moving averages, which may lag sudden price or volume spikes.
False Signals: Squeezes and crossovers can occur in choppy markets, leading to whipsaws. Confirm with price action or other indicators.
Timeframe Sensitivity: Results vary by timeframe; test settings for your trading style (e.g., shorter lengths for day trading).
How to Use
Add to Chart: Apply the indicator to any TradingView chart (non-overlay).
Customize Settings:
Enable Display Reversals for crossover markers.
Enable Show PVO Confluence for volume confirmation.
Adjust ROC Smoothing and ROC Multiplier for clearer ROC visuals.
Customize colors for better visibility.
Interpret Signals:
Monitor squeeze dots for volatility changes.
Watch for momentum/signal crossovers and confluence backgrounds.
Use ROC to gauge momentum strength.
Set Alerts: Configure alerts for squeezes, reversals, or confluence signals to stay informed.
Example Scenario
Setup: A stock in a Very Narrow Squeeze (purple dots) on the daily chart, with momentum below the signal line and PVO < 0.
Signal: Momentum crosses above the signal line, PVO turns positive, and the squeeze transitions to No Squeeze (green dots).
Action: Enter a long position, targeting the next resistance level, with a stop-loss below recent support. The green confluence background and positive ROC confirm the trade.
Conclusion
The SQZMOMPRO indicator is a versatile tool for traders seeking to capitalize on momentum, volatility, and volume trends. Its multi-timeframe adaptability, visual clarity, and robust alert system make it suitable for various trading strategies. Combine with price action, support/resistance, or other indicators for optimal results. For feedback or suggestions, feel free to leave a comment.
OptionHawk1. What makes the script original?
• Unique concept: It integrates a Keltner based custom supertrend with a multi-EMA energy visualization, ATR based multi target management, and on chart options (CALL/PUT) trade signals—creating a toolkit not found in typical public scripts.
• Innovative use: Instead of off the shelf indicators, it reinvents them:
• Keltner bands used as dynamic Supertrend triggers.
• Fifteen EMAs layered for “energy” zones (bullish/bearish heatmaps).
• ATR dynamically scales multi-TP levels and stop loss.
These are creatively fused into a unified signal and automation engine.
________________________________________
2. What value does it provide to traders?
• Clear entries & exits: Labels for entry price/time, five TP levels, and SL structure eliminate guesswork.
• Visualization & automation: Real-time bar coloring and energy overlays allow quick momentum reads.
• Targeted to common pain points: Many traders struggle with manual TP/SL and entry timing—this automates that process.
• Ready for real use: Just plug into intraday (e.g., 5 min) or swing setups; no manual calculations. Signals are actionable out of the box.
________________________________________
3. Why invite only (worth paying)?
• Proprietary fusion: Public indicators like Supertrend or EMA are common—but your layered use, ATR based scaling, and label logic are exclusive.
• Auto-generated options format: Unique labeling for CALL/PUT, with graphical on chart signals, isn’t offered freely elsewhere.
• Time-saver & edge-provider: Saves traders hours of configuration and enhances consistency—worth the subscription cost over piecing together mash ups.
________________________________________
4. How does it work?
• Signal backbone: Custom supertrend uses Keltner bands crossing with close for direction, filtered by trend direction EMAs.
• Multi time logic: Trend defined by crossover of price over dynamic SMA thresholds built from ATR.
• Energy bar-colors/EMAs: 15 fast EMAs color-coded green/red to instantly show momentum.
• Entry logic: “Bull” when close crosses above supertrend; “Bear” when crosses below.
• Risk management: SL set at previous bar; up to 5 ATR scaled targets (or percentage based).
• Options formatted alerts: CALL/PUT labels with ₹¬currency values, embedded timestamp, SL/TP all printed on the chart.
________________________________________
5. How should traders use it?
• Best markets & timeframes: Ideal for intraday / low timeframe (1 15m) setups and 1 hour swing trades in equities, indices, options.
• Conditions: Works best in trending or volatility driven sessions—visible via Keltner bands and EMA energy alignment.
• Recommended combo: Use alongside volume filters or broader cycles; when supertrend & energy EMAs align, validation is stronger.
________________________________________
6. Proof of effectiveness?
• On chart visuals: Entry/exit labels, confirmed labels, TP and SL markers make past hits obvious.
• Real trade examples: Highlighted both bull & bear setups with full profit realization or SL hits.
• Performance is paint tested: Easy to showcase historic signals across multiple tickers.
• Data-backed: Users can export chart data to calculate win rate and avg return per trade.
________________________________________
Summary Pitch:
OptionHawk offers a holistic, execution-ready trading tool:
1. Proprietary blend of Keltner-supertrend and layered EMAs—beyond standard scripts.
2. Automates entries, multi-tier targets, SL, and options-format labels.
3. Visual energy overlays for quick momentum readings.
4. Use-tested in intraday and swing markets.
5. Installs on chart and works immediately—no setup complexity.
It's not a public indicator package; it's a self-contained, plug and play trade catalyst—worth subscribing for active traders seeking clarity, speed, and structure in their decision-making.
6. While OptionHawk is designed for clarity and structure, no script can predict the market. Always use with discretion and proper risk management.
---------------------------------------------------------------------------------------------------------------------
OptionHawk: A Comprehensive Trend-Following & Volatility-Adaptive Trading System
The "OptionHawk" script is a sophisticated trading tool designed to provide clear, actionable signals for options trading by combining multiple technical indicators and custom logic. It aims to offer a holistic view of market conditions, identifying trend direction, momentum, and potential entry/exit points with dynamic stop-loss and take-profit levels.
________________________________________
1. Why These Specific Indicators and Code Elements?
The "OptionHawk" script is a strategic fusion of the Supertrend indicator (modified with Keltner Channels), a multi-EMA "Energy" ribbon, dynamic trend lines (based on SMA and ATR), a 100-period Trend Filter EMA, and comprehensive trade management logic (SL/TP). My reason and motivation for this mashup stem from a desire to create a robust system that accounts for various market aspects often overlooked by individual indicators:
• Supertrend with Keltner Channels: The standard Supertrend is effective for trend identification but can sometimes generate whipsaws in volatile or ranging markets. By integrating Keltner Channels into the Supertrend calculation, the volatility measure becomes more adaptive, using the (high - low) range within the Keltner Channel for its ATR-like component. This aims to create a more responsive yet less prone-to-false-signals Supertrend.
• Multi-EMA "Energy" Ribbon: This visually striking element, composed of 15 EMAs, provides a quick glance at short-to-medium term momentum and potential support/resistance zones. When these EMAs are stacked and moving in one direction, it indicates strong "energy" behind the trend, reinforcing the signals from other indicators.
• Dynamic Trend Lines (SMA + ATR): These lines offer a visual representation of support and resistance that adapts to market volatility. Unlike static trend lines, their ATR-based offset ensures they remain relevant across different market conditions and asset classes, providing context for price action relative to the underlying trend.
• 100-Period Trend Filter EMA: A longer-period EMA acts as a higher-timeframe trend filter. This is crucial for confirming the direction identified by the faster-acting Supertrend, helping to avoid trades against the prevailing broader trend.
• Comprehensive Trade Management Logic: The script integrates automated calculation and display of stop-loss (SL) and multiple take-profit (TP) levels, along with trade confirmation and "TP Hit" labels. This is critical for practical trading, providing immediate, calculated risk-reward parameters that individual indicators typically don't offer.
This combination is driven by the need for a multi-faceted approach to trading that goes beyond simple signal generation to include trend confirmation, volatility adaptation, and essential risk management.
________________________________________
2. What Problem or Need Does This Mashup Solve?
This mashup addresses several critical gaps that existing individual indicators often fail to fill:
• Reliable Trend Identification in Volatile Markets: While Supertrend is good, it can be late or whipsaw. Integrating Keltner Channels helps it adapt to changing volatility, providing more reliable trend signals.
• Confirmation of Signals: A common pitfall of relying on a single indicator is false signals. "OptionHawk" uses the multi-EMA "Energy" ribbon and the 100-period EMA to confirm the trend identified by the Keltner-Supertrend, reducing false entries.
• Dynamic Support/Resistance & Trend Context: Static support and resistance levels can quickly become irrelevant. The dynamic SMA + ATR trend lines provide continually adjusting zones that reflect the current market's true support and resistance, giving traders a better understanding of price action within the trend.
• Integrated Risk and Reward Management: Most indicators just give entry signals. This script goes a significant step further by automatically calculating and displaying clear stop-loss and up to five take-profit levels (either ATR-based or percentage-based). This is a vital component for structured trading, allowing traders to pre-define their risk and reward for each trade.
• Visual Clarity and Actionable Information: Instead of requiring traders to layer multiple indicators manually, "OptionHawk" integrates them into a single, cohesive display with intuitive bar coloring, shape plots, and informative labels. This reduces cognitive load and presents actionable information directly on the chart.
In essence, "OptionHawk" provides a more comprehensive, adaptive, and actionable trading framework than relying on isolated indicators.
________________________________________
3. How Do the Components Work Together?
The various components of "OptionHawk" interact in a synergistic and often sequential manner to generate signals and manage trades:
• Keltner-Supertrend as the Primary Signal Generator: The supertrend function, enhanced by keltner_channel, is the core of the system. It identifies potential trend reversals and continuation signals (bullish/bearish crosses of the supertrendLine). The sensitivity and factor inputs directly influence how closely the Supertrend follows price and its responsiveness to volatility.
• Multi-EMA "Energy" Ribbon for Momentum and Confirmation: The 15 EMAs (from ema1 to ema15) are plotted to provide a visual representation of short-term momentum. When the price is above these EMAs and they are spread out and pointing upwards, it suggests strong bullish "energy." Conversely, when price is below them and they are pointing downwards, it indicates bearish "energy." This ribbon serves as a simultaneous visual confirmation for the Supertrend signals; a buy signal from Supertrend is stronger if the EMA ribbon is also indicating upward momentum.
• Dynamic Trend Lines for Context and Confirmation: The sma_high and sma_low lines, incorporating ATR, act as dynamic support and resistance. The trend variable, determined by price crossing these lines, provides an overarching directional bias. This component works conditionally with the Supertrend; a bullish Supertrend signal is more potent if the price is also above the sma_high (indicating an uptrend).
• 100-Period Trend Filter EMA for Macro Trend Confirmation: The ema100 acts as a macro trend filter. Supertrend signals are typically considered valid if they align with the direction of the ema100. For example, a "BUY" signal from the Keltner-Supertrend is ideally taken only if the price is also above the ema100, signifying that the smaller trend aligns with the larger trend. This is a conditional filter.
• Trade Confirmation and SL/TP Logic (Sequential and Conditional):
• Once a bull or bear signal is generated by the Keltner-Supertrend, the tradeSignalCall or tradeSignalPut is set to true.
• A confirmation step then occurs for a "BUY" signal, the script checks if the close of the next bar is higher than the entry bar's close. For a "SELL" signal, it checks if the close of the next bar is lower. This is a sequential confirmation step aimed at filtering out weak signals.
• Upon a confirmed signal, the stop-loss (SL) is immediately set based on the previous bar's low (for calls) or high (for puts).
• Multiple take-profit (TP) levels are calculated and stored in arrays. These can be based on a fixed percentage or dynamic ATR multiples, based on user input.
• The TP HIT logic continuously monitors price action simultaneously against these pre-defined target levels, displaying labels when a target is reached. The SL HIT logic similarly monitors for a stop-loss breach.
In summary, the Supertrend generates the initial signal, which is then confirmed by the dynamic trend lines and the 100-period EMA, and visually reinforced by the EMA "Energy" ribbon. The trade management logic then takes over, calculating and displaying vital risk-reward parameters.
________________________________________
4. What is the Purpose of the Mashup Beyond Simply Merging Code?
The purpose of "OptionHawk" extends far beyond merely combining different indicator codes; it's about creating a structured and informed decision-making process for options trading. The key strategic insights and functionalities added by combining these elements are:
• Enhanced Signal Reliability and Reduced Noise: By requiring multiple indicators to align (e.g., Keltner-Supertrend signal confirmed by EMA trend filter and dynamic trend lines), the script aims to filter out false signals and whipsaws that commonly plague individual indicators. This leads to higher-probability trade setups.
• Adaptive Risk Management: The integration of ATR into both the Supertrend calculation and the dynamic stop-loss/take-profit levels makes the entire system adaptive to current market volatility. This means stop-losses and targets are not static but expand or contract with the market's price swings, promoting more realistic risk management.
• Clear Trade Entry and Exit Framework: The script provides a complete trading plan with each signal: a clear entry point, a precise stop-loss, and multiple cascading take-profit levels. This holistic approach empowers traders to manage their trades effectively from initiation to conclusion, rather than just identifying a potential entry.
• Visual Confirmation of Market Strength: The "Energy" ribbon and dynamic trend lines provide an immediate visual understanding of the market's momentum and underlying trend strength, helping traders gauge conviction behind a signal.
• Improved Backtesting and Analysis: By combining these elements into one script, traders can more easily backtest a comprehensive strategy rather than trying to manually combine signals from multiple overlaying indicators, leading to more accurate strategy analysis.
• Suitability for Options Trading: Options contracts are highly sensitive to price movement and volatility. This script's focus on confirmed trend identification, dynamic volatility adaptation, and precise risk management makes it particularly well-suited for the nuanced demands of options trading, where timing and defined risk are paramount.
________________________________________
5. What New Functionality or Insight Does Your Script Offer?
"OptionHawk" offers several new functionalities and insights that significantly enhance decision-making, improve accuracy, and provide clearer signals and better timing for traders:
• "Smart" Supertrend: By basing the Supertrend's volatility component on the Keltner Channel's range instead of a simple ATR, the Supertrend becomes more sensitive to price action within its typical bounds while still adapting to broader market volatility. This can lead to earlier and more relevant trend change signals.
• Multi-Confirmation System: The script doesn't just provide a signal; it layers multiple confirmations (Keltner-Supertrend, multi-EMA "Energy" coloration, dynamic trend lines, and the 100-period EMA). This multi-layered validation significantly improves the accuracy of signals by reducing the likelihood of false positives.
• Automated and Dynamic Risk-Reward Display: This is a major functionality enhancement. The automatic calculation and clear display of stop-loss and five distinct take-profit levels (based on either ATR or percentage) directly on the chart, along with "TP HIT" and "SL HIT" labels, streamline the trading process. Traders no longer need to manually calculate these crucial levels, leading to enhanced decision-making and better risk management.
• Visual Trend "Energy" and Momentum: The vibrant coloring of the multi-EMA ribbon based on price relative to the EMA provides an intuitive and immediate visual cue for market momentum and "energy." This offers an insight into the strength of the current move, which isn't available from single EMA plots.
• Post-Signal Confirmation: The "Confirmation" label appearing on the bar after a signal, if the price continues in the signaled direction, adds an extra layer of real-time validation. This helps to improve signal timing by waiting for initial follow-through.
• Streamlined Options Trading Planning: For options traders, having clear entry prices, stop-losses, and multiple target levels directly annotated on the chart is invaluable. It helps in quickly assessing potential premium movements and managing positions effectively.
In essence, "OptionHawk" transitions from a collection of indicators to a semi-automated trading assistant, providing a comprehensive, visually rich, and dynamically adaptive framework for making more informed and disciplined trading decisions.
----------------------------------------------------------------------------------------------------------------
Performance & Claims
1. What is the claimed performance of the script or strategy?
Answer: The script does not claim any specific performance metrics (e.g., win rate, profit factor, percentage gains). It's an indicator designed to identify potential buy/sell signals and target/stop-loss levels. The labels it generates ("BUY CALL," "BUY PUT," "TP HIT," "SL HIT") are informational based on its internal logic, not a representation of actual trading outcomes.
2. Is there any proof or backtesting to support this claim?
Answer: No, the provided code does not include any backtesting functionality or historical performance proof. As an indicator, it simply overlays visual signals on the chart. To obtain backtesting results, the logic would need to be implemented as a Pine Script strategy with entry/exit rules and commission/slippage considerations.
3. Are there any unrealistic or exaggerated performance expectations being made?
Answer: The script itself does not make any performance expectations. It avoids quantitative claims. However, if this script were presented to users with implied promises of profit based solely on the visual signals, that would be unrealistic.
4. Have you clearly stated the limitations of the performance data (e.g., “based on backtesting only”)?
Answer: There is no statement of performance data or its limitations because the script doesn't generate performance data.
5. Do you include a disclaimer that past results do not guarantee future performance?
Answer: No, the script does not include any disclaimers about past or future performance. This is typically found in accompanying documentation or marketing materials for a trading system, not within the indicator's code itself.
________________________________________
Evidence & Transparency
6. How are your performance results measured (e.g., profit factor, win rate, Sharpe ratio)?
Answer: Performance results are not measured by this script. It's an indicator.
7. Are these results reproducible by others using the same script and settings?
Answer: The visual signals and calculated levels (Supertrend line, EMAs, target/SL levels) generated by the script are reproducible on TradingView when applied to the same instrument, timeframe, and with the same input settings. However, the actual trading results (profit/loss) are not generated or reproducible by this indicator.
8. Do you include enough data (charts, equity curves, trade logs) to support your claims?
Answer: No, the script does not include or generate equity curves or trade logs. It provides visual labels on the chart, which can be seen as a form of "data" to support the signal generation, but not the performance claims (as none are made by the code).
________________________________________
Future Expectations
9. Are you making any predictions about future market performance?
Answer: No, the script does not make any explicit predictions about future market performance. Its signals are based on historical price action and indicator calculations.
10. Have you stated clearly that the future is fundamentally uncertain?
Answer: No, the script does not contain any statements about the uncertainty of the future.
11. Are forward-looking statements presented with caution and appropriate language?
Answer: The script does not contain any forward-looking statements beyond the visual signals it generates based on real-time data.
________________________________________
Risk & Disclosure
12. Have you disclosed the risks associated with using your script or strategy?
Answer: No, the script does not include any risk disclosures. This is typically found in external documentation.
13. Do you explain that trading involves potential loss as well as gain?
Answer: No, the script does not contain any explanation about the potential for loss in trading.
________________________________________
Honesty & Integrity
14. Have you avoided hype words like “guaranteed,” “foolproof,” or “no losses”?
Answer: Yes, the script itself avoids these hype words. The language used within the code is technical and describes the indicator's logic.
15. Is your language grounded and realistic rather than promotional?
Answer: Yes, the language within the provided Pine Script code is grounded and realistic as it pertains to the technical implementation of an indicator.
16. Are you leaving out any important details that might mislead users (e.g., selective performance snapshots)?
Answer: From the perspective of the code itself, no, it's not "leaving out" performance details because it's not designed to generate them. However, if this indicator were to be presented as a "strategy" that implies profitability without accompanying disclaimers, backtesting results, and risk disclosures, then that external presentation could be misleading. The script focuses on signal generation and visual representation.
⚠️ Disclaimer:
This indicator is for informational and educational purposes only. It does not guarantee any future results or performance. All trading involves risk. Please assess your own risk tolerance and consult a licensed financial advisor if needed. Past performance does not indicate future returns.

3 Bar Reversal3 Bar Reversal
This pattern is described in John Carter's "Mastering the Trade"
The 3 Bar Reversal indicator is a simple but effective price action tool designed to highlight potential short-term reversals in market direction. It monitors consecutive bar behavior and identifies turning points based on a three-bar pattern. This tool can assist traders in spotting trend exhaustion or early signs of a reversal, particularly in scalping or short-term trading strategies.
How It Works
This indicator analyzes the relationship between consecutive bar closes:
It counts how many bars have passed since the price closed higher than the previous close (barssince(close >= close )) — referred to as an "up streak".
It also counts how many bars have passed since the price closed lower than the previous close (barssince(close <= close )) — known as a "down streak".
A reversal condition is met when:
There have been exactly 3 bars in a row moving in one direction (up or down), and
The 4th bar closes in the opposite direction.
When this condition is detected, the script performs two actions:
Plots a triangle on the chart to signal the potential reversal:
A green triangle below the bar for a possible long (buy) opportunity.
A red triangle above the bar for a possible short (sell) opportunity.
Triggers an alert condition so users can set notifications for when a reversal is detected.
Interpretation
Long Signal: The market has printed 3 consecutive lower closes, followed by a higher close — suggesting bullish momentum may be emerging.
Short Signal: The market has printed 3 consecutive higher closes, followed by a lower close — indicating possible bearish momentum.
These patterns are common in market retracements and can act as confirmation signals when used with other indicators such as RSI, MACD, support/resistance, or volume analysis.
Usage Examples
Scalping: Use the reversal signal to quickly enter short-term trades after a short-term exhaustion move.
Swing Trading: Combine this with trend indicators (e.g., moving averages) to time pullbacks within larger trends.
Confirmation Tool: Use this indicator alongside candlestick patterns or support/resistance zones to validate entry or exit points.
Alert Setup: Enable alerts based on the built-in alertcondition to receive instant notifications for potential trade setups.
Limitations
The 3-bar reversal logic does not guarantee a trend change; it signals potential reversals, which may need confirmation.
Best used in conjunction with broader context such as trend direction, market structure, or other technical indicators.

Topological Market Stress (TMS) - Quantum FabricTopological Market Stress (TMS) - Quantum Fabric
What Stresses The Market?
Topological Market Stress (TMS) represents a revolutionary fusion of algebraic topology and quantum field theory applied to financial markets. Unlike traditional indicators that analyze price movements linearly, TMS examines the underlying topological structure of market data—detecting when the very fabric of market relationships begins to tear, warp, or collapse.
Drawing inspiration from the ethereal beauty of quantum field visualizations and the mathematical elegance of topological spaces, this indicator transforms complex mathematical concepts into an intuitive, visually stunning interface that reveals hidden market dynamics invisible to conventional analysis.
Theoretical Foundation: Topology Meets Markets
Topological Holes in Market Structure
In algebraic topology, a "hole" represents a fundamental structural break—a place where the normal connectivity of space fails. In markets, these topological holes manifest as:
Correlation Breakdown: When traditional price-volume relationships collapse
Volatility Clustering Failure: When volatility patterns lose their predictive power
Microstructure Stress: When market efficiency mechanisms begin to fail
The Mathematics of Market Topology
TMS constructs a topological space from market data using three key components:
1. Correlation Topology
ρ(P,V) = correlation(price, volume, period)
Hole Formation = 1 - |ρ(P,V)|
When price and volume decorrelate, topological holes begin forming.
2. Volatility Clustering Topology
σ(t) = volatility at time t
Clustering = correlation(σ(t), σ(t-1), period)
Breakdown = 1 - |Clustering|
Volatility clustering breakdown indicates structural instability.
3. Market Efficiency Topology
Efficiency = |price - EMA(price)| / ATR
Measures how far price deviates from its efficient trajectory.
Multi-Scale Topological Analysis
Markets exist across multiple temporal scales simultaneously. TMS analyzes topology at three distinct scales:
Micro Scale (3-15 periods): Immediate structural changes, market microstructure stress
Meso Scale (10-50 periods): Trend-level topology, medium-term structural shifts
Macro Scale (50-200 periods): Long-term structural topology, regime-level changes
The final stress metric combines all scales:
Combined Stress = 0.3×Micro + 0.4×Meso + 0.3×Macro
How TMS Works
1. Topological Space Construction
Each market moment is embedded in a multi-dimensional topological space where:
- Price efficiency forms one dimension
- Correlation breakdown forms another
- Volatility clustering breakdown forms the third
2. Hole Detection Algorithm
The indicator continuously scans this topological space for:
Hole Formation: When stress exceeds the formation threshold
Hole Persistence: How long structural breaks maintain
Hole Collapse: Sudden topology restoration (regime shifts)
3. Quantum Visualization Engine
The visualization system translates topological mathematics into intuitive quantum field representations:
Stress Waves: Main line showing topological stress intensity
Quantum Glow: Surrounding field indicating stress energy
Fabric Integrity: Background showing structural health
Multi-Scale Rings: Orbital representations of different timeframes
4. Signal Generation
Stable Topology (✨): Normal market structure, standard trading conditions
Stressed Topology (⚡): Increased structural tension, heightened volatility expected
Topological Collapse (🕳️): Major structural break, regime shift in progress
Critical Stress (🌋): Extreme conditions, maximum caution required
Inputs & Parameters
🕳️ Topological Parameters
Analysis Window (20-200, default: 50)
Primary period for topological analysis
20-30: High-frequency scalping, rapid structure detection
50: Balanced approach, recommended for most markets
100-200: Long-term position trading, major structural shifts only
Hole Formation Threshold (0.1-0.9, default: 0.3)
Sensitivity for detecting topological holes
0.1-0.2: Very sensitive, detects minor structural stress
0.3: Balanced, optimal for most market conditions
0.5-0.9: Conservative, only major structural breaks
Density Calculation Radius (0.1-2.0, default: 0.5)
Radius for local density estimation in topological space
0.1-0.3: Fine-grained analysis, sensitive to local changes
0.5: Standard approach, balanced sensitivity
1.0-2.0: Broad analysis, focuses on major structural features
Collapse Detection (0.5-0.95, default: 0.7)
Threshold for detecting sudden topology restoration
0.5-0.6: Very sensitive to regime changes
0.7: Balanced, reliable collapse detection
0.8-0.95: Conservative, only major regime shifts
📊 Multi-Scale Analysis
Enable Multi-Scale (default: true)
- Analyzes topology across multiple timeframes simultaneously
- Provides deeper insight into market structure at different scales
- Essential for understanding cross-timeframe topology interactions
Micro Scale Period (3-15, default: 5)
Fast scale for immediate topology changes
3-5: Ultra-fast, tick/minute data analysis
5-8: Fast, 5m-15m chart optimization
10-15: Medium-fast, 30m-1H chart focus
Meso Scale Period (10-50, default: 20)
Medium scale for trend topology analysis
10-15: Short trend structures
20-25: Medium trend structures (recommended)
30-50: Long trend structures
Macro Scale Period (50-200, default: 100)
Slow scale for structural topology
50-75: Medium-term structural analysis
100: Long-term structure (recommended)
150-200: Very long-term structural patterns
⚙️ Signal Processing
Smoothing Method (SMA/EMA/RMA/WMA, default: EMA) Method for smoothing stress signals
SMA: Simple average, stable but slower
EMA: Exponential, responsive and recommended
RMA: Running average, very smooth
WMA: Weighted average, balanced approach
Smoothing Period (1-10, default: 3)
Period for signal smoothing
1-2: Minimal smoothing, noisy but fast
3-5: Balanced, recommended for most applications
6-10: Heavy smoothing, slow but very stable
Normalization (Fixed/Adaptive/Rolling, default: Adaptive)
Method for normalizing stress values
Fixed: Static 0-1 range normalization
Adaptive: Dynamic range adjustment (recommended)
Rolling: Rolling window normalization
🎨 Quantum Visualization
Fabric Style Options:
Quantum Field: Flowing energy visualization with smooth gradients
Topological Mesh: Mathematical topology with stepped lines
Phase Space: Dynamical systems view with circular markers
Minimal: Clean, simple display with reduced visual elements
Color Scheme Options:
Quantum Gradient: Deep space blue → Quantum red progression
Thermal: Black → Hot orange thermal imaging style
Spectral: Purple → Gold full spectrum colors
Monochrome: Dark gray → Light gray elegant simplicity
Multi-Scale Rings (default: true)
- Display orbital rings for different time scales
- Visualizes how topology changes across timeframes
- Provides immediate visual feedback on cross-scale dynamics
Glow Intensity (0.0-1.0, default: 0.6)
Controls the quantum glow effect intensity
0.0: No glow, pure line display
0.6: Balanced, recommended setting
1.0: Maximum glow, full quantum field effect
📋 Dashboard & Alerts
Show Dashboard (default: true)
Real-time topology status display
Current market state and trading recommendations
Stress level visualization and fabric integrity status
Show Theory Guide (default: true)
Educational panel explaining topological concepts
Dashboard interpretation guide
Trading strategy recommendations
Enable Alerts (default: true)
Extreme stress detection alerts
Topological collapse notifications
Hole formation and recovery signals
Visual Logic & Interpretation
Main Visualization Elements
Quantum Stress Line
Primary indicator showing topological stress intensity
Color intensity reflects current market state
Line style varies based on selected fabric style
Glow effect indicates stress energy field
Equilibrium Line
Silver line showing average stress level
Reference point for normal market conditions
Helps identify when stress is elevated or suppressed
Upper/Lower Bounds
Red upper bound: High stress threshold
Green lower bound: Low stress threshold
Quantum fabric fill between bounds shows stress field
Multi-Scale Rings
Aqua circles : Micro-scale topology (immediate changes)
Orange circles: Meso-scale topology (trend-level changes)
Provides cross-timeframe topology visualization
Dashboard Information
Topology State Icons:
✨ STABLE: Normal market structure, standard trading conditions
⚡ STRESSED: Increased structural tension, monitor closely
🕳️ COLLAPSE: Major structural break, regime shift occurring
🌋 CRITICAL: Extreme conditions, reduce risk exposure
Stress Bar Visualization:
Visual representation of current stress level (0-100%)
Color-coded based on current topology state
Real-time percentage display
Fabric Integrity Dots:
●●●●● Intact: Strong market structure (0-30% stress)
●●●○○ Stressed: Weakening structure (30-70% stress)
●○○○○ Fractured: Breaking down structure (70-100% stress)
Action Recommendations:
✅ TRADE: Normal conditions, standard strategies apply
⚠️ WATCH: Monitor closely, increased vigilance required
🔄 ADAPT: Change strategy, regime shift in progress
🛑 REDUCE: Lower risk exposure, extreme conditions
Trading Strategies
In Stable Topology (✨ STABLE)
- Normal trading conditions apply
- Use standard technical analysis
- Regular position sizing appropriate
- Both trend-following and mean-reversion strategies viable
In Stressed Topology (⚡ STRESSED)
- Increased volatility expected
- Widen stop losses to account for higher volatility
- Reduce position sizes slightly
- Focus on high-probability setups
- Monitor for potential regime change
During Topological Collapse (🕳️ COLLAPSE)
- Major regime shift in progress
- Adapt strategy immediately to new market character
- Consider closing positions that rely on previous regime
- Wait for new topology to stabilize before major trades
- Opportunity for contrarian plays if collapse is extreme
In Critical Stress (🌋 CRITICAL)
- Extreme market conditions
- Significantly reduce risk exposure
- Avoid new positions until stress subsides
- Focus on capital preservation
- Consider hedging existing positions
Advanced Techniques
Multi-Timeframe Topology Analysis
- Use higher timeframe TMS for regime context
- Use lower timeframe TMS for precise entry timing
- Alignment across timeframes = highest probability trades
Topology Divergence Trading
- Most powerful at regime boundaries
- Price makes new high/low but topology stress decreases
- Early warning of potential reversals
- Combine with key support/resistance levels
Stress Persistence Analysis
- Long periods of stable topology often precede major moves
- Extended stress periods often resolve in regime changes
- Use persistence tracking for position sizing decisions
Originality & Innovation
TMS represents a genuine breakthrough in applying advanced mathematics to market analysis:
True Topological Analysis: Not a simplified proxy but actual topological space construction and hole detection using correlation breakdown, volatility clustering analysis, and market efficiency measurement.
Quantum Aesthetic: Transforms complex topology mathematics into an intuitive, visually stunning interface inspired by quantum field theory visualizations.
Multi-Scale Architecture: Simultaneous analysis across micro, meso, and macro timeframes provides unprecedented insight into market structure dynamics.
Regime Detection: Identifies fundamental market character changes before they become obvious in price action, providing early warning of structural shifts.
Practical Application: Clear, actionable signals derived from advanced mathematical concepts, making theoretical topology accessible to practical traders.
This is not a combination of existing indicators or a cosmetic enhancement of standard tools. It represents a fundamental reimagining of how we measure, visualize, and interpret market dynamics through the lens of algebraic topology and quantum field theory.
Best Practices
Start with defaults: Parameters are optimized for broad market applicability
Match timeframe: Adjust scales based on your trading timeframe
Confirm with price action: TMS shows market character, not direction
Respect topology changes: Reduce risk during regime transitions
Use appropriate strategies: Adapt approach based on current topology state
Monitor persistence: Track how long topology states maintain
Cross-timeframe analysis: Align multiple timeframes for highest probability trades
Alerts Available
Extreme Topological Stress: Market fabric under severe deformation
Topological Collapse Detected: Regime shift in progress
Topological Hole Forming: Market structure breakdown detected
Topology Stabilizing: Market structure recovering to normal
Chart Requirements
Recommended Markets: All liquid markets (forex, stocks, crypto, futures)
Optimal Timeframes: 5m to Daily (adaptable to any timeframe)
Minimum History: 200 bars for proper topology construction
Best Performance: Markets with clear regime characteristics
Academic Foundation
This indicator draws from cutting-edge research in:
- Algebraic topology and persistent homology
- Quantum field theory visualization techniques
- Market microstructure analysis
- Multi-scale dynamical systems theory
- Correlation topology and network analysis
Disclaimer
This indicator is for educational and research purposes only. It does not constitute financial advice or provide direct buy/sell signals. Topological analysis reveals market structure characteristics, not future price direction. Always use proper risk management and combine with your own analysis. Past performance does not guarantee future results.
See markets through the lens of topology. Trade the structure, not the noise.
Bringing advanced mathematics to practical trading through quantum-inspired visualization.
Trade with insight. Trade with structure.
— Dskyz , for DAFE Trading Systems

Quantum Delta Zones with EnhancementsQuantum Delta Zones (QDZ)
Short Title: QDZ
Overview
The Quantum Delta Zones (QDZ) is a unique technical indicator designed to highlight high-probability order block zones in the market based on a combination of Delta Sensitivity, order block tightness, and volume-based filters.
This indicator helps traders to identify key support and resistance levels (bullish and bearish order blocks) that are backed by strong volume and optimal market structure. It employs advanced zone detection and automatic zone management (box creation and deletion) to enhance trade analysis.
The primary objective of QDZ is to provide clear, visually appealing support/resistance zones while factoring in market order flow dynamics, ensuring that you are trading at optimal levels with confirmed volume behind it.
Key Features
Delta Sensitivity: The indicator uses a body-to-range ratio to assess the "delta" between the body and wick of each candlestick, helping to identify strong order block formations based on market sentiment.
Order Block Tightness: A filter is used to detect small, tight order blocks where price action shows accumulation (small body candles) near high-probability levels.
Projection Distance: The ability to project the detected order block zones into the future, providing an idea of where price might react based on historical price action.
Fade Strength: Allows you to adjust the transparency of the projected zones, giving you visual flexibility depending on how prominent you want these order blocks to appear.
Volume Filter: A high-volume filter ensures that only zones with substantial volume (based on a moving average) are considered for box creation, preventing false signals and low-probability trades.
Auto Box Deletion: When the market invalidates a zone (price moves beyond the zone’s projected area), the boxes are automatically deleted to keep the chart clean.
Alerts: Built-in alerts for when a bullish or bearish order block is detected, providing real-time notifications of significant potential trading opportunities.
How it Works
Step-by-Step Explanation:
Delta Sensitivity:
A candlestick is considered "Bullish" if the closing price is above the opening price and the body-to-range ratio is above the user-defined delta Sensitivity.
A candlestick is considered "Bearish" if the closing price is below the opening price with the same body-to-range ratio criteria.
Order Block Tightness:
The indicator looks for tight order blocks, where the body-to-range ratio is below the orderBlock Tightness setting, indicating small candles that may represent accumulation or distribution zones.
Volume Filter:
The indicator applies a filter to check if the volume is above the 50-period simple moving average (SMA) and multiplied by the user-defined volume Multiplier. Only zones with sufficient volume are considered.
Box Creation:
Once a valid order block is detected, the corresponding bullish or bearish box is drawn on the chart. These boxes extend forward by the number of bars specified by projection Bars.
Box Deletion:
If the price moves against the order block (for example, if a bullish box is invalidated when the price closes below its bottom), the box is automatically deleted to keep your chart uncluttered.
Alert System:
Alerts can be set for both bullish and bearish order block detection, notifying traders of the formation of a potential market opportunity.
Inputs / Settings
Delta Sensitivity: The ratio between the candlestick body and its range. Higher values mean stronger bullish/bearish pressure is required to trigger the order block detection.
Order Block Tightness: Defines how tight or small an order block should be to qualify for detection. Smaller values are more sensitive to smaller candlesticks.
Projection Distance: The number of bars into the future that the identified order block should be projected. Useful for seeing potential future support/resistance zones.
Fade Strength: Defines the transparency level of the order block boxes. Higher values result in more transparent boxes, lower values make the boxes more opaque.
Auto Delete: Automatically deletes order blocks if they are invalidated by price action.
Volume Filter: When enabled, only order blocks formed with higher-than-average volume will be considered. This helps eliminate low-probability signals.
Volume Multiplier: Multiplies the average volume by this factor to determine whether the current volume qualifies as "high" for an order block detection.
Visuals
Bullish Order Block: A green box is drawn when a bullish order block is detected. The box is projected forward based on the projection Bars setting.
Bearish Order Block: A red box is drawn when a bearish order block is detected. Similar to the bullish box, it is projected forward.
Fading: Both bullish and bearish boxes fade based on the fade Strength, making the most recent zones more visible while fading out older, less relevant zones.
How to Use in Trading
Bullish Order Block:
A bullish order block is a potential buy area. Once price retraces to the bottom of a detected bullish box, traders may consider it a buy zone, especially if it aligns with other technical factors (e.g., support, trend).
Bearish Order Block:
A bearish order block is a potential sell area. Once price retraces to the top of a detected bearish box, traders may consider it a sell zone, particularly in downtrends or near resistance.
Risk Management:
The projection Bars setting helps to set a clear projection distance. Traders should use their own risk management strategies, such as stop-loss placements below/above the order block zones, and take-profit levels based on market conditions.
Volume Confirmation:
The Volume Filter can be very useful for confirming order blocks. Trading only when an order block is accompanied by high volume ensures the zone has institutional or market-maker backing.
Box Deletion:
The Auto Delete feature automatically removes invalidated zones, keeping the chart clean and preventing you from trading out-of-date or broken levels.
Trading Strategy Example
Bullish Setup:
Look for a bullish order block (green box) formed after price has been trending down and volume is high.
Wait for price to retrace back into the order block zone.
Enter long at the bottom of the order block when price shows signs of support (e.g., bullish candlestick pattern).
Set stop-loss below the bottom of the order block and a take-profit target at a significant resistance level.
Bearish Setup:
Look for a bearish order block (red box) formed after price has been trending up and volume is high.
Wait for price to retrace back into the order block zone.
Enter short at the top of the order block when price shows signs of resistance (e.g., bearish candlestick pattern).
Set stop-loss above the top of the order block and a take-profit target at a significant support level.
Limitations
The QDZ indicator is based on historical price action, and while it is designed to identify areas of strong market participation, it does not guarantee future price behavior.
Traders should always combine this indicator with other technical analysis tools, such as trend analysis, oscillators, or fundamental factors, to improve their decision-making process.
Conclusion
The Quantum Delta Zones (QDZ) indicator is a powerful tool for traders looking to pinpoint high-probability order blocks that are backed by volume and strong market dynamics.
It integrates well with existing trading strategies by providing clear, actionable zones of support and resistance, while also offering advanced features like fade strength, auto-deletion, and volume filters.
Whether you're trading intraday or longer-term, this tool can be an essential part of your trading toolbox.
This is an educational idea, trade at your own desecration.
Regards.

Radonezh Kir-Mary Beauty editionOverview
Dedicated to rev. Kirill and Mary of Radonezh.
This indicator uniquely combines Cumulative Volume Delta (CVD) and price momentum with dynamic normalization to identify trend strength, reversals, supported by a combination of more traditional signal logic. Unlike traditional momentum oscillators, it integrates volume dynamics and advanced directional index to filter false signals and adapts to market volatility through automated scaling, offering a holistic view of price-action reliability.
Core Innovations
Adapive Signals: Uses a proprietary correlation algorithm to weight momentum values, reducing noise in choppy markets.
Lower timeframe entry points: (currently 1 minute only) and HTF line statuses for timeframe synchronisation (currently only 15 minutes and 1 hour status) for super-precise entry points
Automatic drawing of resistance and support lines based on the proprietary algorithm for detecting volume/price synchronization and desynchronization levels.
"Victor-predictor": price chart pointing line that shows where the price supposedly goes based on the machine-learning simulation with pine script based on the main 3 traditional classical indicators. Works independently from the rest of the indicator. Developed by @Skorcez (same team).
Automatic recognition of possible long and short stop order placement levels. I do not filter them so use only within the general context of the indicator.
Key Features
Volume-Price Correlation: CVD reflects institutional order flow, while price momentum quantifies trend acceleration.
Auto-Scaling: Adjusts output range based on recent volatility (ATR), preventing overbought/oversold false positives.
Visual Alerts: Marks divergence zones with colored trendlines and labels (regular/hidden bullish/bearish).
Unique Value
By fusing volume delta dynamics with momentum filtering, this script addresses a critical gap in traditional indicators that treat price and volume in isolation. The closed-source logic focuses on institutional accumulation/distribution patterns, providing actionable signals without repainting.
Compatible with all assets and timeframes. No promotional content or external links included.
============================================
Trading strategy
============================================
Position Signals via DEMA Momentum Line Coloration
The main indicator line (orange/black) determines entry/exits based on its color intensity, which reflects trend strength and confirmation from filtered signals. Here's how it works:
Long Positions (Green/Teal)
Weak Long:
Dark Green = Price momentum rising without volume/Machine Learning (ML) confirmation.
Example: main line turns green but lacks volume spikes or ML buy signals.
Strong Long:
Bright Green = Momentum confirmed by:
Volume Surge: Volume exceeds 1.5x 20-period average.
ML Confirmation: ML score > 0.7 with price above EMA20.
Post-Drop Recovery: Price rebounds after a >1% drop on high volume. (not active as of now, will add a bit later, still working on it)
Short Positions (Red/Orange)
Weak Short:
Orange = Momentum declines without bearish confirmation.
Strong Short:
Bright Red = Confirmed by:
Volume Divergence: Rising price with falling CVD momentum.
ML Bearish: ML score > 0.7 + price below EMA20.
Overextension: RSI > 70 + price above upper Bollinger Band.
Neutral (Gray)
Flat Momentum:
Gray = Momentum near zero (±0.05) + low volatility (ATR < 1% of price).
Action: Avoid trades until color intensifies or stay in a position with a trailing stoploss until it's clear where the market goes (use HTF signal colour table to know what to expect).
Key Features
Adaptive Confirmation:
Colors brighten when signals align across:
Volume acceleration
RSI and a few other extremes (oversold/overbought)
Machine Learning predictions
Dynamic Risk Zones:
Gray areas highlight low-confidence periods, while bright colors mark high-probability entries.
Usage: Enter longs when the line turns bright green and exits when it fades to dark green/gray. Reverse for shorts. Combine with the built-in Victor-Predictor signals for optimal accuracy
============================================
Plans to add soon:
============================================
Dynamic Normalization: Scales CVD and price momentum to a fixed range (default: -20 to +20) using volatility-adjusted multipliers, ensuring consistent interpretation across assets/timeframes.
Divergence Detection: Flags discrepancies between volume-driven momentum (CVD) and price trends, highlighting potential reversals.
Adding 2 nearest psychological support and resistance levels.
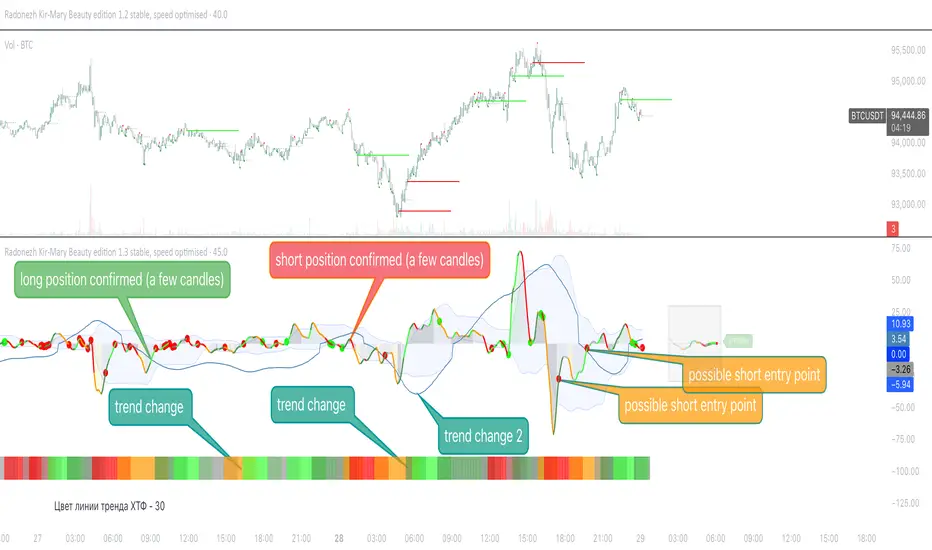
Dskyz (DAFE) Aurora Divergence - Dskyz (DAFE) Aurora Divergence Indicator
Advanced Divergence Detection for Traders. Unleash the power of divergence trading with this cutting-edge indicator that combines price and volume analysis to spot high-probability reversal signals.
🧠 What Is It?
The Dskyz (DAFE) Aurora Divergence Indicator is designed to identify bullish and bearish divergences between the price trend and the On Balance Volume (OBV) trend. Divergence occurs when the price of an asset and a technical indicator (in this case, OBV) move in opposite directions, signaling a potential reversal. This indicator uses linear regression slopes to calculate the trends of both price and OBV over a specified lookback period, detecting when these two metrics are diverging. When a divergence is detected, it highlights potential reversal points with visually striking aurora bands, orbs, and labels, making it easy for traders to spot key signals.
⚙️ Inputs & How to Use Them
The indicator is highly customizable, with inputs grouped under "⚡ DAFE Aurora Settings" for clarity. Here’s how each input works:
Lookback Period: Determines how many bars are used to calculate the price and OBV slopes. Higher values detect longer-term trends (e.g., 20 for 1H charts), while lower values are more responsive to short-term movements.
Price Slope Threshold: Sets the minimum slope value for the price to be considered in an uptrend or downtrend. A value of 0 allows all slopes to be considered, while higher values filter for stronger trends.
OBV Slope Threshold: Similar to the price slope threshold but for OBV. Helps filter out weak volume trends.
Aurora Band Width: Adjusts the width of the visual bands that highlight divergence areas. Wider bands make the indicator more visible but may clutter the chart.
Divergence Sensitivity: Scales the strength of the divergence signals. Higher values make the indicator more sensitive to smaller divergences.
Minimum Strength: Filters out weak signals by only showing divergences above this strength level. A default of 0.3 is recommended for beginners.
Signal Cooldown (Bars): Prevents multiple signals from appearing too close together. Default is 5 bars, reducing chart clutter and helping traders focus on significant signals.
These inputs allow traders to fine-tune the indicator to match their trading style and timeframe.
🚀 What Makes It Unique?
This indicator stands out with its innovative features:
Price-Volume Divergence: Combines price trend (slope) and OBV trend for more reliable signals than price-only divergences.
Aurora Bands: Dynamic visual bands that highlight divergence zones, making it easier to spot potential reversals at a glance.
Interactive Dashboard: Displays real-time information on trend direction, volume flow, signal type, strength, and recommended actions (e.g., "Consider Buying" or "Consider Selling").
Signal Cooldown: Ensures only the most significant divergences are shown, reducing noise and improving usability.
Alerts: Built-in alerts for both bullish and bearish divergences, allowing traders to stay informed even when not actively monitoring the chart.
Beginner Guide: Explains the indicator’s visuals (e.g., aqua orbs for bullish signals, fuchsia orbs for bearish signals), making it accessible for new users.
🎯 Why It Works
The indicator’s effectiveness lies in its use of price-volume divergence, a well-established concept in technical analysis. When the price trend and OBV trend diverge, it often signals a potential reversal because the underlying volume support (or lack thereof) is not aligning with the price action. For example:
Bullish Divergence: Occurs when the price is making lower lows, but the OBV is making higher lows, indicating weakening selling pressure and potential upward reversal.
Bearish Divergence: Occurs when the price is making higher highs, but the OBV is making lower highs, suggesting weakening buying pressure and potential downward reversal.
The use of linear regression ensures smooth and accurate trend calculations over the specified lookback period. The divergence strength is then normalized and filtered based on user-defined thresholds, ensuring only high-quality signals are displayed. Additionally, the cooldown period prevents signal overload, allowing traders to focus on the most significant opportunities.
🧬 Indicator Recommendation
Best For: Traders looking to identify potential trend reversals in any market, especially those where volume data is reliable (e.g., stocks, futures, forex).
Timeframes: Suitable for all timeframes. Adjust the lookback period accordingly—smaller values for shorter timeframes (e.g., 1H), larger for longer ones (e.g., 4H or daily).
Pair With: Support and resistance levels, trend lines, other oscillators (e.g., RSI, MACD) for confirmation, and volume profile tools for deeper analysis.
Tips:
Look for divergences at key support/resistance levels for higher-probability setups.
Pay attention to signal strength; higher strength divergences are often more reliable.
Use the dashboard to quickly assess market conditions before entering a trade.
Set up alerts to catch divergences even when not actively watching the chart.
🧾 Credit & Acknowledgement
This indicator builds upon the classic concept of price-volume divergence, enhancing it with modern visualization techniques, advanced filtering, and user-friendly features. It is designed to provide traders with a powerful yet intuitive tool for spotting reversals.
📌 Final Thoughts
The Dskyz (DAFE) Aurora Divergence Indicator is more than just a divergence tool; it’s a comprehensive trading assistant that combines advanced calculations, intuitive visualizations, and actionable insights. Whether you’re a seasoned trader or just starting out, this indicator can help you spot high-probability reversal points with confidence.
Use it with discipline. Use it with clarity. Trade smarter.
**I will continue to release incredible strategies and indicators until I turn this into a brand or until someone offers me a contract.
-Dskyz
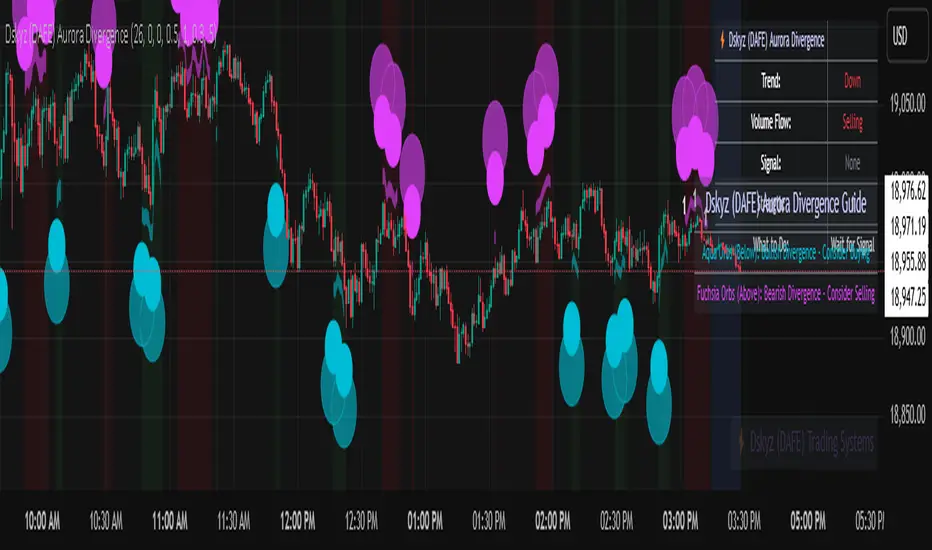
Fair Value MTF [Plazo Sullivan Roche Capital]Unlock a New Edge in Market Timing with the Multi-Timeframe VWAP Indicator!
Transform your trading strategy with our cutting-edge TradingView indicator that brings the power of VWAP to multiple timeframes—all at your fingertips. Designed with the savvy trader in mind, this indicator gives you the clarity to see when prices stray from fair market value:
Seize the Opportunity:
When prices rise above the VWAP, it signals that the market is overvalued. This is your cue for a high-probability shorting opportunity, capitalizing on moments when excesses are primed for a pullback.
Find Your Bargain:
When prices fall below the VWAP, the market is signaling undervaluation—a perfect setup for a buying entry.
Trade with Confidence:
By aligning your trades with the prevailing weekly trend, this tool isn’t about random entries—it’s about smart, trend-confirmed retests at the VWAP. Ensure every trade is set against the direction of the broader market trend for optimized results.
Whether you’re a day trader looking for intraday signals or a swing trader aligning with the weekly momentum, our indicator streamlines your analysis and sharpens your decision-making. Elevate your trading and tap into a system built for precision and performance. Step into a new era of market analysis—where every retest is a potential win!
User Manual
1. Introduction
The Multi-Timeframe VWAP Indicator is engineered to help you interpret market sentiment and spot key entry signals by displaying customizable VWAPs from various timeframes. By highlighting moments when the price diverges from its fair value, this tool provides actionable insights to short overvalued markets and buy undervalued opportunities. Always use in conjunction with your overall market analysis and risk management protocols.
2. Understanding VWAP Basics
What is VWAP?
The Volume Weighted Average Price (VWAP) represents the average price a security has traded at throughout the day, based on both volume and price. It’s widely regarded as a benchmark for fair value.
How It Works:
Price Above VWAP: Indicates the security is trading at a premium—often a sign to consider short positions if confirmed by the weekly trend.
Price Below VWAP: Suggests the security is trading at a discount—an ideal signal for initiating a long or buying position.
Multi-Timeframe Advantage:
The indicator allows you to select VWAPs across different timeframes, offering a dynamic view that lets you align trades with the main weekly trend and pinpoint retest opportunities.
3. Installation and Setup
A. Installation Steps
Access TradingView:
Log in to your TradingView account.
Add the Indicator:
Open the “Indicators” menu on your chart.
Select “Add Script” and paste the provided code or locate the indicator by name if published publicly.
Apply the indicator to your chart.
Customizing Display Settings:
Select Timeframes: Choose which timeframe VWAPs you want displayed (e.g., intraday, daily, weekly).
Adjust Appearance: Customize line colors, thickness, and opacity through the indicator’s settings panel to match your chart style.
Set Alerts (Optional): Configure alerts when price crosses above or below a VWAP, ensuring you never miss a signal.
B. Initial Configuration Tips
Double-check that the indicator is plotting on your desired timeframes.
Familiarize yourself with the input parameters to adjust the VWAP calculations if necessary (e.g., session start/end times).
4. How to Use the Indicator
A. Interpreting Signals
Overvalued (Short Setup):
When the price moves above a selected VWAP, it indicates that the market may be overbought. Look for additional confirmation (such as alignment with the main weekly trend) before taking a short position.
Example: Price surges above the daily VWAP while the weekly trend remains bearish. This convergence signals that a pullback is likely.
Undervalued (Buy Setup):
Conversely, when the price is below the VWAP, the market is signifying a discount. This is your cue to look for buying opportunities.
Example: A dip below the daily VWAP in an overall bullish weekly trend can present a prime entry as the market is expected to recover.
Retest Strategy:
The most robust trades occur when price retests the VWAP in the direction of the main weekly trend.
Wait for a price retest of the VWAP level as confirmation.
Confirm that the retest aligns with the broader trend before entering the trade.
B. Practical Steps When Trading
Confirm the Trend:
Use other trend indicators or price action analysis to confirm the weekly market direction.
Monitor Price Action:
Observe how the price interacts with the VWAP lines. A strong retest provides confidence in your trade decision.
Execute and Manage Trades:
Enter a position when the price retests the VWAP and aligns with the trend.
Set stops just beyond the VWAP line to protect against unexpected volatility.
Consider profit-taking levels based on key support/resistance zones.
5. Advanced Features and Tips
Multi-Timeframe Analysis:
Use the indicator’s flexibility to view VWAP levels across different timeframes. This can enhance your analysis by revealing short-term versus long-term divergences.
Integrate with Other Tools:
Combine the VWAP Indicator with other technical indicators—such as moving averages or oscillators—to build a robust trading system.
Alert System:
Customize alerts for VWAP cross events. This ensures you’re immediately notified when price conditions meet your criteria.
Paper Trade First:
Before committing real capital, test your strategy using paper trading or a demo account. This helps ensure that your setups match your risk tolerance and trading style.
6. FAQs and Troubleshooting
Q: Why aren’t my VWAP lines showing properly?
A: Double-check your indicator’s settings and ensure that the selected timeframes are correctly configured in your chart’s interval.
Q: Can I change the VWAP calculation period?
A: Yes, some versions of the indicator offer adjustable parameters for the calculation period. Refer to the settings panel for customization options.
Q: What if I receive conflicting signals from different timeframes?
A: Focus on the main weekly trend for confirmation. Use shorter timeframe signals as entries once the overall trend aligns.
7. Disclaimer & Risk Management
Trading involves risk and is not suitable for every investor. This indicator is a tool to aid in your technical analysis and should be used in conjunction with sound risk management practices. Past performance is not indicative of future results. Always conduct your own research before making any trading decisions. We recommend testing the indicator in simulation mode prior to live trading.
8. Support & Further Assistance
For additional help with installation, troubleshooting, or strategy optimization, please contact our support team at Plazo Sullivan Roche Capital. We're committed to ensuring you get the most out of your Multi-Timeframe VWAP Indicator.
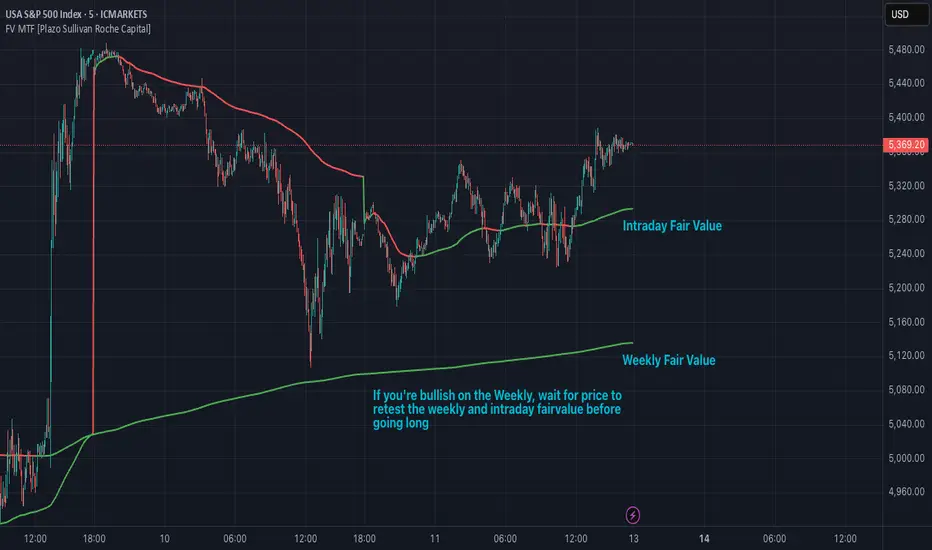
CandelaCharts - ICT Daily Profiles📝 Overview
The ICT Daily Profiles by CandelaCharts rooted in the ICT teachings represent a pattern-based approach to trading that focuses on identifying and analyzing the key highs and lows of various intraday trading sessions.
The toolkit automatically detects and marks these ICT Daily Profiles on the chart, enabling traders to quickly pinpoint critical zones for analysis and decision-making.
Whether you are a seasoned professional or a developing trader, ICT Daily Profiles provides actionable frameworks to enhance your understanding of price dynamics and improve your intraday trading performance.
📦 Features
The ICT Daily Profiles toolkit offers a comprehensive set of features designed to enhance trading precision and decision-making. Key features include:
Daily Profiles
Advanced Styling
Scanner
The indicator supports the following profiles:
Session I High Session II Low Bearish
Session I High Session III Low Bearish
Session I High Session IV Low Bearish
Session II High Session III Low Bearish
Session II High Session IV Low Bearish
Session III High Session IV Low Bearish
Session I Low Session II High Bullish
Session I Low Session III High Bullish
Session I Low Session IV High Bullish
Session II Low Session III High Bullish
Session II Low Session IV High Bullish
Session III Low Session IV High Bullish
Session I High Session I Low Bearish
Session I Low Session I High Bearish
Session II High Session II Low Bearish
Session II Low Session II High Bearish
Session III High Session III Low Bearish
Session III Low Session III High Bearish
Session IV High Session IV Low Bearish
Session IV Low Session IV High Bearish
⚙️ Settings
Sessions: Controls how many sessions you want to see.
History: Controls how many profiles are displayed on the chart.
Timeframe Limit: Sets the timeframe up to which profiles will be drawn.
Show OHLC Lines: Display the lines for OHLC.
Show Profile Line: Display the Daily Profile line.
Use NY Midnight Open: Controls from where a profile will start detection.
Open: Style for Open line.
High: Style for High line.
Low: Style for Low line.
Midline: Style for Profile Midline.
Label: Controls the position of the Daily Profile name.
Scanner: Display the Scanner
⚡️ Showcase
ICT (Inner Circle Trader) daily profile templates are analytical frameworks that categorize and describe typical patterns of price action observed during a trading day.
ICT Daily Profiles
Scanner
📒 Usage
The ICT Daily Profiles indicator aims to give traders a clear and actionable view of the Daily Previous, Current, and Future Profiles. This enables them to analyze market structure, predict price movements, and align their trading strategies with higher time-frame trends.
Load the indicator on the chart
Enable Scanner
See the Predicted Profiles list
Predicted Profiles represent all potential scenarios for the current day, generated by a profile detection algorithm.
By visualizing potential outcomes through Predicted Profiles, the ICT Daily Profiles indicator provides traders with a strategic edge, allowing them to remain flexible, prepared, and aligned with the most probable market movements.
🚨 Alerts
The indicator does not provide any alerts!
🔹 Notes
ICT Daily Profiles
pbs.twimg.com
⚠️ Disclaimer
These tools are exclusively available on the TradingView platform.
Our charting tools are intended solely for informational and educational purposes and should not be regarded as financial, investment, or trading advice. They are not designed to predict market movements or offer specific recommendations. Users should be aware that past performance is not indicative of future results and should not rely on these tools for financial decisions. By using these charting tools, the purchaser agrees that the seller and creator hold no responsibility for any decisions made based on information provided by the tools. The purchaser assumes full responsibility and liability for any actions taken and their consequences, including potential financial losses or investment outcomes that may result from the use of these products.
By purchasing, the customer acknowledges and accepts that neither the seller nor the creator is liable for any undesired outcomes stemming from the development, sale, or use of these products. Additionally, the purchaser agrees to indemnify the seller from any liability. If invited through the Friends and Family Program, the purchaser understands that any provided discount code applies only to the initial purchase of Candela's subscription. The purchaser is responsible for canceling or requesting cancellation of their subscription if they choose not to continue at the full retail price. In the event the purchaser no longer wishes to use the products, they must unsubscribe from the membership service, if applicable.
We do not offer reimbursements, refunds, or chargebacks. Once these Terms are accepted at the time of purchase, no reimbursements, refunds, or chargebacks will be issued under any circumstances.
By continuing to use these charting tools, the user confirms their understanding and acceptance of these Terms as outlined in this disclaimer.
RSI and CMF V 1.0
Introduction: RSI and CMF
The Relative Strength Index (RSI) and Chaikin Money Flow (CMF) are two powerful tools for analyzing market behavior. Each serves a unique purpose and provides insights into different aspects of price action.
The RSI measures the speed and magnitude of price movements. By comparing recent gains to losses over a chosen period, it identifies overbought and oversold conditions in the market. RSI focuses solely on price and offers traders a quick glance at whether an asset is trending too high or too low relative to its recent performance.
On the other hand, the CMF evaluates market behavior by integrating both price and volume. It measures money flow to determine whether an asset is being accumulated (bullish) or distributed (bearish). Positive CMF values indicate buying pressure, while negative values signal selling pressure, making it an essential tool for volume-based analysis.
Our Innovation
Traditionally, indicators like the RSI and CMF are analyzed in separate panels, limiting their connection to the price chart itself. We’ve developed an innovative solution that combines the power of these two indicators, enabling traders to simultaneously measure both price movements and volume flow in a unified visualization. By mapping the RSI and CMF directly onto the price chart, our indicator provides a seamless way to observe and analyze how price momentum and money flow interact with the actual price action.
This integration of volume, price, and momentum into a single chart offers traders a comprehensive tool for deeper market insights and faster decision-making.
__________________________________________________________________________
Simple Settings Panel with Tooltips
Our indicator comes with an intuitive and user-friendly settings panel, designed for ease of use and full customization. Each input is accompanied by a tooltip to guide users through the settings and ensure clear understanding of their purpose.
Settings Overview
1. Enable RSI over Price:
Tooltip: "Toggle this option to enable or disable the RSI plotted on the price chart."
This setting allows users to control whether the RSI is displayed directly over the price chart.
2. RSI Length:
Default Value: 14
Tooltip: "Set the period for RSI calculation. Typical value is 14."
Adjusts the time period used for RSI calculations, affecting its sensitivity to price changes.
3. RSI Source:
Default Value: Close
Tooltip: "Choose the data source for RSI calculation, usually the closing price."
Allows users to specify which price data (e.g., close, open, high, low) is used in the RSI calculation.
4. Enable CMF over Price:
Tooltip: "Toggle this option to enable or disable the CMF mapped onto the price chart."
Controls the visibility of the CMF line on the price chart.
5. CMF Length:
Default Value: 20
Tooltip: "Set the period for CMF calculation. Typical value is 20."
Adjusts the time period used to compute the CMF, determining the volume-weighted money flow sensitivity.
Description of RSI and CMF Settings
RSI Settings:
The RSI Length determines how many periods are included in the RSI calculation. Shorter lengths make the RSI more reactive to price changes, while longer lengths smooth out fluctuations. The RSI Source provides flexibility in selecting the price input for calculation, which is typically the closing price by default.
CMF Settings:
The CMF Length defines how many periods are used to calculate the Chaikin Money Flow, enabling users to focus on short-term or long-term trends in money flow. Enabling the CMF over price ensures the relationship between volume and price action is visually evident on the price chart.
The Style Settings
panel allows users to customize the visual appearance of the indicator, ensuring clarity and alignment with their preferences. Users can independently adjust the line colors for RSI and CMF, with default settings of green for RSI and red for CMF, enabling a clear distinction between the two.
Additionally, the Fill between RSI and CMF option provides two customizable colors (Color 0 and Color 1) to represent the dynamic fill. This fill visually highlights the relationship between the RSI and CMF, enhancing the interpretability of their interaction on the price chart. The settings also include options to toggle precision, labels on the price scale, and values in the status line for added flexibility.
_______________________________________________________________________________
How to Analyze with RSI and CMF V 1.0
The RSI and CMF V 1.0 indicator provides an intuitive and integrated approach to analyzing market trends, combining momentum and volume dynamics directly on the price chart. Its innovative mapping of RSI and CMF makes it easy to spot key trends and reversals with unmatched clarity.
Key Insights:
1. Dynamic Relationship Between RSI and CMF:
The indicator maps RSI (momentum-based) and CMF (volume-based) values onto the price chart. This makes it easier to analyze how price momentum aligns with money flow.
The color-coded fill highlights the strength of their relationship:
- Blue Fill: RSI is stronger than CMF, indicating price momentum leads the movement.
- Red Fill: CMF dominates RSI, reflecting the strength of volume flow.
2. Spotting Trends:
Uptrends: Consistent blue fills paired with RSI and CMF rising together suggest bullish momentum backed by strong volume.
Downtrends: Red fills with declining RSI and CMF signal bearish pressure driven by selling volume.
3. Reversals and Divergences:
Divergences between price action and the mapped RSI/CMF lines can signal potential reversals.
For instance, if price is rising but RSI and CMF are both falling, it could indicate weakening bullish momentum.
Ease of Use:
Color Coding: The dynamic fills (blue and red) allow for immediate visual identification of trend strength and direction, reducing analysis time.
Overlay on Price: By plotting directly on the price chart, traders don’t need to switch between multiple panels, ensuring the context remains clear.
Customizable Settings: Inputs for length, source, and enable/disable toggles make it adaptable for all trading styles and timeframes.
In conclusion, this indicator offers a visually clear and easy-to-understand way to combine momentum and volume analysis, empowering traders with actionable insights at a glance.
PERFECT PIVOT RANGE DR ABIRAM SIVPRASAD (PPR)PERFECT PIVOT RANGE (PPR) by Dr. Abhiram Sivprasad
The Perfect Pivot Range (PPR) indicator is designed to provide traders with a comprehensive view of key support and resistance levels based on pivot points across different timeframes. This versatile tool allows users to visualize daily, weekly, and monthly pivots along with high and low levels from previous periods, helping traders identify potential areas of price reversals or breakouts.
Features:
Multi-Timeframe Pivots:
Daily, weekly, and monthly pivot levels (Pivot Point, Support 1 & 2, Resistance 1 & 2).
Helps traders understand price levels across various timeframes, from short-term (daily) to long-term (monthly).
Previous High-Low Levels:
Displays the previous week, month, and day high-low levels to highlight key zones of historical support and resistance.
Traders can easily see areas of price action from prior periods, giving context for future price movements.
Customizable Options:
Users can choose which pivot levels and high-lows to display, allowing for flexibility based on trading preferences.
Visual settings can be toggled on and off to suit different trading strategies and timeframes.
Real-Time Data:
All pivot points and levels are dynamically calculated based on real-time price data, ensuring accurate and up-to-date information for decision-making.
How to Use:
Pivot Points: Use daily, weekly, or monthly pivot points to find potential support or resistance levels. Prices above the pivot suggest bullish sentiment, while prices below indicate bearishness.
Previous High-Low: The high-low levels from previous days, weeks, or months can serve as critical zones where price may reverse or break through, indicating potential trade entries or exits.
Confluence: When pivot points or high-low levels overlap across multiple timeframes, they become even stronger levels of support or resistance.
This indicator is suitable for all types of traders (scalpers, swing traders, and long-term investors) looking to enhance their technical analysis and make more informed trading decisions.
Here are three detailed trading strategies for using the Perfect Pivot Range (PPR) indicator for options, stocks, and commodities:
1. Options Buying Strategy with PPR Indicator
Strategy: Buying Call and Put Options Based on Pivot Breakouts
Objective: To capitalize on sharp price movements when key pivot levels are breached, leading to high returns with limited risk in options trading.
Timeframe: 15-minute to 1-hour chart for intraday option trading.
Steps:
Identify the Key Levels:
Use weekly pivots for intraday trading, as they provide more significant levels for options.
Enable the "Previous Week High-Low" to gauge support and resistance from the previous week.
Call Option Setup (Bullish Breakout):
Condition: If the price breaks above the weekly pivot point (PP) with high momentum (indicated by a strong bullish candle), it signifies potential bullishness.
Action: Buy Call Options at the breakout of the weekly pivot.
Confirmation: Check if the price is sustaining above the pivot with a minimum of 1-2 candles (depending on timeframe) and the first resistance (R1) isn’t too far away.
Target: The first resistance (R1) or previous week’s high can be your target for exiting the trade.
Stop-Loss: Set a stop-loss just below the pivot point (PP) to limit risk.
Put Option Setup (Bearish Breakdown):
Condition: If the price breaks below the weekly pivot (PP) with strong bearish momentum, it’s a signal to expect a downward move.
Action: Buy Put Options on a breakdown below the weekly pivot.
Confirmation: Ensure that the price is closing below the pivot, and check for declining volumes or bearish candles.
Target: The first support (S1) or the previous week’s low.
Stop-Loss: Place the stop-loss just above the pivot point (PP).
Example:
Let’s say the weekly pivot point (PP) is at 1500, the price breaks above and sustains at 1510. You buy a Call Option with a strike price near 1500, and the target will be the first resistance (R1) at 1530.
2. Stock Trading Strategy with PPR Indicator
Strategy: Swing Trading Using Pivot Points and Previous High-Low Levels
Objective: To capture mid-term stock price movements using pivot points and historical high-low levels for better trade entries and exits.
Timeframe: 1-day or 4-hour chart for swing trading.
Steps:
Identify the Trend:
Start by determining the overall trend of the stock using the weekly pivots. If the price is consistently above the pivot point (PP), the trend is bullish; if below, the trend is bearish.
Buy Setup (Bullish Trend Reversal):
Condition: When the stock bounces off the weekly pivot point (PP) or previous week’s low, it signals a bullish reversal.
Action: Enter a long position near the pivot or previous week’s low.
Confirmation: Look for a bullish candle pattern or increasing volumes.
Target: Set your first target at the first resistance (R1) or the previous week’s high.
Stop-Loss: Place your stop-loss just below the previous week’s low or support (S1).
Sell Setup (Bearish Trend Reversal):
Condition: When the price hits the weekly resistance (R1) or previous week’s high and starts to reverse downwards, it’s an opportunity to short-sell the stock.
Action: Enter a short position near the resistance.
Confirmation: Watch for bearish candle patterns or decreasing volume at the resistance.
Target: Your first target would be the weekly pivot point (PP), with the second target as the previous week’s low.
Stop-Loss: Set a stop-loss just above the resistance (R1).
Use Previous High-Low Levels:
The previous week’s high and low are key levels where price reversals often occur, so use them as reference points for potential entry and exit.
Example:
Stock XYZ is trading at 200. The previous week’s low is 195, and it bounces off that level. You enter a long position with a target of 210 (previous week’s high) and place a stop-loss at 193.
3. Commodity Trading Strategy with PPR Indicator
Strategy: Trend Continuation and Reversal in Commodities
Objective: To capitalize on the strong trends in commodities by using pivot points as key support and resistance levels for trend continuation and reversal.
Timeframe: 1-hour to 4-hour charts for commodities like Gold, Crude Oil, Silver, etc.
Steps:
Identify the Trend:
Use monthly pivots for long-term commodities trading since commodities often follow macroeconomic trends.
The monthly pivot point (PP) will give an idea of the long-term trend direction.
Trend Continuation Setup (Bullish Commodity):
Condition: If the price is consistently trading above the monthly pivot and pulling back towards the pivot without breaking below it, it indicates a bullish continuation.
Action: Enter a long position when the price tests the monthly pivot (PP) and starts moving up again.
Confirmation: Look for a strong bullish candle or an increase in volume to confirm the continuation.
Target: The first resistance (R1) or previous month’s high.
Stop-Loss: Place the stop-loss below the monthly pivot (PP).
Trend Reversal Setup (Bearish Commodity):
Condition: When the price reverses from the monthly resistance (R1) or previous month’s high, it’s a signal for a bearish reversal.
Action: Enter a short position at the resistance level.
Confirmation: Watch for bearish candle patterns or decreasing volumes at the resistance.
Target: Set your first target as the monthly pivot (PP) or the first support (S1).
Stop-Loss: Stop-loss should be placed just above the resistance level.
Using Previous High-Low for Swing Trades:
The previous month’s high and low are important in commodities. They often act as barriers to price movement, so traders should look for breakouts or reversals near these levels.
Example:
Gold is trading at $1800, with a monthly pivot at $1780 and the previous month’s high at $1830. If the price pulls back to $1780 and starts moving up again, you enter a long trade with a target of $1830, placing your stop-loss below $1770.
Key Points Across All Strategies:
Multiple Timeframes: Always use a combination of timeframes for confirmation. For example, a daily chart may show a bullish setup, but the weekly pivot levels can provide a larger trend context.
Volume: Volume is key in confirming the strength of price movement. Always confirm breakouts or reversals with rising or declining volume.
Risk Management: Set tight stop-loss levels just below support or above resistance to minimize risk and lock in profits at pivot points.
Each of these strategies leverages the powerful pivot and high-low levels provided by the PPR indicator to give traders clear entry, exit, and risk management points across different markets
