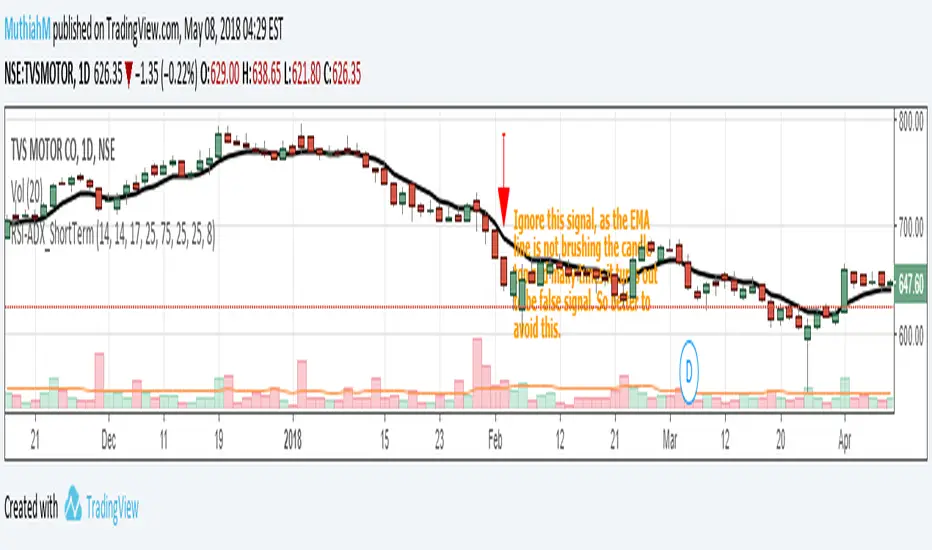
Setup for Short Term Investment using RSI&ADX. High success rateThis is a very simple script which gives reliable signals for buying and selling in short term. I came across this strategy a long time before in some website and coded it here. I had been using this for a long time and made good profits.
Idea is very simple, a buy call is triggered when RSI is greater than 75 and ADX is greater than 25. Sell call is triggered when RSI is lesser than 25 and ADX is again greater than 25. To remove false signals I always use it with EMA(close,8) which is also included as part of the code.
The ideal chart resolution is 1 day, below this the indicator is not reliable. Haven't tested this indicator for anything other than daily chart.
Refer the snapshots for more details.For any queries, please comment or PM me.
在脚本中搜索"profit"
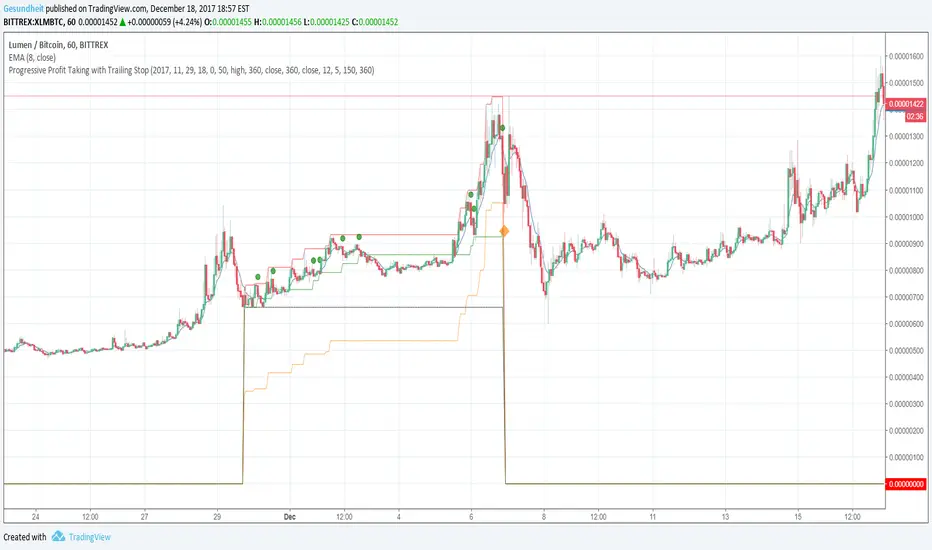
Progressive Profit Taking with Trailing StopThis is version 2 of
Special features:
Added partial profit taking as price rises. Profit taking is triggered by price crossing an EMA.
After profit taking, price has to rise by a user-specified percent before taking profits again.
Also includes condition for fully closing position after meeting specified profit target.
To incorporate into your algo, turn the plotshape functions into alertcondition.
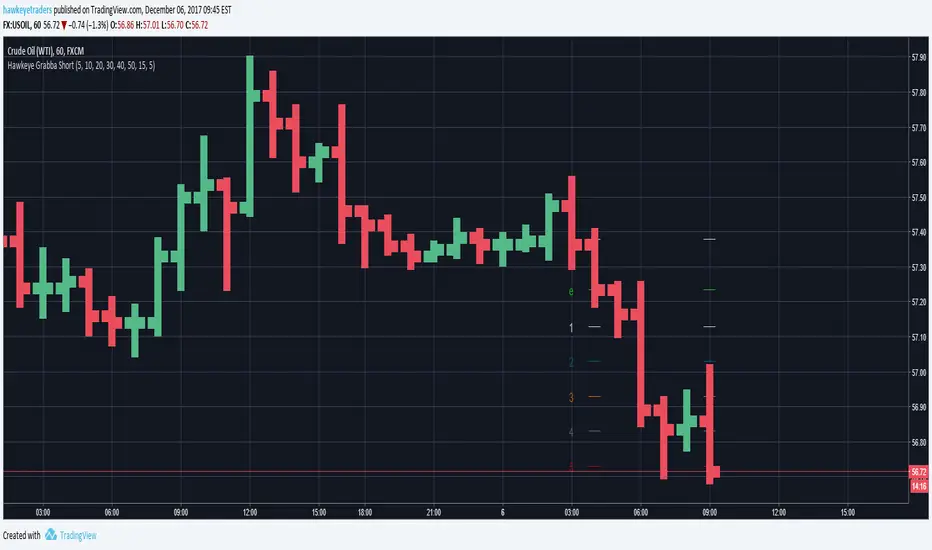
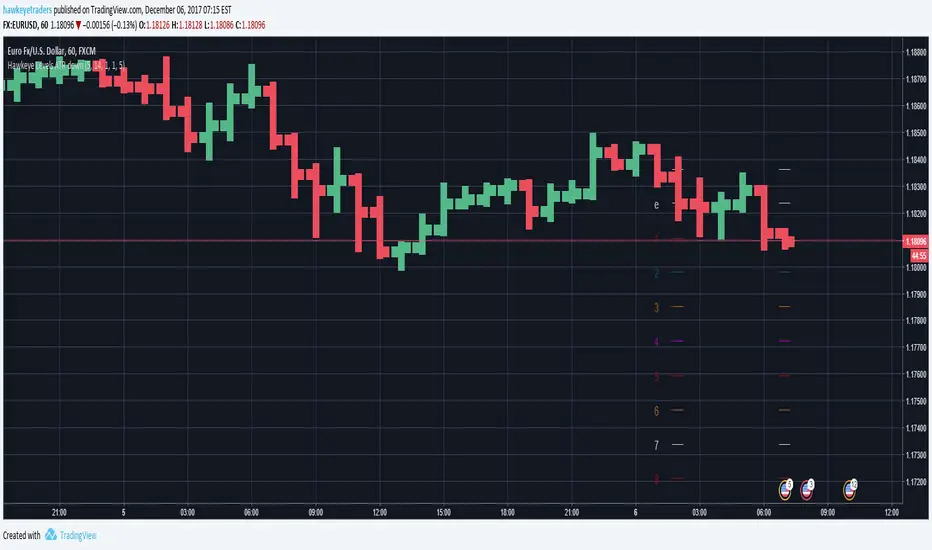
Hawkeye Grabba ShortGrab pips with Hawkeye Grabba
Grabba is a simple mechanical system that you can manage yourself, using your own risk and reward profile.
The Hawkeye Grabba is a risk management tool which provides traders with a visual representation of the risk-to-reward profile on every trade.
For example, you can apply your own profit targets (say 10 pips) and each line will show you that multiple.
As with all the Hawkeye Indicators, Grabba can be applied to any timeframe and any chart and can be custom set to be used on any market, i.e. Forex, stock indices, commodities, etc.
Hawkeye Grabba LongGrab pips with Hawkeye Grabba
Grabba is a simple mechanical system that you can manage yourself, using your own risk and reward profile.
The Hawkeye Grabba is a risk management tool which provides traders with a visual representation of the risk-to-reward profile on every trade.
For example, you can apply your own profit targets (say 10 pips) and each line will show you that multiple.
As with all the Hawkeye Indicators, Grabba can be applied to any timeframe and any chart and can be custom set to be used on any market, i.e. Forex, stock indices, commodities, etc.

Hawkeye Levels ATR downExit at the right time with Levels ATR!
Levels ATR is a powerful series of user pre-defined levels, which act as both potential exit positions and stop loss management.
The Levels ATR indicator helps traders identify clear exit strategies.
Inexperienced traders can:
spend too long focusing on where to enter the position
spend no time on where to exit or take profits
allow the market to dictate the exit following a particular chart pattern or set up
be panicked into exiting
Few traders concentrate on their exit strategies, yet this is where the big profits are made!
Hawkeye Levels ATR upExit at the right time with Levels ATR!
Levels ATR is a powerful series of user pre-defined levels, which act as both potential exit positions and stop loss management.
The Levels ATR indicator helps traders identify clear exit strategies.
Inexperienced traders can:
spend too long focusing on where to enter the position
spend no time on where to exit or take profits
allow the market to dictate the exit following a particular chart pattern or set up
be panicked into exiting
Few traders concentrate on their exit strategies, yet this is where the big profits are made!

Hawkeye Levels ATRExit at the right time with Levels ATR!
Levels ATR is a powerful series of user pre-defined levels, which act as both potential exit positions and stop loss management.
The Levels ATR indicator helps traders identify clear exit strategies.
Inexperienced traders can:
spend too long focusing on where to enter the position
spend no time on where to exit or take profits
allow the market to dictate the exit following a particular chart pattern or set up
be panicked into exiting
Few traders concentrate on their exit strategies, yet this is where the big profits are made!

ALTS/BTC Profitability Osc 1.0This script compares the profitability of a basket of Altcoins vs. Bitcoin.

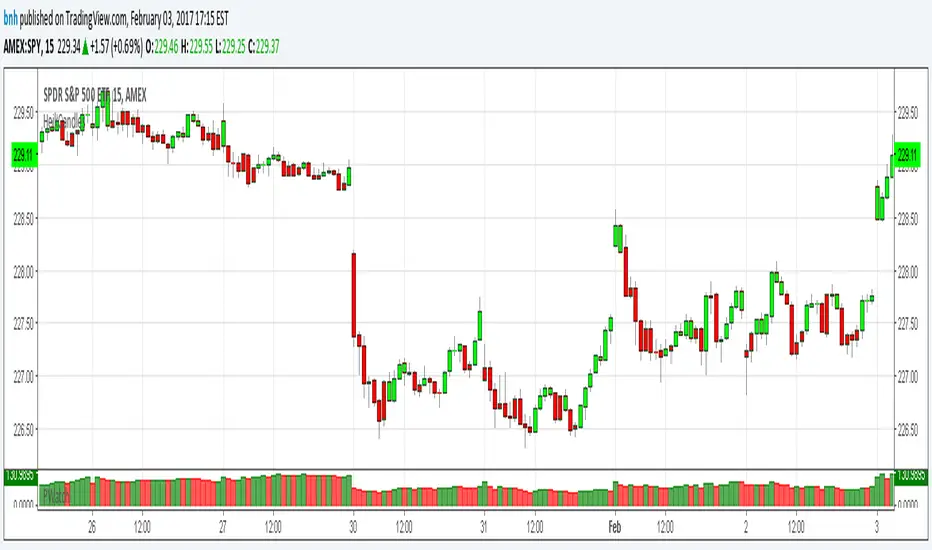
Hershey's Portfolio WatchThanks to user rwestbury for the idea!
Watch the profit in dollars of your portfolio in REAL TIME, love it!
Put this in a window that doesn't change often, for it takes long to initially load.
I use it in my window where I monitor the US index SPY.
Edit and add as many symbols as you want below, you should be able to figure it out.
Just add symbol, number of shares and price.
I'll improve on this later, like trim the code down with function calls, etc.
Good trading!
Brian Hershey
Alpha Net Stop Loss & Take Profit % 🔒 Invite-only Script: Alpha Net SL/TP %
An automated system that plots fixed-percentage Stop Loss and Take Profit zones using EMA 5/32 cross signals. It captures entries, plots TP/SL zones with colored fills, and tracks trade state.
📌 Features:
- EMA 5/32 cross-based entry signals.
- Auto-reset on SL/TP hit.
- Alerts for entry/exit.
- Clean zone visuals.
The code is protected to preserve proprietary logic. Please contact the author to request access.

Dual MA Crossover with Profit Targets + Stop-LossChatGPT script and is a dual moving average crossover script with profit targets and stop loss

Market Profit X (MPX)Hi Traders,
Welcome to Market Profit X (MPX)
Keep
It
Simple
Stupid
I have created MPX to give a main screen visual with simple easy Buy/Sell signals based on your favorite wave trend oscillators.
Traders' learners through to advanced will and I say will PROFIT using MPX easy to follow system.
The 12: Tema and 56: Tema are utilized umm yeah that's right the same ones you are paying thousands for 56 Tema giving you your baseline or zero line on the common Wave Trend Oscillator and the 12 Tema giving you that momentum where all chasing.
One thing after years of studying what really is the bread and butter? Money money money that's what matters money flowing in money flowing out Long/Short yeah. So that's what your BUY/SELL signals are based on and they work.
I have added ATR for stops and have found after extensive trials setting multiplier to 2.5 you are going to have a high % of winning trades which you can thank me with i will send my BTC wallet Addy.
I have added the 8 EMA for another extremely rewarding swing system that i may share with my crew or people I like. I hear you already 8 EMA yeah right that's old worth nothing well it's what I do with this is the magic.
So how do I use? i can see the DM box filling up now because i have been reluctant to release this simple little indicator because i trialed it put in hard yards and know it's a banger.
first one i share and if i get no donations i take down because i know you will be hitting home runs.
Top-down analysis first are we bull or bear? then i drop to the 30m or 15m and wait for BUY/SELL signal go to your favorite wave trend oscillator i have mine over at Marketspy.com and take a good look at your money flow. I will wait for candle to close and confirm then buy next candles open or drop down to the 5m for slight pullback for entry.
Tip one: I like to buy 60 or -60 levels with confidence what will catch you reg bear divs.
like everything not every signal a home run that's why as soon as you take the trade you are looking at your stop and setting it in stone if you get hit o well onto the next. What's your number one? protecting your bank.
Now like i said the 8EMA system is a special spice i may share with special people as it requires training.
Enjoy tell me i suck i don't care i know it works and makes consistent money and my trading group guys will vouch for me.
Thank you, Trader (IKN) I Know Nothing out.

PARTH Gold Profit IndicatorWhat's Inside:
✅ What is gold trading (XAU/USD explained)
✅ Why trade gold (5 major reasons)
✅ How to make money (buy/sell mechanics)
✅ Complete trading setup using your indicator
✅ Entry rules (when to buy/sell with examples)
✅ Risk management (THE MOST IMPORTANT)
✅ Best trading times (London-NY overlap)
✅ 3 trading styles (scalping, swing, position)
✅ 6 common mistakes to avoid
✅ Realistic profit expectations
✅ Pre-trade checklist
✅ Step-by-step getting started guide
✅ Everything a beginner need

Trend Profit Tracking——JackFinanceTrend Profit Tracking Indicator Usage Guide1. Chart Interpretation and UsageSignals: Green "Buy" (below bar) for long entry; red "Sell" (above bar) for short entry or close long. Based on ATR stop reversal.
Trend Line: Green = bullish (support); red = bearish (resistance); gray = neutral.
Background: Light green/red = trend environment.
Filter Band: Green fill confirms bullish; red confirms bearish. Signals more accurate when price is inside the band.
Volume: Yellow bars = unusual volume spike; combine with signals for reversal hints.
Table (top-right): Bullish; Bearish; Neutral.
2. Trading ApplicationEntry: Signal + matching filter band color (green for long, red for short).
Exit: Reverse signal or price hits trend line/band edge.
Stop-Loss: Use built-in trailing stop; ATR multiplier for position sizing.
Best For: Daily/4H trend charts; avoid choppy markets.
Backtest: Verify in strategy tester (~55-65% win rate with defaults).
3. TipsCombine with RSI for filters.
Trading involves risk; decide at your own discretion.

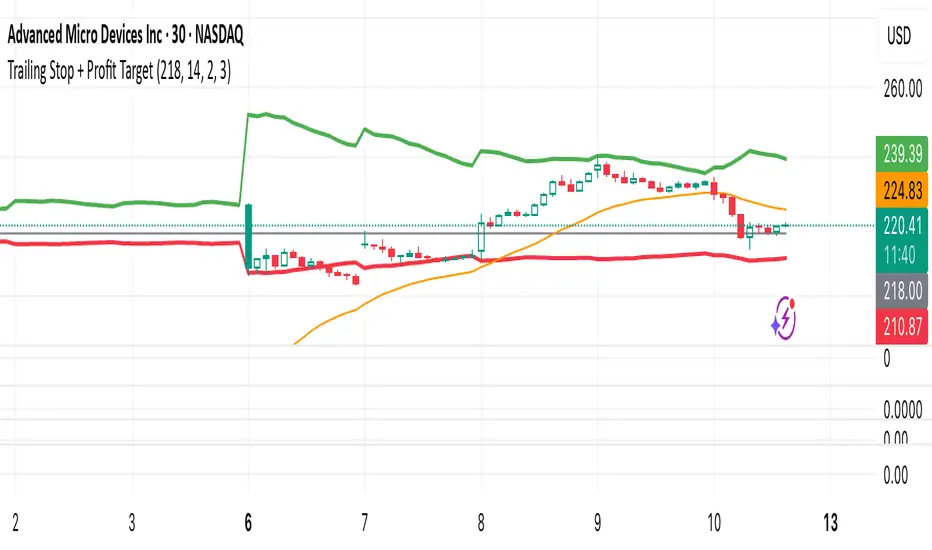
Trailing Stop + Profit TargetTrailing Stop + Exit Confirmation is a manual-entry tool designed to help traders visually manage trades with dynamic trailing stops and profit targets, based on ATR projections with a toggle button to reset calculations in real-time. Contains a “Short” toggle to work for short positions as well, which automatically inverses the PT and SL lines when toggled on.
Primary Calculations: Utilizes a manually adjustable entry price (default: $5 — ideal for options traders) that (when adjusted and recalculated) populates the chart with an adaptive ATR-based trailing stop line, dynamic profit target line, and optional 21-day EMA for directional context.
Below the Entry Price is a fully functional, manual reset toggle to reset all parameters mid-session to assess risk-reward based on entry price, risk tolerance, etc. followed by the “Short” toggle.
Primary Directions/Functions:
Enter your trade price in the “Manual Entry Price” field.
The script will begin plotting a dynamic trailing stop and profit target based on current market conditions.
Use the reset toggle to clear all calculations and start a new position at any time.
Customizable Settings:
ATR Length and Multiplier
Risk/Reward Profit Target Multiplier
Toggle to show/hide trailing stop, target, and EMA lines
Options Trading Use Case:
This tool is especially useful for options traders looking to manage premium-based entries (e.g., $5.00) on intraday or swing trades. The dynamic stop and target lines provide clear visual cues for scaling out or exiting based on price action, while allowing for tighter or looser risk depending on volatility (ATR).
This tool does not auto-detect entries or backtest positions. It is intended to complement your entry signals, not generate them. I've written an Options Momentum Signal indicator you can find right here which functions well in tandem with this tool.
Made for traders who execute trades manually and want typical preset guidelines for profit and stop loss signals but lets you recalculate them by simply clicking a button, especially if any major news or downturn causes a big change in market conditions so you can make adjustments in real time.
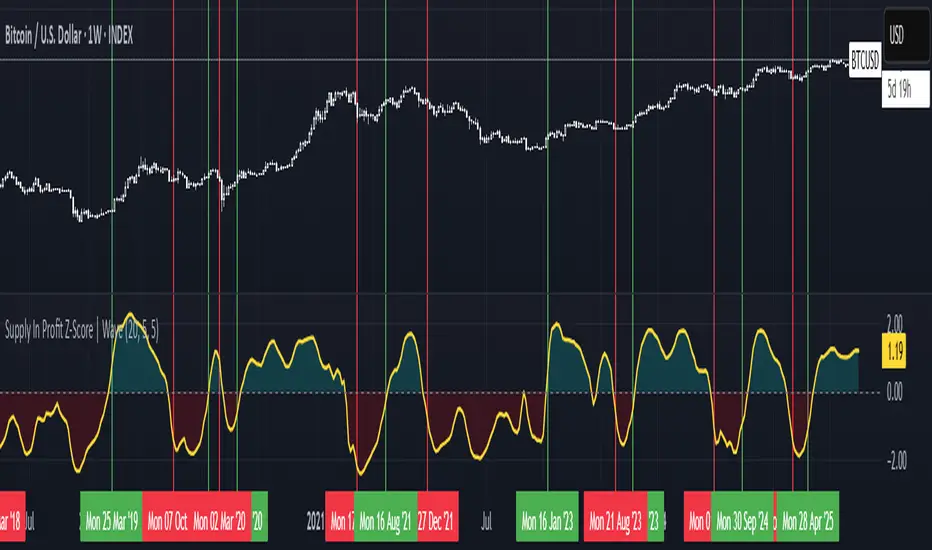
Supply In Profit Z-Score | Wave BackgroundSupply in Profit Z-Score
Modified by Quant_Hustler | Original by QuantChook
What it does
The Supply in Profit Z-Score measures how extreme the balance is between BTC addresses in profit versus those in loss compared to historical norms.
It highlights periods of excessive optimism or pessimism, helping traders identify market sentiment extremes that can signal potential turning points or confirm ongoing trends.
This version is designed for longer-term strategies, using smoothing and statistical normalization to focus on broader market sentiment cycles rather than short-term noise.
How it works
--Data Retrieval: Pulls on-chain data showing the percentage of Bitcoin addresses currently in profit and in loss.
--Spread Calculation: Finds the difference between the two to gauge overall sentiment balance.
--Alpha Decay Adjustment (optional): Normalizes extreme values to stabilize the signal over time.
--Smoothing: Applies a moving average to filter daily volatility and improve long-term clarity.
--Z-Score Conversion: Standardizes the data to show how far current sentiment deviates from historical averages.
--Visualization: Plots the result around a neutral midpoint (zero line) — positive values indicate profit dominance, negative values indicate loss dominance.
How to use it
--Above Zero: More addresses in profit → bullish sentiment and strong trend conditions.
--Below Zero: More addresses in loss → bearish sentiment or potential accumulation zones.
--Extreme Values: Mark overly optimistic or capitulated sentiment, often preceding major reversals.
Why use it in trend following
--This indicator serves as an on-chain sentiment confirmation layer for trend-following systems, especially on higher timeframes (daily or weekly).
--In uptrends, sustained positive readings confirm market strength and investor confidence.
--In downtrends, persistent negative readings confirm weakness and help avoid false reversal signals.
--Divergences between price and sentiment (e.g., rising price but weakening sentiment) often signal momentum loss or potential trend transitions.
Modifications from the original by QuantChook
Added EMA, adaptive Z-score smoothing and capping to reduce volatility and noise.
Introduced a wave-style visualization for intuitive sentiment shifts.
Improved calculation structure and upgraded for Pine Script v6 efficiency.
Tuned signal responsiveness and smoothing parameters for long-term trend accuracy.
Simplified user inputs and grouping for easier customization and integration.
In summary:
A refined, statistically grounded on-chain sentiment oscillator — originally developed by QuantChook and enhanced by Quant_Hustler — built to support long-term trend-following strategies by quantifying Bitcoin market sentiment through real-time profit and loss dynamics.
ATR Take Profit (T-Maker)A dead-simple take-profit helper based on ATR.
This script calculates a 14-period Average True Range (ATR) and multiplies it by a user-defined factor, then shows that single number on your chart in a small table (bottom-left). Use it as a quick, volatility-aware distance for setting take-profit levels, scaling out, or gauging whether a move has “room” to breathe.
What it does
Computes ATR(14) × Multiplier every bar.
Displays the result (rounded to 2 decimals) in a clean on-chart label.
Updates only on the last bar to avoid visual noise and keep performance snappy.
Why it’s useful
Volatility-adjusted targets: ATR adapts to changing market conditions, so your TP distance scales with current volatility.
Instrument & timeframe agnostic: Works on any symbol and timeframe supported by TradingView.
Minimalist workflow: No lines or clutter—just the exact distance to add/subtract from your entry.
How to use it
Choose your ATR Multiplier (default = 4).
Example: If ATR(14) = 1.52 and Multiplier = 4 → displayed value = 6.08.
For a long, a simple TP idea is: TP = Entry + xATR.
For a short: TP = Entry − xATR.
Optionally draw a manual horizontal line at your calculated TP level, or use the value to feed your own rules in other scripts.
Tip: Test different multipliers per market/timeframe (e.g., 2–3 for intraday indices, 3–5 for swing on FX/crypto). Optimize in backtests before going live.
Inputs
ATR Multiplier (int): Scales ATR(14) to your preferred TP distance.
Text Color (color): Customize the display color to match your theme.
Notes & Limitations
Uses ATR(14) (fixed) for consistency in this original version.
Displays a single number only—it does not plot levels, draw lines, or place orders.
Value is rounded to 2 decimals and shown bottom-left of the chart.
Version
v1.0 — Original release (minimal, display-only utility)
Created by T-Maker. This tool is for educational purposes only and is not financial advice. Always manage risk and verify settings before trading.
Stop Loss vs Take Profit Probability and EVThis stop loss and take profit calculator uses a Monte Carlo simulation to calculate the probability of hitting your Stop Loss or Take Profit levels across different time horizons (expressed in bars).
It provides data-driven insights to optimize your risk management and position sizing by showing Expected Value for each scenario.
As a quant, I love using statistical data to help my decisions and get better EV from my trades.
🔬 How It's Calculated
Monte Carlo Simulation: Runs 1,000-10,000 price simulations using a random walk model
Volatility Analysis: Combines ATR-based and Historical Volatility for accurate price movement modeling
Expected Value: Calculates profit/loss expectation using formula: (TP_Probability × Reward) - (SL_Probability × Risk)
Time Horizons: Tests multiple timeframes (1, 5, 10, 20, 50 bars) to find optimal holding periods
Risk/Reward Ratios: Automatically calculates and displays R:R ratios for quick assessment
💡 Use Cases
Position Sizing - Determine optimal risk per trade based on Expected Value
Time Horizon Optimization - Find the best holding period for your strategy
Stop Loss Placement - Validate SL levels using probability analysis
Take Profit Optimization - Set TP levels with statistical backing
Strategy Backtesting - Compare different R:R setups before entering trades
Risk Management - Avoid trades with negative Expected Value
Swing vs Day Trading - Choose timeframes with highest success probability
🎯 How to Use
Setup Trade: Enter your entry price, stop loss, and take profit levels
You can add or remove time horizons denominated in bars. Say you are looking at 1h candles, adding a 24-bar time horizon means you are looking into 24 hours
Choose Direction: Select Long or Short position
Review Table
Analyze Expected Value: Focus on positive EV scenarios (green background)
Optimize Timing: Select time horizons with best risk/reward profile
Adjust Parameters: Modify volatility calculation method and simulation count if needed
Examples
Here's how you can read the tables.
Example 1:
In this chart, we are analyzing the TP and SL probabilities as well as the EV (expected value) for a stock. I want to check what the likelihood is that my SL and TP get triggered over the next 5 days. The stock market is open for 6.5 hours per day, which is 13 bars in this 30-minute bar chart. 26 bars is 2 days, 39 bars is 3 days and so on.
Although this trade is more likely to trigger my SL than my TP, in some of the time horizons we have a positive expected value because of the risk/reward of our trade (i.e. distance of the SL and TP from the price) and the probability of hitting SL and TP.
Example 2:
In this example, we have applied the indicator to gold. Because the TP is much closer to the price, the probability of hitting the TP is much higher.
We can also observe that the expected Value in the shorter time frames is better than in the longer ones. This can give us some clues to set up our trade. If we know that the EV is positive, we can allocate more to that specific trade.
Enjoy, and please let me know your feedback! 😊🥂

Economic Profit (Fixed & Labeled) — Rated + PeersFRAC (Fundamental-Rated-Asset-Calculate)
FRAC is a fundamentals-driven tool designed to measure whether a company is creating or destroying shareholder value. Unlike surface ratios, FRAC uses Economic Profit (ROIC – WACC) as its engine, showing whether a business truly outperforms its cost of capital.
🔹 What FRAC Does
Calculates ROIC (Return on Invested Capital) vs. WACC (Weighted Average Cost of Capital).
Shows whether a company is creating or destroying shareholder value.
Uses tiered color coding for clarity:
🔵 Superior (Aqua Blue) → Top tier; best of the best.
🟣 Elite (Purple) → Strong value creation.
🟢 Positive (Green) → Solid, creating shareholder value.
🟡 Marginal (Yellow) → Barely covering cost of capital.
🔴 Negative (Red) → Value destruction.
🔹 Composite Ranking System (1–4)
FRAC also assigns each company a Composite Rank so you can compare multiple names side by side. The rank works like this:
Rank 1 → Superior (🔵 Aqua Blue)
Best possible rating; wide gap between ROIC and WACC.
Rank 2 → Elite (🟣 Purple)
Strongly positive; above-average capital efficiency.
Rank 3 → Positive (🟢 Green)
Creating value but only moderately; not a top compounder.
Rank 4 → Marginal/Negative (🟡/🔴)
Weak or destructive; either barely covering WACC or losing money on capital.
✅ How to Use the Ranks
When comparing a set of peers (e.g., NVDA, AMD, INTC):
FRAC will display each company’s color rating + composite rank (1–4).
You can instantly see who is strongest vs. weakest in the group.
Best decisions = overweight Rank 1 & 2 companies, avoid Rank 4 names.
🔹 Key Inputs Explained
Risk-Free Asset → Typically the 10-Year US Treasury yield (US10Y).
Corporate Tax Rate → Effective tax rate for the company’s country (e.g., USCTR).
Expected Market Return → Historical average ~8–10%, adjustable.
Beta Lookback Period → Controls how far back Beta is calculated (longer = more stable, shorter = more reactive).
👉 These must be set correctly for FRAC to calculate WACC accurately.
🔹 Example Comparison
NVDA: ROIC 25% – WACC 7% = +18% → 🔵 Superior → Rank 1
AMD: ROIC 17% – WACC 8% = +9% → 🟣 Elite → Rank 2
INTC: ROIC 11% – WACC 9% = +2% → 🟢 Positive → Rank 3
FSLY: ROIC 5% – WACC 10% = –5% → 🔴 Negative → Rank 4
🔹 Why It Matters
Buffett said: “The best businesses are those that can consistently generate returns on capital above their cost of capital.”
FRAC turns that into a visual + numeric rating system (1–4), making comparisons across peers simple and actionable.
🔹 Credit
FRAC was created by Hunter Hammond (Elite x FineFir), inspired by corporate finance models of Economic Profit and Economic Value Added (EVA).
⚠️ Disclaimer: FRAC is a research framework, not financial advice. Always pair with full due diligence.

Trojan Cycle: Dip & Profit Hunter📉 Crypto is changing. Your signals should too.
This script doesn’t try to outguess price — it helps you track capital rotation and flow behavior in alignment with the evolving macro structure of the digital asset market.
Trojan Cycle: Dip & Profit Hunter is a signal engine built to support and validate the capital rotation models outlined in the Trojan Cycle and Synthetic Rotation theses — available via RWCS_LTD’s published charts
It is not a classic “buy low, sell high” tool. It is a structural filter that uses price/volume statistics to surface accumulation zones, synthetic traps, and macro context shifts — all aligned with the institutionalization of crypto post-2024.
🧠 Purpose & Value
Crypto no longer follows the retail-led, halving-driven pattern of 2017 or 2021.
Instead, institutional infrastructure, regulatory filters, and equity-market Trojan horses define the new path of capital.
This tool helps you visualize that path by interpreting behavior through statistical imbalances and real-time momentum signals.
Use it to:
Track where capital is accumulating or exiting
Identify signals consistent with true cycle rotation (vs. synthetic traps)
Validate your macro view with real-time statistical context
🔍 How It Works
The engine combines four signal layers:
1. Z-Score Logic
- Measures how far price and volume have deviated from their mean
- Detects dips, blowoffs, and exhaustion zones
2. Percentile Logic
- Compares current price and volume to historical rank distribution
- Flags statistically rare conditions (e.g. bottom 10% price, top 90% volume)
3. Combined Context Engine
- Integrates both models to generate one of 36 unique output states
- Each state provides a labeled market context (e.g., 🟢 Confluent Buy, 🔴 Confluent Sell, 🧨 Synthetic Trap )
4. Momentum Spread & Divergence
- Measures whether price is leading volume (trap risk) or volume is leading price (accumulation)
- Outputs intuitive momentum context with emoji-coded alerts
📋 What You See
🧠 Contextual Table UI with key Z-Scores, percentiles, signals, and market commentary
🎯 Emoji-coded signals to quickly grasp high-probability setups or risk zones
🌊 Optional overlays: price/volume divergence, momentum spread
🎨 Visual table customization (size, position) and chart highlights for signal clarity
🔔 Alert System
✅ Single dynamic alert using alert() that only fires when signal context changes
Prevents alert fatigue and allows clean webhook/automation integration
🧭 Use Cases
For macro cycle traders: Track where we are in the Trojan Cycle using statistical context
For thesis explorers: Use the 36-output signal map to match against your rotation thesis
For capital rotation watchers: Identify structural setups consistent with ETF-driven or compliance-filtered flow
For narrative skeptics: Avoid synthetic altseason traps where volume lags or flow dries up
🧪 Suggested Pairing for Thesis Validation
To use this tool as part of a thesis-confirmation framework , pair it with:
BTC.D — Bitcoin Dominance
ETH/BTC — Ethereum strength vs. Bitcoin
TOTALE100/ETH — Altcoin strength relative to ETH
RWCS_LTD’s published charts and macro cycle models
🏁 Final Note
Crypto has matured. So should your signals.
This tool doesn’t try to game the next 2 candles. It helps you understand the current phase in a compliance-filtered, institutionalized rotation model.
It’s not built for hype — it’s built for conviction.
Explore the thesis → Validate the structure → Trade with clarity.
🚨 Disclaimer
This script is not financial advice. It is an analytical tool designed to support market structure research and rotation thesis validation. Use this as part of a broader framework including technical structure, dominance charts, and macro data.

Intraday Bullish Scanner - Profit Ping📊 Intraday Bullish Scanner – Profit Ping Only
This custom-built TradingView script identifies high-probability intraday BUY signals on the 15-minute chart, confirmed by volume, momentum, and price action. It uses:
✅ EMA 7/14 crossovers
✅ Bullish candlestick patterns (Engulfing, Piercing, etc.)
✅ Volume spikes above 20-MA
✅ RSI between 55–65
✅ MACD histogram flip from red to green
✅ Cross-confirmation with the 30-minute trend
Once in a trade, it activates a dynamic trailing stop (starting at 2%, tightening to 1% as profit and volume increase). SELL signals are confirmed only with:
❌ MACD turning red
❌ Bearish RSI movement or drop below 50
❌ EMA 7 crossing below EMA 14
❌ A bearish candlestick (Engulfing or Piercing)
❌ Volume spike on a red candle
💰 When all SELL conditions align, a yellow triangle appears. BUYs are marked with a white triangle. Alerts can be connected directly to Python/webhook systems for full automation with IBKR.
Stop Loss & Take Profit For Overlay Indicators[LePasha] Stop Loss & Take Profit For Overlay Indicators
This indicator helps traders easily visualize Stop Loss (SL) and Take Profit (TP) levels based on custom buy and sell signals from any overlay indicators or price-based sources.
Key Features:
Accepts buy and sell signals from any indicator or price source on your chart.
Automatically calculates SL and TP levels using ATR-based volatility for dynamic risk management.
Allows customization of capital, risk percentage per trade, and reward-to-risk ratio.
Displays clear colored boxes on the chart showing potential profit and loss zones.
Calculates position size and required leverage based on your risk settings.
Designed to work with your preferred strategies by simply connecting signal inputs.
Helps you visually manage trades with precise risk control and reward targets.
How to Use:
Connect your buy and sell signals (e.g., from Moving Average crossovers, custom scripts, or price levels) to the indicator’s inputs.
Adjust risk settings to fit your trading style (capital, risk %, reward ratio).
Watch as the indicator draws TP and SL zones on your chart when signals occur.
Use this information to set stops and targets in your trades confidently.
Perfect for traders who want simple, clear, and reliable trade management visuals based on their own strategy signals.

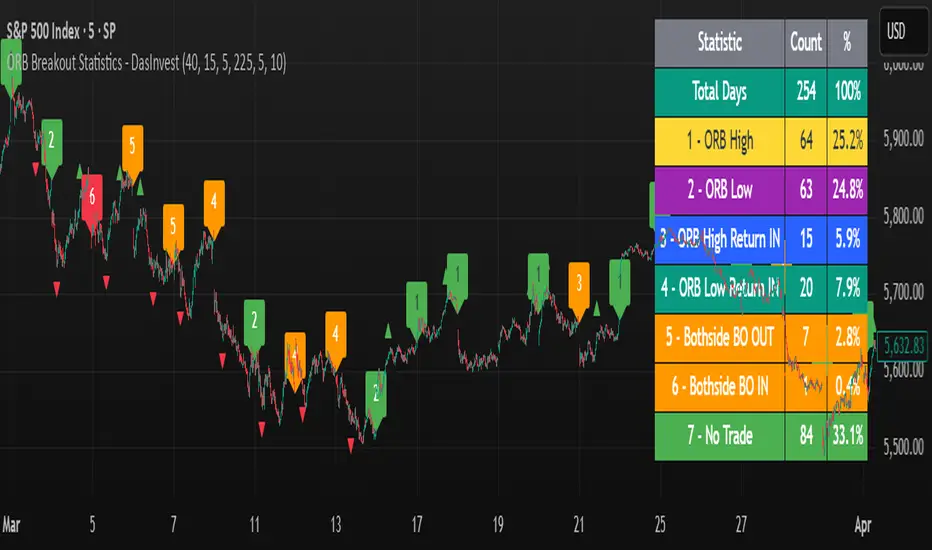
ORB Breakout Statistics with Labels and ProfitOpening Range Breakout Statistics – This indicator identifies the opening range based on user-defined inputs and detects breakouts above the high or below the low. At the end of each trading day, it classifies the session into a specific category based on price action. Additionally, it tracks profit and loss for each classification, allowing you to backtest the strategy using log files.