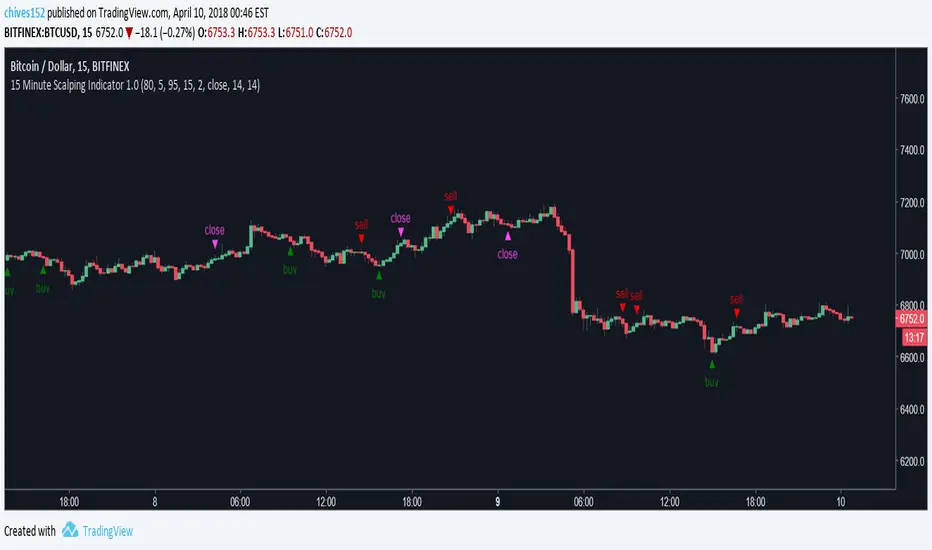
15 Minute Bitcoin Indicator 1.0Indicator Description:
This is a premium indicator that is intended for trading on the 15 minute time scale. This script uses ADX to judge the strength of trends. When a trend is confirmed by ADX, the indicator uses SRSI to find the optimal entry. The indicator works best on BITFINEX:BTCUSD .
Instructions:
Whenever there is a sell signal exit the current long and vice versa. If a close signal appears close the current position but do not open another trade in opposite direction. There is a indicator based stop loss system that is built into the signals, but no static stop loss based on % loss or pips moved in one direction.
Available Settings :
1. Buying and Selling Thresholds: These are the values that are used with SRSI to determine entries. The default values were experimentally determined
to be the most profitable.
2. Stacked Orders Allowed: This limits the amount of positions that can be entered in the same direction. This is useful for trading with leverage. This is defaulted to 2 because I limit myself to 2x leverage. Backtesting shows the more orders allowed, the more profitable, but also risk is increased.
3. ADX/DI Settings: These are settings the ADX smoothing and DI length.
Backtesting:
CLICK HERE
This is a strategy that enters and exits positions on the exact same criteria as this indicator. For the simulation the capital was 10,000 dollars and it was allowed to go up to 2x leverage. Each trade used 100% of available funds. The same simulation done from 1/1/2018 to 4/10/2018 resulted in:
3658.38 % Net Profit
316 Total Closed Trades
77.22 % Profitable
4.552 Profit Factor
24 % Max Drawdown
+11.58% Average Trade
20 15m candles in each trade on average.
Future Plans:
More robust stop loss system.
Factoring trend into trading signals.
EMA integration.
MULTI-TIMEFRAME SUPPORT
Availability
This indicator is currently in a testing stage of development with a full release planned for mid April. While the indicator is not completed, it currently is profitable for me to consider it ready for release. During this testing phase anyone can test it for free for three days, just comment below. Lifetime access currently costs .005 btc, and this price will increase once the full release occurs, if you are interested, DM me for further details.
Please comment with any ideas, suggestions, or criticisms.
在脚本中搜索"profit"
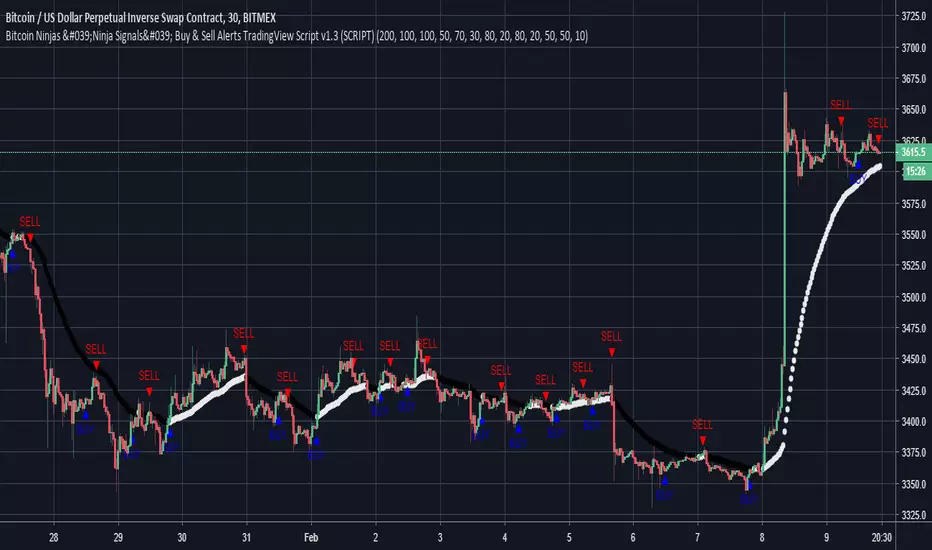
Bitcoin Ninjas 'Ninja Signals' Buy & Sell Alert Trading ScriptBitcoin Ninjas 'Ninja Signals' Buy/Sell Alerts & Backtesting TradingView Script
(for Cryptocurrencies, Forex, GunBot, ProfitTrailer, automatic trading software, and more)
-Allows users to easily set automated buy and sell alerts on TradingView for use with automatic and manual trading of cryptocurrencies, Forex securities, and more (alerts are compatible with automatic trading software such as GunBot, ProfitTrailer, and more).
-Synthesizes many powerful indicators [e.g. Relative Strength Index (RSI), stochastic RSI, Money Flow Index (MFI), Moving Average Convergence Divergence (MACD), etc.) into one super script to generate very precise buy and sell signals in almost any market condition.
-Buy arrows (blue) and sell arrows (red) can be changed or hidden for ease of viewing.
-No lag EMA trendline featuring trend-reversal color-coding (white uptrend, black downtrend).
-Adjustable ‘calibration’ setting allows users to customize the script to work for any currency or security available through TradingView, on any exchange, simply by adjusting a number.
-Complete with backtesting strategy version of script which allows users to test various buy and sell strategies based on the alerts the script generates (see info and screenshots below).
-Backtesting strategy incorporates a user-defined adjustable date range, so users can estimate the script’s performance over specific periods of time, such as the last day, week, or month.
-Backtesting strategy utilizes a minimum protective gain setting to help you never sell for a loss. Simply adjust your minimum profit (%) per trade, and the test results will update.
-Backtesting strategy allows for pyramid buying to test various average down / double up buying strategies. Simply adjust the number of pyramid buys and the quantity of each buy.
-Free 7-day trial available for TradingView users who join our free BitcoinNinjas community.
-Free 24/7 support via BitcoinNinjas Telegram GunBot support group with script purchase.
-Fully compatible with GunBot automatic trading software (TradingView plugin is required).
-Special discount available for traders who purchase GunBot automatic trading software and the GunBot TradingView plugin from BitcoinNinjas, allowing for fully automatic trading.
-Contact us for more information, to request additional / custom screenshots, or to start your free trial.
DISCLAIMER: By viewing and/or using this TradingView script, you agree to the BitcoinNinjas 'Terms of Use', as presented on our website and as stated here. No sharing, copying, reselling, modifying, or any other forms of use, are authorized for this document. This document is strictly for individual use and informational purposes only. This is not financial or investment advice. Investments are always made at your own risk, and are ba
BOS Indicator (Anchored, TP1-TP3, MTF>=4, Multi-Entry)BOS Indicator (Anchored, TP1–TP3, MTF≥4, Multi-Entry)
This indicator is designed to identify high-probability Break of Structure (BOS) trade setups using a combination of market structure, EMA bias, and multi-timeframe direction confirmation. It is intended for discretionary traders who want clear structure-based entries with predefined risk and profit targets.
🔹 Core Logic
Uses a long-term EMA to define bullish or bearish market bias
Tracks market structure using swing pivots to identify valid BOS events
A trade is only signaled after:
Price is on the correct side of the EMA
A valid pullback has formed
Structure is broken in the direction of the trend
Optional multi-timeframe confirmation ensures alignment across higher timeframes before signaling a trade
🔹 Trade Visualization
When a valid BOS setup occurs, the indicator automatically draws:
Entry level
Stop loss zone
Profit target zone
Three Take Profit levels (TP1, TP2, TP3)
Risk and reward boxes anchored to the signal candle
🔹 Take Profit & Trade Management (Important)
This script is designed to be used with partial profit-taking:
TP1
Take 50% of the position off
Locks in early profits and reduces risk
TP2
Take 25% more off the position
At this point, it is recommended to move the stop loss slightly into profit (or near TP1) to protect the trade and eliminate downside risk
TP3
Let the remaining 25% run toward the final target
This allows traders to benefit from extended moves while already being protected
This approach balances risk control, consistency, and the ability to capture larger trend moves.
🔹 Additional Features
Supports multi-entry trends after exits
Works across all markets and timeframes
Visual MTF direction panel for quick confirmation
Designed to avoid false signals caused by minor consolidations
⚠️ Disclaimer
This indicator is a decision-support tool only and does not guarantee profits. Always use proper risk management and confirm signals with your own analysis.

"VWAP Multi-Timeframe Pro - 6 VWAPs + Session Analysis"═════════════════════════════════════════════════════════════════════════════
VWAP MULTI-TIMEFRAME PRO - COMPLETE TUTORIAL
By Alphaomega18 (OA18)
═══════════════════════════════════════════════════════════════════════════════
📌 DESCRIPTION
VWAP Multi-Timeframe Pro is a professional trading tool that simultaneously
displays 6 different VWAPs with customizable sessions and dynamic standard
deviation bands. Ideal for day trading, swing trading, and institutional
order flow analysis.
═══════════════════════════════════════════════════════════════════════════════
🎯 KEY FEATURES
✅ 3 CUSTOMIZABLE SESSION VWAPS
• Asia Session: Configurable hours (default 0h-8h Paris time)
• London Session: Configurable hours (default 8h-16h Paris time)
• NY Session: Configurable hours (default 15h30-22h Paris time)
• Each session automatically stops at end time
• Customizable colors and thickness for each session
✅ 3 STANDARD TIMEFRAME VWAPS
• Daily VWAP (resets at midnight)
• Weekly VWAP (resets on Monday)
• Monthly VWAP (resets on 1st of month)
✅ ADVANCED STANDARD DEVIATION BANDS
• 3 levels of standard deviation (1σ, 2σ, 3σ)
• Timeframe selection for bands (Asia/London/NY/Daily/Weekly/Monthly)
• Colored zones for quick extreme identification
• Perfect for mean reversion trading
✅ DYNAMIC LABELS
• Real-time value display
• Labels visible only during active sessions
• Adjustable size (tiny/small/normal/large)
• Automatic positioning
✅ ALERT SYSTEM
• Price / Daily VWAP crossover
• Price reaching ±3σ bands
• Real-time notifications
═══════════════════════════════════════════════════════════════════════════════
📖 INSTALLATION GUIDE
STEP 1: Add the indicator
1. Open TradingView
2. Click on "Indicators" at the top of the chart
3. Search for "VWAP Multi-Timeframe Pro" or "Alphaomega18"
4. Click to add the indicator to your chart
STEP 2: Basic configuration
1. Click on the ⚙️ (settings) icon of the indicator
2. You will see 8 parameter groups
3. Start by enabling/disabling the VWAPs you want
═══════════════════════════════════════════════════════════════════════════════
⚙️ DETAILED CONFIGURATION
┌─────────────────────────────────────────────────────────────────────────────┐
│ GROUP 1: VWAP ASIA SESSION │
├─────────────────────────────────────────────────────────────────────────────┤
│ • Show VWAP Asia: YES/NO │
│ • Start Hour: 0 (24h format, 0-23) │
│ • Start Minute: 0 (minutes, 0-59) │
│ • End Hour: 8 │
│ • End Minute: 0 │
│ • Color: Yellow (customizable) │
│ • Line Width: 2 (1-5) │
│ │
│ 💡 EXAMPLE: For Tokyo 1h-9h Paris → Start: 1h00, End: 9h00 │
└─────────────────────────────────────────────────────────────────────────────┘
┌─────────────────────────────────────────────────────────────────────────────┐
│ GROUP 2: VWAP LONDON SESSION │
├─────────────────────────────────────────────────────────────────────────────┤
│ • Show VWAP London: YES/NO │
│ • Start Hour: 8 │
│ • Start Minute: 0 │
│ • End Hour: 16 │
│ • End Minute: 0 │
│ • Color: Aqua (customizable) │
│ • Line Width: 2 (1-5) │
│ │
│ 💡 EXAMPLE: For LSE 9h-17h30 Paris → Start: 9h00, End: 17h30 │
└─────────────────────────────────────────────────────────────────────────────┘
┌─────────────────────────────────────────────────────────────────────────────┐
│ GROUP 3: VWAP NY SESSION │
├─────────────────────────────────────────────────────────────────────────────┤
│ • Show VWAP NY: YES/NO │
│ • Start Hour: 15 │
│ • Start Minute: 30 │
│ • End Hour: 22 │
│ • End Minute: 0 │
│ • Color: Orange (customizable) │
│ • Line Width: 2 (1-5) │
│ │
│ 💡 NOTE: US RTH = 9h30-16h00 ET = 15h30-22h00 Paris time │
└─────────────────────────────────────────────────────────────────────────────┘
┌─────────────────────────────────────────────────────────────────────────────┐
│ GROUPS 4-6: VWAP DAILY, WEEKLY, MONTHLY │
├─────────────────────────────────────────────────────────────────────────────┤
│ Each group has the same options: │
│ • Show VWAP: YES/NO │
│ • Color: Customizable │
│ • Line Width: 1-5 │
└─────────────────────────────────────────────────────────────────────────────┘
┌─────────────────────────────────────────────────────────────────────────────┐
│ GROUP 7: STANDARD DEVIATION BANDS │
├─────────────────────────────────────────────────────────────────────────────┤
│ • Show Bands: YES/NO │
│ • Bands Timeframe: Asia/London/NY/Daily/Weekly/Monthly │
│ • Standard Deviation 1: 1.0 (recommended) │
│ • Standard Deviation 2: 2.0 (recommended) │
│ • Standard Deviation 3: 3.0 (recommended) │
│ • Upper Band Color: Green (customizable) │
│ • Lower Band Color: Red (customizable) │
│ │
│ 💡 Bands are calculated on the selected VWAP │
└─────────────────────────────────────────────────────────────────────────────┘
┌─────────────────────────────────────────────────────────────────────────────┐
│ GROUP 8: DISPLAY │
├─────────────────────────────────────────────────────────────────────────────┤
│ • Show Labels: YES/NO │
│ • Label Size: tiny/small/normal/large │
└─────────────────────────────────────────────────────────────────────────────┘
═══════════════════════════════════════════════════════════════════════════════
🎨 PRESET CONFIGURATIONS
┏━━━━━━━━━━━━━━━━━━━━━━━━━━━━━━━━━━━━━━━━━━━━━━━━━━━━━━━━━━━━━━━━━━━━━━━━━┓
┃ CONFIGURATION 1: SCALPING / INTRADAY DAY TRADING ┃
┣━━━━━━━━━━━━━━━━━━━━━━━━━━━━━━━━━━━━━━━━━━━━━━━━━━━━━━━━━━━━━━━━━━━━━━━━━┫
┃ Chart timeframe: 1min - 5min ┃
┃ ┃
┃ Active VWAPs: ┃
┃ ☑ VWAP Asia : YES (to see overnight range) ┃
┃ ☑ VWAP London : YES (if trading EU session) ┃
┃ ☑ VWAP NY : YES (main US session) ┃
┃ ☑ VWAP Daily : YES (daily reference) ┃
┃ ☐ VWAP Weekly : NO ┃
┃ ☐ VWAP Monthly : NO ┃
┃ ┃
┃ Bands: ┃
┃ Timeframe: NY (if trading US session) ┃
┃ Levels: 1σ, 2σ, 3σ ┃
┃ ┃
┃ Labels: YES, size SMALL ┃
┗━━━━━━━━━━━━━━━━━━━━━━━━━━━━━━━━━━━━━━━━━━━━━━━━━━━━━━━━━━━━━━━━━━━━━━━━━┛
┏━━━━━━━━━━━━━━━━━━━━━━━━━━━━━━━━━━━━━━━━━━━━━━━━━━━━━━━━━━━━━━━━━━━━━━━━━┓
┃ CONFIGURATION 2: STANDARD DAY TRADING ┃
┣━━━━━━━━━━━━━━━━━━━━━━━━━━━━━━━━━━━━━━━━━━━━━━━━━━━━━━━━━━━━━━━━━━━━━━━━━┫
┃ Chart timeframe: 5min - 15min ┃
┃ ┃
┃ Active VWAPs: ┃
┃ ☐ VWAP Asia : NO ┃
┃ ☐ VWAP London : NO ┃
┃ ☑ VWAP NY : YES ┃
┃ ☑ VWAP Daily : YES ┃
┃ ☐ VWAP Weekly : NO ┃
┃ ☐ VWAP Monthly : NO ┃
┃ ┃
┃ Bands: ┃
┃ Timeframe: Daily ┃
┃ Levels: 1σ, 2σ, 3σ ┃
┃ ┃
┃ Labels: YES, size SMALL ┃
┗━━━━━━━━━━━━━━━━━━━━━━━━━━━━━━━━━━━━━━━━━━━━━━━━━━━━━━━━━━━━━━━━━━━━━━━━━┛
┏━━━━━━━━━━━━━━━━━━━━━━━━━━━━━━━━━━━━━━━━━━━━━━━━━━━━━━━━━━━━━━━━━━━━━━━━━┓
┃ CONFIGURATION 3: SWING TRADING ┃
┣━━━━━━━━━━━━━━━━━━━━━━━━━━━━━━━━━━━━━━━━━━━━━━━━━━━━━━━━━━━━━━━━━━━━━━━━━┫
┃ Chart timeframe: 1H - 4H ┃
┃ ┃
┃ Active VWAPs: ┃
┃ ☐ VWAP Asia : NO ┃
┃ ☐ VWAP London : NO ┃
┃ ☐ VWAP NY : NO ┃
┃ ☑ VWAP Daily : YES ┃
┃ ☑ VWAP Weekly : YES ┃
┃ ☐ VWAP Monthly : NO ┃
┃ ┃
┃ Bands: ┃
┃ Timeframe: Weekly ┃
┃ Levels: 1σ, 2σ, 3σ ┃
┃ ┃
┃ Labels: YES, size NORMAL ┃
┗━━━━━━━━━━━━━━━━━━━━━━━━━━━━━━━━━━━━━━━━━━━━━━━━━━━━━━━━━━━━━━━━━━━━━━━━━┛
┏━━━━━━━━━━━━━━━━━━━━━━━━━━━━━━━━━━━━━━━━━━━━━━━━━━━━━━━━━━━━━━━━━━━━━━━━━┓
┃ CONFIGURATION 4: MULTI-SESSION TRADING (FOREX, 24H FUTURES) ┃
┣━━━━━━━━━━━━━━━━━━━━━━━━━━━━━━━━━━━━━━━━━━━━━━━━━━━━━━━━━━━━━━━━━━━━━━━━━┫
┃ Chart timeframe: 15min - 1H ┃
┃ ┃
┃ Active VWAPs: ┃
┃ ☑ VWAP Asia : YES ┃
┃ ☑ VWAP London : YES ┃
┃ ☑ VWAP NY : YES ┃
┃ ☑ VWAP Daily : YES ┃
┃ ☐ VWAP Weekly : NO ┃
┃ ☐ VWAP Monthly : NO ┃
┃ ┃
┃ Bands: ┃
┃ Timeframe: Daily ┃
┃ Levels: 1σ, 2σ, 3σ ┃
┃ ┃
┃ Labels: YES, size SMALL ┃
┗━━━━━━━━━━━━━━━━━━━━━━━━━━━━━━━━━━━━━━━━━━━━━━━━━━━━━━━━━━━━━━━━━━━━━━━━━┛
═══════════════════════════════════════════════════════════════════════════════
📊 SIGNAL INTERPRETATION
┌─────────────────────────────────────────────────────────────────────────────┐
│ PRICE POSITION RELATIVE TO VWAP │
├─────────────────────────────────────────────────────────────────────────────┤
│ Price > VWAP → BULLISH TREND (bulls in control) │
│ Price < VWAP → BEARISH TREND (bears in control) │
│ Price = VWAP → EQUILIBRIUM ZONE (indecision) │
│ Price oscillates → RANGE / CONSOLIDATION │
└─────────────────────────────────────────────────────────────────────────────┘
┌─────────────────────────────────────────────────────────────────────────────┐
│ STANDARD DEVIATION BANDS SIGNALS │
├─────────────────────────────────────────────────────────────────────────────┤
│ Price at +1σ → Normal bullish extension │
│ Price at +2σ → OVERBOUGHT - possible reversal │
│ Price at +3σ → EXTREME OVERBOUGHT - high probability return to VWAP │
│ │
│ Price at -1σ → Normal bearish extension │
│ Price at -2σ → OVERSOLD - possible reversal │
│ Price at -3σ → EXTREME OVERSOLD - high probability return to VWAP │
└─────────────────────────────────────────────────────────────────────────────┘
┌─────────────────────────────────────────────────────────────────────────────┐
│ VWAP CONFLUENCE (POWERFUL SIGNALS) │
├─────────────────────────────────────────────────────────────────────────────┤
│ 3+ VWAPs aligned → VERY STRONG TREND │
│ VWAPs converging → MAJOR SUPPORT/RESISTANCE ZONE │
│ VWAPs diverging → CONSOLIDATION ZONE │
│ Price between 2 → CRITICAL DECISION ZONE │
└─────────────────────────────────────────────────────────────────────────────┘
═══════════════════════════════════════════════════════════════════════════════
💡 TRADING STRATEGIES
╔═════════════════════════════════════════════════════════════════════════════╗
║ STRATEGY 1: MEAN REVERSION ║
╠═════════════════════════════════════════════════════════════════════════════╣
║ TIMEFRAME: 5min - 15min ║
║ VWAP USED: Daily or NY Session ║
║ ║
║ LONG ENTRY RULES: ║
║ 1. Price touches -2σ or -3σ band ║
║ 2. Wait for rejection candle (hammer, pin bar) ║
║ 3. Volume above average ║
║ 4. Enter LONG above rejection candle high ║
║ ║
║ SHORT ENTRY RULES: ║
║ 1. Price touches +2σ or +3σ band ║
║ 2. Wait for rejection candle (shooting star, pin bar) ║
║ 3. Volume above average ║
║ 4. Enter SHORT below rejection candle low ║
║ ║
║ MANAGEMENT: ║
║ • Stop Loss: Beyond ±3σ band ║
║ • Take Profit: Return to VWAP (TP1), opposite VWAP (TP2) ║
║ • Risk/Reward: Minimum 1:2 ║
╚═════════════════════════════════════════════════════════════════════════════╝
╔═════════════════════════════════════════════════════════════════════════════╗
║ STRATEGY 2: TREND FOLLOWING ║
╠═════════════════════════════════════════════════════════════════════════════╣
║ TIMEFRAME: 15min - 1H ║
║ VWAP USED: Daily + Weekly ║
║ ║
║ LONG ENTRY RULES: ║
║ 1. Price > Daily VWAP AND > Weekly VWAP (confirmed trend) ║
║ 2. Wait for pullback to Daily VWAP ║
║ 3. Price rejects VWAP upward (doesn't break) ║
║ 4. Enter LONG on rejection ║
║ ║
║ SHORT ENTRY RULES: ║
║ 1. Price < Daily VWAP AND < Weekly VWAP (confirmed trend) ║
║ 2. Wait for pullback to Daily VWAP ║
║ 3. Price rejects VWAP downward (doesn't break) ║
║ 4. Enter SHORT on rejection ║
║ ║
║ MANAGEMENT: ║
║ • Stop Loss: Below/above Daily VWAP ║
║ • Take Profit: +1σ/+2σ bands or key support/resistance ║
║ • Trailing Stop: Use VWAP as dynamic trailing ║
╚═════════════════════════════════════════════════════════════════════════════╝
╔═════════════════════════════════════════════════════════════════════════════╗
║ STRATEGY 3: BREAKOUT CONFIRMATION ║
╠═════════════════════════════════════════════════════════════════════════════╣
║ TIMEFRAME: 5min - 30min ║
║ VWAP USED: NY Session + Daily ║
║ ║
║ LONG ENTRY RULES: ║
║ 1. Price consolidates around VWAP (range) ║
║ 2. Breakout above VWAP with HIGH VOLUME ║
║ 3. Simultaneous break of NY VWAP AND Daily VWAP ║
║ 4. Pullback test of VWAP (now support) ║
║ 5. Enter LONG on pullback rejection ║
║ ║
║ SHORT ENTRY RULES: ║
║ 1. Price consolidates around VWAP (range) ║
║ 2. Breakout below VWAP with HIGH VOLUME ║
║ 3. Simultaneous break of NY VWAP AND Daily VWAP ║
║ 4. Pullback test of VWAP (now resistance) ║
║ 5. Enter SHORT on pullback rejection ║
║ ║
║ MANAGEMENT: ║
║ • Stop Loss: Return to other side of VWAP ║
║ • Take Profit: ±2σ bands or measured move from range ║
║ • Failed breakout: Exit immediately if back in range ║
╚═════════════════════════════════════════════════════════════════════════════╝
╔═════════════════════════════════════════════════════════════════════════════╗
║ STRATEGY 4: SESSION HANDOFF ║
╠═════════════════════════════════════════════════════════════════════════════╣
║ TIMEFRAME: 5min - 15min ║
║ VWAP USED: Asia + London + NY ║
║ ║
║ CONCEPT: ║
║ Observe how each session respects or breaks the previous session's VWAP. ║
║ A break indicates sentiment change. ║
║ ║
║ LONG EXAMPLE: ║
║ 1. Asia Session: Price ranges around Asia VWAP ║
║ 2. London Open (8h): Price breaks Asia VWAP upward ║
║ 3. London VWAP forms above Asia VWAP ║
║ 4. NY Open (15h30): Price respects London VWAP (doesn't break) ║
║ 5. BULLISH SIGNAL: All 3 sessions aligned bullish ║
║ 6. Enter LONG on pullback to NY VWAP ║
║ ║
║ MANAGEMENT: ║
║ • Stop: Below current session VWAP ║
║ • Target: +2σ band or previous session high ║
║ • Invalid if: Price breaks below all session VWAPs ║
╚═════════════════════════════════════════════════════════════════════════════╝
═══════════════════════════════════════════════════════════════════════════════
🔔 ALERT CONFIGURATION
STEP 1: Create an alert
1. Click on "Alerts" button (alarm icon) top right
2. Click "Create alert"
3. In "Condition", select "VWAP Multi-Timeframe Pro"
STEP 2: Choose alert type
• Price > Daily VWAP: Alert when price crosses Daily VWAP upward
• Price < Daily VWAP: Alert when price crosses Daily VWAP downward
• Price at +3σ: Alert when price reaches extreme upper band
• Price at -3σ: Alert when price reaches extreme lower band
STEP 3: Configure alert
• Frequency: "Once per bar close" (recommended)
• Expiration: Set according to your needs
• Actions: Popup + Email + Mobile notification
RECOMMENDED ALERTS FOR DAY TRADING:
✓ Price crosses Daily VWAP (up and down)
✓ Price at ±3σ on NY Session VWAP
✓ Combine with other indicators for confirmation
═══════════════════════════════════════════════════════════════════════════════
💼 SPECIFIC USE CASES
┏━━━━━━━━━━━━━━━━━━━━━━━━━━━━━━━━━━━━━━━━━━━━━━━━━━━━━━━━━━━━━━━━━━━━━━━━━┓
┃ TRADING MNQ (E-MINI NASDAQ 100) ┃
┣━━━━━━━━━━━━━━━━━━━━━━━━━━━━━━━━━━━━━━━━━━━━━━━━━━━━━━━━━━━━━━━━━━━━━━━━━┫
┃ Optimal configuration: ┃
┃ • Timeframe: 5min ┃
┃ • VWAP Asia: 0h-8h (see overnight range) ┃
┃ • VWAP NY: 15h30-22h (RTH session) ┃
┃ • VWAP Daily: Active ┃
┃ • Bands: NY Session, 1σ/2σ/3σ ┃
┃ ┃
┃ Strategy: ┃
┃ 1. At 15h30: Observe if price respects or breaks Asia VWAP ┃
┃ 2. Enter in NY VWAP direction if confluence with Daily ┃
┃ 3. Use ±2σ bands for targets ┃
┃ 4. Stop below/above NY VWAP ┃
┗━━━━━━━━━━━━━━━━━━━━━━━━━━━━━━━━━━━━━━━━━━━━━━━━━━━━━━━━━━━━━━━━━━━━━━━━━┛
┏━━━━━━━━━━━━━━━━━━━━━━━━━━━━━━━━━━━━━━━━━━━━━━━━━━━━━━━━━━━━━━━━━━━━━━━━━┓
┃ TRADING FOREX EUR/USD ┃
┣━━━━━━━━━━━━━━━━━━━━━━━━━━━━━━━━━━━━━━━━━━━━━━━━━━━━━━━━━━━━━━━━━━━━━━━━━┫
┃ Optimal configuration: ┃
┃ • Timeframe: 15min ┃
┃ • VWAP Asia: 0h-8h ┃
┃ • VWAP London: 8h-16h (most liquid EUR/USD session) ┃
┃ • VWAP NY: 14h-22h (US overlap) ┃
┃ • Bands: London Session ┃
┃ ┃
┃ Strategy: ┃
┃ 1. London Session (8h): Trade in Asia breakout direction ┃
┃ 2. NY Session (14h): Observe London/NY VWAP confluence ┃
┃ 3. Exit before 22h (end of liquidity) ┃
┗━━━━━━━━━━━━━━━━━━━━━━━━━━━━━━━━━━━━━━━━━━━━━━━━━━━━━━━━━━━━━━━━━━━━━━━━━┛
┏━━━━━━━━━━━━━━━━━━━━━━━━━━━━━━━━━━━━━━━━━━━━━━━━━━━━━━━━━━━━━━━━━━━━━━━━━┓
┃ TRADING US STOCKS (AAPL, TSLA, etc.) ┃
┣━━━━━━━━━━━━━━━━━━━━━━━━━━━━━━━━━━━━━━━━━━━━━━━━━━━━━━━━━━━━━━━━━━━━━━━━━┫
┃ Optimal configuration: ┃
┃ • Timeframe: 5min or 15min ┃
┃ • VWAP NY: 15h30-22h (RTH only) ┃
┃ • VWAP Daily: Active ┃
┃ • VWAP Weekly: Active (for swing) ┃
┃ • Bands: Daily ┃
┃ ┃
┃ Strategy: ┃
┃ 1. Pre-market: Analyze sentiment vs Daily VWAP ┃
┃ 2. Open (15h30): Confirm direction with NY VWAP ┃
┃ 3. Institutional orders visible at Daily/Weekly VWAP confluence ┃
┗━━━━━━━━━━━━━━━━━━━━━━━━━━━━━━━━━━━━━━━━━━━━━━━━━━━━━━━━━━━━━━━━━━━━━━━━━┛
═══════════════════════════════════════════════════════════════════════════════
⚠️ COMMON MISTAKES TO AVOID
❌ MISTAKE 1: Trading against all VWAPs
→ If price < Daily, Weekly, Monthly VWAP → DON'T buy
→ Wait for confluence or trend change
❌ MISTAKE 2: Ignoring sessions
→ NY VWAP at 8am has NO validity
→ Respect session start/end times
❌ MISTAKE 3: Over-trading VWAP touches
→ Every VWAP touch is NOT a signal
→ Wait for confluence + volume + pattern
❌ MISTAKE 4: Wrong time configuration
→ Check your timezone
→ Adjust hours according to your location
❌ MISTAKE 5: Neglecting volume
→ VWAP crossover without volume is WEAK
→ Volume > average = more reliable signal
❌ MISTAKE 6: Forgetting HTF context
→ Always check higher timeframe
→ Daily chart for intraday, Weekly for swing
❌ MISTAKE 7: Too tight stop loss
→ Place stop BEYOND ±3σ band
→ Give position room to breathe
❌ MISTAKE 8: Using only VWAP
→ COMBINE with: RSI, Volume Profile, Support/Resistance
→ VWAP is a tool, not a complete strategy
═══════════════════════════════════════════════════════════════════════════════
📈 OPTIMIZATION & BACKTESTING
TIPS TO IMPROVE YOUR RESULTS:
1. JOURNAL YOUR TRADES
• Note which VWAP configuration worked
• Which session gives best results
• Which band level (1σ/2σ/3σ) is optimal
2. TEST DIFFERENT PERIODS
• Modify session hours according to your asset
• Crypto: Different 24h sessions
• EU Stocks: Adapt to XETRA/CAC hours
3. ADAPT BANDS
• Volatile assets: Use 1.5σ, 2.5σ, 3.5σ
• Calm assets: Keep standard 1σ, 2σ, 3σ
4. COMBINE WITH OTHER TOOLS
• Volume Profile (POC, VAH, VAL)
• Market Delta / Order Flow
• Horizontal Support/Resistance
• Fibonacci retracements
═══════════════════════════════════════════════════════════════════════════════
🆘 SUPPORT & FAQ
Q: Are times in local time or UTC?
A: Times are in your TradingView chart's timezone.
For Paris, use French local time.
Q: Can I use more than 3 sessions?
A: This version offers 3 customizable sessions. For more, duplicate
the indicator with different configurations.
Q: Does VWAP reset automatically?
A: Yes! Each VWAP resets automatically:
• Sessions: At defined start time
• Daily: At midnight
• Weekly: On Monday
• Monthly: On 1st of month
Q: Why isn't my session VWAP displaying?
A: Check:
1. Session is enabled in settings
2. You are WITHIN session time
3. Hours are correctly configured
Q: Can I export my configurations?
A: Yes, TradingView allows saving indicator templates.
Q: Compatible with free TradingView?
A: Yes, indicator works on all TradingView plans.
═══════════════════════════════════════════════════════════════════════════════
Version 1.0 | © 2025 Alphaomega18
Indicator developed for professional and passionate traders
═══════════════════════════════════════════════════════════════════════════════

Session Trader - Optimal Hours📊 Overview
Never miss the best trading hours again! This indicator provides a comprehensive, real-time session tracker that shows you EXACTLY when to trade crypto and when to stay out of the market. Automatically converts all times to your local timezone, highlights the current active session, and shows what's coming next.
Perfect for crypto traders who want to maximize profits by trading during high-liquidity, high-volume sessions while avoiding choppy, low-liquidity periods that lead to losses.
✨ Key Features
🎯 Real-Time Session Tracking
LIVE indicator shows which session is currently active with bright highlighting
NEXT UP feature highlights the upcoming session when between trading periods
Smart header displays current status at a glance
Real-time countdown timers for every session (opens/closes)
📍 6 Critical Trading Sessions Covered
✅ BEST TRADING SESSIONS (Green):
London Open (07:00-09:00 UTC) - High volatility kickoff, institutional orders
London-NY Overlap (13:30-15:30 UTC) - THE BEST period! Maximum liquidity & volume
NY Momentum (15:30-18:00 UTC) - Strong trending moves, continuation plays
❌ AVOID TRADING SESSIONS (Red):
4. Pre-Asia Quiet (21:00-00:00 UTC) - Low liquidity, erratic moves, wide spreads
5. Asia Lunch (03:30-05:00 UTC) - Choppy markets, whipsaws, unreliable patterns
6. Post-US Drift (20:00-21:00 UTC) - Market slows, unpredictable behavior
🌍 Automatic Timezone Conversion
Times display in YOUR chart timezone - no manual conversion needed!
Works in Berlin, New York, Tokyo, Sydney, or anywhere in the world
Switch between 12-hour and 24-hour formats
🎨 Visual Clarity
Active TRADE sessions = Bright green background, impossible to miss
Active AVOID sessions = Bright red background, clear warning
NEXT UP session = Orange highlight when between sessions
Inactive sessions = Faded gray, stays out of your way
Color-coded status column with clear ✓ TRADE or ✗ AVOID indicators
⚙️ Fully Customizable
9 table positions (top-left, top-right, bottom-center, etc.)
6 text sizes (tiny to huge) for any screen size
Toggle individual sessions on/off
Show/hide descriptions for cleaner view
Custom colors for each session type
Countdown timer toggle
🔔 Built-In Alerts
Automatic alerts when TRADE sessions start
Alerts when AVOID sessions begin (so you don't enter bad conditions)
Customizable per session
📖 How To Use
Basic Setup:
Add indicator to any crypto chart (BTC, ETH, etc.)
Times automatically convert to your chart's timezone
Watch the header - shows current session or next upcoming
Look for bright colors:
🟢 Bright green = TRADE NOW
🔴 Bright red = AVOID NOW
🟠 Orange = NEXT UP (coming soon)
Trading Strategy:
Focus on GREEN sessions (London Open, London-NY Overlap, NY Momentum)
Avoid RED sessions (Pre-Asia Quiet, Asia Lunch, Post-US Drift)
Prepare for ORANGE sessions (next up - get ready!)
Use countdown timers to plan entries/exits perfectly
Pro Tips:
London-NY Overlap is the BEST - highest volume, tightest spreads, cleanest trends
First 30 minutes of London can have quick reversals - use caution
NY Momentum is perfect for riding trends with trailing stops
NEVER trade during Asia Lunch - choppy, unpredictable, costs you money
Post-US Drift looks tempting but often leads to whipsaws
🔧 Indicator Settings
Display Options:
Table Position: Choose from 9 positions on your chart
Text Size: Auto, Tiny, Small, Normal, Large, Huge
Time Format: 12-hour (AM/PM) or 24-hour format
Show Countdown: Toggle real-time countdown timers
Show Description: Toggle detailed session descriptions
Highlight Next Session: Orange highlight for upcoming session
Session Toggles:
Enable/disable any of the 6 sessions individually:
London Open
London-NY Overlap
NY Momentum
Pre-Asia Quiet
Asia Lunch
Post-US Drift
Color Customization:
Active TRADE session color (default: bright green)
Active AVOID session color (default: bright red)
NEXT UP session color (default: orange)
Inactive session color (default: faded gray)
Alerts:
Individual alert toggles for each session
Alerts fire when sessions start (not every bar)
Includes context in alert message
📊 Session Details
🟢 London Open (07:00-09:00 UTC)
Status: TRADE ✓
Characteristics:
London opens with high volatility as European traders enter
Major institutional orders create significant price movements
Perfect for breakout and trend-following strategies
Watch for quick reversals in first 30 minutes
Good liquidity and volume
🟢 London-NY Overlap (13:30-15:30 UTC)
Status: TRADE ✓
THE BEST TRADING PERIOD!
Maximum liquidity as London & NY markets overlap
Institutional volume peaks, creating clean trends
Reliable technical setups, tightest spreads
Best execution quality
Focus on momentum and breakout trades
🟢 NY Momentum (15:30-18:00 UTC)
Status: TRADE ✓
Characteristics:
Strong directional moves as US market dominates
Trending behavior ideal for position trades
Continuation patterns highly reliable
Major news impact is highest during this period
Use trailing stops to ride trends effectively
🔴 Pre-Asia Quiet (21:00-00:00 UTC)
Status: AVOID ✗
WARNING:
Pre-Asian session with minimal liquidity
Thin order books cause erratic price action
Fake breakouts and stop-hunting common
Wide spreads increase trading costs
High risk, low reward - wait for better conditions
🔴 Asia Lunch (03:30-05:00 UTC)
Status: AVOID ✗
WARNING:
Asian lunch break creates choppy, directionless markets
Low volume leads to whipsaws and false signals
Market makers widen spreads significantly
Technical patterns unreliable
Not worth the risk - take a break!
🔴 Post-US Drift (20:00-21:00 UTC)
Status: AVOID ✗
WARNING:
Post-US session as major markets close
Liquidity dries up, causing unpredictable moves
High slippage risk
Market enters consolidation before Asian open
Better to wait for next quality session
🎯 Who Is This For?
Perfect for:
✅ Crypto day traders who want to maximize profits by timing the markets
✅ Scalpers who need high liquidity and tight spreads
✅ Swing traders who want to enter during optimal conditions
✅ Beginners who need clear guidance on when to trade
✅ Anyone tired of choppy sessions that eat away profits
Ideal Markets:
Bitcoin (BTC/USD, BTC/USDT)
Ethereum (ETH/USD, ETH/USDT)
Major altcoins (SOL, XRP, ADA, etc.)
Any 24/7 crypto market
💡 Why Session Timing Matters
Trading crypto during low-liquidity sessions is one of the biggest mistakes traders make:
❌ Trading during bad sessions causes:
Wider spreads (higher costs per trade)
Choppy, unpredictable price action
Fake breakouts and stop-hunting
Poor trade execution and slippage
Emotional frustration and overtrading
✅ Trading during optimal sessions gives you:
Tight spreads (lower costs)
Clean, trending price action
Reliable technical patterns
Better execution quality
Higher win rates and confidence
The difference between a profitable trader and a losing trader is often WHEN they trade, not HOW they trade.
🚀 Technical Details
Version: Pine Script v6
Type: Overlay indicator (table display)
Repainting: Non-repainting (all times are fixed to session schedules)
Updates: Real-time on every bar
Performance: Lightweight, no lag
Compatibility: Works on any timeframe (1m to 1D+)
📈 Best Practices
Plan your trading schedule around GREEN sessions
Set alerts for session starts so you never miss opportunities
Use the countdown to prepare entries/exits in advance
Combine with your strategy - this indicator tells you WHEN, your strategy tells you WHAT
Respect the RED sessions - discipline is profit
Keep descriptions ON when learning, turn OFF for cleaner charts later
🔄 Updates & Support
This indicator is actively maintained. Future updates may include:
Session volume statistics
Historical session performance tracking
Additional regional sessions
More customization options

SuperTrend Long/Short Signals With Fibonacci“By using the updated version of the previously published indicator with a Fibonacci extension, you can obtain multiple take-profit levels and make profitable trades.
Wishing you plenty of profits.

Volume Analysis🙏🏻 (signed) Volume Analysis is 2 of 2 structural layer / ordeflow analysis scripts, while the first one is Liquidity Analysis. Both are independent so can’t be released together as a single script, but should be used together.
The same math used in this script can be applied to other types of aggressive volume data: non-aggregated flow of market orders, volume traded of put vs call options.
There’s no universal agreement about terminology, but this script works with volumes signed by the aggressor who initiated a transaction. Then these volumes get aggregated by time and a cumulative sum is calculated. Mostly this is widely known as Cumulative Volume Delta.
However this script works with 'inferred' volumes vs the provided ones. It’s the better choice for equities, bonds; neutral choice for currencies; and suboptimal choice for natural and artificial commodities.
Contents:
Output description;
How to analyze & use the outputs;
How to use it together with Liquidity Analysis script;
How did I use both scripts to finish The Leap profitably and skipped many losses.
1. Output description
Color of the CVD line reflects (signed) volume imbalance state: red is negative, purple is neutral, blue is positive.
3 purple lines are lower deviation (lower band), basis (middle band), upper deviation (upper band): used to generate signals by a ruleset that would be explained in a minute
Gray number in the script’s status line is the advised input you may put into Inferred volume multiplier in script’s setting, I will explain it
Vertical dash line marks the moving window end, this way you can be certain over what exact data you see the profile was built.
2. How to analyze & use the outputs
Setup up the script:
Moving window length: set it to ~ ¼ of your data analysis window. E.g if you see on your charts and use ~ 256 bars, set the length to 64.
Inferred volume multiplier: you can easily leave it 256, this is not a critical factor for the math, it’s mostly there if you want to ~ equate inferred volumes with real ones in scale. For this, use the gray number in the script status line, it’s calculated as ratio of long term real volumes weighted avg to long term inferred volumes weighted avg.
Again, changing the inferred volume multiplier won’t affect the math.
Use 2 timeframes: main one and a far lower one 3 steps down, just like on the screenshot.
Find out current volume imbalance state:
As mentioned before, based on CVD line color, it can be negative, neutral or positive. This is the state variable that changes slowly and denies/confirms the signals generated by crossovers of CVD line and 3 purple thresholds.
For this I use my own very fast and lightweight metric that is totally statistically grounded, utilizes temporal information, and calculates volume imbalance without using heavy math like regressions as it’s usually done. It also provides a natural neutral zone, when volume imbalance is not strong enough to be confirmed.
...
CVD-based signals:
First you need to understand what precisely a touch of a threshold is:
Touch: an event when either of these 2 happens:
One CVD datapoint is above the threshold, and the next CVD datapoint is below the threshold
One CVD datapoint is below the threshold, and the next CVD datapoint is above the threshold
These are usually called crossovers/crossunders.
Now with the 3 purple thresholds we follow this logic:
Monitor the last touched threshold;
Once another threshold is touched, here we may generate a signal but only once !, after the first generated signal at that threshold we can’t generate more signals on this threshold, we need to wait when CVD comes to another threshold.
If CVD touches one threshold, and then goes down and touches another threshold downwards, we wait when CVD makes a datapoint above this threshold. When it happens, we register a long signal
If CVD touches one threshold, and then goes up and touches another threshold upwards, we wait when CVD makes a datapoint below this threshold. When it happens, we register a short signal
However, don’t open new trades against the current volume imbalance state. So don’t open shorts when the CDV line is blue, and don’t open longs when CVD line is red.
Btw, this technique I call it “reclaim” of a level/threshold. It can be applied to horizontal levels, and it’s very powerful especially when you fade levels on very volatility assets like BTC. This technique allows you to Not fade a level straight away, but wait when price goes past the level a bit, and then comes back and reclaims it, only there you enter, and moreover you now have a very well defined risk point.
The last part is multi-timeframe logic. Prefer to act when a lower timeframe is Not against the main timeframe. That’s all, no multiple higher timeframes are needed.
3. How to use it together with Liquidity Analysis script.
That script also has a mean to generate its own signals, and another state variable called Liquidity Imbalance.
So now you’re not only looking at volume imbalance but also at liquidity imbalance that would deny/confirm the CVD based signal. You need at least one of these two to favor your long or short.
This is the same logic widely used in HFT, where MM bots cancel/shift/resize orders when book is too onesided And ordeflow is one sided as well.
4. How did I use both scripts to finish The Leap profitably and skipped many losses.
Even tho you can use structural information as your main strategic layer, as many so-called orderflow traders do, I traded in objective style: my fade signals were volatility based in essence, and I used ordeflow for better entries and stops, but most importantly to skip losses.
When ‘both‘ liquidity imbalance and volume imbalance (in their main timeframes) were against my trades, I skipped them all, saving many ~$500 stop losses (that was my basis risk unit for the Leap). Unless I had a very strong objective signal, i.e. confluence of several signals, or just one higher timeframe signal, I did all these skips.
I traded ~ intraweek timeframe, so I was analyzing either the last 230 30min bars or 1380 5min bars. Both Liquidity Analysis and (signed) Volume Analysis scripts were set to moving window length 46 or 276 for either granularity.
I finished the leap with 9% profit and max DD ~ 5%, a bit short of my goal of 12.5%. If not these 2 scripts I would’ve finished a bit above breakeven I think.
,,,
Another thing, I made these 2 scripts invite-only because they are made particularly for trading, particularly for certain types of market data. These are tools adapted for particular use case, not like my other posts with general math entities like Kernel Density Estimation or Kalman filter, that you can take and apply properly on any data you need yourself.
However these are made from general math entities like everything else. ‘All’ the components are available in my other scripts, ideas, and other sources related to me. If you want to reverse-engineer these, you can find all the components you need in my already posted open source work.
∞

Liquidity Analysis🙏🏻 Liquidity Analysis is 1 of 2 structural layer / orderflow layer analysis scripts. Both are independent so can’t be released together as a single script, but should be used together. The second one which is called (Signed) Volume Analysis is incoming.
The same math used in this script can be applied on other types of profile-like data: orderbooks, trading volumes of all options for each strike.
Important: market or volume profile, just as orderbooks and options traded volume by strikes, are all liquidity ‘estimates’, showing where liquidity is more likely or less likely to be. These estimates however, especially combined with other info, are really useful and reliable.
This script works with inferred volumes vs the provided one. It's the better choice for equities, bonds; neutral choice for currencies; and suboptimal choice for natural & artificial commodities.
Contents:
Output description;
How to analyze & use the outputs;
How to use it together with upcoming (Signed) Volume Analysis script;
How did I use both scripts to finish The Leap profitably and skipped many losses.
1. Output description
Color of the profile reflects the liquidity imbalance state: red is negative, purple is neutral, blue is positive.
Bar coloring represents history values of liquidity imbalance for backtesting purposes. It can be turned on/off in the script's Style settings.
Two purple vertical lines represent calculated borders of excessive liquidity (HVN), scarce liquidity (LVN), and sufficient liquidity (NVN) zones.
Vertical dash line marks the moving window end, this way you can be certain over what exact data you see the profile was built.
2. How to analyze & use the outputs
Setup up the script:
Moving window length: set it to ~ ¼ of your data analysis window. E.g if you see on your charts and use ~ 256 bars, set the length to 64.
Native tick size multiplier: leave it at 0 to calculate optimal number of rows automatically, or set it manually to match native tick size multiples you desire.
Use 2 timeframes: main one and a far lower one 3 steps down, just like on the screenshot.
Native lot size multiplier allows to round profile rows themselves to nearest multiples of native lot size. I added this just in case any1 needs it.
Find out current liquidity imbalance state:
As mentioned before, based on profile color, it can be negative, neutral or positive. This is the state variable that changes slowly and denies/confirms the signals that would be explained in the minute.
I use my own statistically grounded imbalance metric (no hardcoded/learned thresholds), that unlike mainstream imbalance metrics (e.g orderbook imbalance as sum of bids vs sum of asks) provides a natural neutral zone, when liquidity imbalance is ofc there but not strong enough to be considered.
…
Profile-based signals: look at profile shape vs 2 vertical purple lines.
where profile rows exceed the left purple line, these prices are considered HVN. Too much potential liquidity is there.
where profile rows don’t exceed the right purple line, these prices are considered LVN. Potential thin/lack of liquidity is expected there.
where profile rows are in between these 2 purple lines, these are NVN, or neutral liquidity zones.
Trading ruleset itself is based on couple of simple rules:
Only! Use limit orders hence provide liquidity in LVNs and Only! use stop-market orders hence consume liquidity in HVNs;
These orders should be put in advance ‘only’. This is how you discover the direction or orders: you can only put sell limit orders above you and buy limit orders below you, and you can only put buy stop orders above you, and sell stop orders below you.
This is really it. It may look weird, but once you just try to follow these 2 rules letter by letter for 1 hour, you’ll see how liquidity trading works.
Now once you know that, just don’t open new trades against the liquidity imbalance state. So don’t open shorts when the profile is blue, and don’t open longs when it’s red.
The last part is multi-timeframe logic. Prefer to act when a lower timeframe is Not against the main timeframe. That’s all, no multiple higher timeframes are needed.
3. How to use it together with upcoming (Signed) Volume Analysis script.
That upcoming script would also have a mean to generate its own signals, and another state variable called volume imbalance.
So now you’re not only looking at liquidity imbalance but also at volume imbalance that would deny/confirm a profile based signal. You need at least one of these to favor your long or short.
This is the same logic widely used in HFT, where MM bots cancel/shift/resize orders when book is too onesided And ordeflow is one sided as well.
4. How did I use both scripts to finish The Leap profitably and skipped many losses.
Even tho you can use structural information as your main strategic layer, as many so-called orderflow traders do, I traded in objective style: my fade signals were volatility based in essence, and I used ordeflow for better entries and stops, but most importantly to skip losses.
When ‘both‘ liquidity imbalance and volume imbalance (in their main timeframes) were against my trades, I skipped them all, saving many ~$500 stop losses (that was my basis risk unit for the Leap). Unless I had a very strong objective signal, i.e confluence of several signals, or just one higher timeframe signal, I did all these skips.
I traded ~ intraweek timeframe, so I was analyzing either the last 230 30min bars or 1380 5min bars. Both Liquidity Analysis and (signed) Volume Analysis scripts were set to moving window length 46 or 276 for either granulary.
I finished the leap with 9% profit and max DD ~ 5%, a bit short of my goal of 12.5%. If not these 2 scripts I would’ve finished a bit above breakeven I think.
∞

Gyspy Bot Trade Engine - V1.2B - Alerts - 12-7-25 - SignalLynxGypsy Bot Trade Engine (MK6 V1.2B) - Alerts & Visualization
Brought to you by Signal Lynx | Automation for the Night-Shift Nation 🌙
1. Executive Summary & Architecture
Gypsy Bot (MK6 V1.2B) is not merely a strategy; it is a massive, modular Trade Engine built specifically for the TradingView Pine Script V6 environment. While most tools rely on a single dominant indicator to generate signals, Gypsy Bot functions as a sophisticated Consensus Algorithm.
Note: This is the Indicator / Alerts version of the engine. It is designed for visual analysis and generating live alert signals for automation. If you wish to see Backtest data (Equity Curves, Drawdown, Profit Factors), please use the Strategy version of this script.
The engine calculates data from up to 12 distinct Technical Analysis Modules simultaneously on every bar closing. It aggregates these signals into a "Vote Count" and only fires a signal plot when a user-defined threshold of concurring signals is met. This "Voting System" acts as a noise filter, requiring multiple independent mathematical models—ranging from volume flow and momentum to cyclical harmonics and trend strength—to agree on market direction.
Beyond entries, Gypsy Bot features a proprietary Risk Management suite called the Dump Protection Team (DPT). This logic layer operates independently of the entry modules, specifically scanning for "Moon" (Parabolic) or "Nuke" (Crash) volatility events to signal forced exits, preserving capital during Black Swan events.
2. ⚠️ The Philosophy of "Curve Fitting" (Must Read)
One must be careful when applying Gypsy Bot to new pairs or charts.
To be fully transparent: Gypsy Bot is, by definition, a very advanced curve-fitting engine. Because it grants the user granular control over 12 modules, dozens of thresholds, and specific voting requirements, it is extremely easy to "over-fit" the data. You can easily toggle switches until the charts look perfect in hindsight, only to have the signals fail in live markets because they were tuned to historical noise rather than market structure.
To use this engine successfully:
Visual Verification: Do not just look for "green arrows." Look for signals that occur at logical market structure points.
Stability: Ensure signals are not flickering. This script uses closed-candle logic for key decisions to ensure that once a signal plots, it remains painted.
Regular Maintenance is Mandatory: Markets shift regimes (e.g., from Bull Trend to Crab Range). Gypsy Bot settings should be reviewed and adjusted at regular intervals to ensure the voting logic remains aligned with current market volatility.
Timeframe Recommendations:
Gypsy Bot is optimized for High Time Frame (HTF) trend following. It generally produces the most reliable results on charts ranging from 1-Hour to 12-Hours, with the 4-Hour timeframe historically serving as the "sweet spot" for most major cryptocurrency assets.
3. The Voting Mechanism: How Entries Are Generated
The heart of the Gypsy Bot engine is the ActivateOrders input (found in the "Order Signal Modifier" settings).
The engine constantly monitors the output of all enabled Modules.
Long Votes: GoLongCount
Short Votes: GoShortCount
If you have 10 Modules enabled, and you set ActivateOrders to 7:
The engine will ONLY plot a Buy Signal if 7 or more modules return a valid "Buy" signal on the same closed candle.
If only 6 modules agree, the signal is rejected.
4. Technical Deep Dive: The 12 Modules
Gypsy Bot allows you to toggle the following modules On/Off individually to suit the asset you are trading.
Module 1: Modified Slope Angle (MSA)
Logic: Calculates the geometric angle of a moving average relative to the timeline.
Function: Filters out "lazy" trends. A trend is only considered valid if the slope exceeds a specific steepness threshold.
Module 2: Correlation Trend Indicator (CTI)
Logic: Measures how closely the current price action correlates to a straight line (a perfect trend).
Function: Ensures that we are moving up with high statistical correlation, reducing fake-outs.
Module 3: Ehlers Roofing Filter
Logic: A spectral filter combining High-Pass (trend removal) and Super Smoother (noise removal).
Function: Isolates the "Roof" of price action to catch cyclical turning points before standard moving averages.
Module 4: Forecast Oscillator
Logic: Uses Linear Regression forecasting to predict where price "should" be relative to where it is.
Function: Signals when the regression trend flips. Offers "Aggressive" and "Conservative" calculation modes.
Module 5: Chandelier ATR Stop
Logic: A volatility-based trend follower that hangs a "leash" (ATR multiple) from extremes.
Function: Used as an entry filter. If price is above the Chandelier line, the trend is Bullish.
Module 6: Crypto Market Breadth (CMB)
Logic: Pulls data from multiple major tickers (BTC, ETH, and Perpetual Contracts).
Function: Calculates "Market Health." If Bitcoin is rising but the rest of the market is dumping, this module can veto a trade.
Module 7: Directional Index Convergence (DIC)
Logic: Analyzes the convergence/divergence between Fast and Slow Directional Movement indices.
Function: Identifies when trend strength is expanding.
Module 8: Market Thrust Indicator (MTI)
Logic: A volume-weighted breadth indicator using Advance/Decline and Volume data.
Function: One of the most powerful modules. Confirms that price movement is supported by actual volume flow. Recommended setting: "SSMA" (Super Smoother).
Module 9: Simple Ichimoku Cloud
Logic: Traditional Japanese trend analysis.
Function: Checks for a "Kumo Breakout." Price must be fully above/below the Cloud to confirm entry.
Module 10: Simple Harmonic Oscillator
Logic: Analyzes harmonic wave properties to detect cyclical tops and bottoms.
Function: Serves as a counter-trend or early-reversal detector.
Module 11: HSRS Compression / Super AO
Logic: Detects volatility compression (HSRS) or Momentum/Trend confluence (Super AO).
Function: Great for catching explosive moves resulting from consolidation.
Module 12: Fisher Transform (MTF)
Logic: Converts price data into a Gaussian normal distribution.
Function: Identifies extreme price deviations. Uses Multi-Timeframe (MTF) logic to ensure you aren't trading against the major trend.
5. Global Inhibitors (The Veto Power)
Even if 12 out of 12 modules vote "Buy," Gypsy Bot performs a final safety check using Global Inhibitors.
Bitcoin Halving Logic: Prevents trading during chaotic weeks surrounding Halving events (dates projected through 2040).
Miner Capitulation: Uses Hash Rate Ribbons to identify bearish regimes when miners are shutting down.
ADX Filter: Prevents trading in "Flat/Choppy" markets (Low ADX).
CryptoCap Trend: Checks the total Crypto Market Cap chart for broad market alignment.
6. Risk Management & The Dump Protection Team (DPT)
Even in this Indicator version, the RM logic runs to generate Exit Signals.
Dump Protection Team (DPT): Detects "Nuke" (Crash) or "Moon" (Pump) volatility signatures. If triggered, it plots an immediate Exit Signal (Yellow Plot).
Advanced Adaptive Trailing Stop (AATS): Dynamically tightens stops in low volatility ("Dungeon") and loosens them in high volatility ("Penthouse").
Staged Take Profits: Plots TP1, TP2, and TP3 events on the chart for visual confirmation or partial exit alerts.
7. Recommended Setup Guide
When applying Gypsy Bot to a new chart, follow this sequence:
Set Timeframe: 4 Hours (4H).
Tune DPT: Adjust "Dump/Moon Protection" inputs first. These filter out bad signals during high volatility.
Tune Module 8 (MTI): Experiment with the MA Type (SSMA is recommended).
Select Modules: Enable/Disable modules based on the asset's personality (Trending vs. Ranging).
Voting Threshold: Adjust ActivateOrders to filter out noise.
Alert Setup: Once visually satisfied, use the "Any Alert Function Call" option when creating an alert in TradingView to capture all Buy/Sell/Close events generated by the engine.
8. Technical Specs
Engine Version: Pine Script V6
Repainting: This indicator uses Closed Candle data for all Risk Management and Entry decisions. This ensures that signals do not vanish after the candle closes.
Visuals:
Blue Plot: Buy/Sell Signal.
Yellow Plot: Risk Management (RM) / DPT Close Signal.
Green/Lime/Olive Plots: Take Profit hits.
Disclaimer:
This script is a complex algorithmic tool for market analysis. Past performance is not indicative of future results. Cryptocurrency trading involves substantial risk of loss. Use this tool to assist your own decision-making, not to replace it.
9. About Signal Lynx
Automation for the Night-Shift Nation 🌙
Signal Lynx focuses on helping traders and developers bridge the gap between indicator logic and real-world automation. The same RM engine you see here powers multiple internal systems and templates, including other public scripts like the Super-AO Strategy with Advanced Risk Management.
We provide this code open source under the Mozilla Public License 2.0 (MPL-2.0) to:
Demonstrate how Adaptive Logic and structured Risk Management can outperform static, one-layer indicators
Give Pine Script users a battle-tested RM backbone they can reuse, remix, and extend
If you are looking to automate your TradingView strategies, route signals to exchanges, or simply want safer, smarter strategy structures, please keep Signal Lynx in your search.
License: Mozilla Public License 2.0 (Open Source).
If you make beneficial modifications, please consider releasing them back to the community so everyone can benefit.

Multi-Timeframe Smart Analysis [Abusuhil]الوصف بالعربي في الاسفل .
📊 Multi-Timeframe Smart Analysis
🇬🇧 ENGLISH DESCRIPTION
Overview
Multi-Timeframe Smart Analysis is a professional trading indicator designed for cryptocurrency and forex markets, combining RSI and MACD with multi-timeframe (MTF) confirmation to generate high-probability trading signals. The indicator provides clear entry points, automatic Fibonacci-based targets, and risk management levels.
Key Features
1. Multi-Timeframe Analysis (MTF)
Analyzes up to 3 higher timeframes simultaneously
Provides trend confirmation from HTF1, HTF2, and HTF3
Real-time dashboard showing current trend status
Optional: Can be disabled to trade based on current timeframe only
2. Smart Signal Generation
Buy Signals: Generated when MACD crosses above signal line with bullish RSI and HTF confirmation
Sell Signals: Generated when MACD crosses below signal line with bearish RSI and HTF confirmation
Anti-spam system: Minimum bars between signals (default: 10 bars)
Optional: Show only last signal to keep chart clean
3. Automatic Risk Management
Entry Line: Displays exact entry price
Stop Loss: Calculated using ATR (default: 1.5x ATR)
Take Profit Levels:
T1: 1.618x ATR (First target)
T2: 2.618x ATR (Second target)
T3: 4.236x ATR (Final target)
4. Visual Dashboard
Shows current timeframe RSI and MACD status
Displays HTF1 and HTF2 trend direction (BULL/BEAR)
Real-time signal status (🟢 BUY / 🔴 SELL / ⚪ WAIT)
Clean, professional interface in top-right corner
5. Customization Options
Multiple signal styles: Label, Triangle, Arrow, Circle
Adjustable signal size: Tiny, Small, Normal, Large
Customizable colors for buy/sell signals
Flexible target extension bars
Toggle all features on/off independently
📋 Recommended Settings by Timeframe
For 1-Minute Chart (Scalping)
HTF1: 5 minutes
HTF2: 15 minutes
HTF3: 1 hour
RSI Length: 14
MACD: 12/26/9
Stop Loss ATR: 1.0
Best for: High-frequency scalping on volatile pairs like BTC/USDT, ETH/USDT
For 5-Minute Chart (Day Trading)
HTF1: 15 minutes
HTF2: 1 hour
HTF3: 4 hours
RSI Length: 14
MACD: 12/26/9
Stop Loss ATR: 1.5
Best for: Intraday trading on major crypto pairs and forex
For 15-Minute Chart (Swing Trading)
HTF1: 1 hour
HTF2: 4 hours
HTF3: 1 day
RSI Length: 14
MACD: 12/26/9
Stop Loss ATR: 1.5
Best for: Short-term swing trades, ideal for crypto and forex
For 1-Hour Chart (Position Trading)
HTF1: 4 hours
HTF2: 1 day
HTF3: 3 days
RSI Length: 14
MACD: 12/26/9
Stop Loss ATR: 2.0
Best for: Medium-term positions, suitable for all markets
For 4-Hour Chart (Swing/Position)
HTF1: 1 day
HTF2: 3 days
HTF3: 1 week
RSI Length: 14
MACD: 12/26/9
Stop Loss ATR: 2.5
Best for: Swing trading with lower frequency, higher accuracy
For Daily Chart (Long-Term)
HTF1: 3 days
HTF2: 1 week
HTF3: 1 month
RSI Length: 14
MACD: 12/26/9
Stop Loss ATR: 3.0
Best for: Position trading and long-term investments
🎯 How to Trade with This Indicator
Entry Rules
For LONG (Buy) Entries:
Wait for 🟢 BUY signal to appear
Verify HTF1 and HTF2 show BULL trend in dashboard
Check RSI is below 70 (not overbought)
Enter at the displayed Entry Line price
Place stop loss at SL level
Set take profit at T1, T2, T3 (scale out)
For SHORT (Sell) Entries:
Wait for 🔴 SELL signal to appear
Verify HTF1 and HTF2 show BEAR trend in dashboard
Check RSI is above 30 (not oversold)
Enter at the displayed Entry Line price
Place stop loss at SL level
Set take profit at T1, T2, T3 (scale out)
Exit Strategy (Recommended)
Conservative Approach:
Close 50% position at T1
Move SL to breakeven
Close 30% at T2
Let 20% run to T3 with trailing stop
Aggressive Approach:
Hold full position to T2
Close 70% at T2
Trail remaining 30% to T3
Quick Scalp:
Close entire position at T1
Re-enter on next signal
⚙️ Settings Guide
Timeframe Settings
Enable Higher Timeframe Analysis: Toggle MTF confirmation on/off
HTF1, HTF2, HTF3: Set your desired higher timeframes
RSI Settings
RSI Length: Period for RSI calculation (default: 14)
RSI Overbought: Upper threshold (default: 70)
RSI Oversold: Lower threshold (default: 30)
Use RSI Filter: Enable/disable RSI confirmation
MACD Settings
Fast Length: Fast EMA period (default: 12)
Slow Length: Slow EMA period (default: 26)
Signal Length: Signal line period (default: 9)
Use MACD Filter: Enable/disable MACD confirmation
Target Settings
Show Price Targets: Toggle target lines on/off
Fib Target 1/2/3: Customize Fibonacci multipliers
Target Extension Bars: How far targets extend (default: 50)
Stop Loss ATR: Stop loss distance multiplier (default: 1.5)
Signal Settings
Show Buy/Sell Signals: Toggle signals independently
Show Only Last Signal: Hide previous signals, show only latest
Signal Style: Choose visual style (Label/Triangle/Arrow/Circle)
Minimum Bars Between Signals: Anti-spam filter (default: 10)
📌 Important Notes
Not a Holy Grail: This indicator is a tool, not a guarantee. Always use proper risk management
Backtest First: Test on historical data before live trading
Combine with Price Action: Use support/resistance levels for additional confirmation
Adjust to Market Conditions: Volatile markets may need wider stops, ranging markets need tighter targets
News Events: Avoid trading during major news releases
Risk Management: Never risk more than 1-2% of your capital per trade
🎓 Best Practices
Start Conservative: Begin with default settings
One Timeframe at a Time: Master one chart before expanding
Journal Your Trades: Track which settings work best for your style
Use Demo Account: Practice before risking real money
Stay Disciplined: Follow your trading plan strictly
🔔 Alert System
The indicator includes built-in alerts:
Buy Signal Alert: Notifies when long opportunity appears
Sell Signal Alert: Notifies when short opportunity appears
To activate alerts:
Click "Create Alert" in TradingView
Select "Multi-Timeframe Smart Analysis"
Choose "Buy Signal" or "Sell Signal"
Set notification preferences
💡 Pro Tips
Confluence Trading: Wait for signals that align with key S/R levels
Trend Trading: In strong trends, prioritize signals in trend direction
Multiple Timeframe Entries: Use HTF for bias, lower TF for precise entry
Partial Profits: Always secure some profit at T1
Trailing Stops: Move SL to breakeven after T1 is hit
⚠️ Risk Disclaimer
Trading cryptocurrencies, forex, and other financial instruments involves substantial risk of loss and is not suitable for all investors. Past performance is not indicative of future results. The indicator provides technical analysis only and should not be considered financial advice. You are solely responsible for your trading decisions. Always conduct your own research and consider consulting with a licensed financial advisor.
📞 Support & Updates
For questions, suggestions, or bug reports, please contact via TradingView messages.
Version: 1.0
Author: Abusuhil
Last Updated: December 2024
📊 التحليل الذكي متعدد الأطر الزمنية
🇸🇦 الوصف بالعربية
نظرة عامة
التحليل الذكي متعدد الأطر الزمنية هو مؤشر تداول احترافي مصمم لأسواق العملات الرقمية والفوركس، يجمع بين مؤشري RSI و MACD مع تأكيد من أطر زمنية أعلى لتوليد إشارات تداول عالية الاحتمالية. يوفر المؤشر نقاط دخول واضحة، أهداف تلقائية مبنية على فيبوناتشي، ومستويات إدارة المخاطر.
المزايا الرئيسية
1. التحليل متعدد الأطر الزمنية (MTF)
يحلل حتى 3 أطر زمنية أعلى في وقت واحد
يوفر تأكيد الاتجاه من HTF1، HTF2، و HTF3
لوحة معلومات فورية تظهر حالة الاتجاه الحالي
اختياري: يمكن تعطيله للتداول بناءً على الإطار الزمني الحالي فقط
2. توليد إشارات ذكية
إشارات الشراء: تُنشأ عندما يعبر MACD فوق خط الإشارة مع RSI صاعد وتأكيد HTF
إشارات البيع: تُنشأ عندما يعبر MACD تحت خط الإشارة مع RSI هابط وتأكيد HTF
نظام مضاد للإزعاج: حد أدنى من الشموع بين الإشارات (افتراضي: 10 شموع)
اختياري: إظهار آخر إشارة فقط للحفاظ على نظافة الشارت
3. إدارة تلقائية للمخاطر
خط الدخول: يعرض سعر الدخول الدقيق
وقف الخسارة: محسوب باستخدام ATR (افتراضي: 1.5x ATR)
مستويات جني الأرباح:
T1: 1.618x ATR (الهدف الأول)
T2: 2.618x ATR (الهدف الثاني)
T3: 4.236x ATR (الهدف النهائي)
4. لوحة معلومات مرئية
تعرض حالة RSI و MACD للإطار الزمني الحالي
تظهر اتجاه HTF1 و HTF2 (صاعد/هابط)
حالة الإشارة الفورية (🟢 شراء / 🔴 بيع / ⚪ انتظار)
واجهة نظيفة واحترافية في الزاوية العلوية اليمنى
5. خيارات التخصيص
أنماط إشارات متعددة: تسمية، مثلث، سهم، دائرة
حجم إشارة قابل للتعديل: صغير جداً، صغير، عادي، كبير
ألوان قابلة للتخصيص لإشارات الشراء/البيع
أشرطة تمديد الهدف مرنة
تبديل جميع الميزات تشغيل/إيقاف بشكل مستقل
📋 الإعدادات الموصى بها حسب الإطار الزمني
لشارت دقيقة واحدة (سكالبينج)
HTF1: 5 دقائق
HTF2: 15 دقيقة
HTF3: 1 ساعة
طول RSI: 14
MACD: 12/26/9
وقف الخسارة ATR: 1.0
الأفضل لـ: السكالبينج عالي التردد على الأزواج المتقلبة مثل BTC/USDT، ETH/USDT
لشارت 5 دقائق (التداول اليومي)
HTF1: 15 دقيقة
HTF2: 1 ساعة
HTF3: 4 ساعات
طول RSI: 14
MACD: 12/26/9
وقف الخسارة ATR: 1.5
الأفضل لـ: التداول اليومي على أزواج العملات الرقمية الرئيسية والفوركس
لشارت 15 دقيقة (التداول المتأرجح)
HTF1: 1 ساعة
HTF2: 4 ساعات
HTF3: 1 يوم
طول RSI: 14
MACD: 12/26/9
وقف الخسارة ATR: 1.5
الأفضل لـ: صفقات التأرجح قصيرة المدى، مثالي للعملات الرقمية والفوركس
لشارت ساعة واحدة (التداول بالمراكز)
HTF1: 4 ساعات
HTF2: 1 يوم
HTF3: 3 أيام
طول RSI: 14
MACD: 12/26/9
وقف الخسارة ATR: 2.0
الأفضل لـ: المراكز متوسطة المدى، مناسب لجميع الأسواق
لشارت 4 ساعات (التأرجح/المراكز)
HTF1: 1 يوم
HTF2: 3 أيام
HTF3: 1 أسبوع
طول RSI: 14
MACD: 12/26/9
وقف الخسارة ATR: 2.5
الأفضل لـ: التداول المتأرجح بتردد أقل ودقة أعلى
للشارت اليومي (طويل المدى)
HTF1: 3 أيام
HTF2: 1 أسبوع
HTF3: 1 شهر
طول RSI: 14
MACD: 12/26/9
وقف الخسارة ATR: 3.0
الأفضل لـ: تداول المراكز والاستثمارات طويلة المدى
🎯 كيفية التداول باستخدام هذا المؤشر
قواعد الدخول
لصفقات الشراء (LONG):
انتظر ظهور إشارة 🟢 شراء
تحقق من أن HTF1 و HTF2 تظهر اتجاه صاعد في لوحة المعلومات
تأكد من أن RSI أقل من 70 (ليس في منطقة التشبع الشرائي)
ادخل عند سعر خط الدخول المعروض
ضع وقف الخسارة عند مستوى SL
اضبط جني الأرباح عند T1، T2، T3 (اخرج تدريجياً)
لصفقات البيع (SHORT):
انتظر ظهور إشارة 🔴 بيع
تحقق من أن HTF1 و HTF2 تظهر اتجاه هابط في لوحة المعلومات
تأكد من أن RSI أعلى من 30 (ليس في منطقة التشبع البيعي)
ادخل عند سعر خط الدخول المعروض
ضع وقف الخسارة عند مستوى SL
اضبط جني الأرباح عند T1، T2، T3 (اخرج تدريجياً)
استراتيجية الخروج (موصى بها)
النهج المحافظ:
أغلق 50% من المركز عند T1
حرك وقف الخسارة إلى نقطة التعادل
أغلق 30% عند T2
دع 20% يعمل حتى T3 مع وقف خسارة متحرك
النهج العدواني:
احتفظ بالمركز الكامل حتى T2
أغلق 70% عند T2
تتبع الـ 30% المتبقية حتى T3
سكالبينج سريع:
أغلق المركز بالكامل عند T1
أعد الدخول عند الإشارة التالية
⚙️ دليل الإعدادات
إعدادات الإطار الزمني
تفعيل تحليل الإطار الزمني الأعلى: تبديل تأكيد MTF تشغيل/إيقاف
HTF1، HTF2، HTF3: اضبط الأطر الزمنية الأعلى المرغوبة
إعدادات RSI
طول RSI: فترة حساب RSI (افتراضي: 14)
RSI في التشبع الشرائي: العتبة العليا (افتراضي: 70)
RSI في التشبع البيعي: العتبة السفلى (افتراضي: 30)
استخدام فلتر RSI: تمكين/تعطيل تأكيد RSI
إعدادات MACD
الطول السريع: فترة المتوسط المتحرك السريع (افتراضي: 12)
الطول البطيء: فترة المتوسط المتحرك البطيء (افتراضي: 26)
طول الإشارة: فترة خط الإشارة (افتراضي: 9)
استخدام فلتر MACD: تمكين/تعطيل تأكيد MACD
إعدادات الأهداف
إظهار أهداف الأسعار: تبديل خطوط الأهداف تشغيل/إيقاف
هدف فيبوناتشي 1/2/3: تخصيص مضاعفات فيبوناتشي
أشرطة تمديد الأهداف: مدى امتداد الأهداف (افتراضي: 50)
وقف الخسارة ATR: مضاعف مسافة وقف الخسارة (افتراضي: 1.5)
إعدادات الإشارات
إظهار إشارات الشراء/البيع: تبديل الإشارات بشكل مستقل
إظهار آخر إشارة فقط: إخفاء الإشارات السابقة، إظهار الأحدث فقط
نمط الإشارة: اختر النمط المرئي (تسمية/مثلث/سهم/دائرة)
الحد الأدنى من الشموع بين الإشارات: فلتر مضاد للإزعاج (افتراضي: 10)
📌 ملاحظات مهمة
ليس الكأس المقدسة: هذا المؤشر أداة، وليس ضماناً. استخدم دائماً إدارة مخاطر مناسبة
اختبار رجعي أولاً: اختبر على البيانات التاريخية قبل التداول المباشر
ادمج مع حركة السعر: استخدم مستويات الدعم/المقاومة لتأكيد إضافي
تكيّف مع ظروف السوق: الأسواق المتقلبة قد تحتاج إلى وقف خسارة أوسع، الأسواق الجانبية تحتاج إلى أهداف أضيق
أحداث الأخبار: تجنب التداول أثناء إصدارات الأخبار الكبرى
إدارة المخاطر: لا تخاطر أبداً بأكثر من 1-2% من رأس مالك لكل صفقة
🎓 أفضل الممارسات
ابدأ بحذر: ابدأ بالإعدادات الافتراضية
إطار زمني واحد في كل مرة: أتقن شارت واحد قبل التوسع
سجل صفقاتك: تتبع أي الإعدادات تعمل بشكل أفضل لأسلوبك
استخدم حساب تجريبي: تدرب قبل المخاطرة بأموال حقيقية
التزم بالانضباط: اتبع خطة تداولك بصرامة
🔔 نظام التنبيهات
يتضمن المؤشر تنبيهات مدمجة:
تنبيه إشارة الشراء: يُعلمك عند ظهور فرصة شراء
تنبيه إشارة البيع: يُعلمك عند ظهور فرصة بيع
لتفعيل التنبيهات:
انقر على "إنشاء تنبيه" في TradingView
اختر "Multi-Timeframe Smart Analysis"
اختر "Buy Signal" أو "Sell Signal"
اضبط تفضيلات الإشعارات
💡 نصائح احترافية
تداول التقاء: انتظر الإشارات التي تتماشى مع مستويات الدعم والمقاومة الرئيسية
تداول الاتجاه: في الاتجاهات القوية، أعط الأولوية للإشارات في اتجاه الترند
مداخل الإطار الزمني المتعدد: استخدم HTF للتحيز، إطار زمني أقل للدخول الدقيق
أرباح جزئية: احفظ دائماً بعض الربح عند T1
وقف خسارة متحرك: حرك وقف الخسارة إلى التعادل بعد الوصول إلى T1
⚠️ إخلاء مسؤولية المخاطر
تداول العملات الرقمية والفوركس وغيرها من الأدوات المالية ينطوي على مخاطر كبيرة للخسارة وليس مناسباً لجميع المستثمرين. الأداء السابق لا يشير إلى النتائج المستقبلية. يوفر المؤشر التحليل الفني فقط ولا ينبغي اعتباره نصيحة مالية. أنت المسؤول الوحيد عن قرارات التداول الخاصة بك. قم دائماً بإجراء بحثك الخاص وفكر في استشارة مستشار مالي مرخص.
📞 الدعم والتحديثات
للأسئلة أو الاقتراحات أو الإبلاغ عن الأخطاء، يرجى التواصل عبر رسائل TradingView.
الإصدار: 1.0
المطور: Abusuhil
آخر تحديث: ديسمبر 2024

XΩ — T+ Sentiment Sniper
**XΩ — T+ Sentiment Sniper**
Crowd psychology helper for timing T+ reversals and managing risk
---
### 1. What is XΩ — T+ Sentiment Sniper?
XΩ — T+ Sentiment Sniper is a **crowd sentiment companion indicator**.
It estimates whether the market as a whole is currently:
- Deep in profit (euphoria, FOMO‑prone)
- Deep in loss (panic, capitulation‑prone)
- Slightly profitable / slightly losing
From that, it marks:
- Potential **supply/demand absorption** zones at panic lows and euphoric highs
- **Sentiment divergences** between price and crowd PnL
You use it as a **psychology layer on top of your main system**, especially for timing T+ style moves (the next 1–3 swings after an emotional extreme).
You do not need to understand the internal math to use it.
---
### 2. How to read the panel
The indicator runs in a **separate pane** (not on the price chart) and shows:
1. **Crowd Sentiment (Raw) – columns**
- Green/red columns represent how “good” or “bad” the crowd’s current PnL is.
- Taller columns = more emotional / more extreme conditions.
2. **Signal Line – white line**
- A smoothed line summarising the **overall direction of sentiment**.
- Helps you see whether psychology is improving or deteriorating.
3. **Horizontal levels**
- `0 (Neutral)` → sentiment is roughly balanced.
- `Euphoria` → crowd is strongly in profit (high risk of FOMO and distribution).
- `Panic` → crowd is deeply underwater (high risk of capitulation and absorption).
4. **Dashboard label on the latest bar**
- Status: `EUPHORIA (Risk)`, `PANIC (Opp.)`, `SLIGHT PROFIT`, or `SLIGHT LOSS`.
- Current **Crowd PnL (%)**.
- A short note about volume (stable vs unusually high, with a T+2 warning when needed).
At a glance, you know:
> “Is the market currently euphoric, panicking, or somewhere in between?”
---
### 3. What the signals mean
The indicator plots shapes at the top/bottom of the pane:
- **ABS (Absorption – Buy)**
- Small green circle near the bottom.
- Suggests **demand absorption**: sentiment is bad (panic), but strong buying appears against the selling.
- Use as a **potential bottom area** to watch, not an automatic “buy now”.
- **DST (Distribution – Sell)**
- Small red circle near the top.
- Suggests **distribution**: sentiment is very positive (euphoria), but strong selling appears into that optimism.
- Use as a **potential top area** to watch for taking profits or avoiding FOMO entries.
- **DIV triangle up (Bullish Div – Buy)**
- Yellow triangle pointing up near the bottom.
- Price makes new lows while sentiment stops getting worse and starts to improve.
- Suggests selling pressure is fading; potential for an upward reversal.
- **DIV triangle down (Bearish Div – Sell)**
- Orange triangle pointing down near the top.
- Price makes new highs while sentiment stops getting better and starts to weaken.
- Suggests buying pressure is fading; potential for a downward reversal.
Think of these as **context signals / alerts**, not as “must‑take” entries on their own.
---
### 4. Suggested ways to use it
#### 4.1. As a context filter before entering trades
Use Sentiment Sniper to avoid trading directly into emotional extremes:
- Avoid opening **new longs** when:
- The indicator is in the **Euphoria** zone and you see **DST or Bearish DIV** near resistance.
- Avoid opening **new shorts** when:
- The indicator is in the **Panic** zone and you see **ABS or Bullish DIV** near support.
In other words, use it as a **“do not chase” filter** for tops and bottoms.
---
#### 4.2. To spot potential T+ reversal zones
Example workflow:
1. Use your normal tools to mark **key zones** (support/resistance, liquidity areas, higher‑timeframe levels).
2. When price reaches those zones, look at T+ Sentiment Sniper:
- Near **Panic** with **ABS or Bullish DIV** → watch for potential long opportunities.
- Near **Euphoria** with **DST or Bearish DIV** → watch for potential short/exit opportunities.
3. Only take trades when:
- You also have confirmation from your own system (reversal candle, structure break, etc.).
4. Expect a **T+ style move** (1–3 swings) away from the extreme.
---
#### 4.3. To manage open positions
- When you are **heavily in profit**:
- If Sentiment Sniper moves into **Euphoria** and starts printing **DST or Bearish DIV**, consider:
- Taking partial profits
- Tightening stops
- Reducing risk to protect gains
- When you are **stuck in drawdown**:
- If sentiment is deep in **Panic** but there is **no** ABS or Bullish DIV yet, be careful:
- Avoid catching a falling knife too early.
- Look for sentiment to stabilise (ABS/DIV + your own confirmation) before committing.
---
### 5. User‑level settings (simple view)
You typically only need to think of them like this:
- **Half-Life (Memory Decay)**
- Higher value → sentiment reacts more slowly (more “long‑term” feel).
- Lower value → sentiment reacts faster to recent moves (better for short‑term trading).
- **Euphoria / Panic Threshold (%)**
- Define what counts as an “extreme”.
- For very volatile assets (crypto, small caps), you may want slightly wider thresholds.
- For calmer markets (majors, large caps), slightly tighter thresholds may be enough.
- **Avg Volume Length**
- Period to define “normal” volume.
- Spikes above this are used to flag meaningful absorption/distribution.
- **Show Sentiment Divergence / Show Supply/Demand Absorption**
- Turn off one or both if you feel the chart is too crowded.
- Keep only the parts that match your own style.
---
### 6. Alerts
In TradingView’s **Alerts** panel you will find:
- `XΩ SNIPER BUY`
- Triggers when a **psychological Buy** signal appears (Absorption or Bullish Divergence, if enabled).
- `XΩ SNIPER SELL`
- Triggers when a **psychological Sell** signal appears (Distribution or Bearish Divergence, if enabled).
Use alerts to be notified when the crowd hits important **Panic/Euphoria zones**, without watching the screen all day.
---
### 7. Important notes
- This is a **sentiment / context tool**, not a standalone “black box” system.
- Always combine it with:
- Price structure on higher timeframes
- Your own entry/exit rules
- Proper risk management
- Backtest and forward‑test before applying it with real capital.

Apex Trend & Liquidity Master with TP/SLThe Apex Trend & Liquidity Master is a systematic trading framework that identifies trend direction and key structural price levels for entry and exit decisions. The system uses a volatility-adaptive trend detection mechanism built on Hull Moving Averages with ATR-based bands to filter consolidation periods and isolate directional moves.
The liquidity detection engine identifies potential reversal zones by marking swing highs and lows that meet statistical significance thresholds. These zones represent areas where institutional order flow previously caused price rejection. Zones remain active until price closes through them, indicating mitigation of the level.
This implementation is an enhanced derivative of the original system with fully automated risk management. Stop losses are calculated using ATR multiples with entry candle wick protection as a minimum threshold, while take profits maintain a fixed 3:1 risk-reward ratio. An additional exit mechanism closes profitable positions when price reaches opposing supply or demand zones, providing early profit-taking at probable reversal points before full target completion.
Entry signals generate only on trend changes when volume exceeds average levels, reducing false breakouts in ranging conditions. The system includes complete position tracking with three distinct exit types: take profit hits, stop loss hits, and profitable zone contact exits. All calculations use confirmed historical data with no forward-looking bias, though supply/demand zone identification operates with a confirmation lag inherent to pivot point detection.

HTF/CTF High/Low Mitigation with SignalsHTF/CTF High/Low Mitigation with Signals Indicator
Overview
HTF/CTF High/Low Mitigation with Signals (shortened as "H/L Signals+") is an advanced overlay indicator for TradingView, designed to identify and visualize higher timeframe (HTF) and current timeframe (CTF) swing highs/lows, track their mitigation, and generate filtered buy/sell signals using an EMA ribbon trend filter. It incorporates automated trade simulation with risk/reward (RR) visualization, position sizing based on user-defined risk, and a statistics table for performance evaluation. This tool is ideal for multi-timeframe traders focusing on swing trading, breakout strategies, or trend reversals across assets like forex, futures, metals (e.g., XAU/USD, XAG/USD), stocks, or cryptocurrencies.
The "meshup" (mashup) integrates several complementary elements: Multi-timeframe swing level detection (HTF for broader structure, CTF for finer details) with mitigation logic ensures signals align with market structure breaks; an EMA ribbon provides a dynamic trend bias to filter counter-trend trades; risk management automates position sizing and RR calculations for disciplined trading; and built-in backtesting stats offer quick insights into hypothetical performance. This combination reduces noise from isolated indicators—e.g., raw swings can be choppy, EMAs alone lag structure, and manual RR is error-prone—creating a cohesive system for spotting high-probability setups where structure, trend, and risk align. By meshing these, it aims to enhance decision-making in trending or ranging markets, though it's reactive and best used with confirmation. Note: This is a technical tool for educational purposes only; it does not provide financial advice, guarantees of profitability, or trading recommendations. Past performance is not indicative of future results, and users should backtest thoroughly on their specific assets/timeframes, in compliance with TradingView's house rules.
Key Features
• HTF Swing Levels: Detects and draws session highs/lows from a user-selected higher timeframe (e.g., Daily), extends lines until mitigated (by wick or body close), with alerts on mitigation.
• CTF Swing Levels: Identifies local swing highs/lows on the chart timeframe using a pivot candle formation (default 5-candle), with separate limits for unmitigated/mitigated lines.
• EMA Ribbon: A three-EMA system (fast 8, mid 13, slow 21) with gradient fills (green for bullish, red for bearish) to visualize trend strength and filter signals.
• Signal Generation: Buy/sell labels ("BUY"/"SELL") triggered post-mitigation when price aligns with EMA trend (e.g., above slow EMA with stacked bulls for buys).
• Trade Simulation & Risk Management: On signals, calculates stop-loss (SL) from recent extremes, position size based on fixed risk amount (e.g., $100 per trade, adjusted for asset type like futures point value or forex lots), and full take-profit (TP) at user-defined RR level (1-5). Draws RR boxes for visuals.
• Statistics Table: Displays total trades, wins/losses, win rate (%), net R-return, and max consecutive losses in a top-right table.
• Alerts: Customizable alerts for HTF mitigations and new trades (including entry, SL, TP, size).
• Visual Customizations: Toggle lines/ribbon/boxes, adjust colors/styles/widths for unmitigated/mitigated lines (HTF/CTF), min box width.
• Performance Optimization: Automatically cleans up excess lines to stay within max limits (e.g., 15 unmitigated HTF, 5 CTF).
How It Works
• HTF Logic: On new HTF bars (via time(htf_timeframe)), captures session high/low and draws extendable lines. Lines extend rightward until mitigated (high/close > high level for highs, low/close < low level for lows, toggle wick/body). Mitigation sets "waiting" flags for signals and triggers alerts.
• CTF Logic: Scans for pivot highs/lows using a user-defined candle count (e.g., 2 left/right for 5-candle swings). Draws and extends lines similarly, mitigating on wick touches, with separate styles for mitigated (e.g., dotted gray).
• EMA Ribbon Logic: Computes 8/13/21 EMAs; fills mid-slow and fast-mid with bullish green (close > slow EMA) or bearish red gradients.
• Signal Conditions: Post-mitigation (waiting_for_buy/sell true), checks EMA stack—buys require close > slow, fast > mid > slow; sells require close < slow, fast < mid < slow. Signals only on confirmed bars.
• Trade Execution: On signal, sets entry at close, scans back to mitigation bar for tightest SL (lowest low for buys, highest high for sells). Calculates risk points (entry - SL for buys), then position size via helper function (asset-specific: e.g., XAU *100, futures *pointvalue, forex 100000pointvalue). Sets full TP at entry ± (risk * full_tp_level). Draws risk/reward boxes (e.g., long: dark risk below entry, blue reward above) with RR and size text. Alerts with trade details.
• Trade Management: Monitors for SL hit (low <= SL for longs) or TP hit (high >= TP for longs); updates stats (wins if TP, losses if SL, tracks consec losses, net R as +full_tp_level or -1). Places summary label ("Hit TP5 (Win)" or "Stopped Out (Loss)").
• Cleanup: Counts unmitigated/mitigated lines; deletes oldest excess to respect max limits (e.g., max_lines_input=15 for HTF unmitigated, max_mit_lines_ctf=5 for CTF mitigated).
• Why This Meshup?: Standalone tools often fall short—HTF swings ignore local noise, but without CTF, miss entries; EMAs filter trends but overlook structure; manual RR lacks automation. Meshing them creates a "mitigation-to-signal" flow: HTF/CTF provide structural context (e.g., BOS/CHOCH), EMA ensures trend alignment (reducing whipsaws), and RR simulation adds practical risk control with stats for optimization. This holistic approach potentially improves edge in structure-based trading, especially in volatile markets, by combining macro/micro analysis with quantifiable risk—though it may lag in ranges or require tuning.
All logic uses arrays for line management, barstate.isconfirmed for reliability, and syminfo for asset-specific sizing. No repainting, but historical trades simulate based on chart data.
Settings and Customization
Inputs are grouped for usability:
1. Higher Timeframe (HTF) Settings:
o Show HTF Lines: Toggle visibility (default: true).
o Use Wick for Mitigation: True for wick touch, false for body close (default: false; tooltip explains).
o Timeframe: HTF period (default: "D").
o Max Unmitigated HTF Lines: Limit for active lines (default: 15, min 1, max 250).
2. Current Timeframe (CTF) Settings:
o Show CTF Swings: Toggle (default: true).
o CTF Swing Candle Count: Left/right candles for pivot (default: 2, min 1; tooltip: '2' = 5-candle formation).
o Max Unmitigated CTF Lines: (default: 5, min 1, max 250).
o Max Mitigated CTF Lines: (default: 5, min 1, max 250).
3. EMA Settings:
o Show EMA Ribbon: Toggle (default: true).
o Fast/Middle/Slow EMA Length: Defaults 8/13/21.
4. Risk/Reward Settings:
o Risk Amount per Trade ($): Fixed risk (default: 100.0, min 0.1; tooltip: for position sizing).
o Full Take Profit Level (1-5): RR for full win (default: 5; tooltip: counts as win in stats).
o Show Trade Visuals & Stats: Toggle boxes, labels, table (default: true).
5. 🎨 Visuals:
o Draw Risk/Reward Box: Toggle (default: true).
o Minimum Box Width (in bars): (default: 5, min 1).
o Long - Risk/Reward Box Colors: Defaults dark gray (risk), blue (reward).
o Short - Risk/Reward Box Colors: Defaults dark gray (risk), orange (reward).
6. Alert Settings:
o Alert on HTF Level Mitigation: Toggle (default: true).
7. HTF Line Style Settings:
o High (Unmitigated): Color (maroon 20%), width (1).
o High (Mitigated): Color (gray 40%), style (dotted/dashed, default dotted).
o Low (Unmitigated): Color (teal 20%), width (1).
o Low (Mitigated): Color (gray 40%), style (dotted/dashed, default dotted).
8. CTF Line Styles:
o CTF High (Unmitigated): Color (purple #8d198d 25%), width (1), style (Solid/Dotted/Dashed, default Solid).
o CTF High (Mitigated): Color (gray 50%), width (1), style (default Dotted).
o CTF Low (Unmitigated): Color (teal #008080 25%), width (1), style (default Solid).
o CTF Low (Mitigated): Color (gray 50%), width (1), style (default Dotted).
Usage Tips
• Multi-Timeframe Strategy: Use HTF (e.g., D1) for major levels, CTF for entries. Signals post-mitigation with EMA filter—enter on "BUY"/"SELL" labels, use boxes for RR visualization.
• Risk Management: Set risk_amount_per_trade to 1-2% of capital; adjust full_tp_level for strategy (e.g., 3 for conservative). Position size auto-adapts to asset (e.g., smaller for high-vol like XAU).
• Customization: Enable wick mitigation for aggressive setups; increase max lines in trending markets. Tune EMAs for asset (shorter for crypto).
• Alerts Integration: Use for notifications on mitigations or trades; messages include all details for quick action.
• Stats Analysis: Table shows hypothetical results—use for optimization (e.g., aim for >50% win rate, low consec losses). Reset on chart reload.
• Chart Compatibility: Best on candlestick charts; test on lower TFs with higher HTF for confluence.
Limitations
• Reactive Signals: Waits for mitigation + EMA alignment, so may miss early reversals or lag in fast markets.
• Chop in Ranges: Frequent mitigations without trend can generate false signals; EMA helps but not foolproof.
• Simulation Only: Trades are backtested on visible data—no live execution; stats assume full TP or SL hits, ignoring partials or slippage.
• Line Limits: Caps at user max to prevent overload; oldest deleted first.
• Asset Specificity: Position sizing tailored to forex/futures/metals; may need tweaks for others.
• Disclaimer: For informational use only. Trading involves risk of loss; results vary by market, timeframe, and settings. Consult professionals and backtest extensively. No profitability claims per TradingView rules.

VB-MainLiteVB-MainLite – v1.0 Initial Release
Overview
VB-MainLite is a consolidated market-structure and execution framework designed to streamline decision-making into a single chart-level view. The script combines multi-timeframe trend, volatility, volume, and liquidity signals into one cohesive visual layer, reducing indicator clutter while preserving depth of information for active traders.
Core Architecture
Trend Backbone – EMA 200
Dedicated EMA 200 acts as the primary trend filter and higher-timeframe bias reference.
Serves as the “spine” of the system for contextualizing all secondary signals (swings, reversals, volume events, etc.).
Custom MA Suite (Envelope Ready)
Four configurable moving averages with flexible source, length, and smoothing.
Default configuration (preset idea: “8/89 Envelope”):
MA #1: EMA 8 on high
MA #2: EMA 8 on low
MA #3: EMA 89 on high
MA #4: EMA 89 on low
All four are disabled by default to keep the chart minimal. Users can toggle them on from the Custom MAs group for envelope or cloud-style configurations.
Nadaraya–Watson Smoother (Swing Framework)
Gaussian-kernel Nadaraya–Watson regression applied to price (hl2) to build a smooth synthetic curve.
Two layers of functionality:
Swing labels (▲ / ▼) at inflection points in the smoothed curve.
Optional curve line that visually tracks the turning structure over the last ~500 bars.
Designed to surface early swing potential before standard MAs react.
Hull Moving Average (Trend Overlay)
Optional Hull MA (HMA) for faster trend visualization.
Color-coded by slope (buy/sell bias).
Default: off to prevent overloading the chart; can be enabled under Hull MA settings.
Momentum, Exhaustion & Pattern Engine
CCI-Based Bar Coloring
CCI applied to close with configurable thresholds.
Overbought / oversold CCI zones map directly into candle coloring to visually highlight short-term momentum extremes.
RSI Top / Bottom Exhaustion Finder
RSI logic applied separately to high-driven (tops) and low-driven (bottoms) sequences.
Plots:
Top arrows where high-side RSI stretches into high-risk territory.
Bottom arrows where low-side RSI indicates exhaustion on the downside.
Useful as confluence around the Nadaraya swing turns and EMA 200 regime.
Engulfing + MA Trend Engine (“Fat Bull / Fat Bear”)
Detects bullish and bearish engulfing patterns, then combines them with MA trend cross logic.
Only when both pattern and MA regime align does the engine flag:
Fat Bull (Engulf + MA aligned long)
Fat Bear (Engulf + MA aligned short)
Candles are marked via conditional barcolor to highlight strong, structured shifts in control.
Fat Finger Detection (Wick Spikes / Stop Runs)
Identifies abnormal wick extensions relative to the prior bar’s body range with configurable tolerance.
Supports detection of potential liquidity grabs, stop runs, or “excess” that may precede reversals or mean-reversion behavior.
Volume & Liquidity Intelligence
Bull Snort (Aggressive Buy Spikes)
Flags events where:
Volume is significantly above the 50-period average, and
Price closes in the upper portion of the bar and above prior close.
Plots a labeled marker below the bar to indicate aggressive upside initiative by buyers.
Pocket Pivots (Accumulation Flags)
Compares current volume vs prior 10 sessions with a filter on prior “up” days.
Highlights pocket pivot days where current green candle volume outclasses recent down-day volumes, suggesting stealth accumulation.
Delta Volume Core (Directional Volume by Price)
Internal volume-by-price style engine over a user-defined lookback.
Splits volume into up-close and down-close buckets across dynamic price bins.
Feeds into S&R and ICT zone logic to quantify where buying vs selling pressure built up.
Structural Context: S&R and ICT Zones
S&R Power Channel
Computes local high/low band over a configurable lookback window.
Renders:
Upper and lower S&R channel lines.
Shaded support / resistance zones using boxes.
Adds Buy Power / Sell Power metrics based on the ratio of up vs down bars inside the window, displayed directly in the zone overlays.
Drops ◈ markers where price interacts dynamically with the top or bottom band, highlighting reaction points.
ICT-Style Premium / Discount & Macro Zones
Two tiered structures:
Local Premium / Discount zones over a shorter SR window.
Macro Premium / Discount zones over a longer macro window.
Each zone:
Uses underlying directional volume to annotate accumulation vs distribution bias.
Provides Delta Volume Bias shading in the mid-band region, visually encoding whether local power flows are net-buying or net-selling.
Enables traders to quickly see whether current trade location is in a local/macro discount or premium context while still respecting volume profile.
Positioning Intelligence: PCD (Stocks)
Position Cost Distribution (PCD) – Stocks Only
Available for stock symbols on intraday up to daily timeframe (≤ 1D).
Uses:
TOTAL_SHARES_OUTSTANDING fundamentals,
Daily OHLCV snapshot, and
A bucketed distribution engine
to approximate cost basis distribution across price.
Outputs:
Horizontal “PCD bars” to the right of current price, density-scaled by estimated share concentration.
Color-coding by profitability relative to current price (profitable vs unprofitable positions).
Labels for:
Current price
Average cost
Profit ratio (share % below current price)
90% cost range
70% cost range
Range overlap as a measure of clustering / concentration.
Multi-Timeframe Trend: Two-Pole Gaussian Dashboard
Two-Pole Gaussian Filter (Line + Cloud)
Smooths a user-selected source (default: close) using a two-pole Gaussian filter with tunable alpha.
Plots:
A thin Gaussian trend line, and
A thick Gaussian “cloud” line with transparency, colored by slope vs past (offsetG).
Functions as a responsive trend backbone that is more sensitive than EMA 200 but less noisy than raw price.
Multi-Timeframe Gaussian Dashboard
Evaluates Gaussian trend direction across up to six timeframes (e.g., 1H / 2H / 4H / Daily / Weekly).
Renders a compact bottom-right table:
Header: symbol + overall bias arrow (up / down) based on average trend alignment.
Row of colored cells per timeframe (green for uptrend, magenta for downtrend) with human-readable TF labels (e.g., “60M”, “4H”, “1D”).
Gives an immediate read on whether intraday, swing, and higher-timeframe flows are aligned or fragmented.
Default Configuration & Usage Guidance
Default state after adding the script:
Enabled by default:
EMA 200 trend backbone
Nadaraya–Watson swing labels and curve
CCI bar coloring
RSI top/bottom arrows
Fat Bull / Fat Bear engine
Bull Snort & Pocket Pivots
S&R Power Channel
ICT Local + Macro zones
Two-pole Gaussian line + cloud + dashboard
PCD engine for stocks (auto-active where data is available)
Disabled by default (opt-in):
Custom MA suite (4x MAs, preset as EMA 8/8/89/89)
Hull MA overlay
How traders can use VB-MainLite in practice:
Use EMA 200 + Gaussian dashboard to define top-down directional bias and avoid trading directly against multi-TF trend.
Use Nadaraya swing labels, RSI exhaustion arrows, and CCI bar colors to time entries within that higher-timeframe bias.
Use Fat Bull / Fat Bear events as structured confirmation that both pattern and MA regime have flipped in the same direction.
Use Bull Snort, Pocket Pivots, and S&R / ICT zones to align execution with liquidity, volume, and location (premium vs discount).
On stocks, use PCD as a positioning map to understand trapped supply, support zones near crowded cost basis, and where profit-taking is likely.

Dark Vector ScalpingThe Dark Vector Scalping indicator is a high-frequency trend-following system designed specifically to capture rapid momentum shifts in the market. It combines a staircase-style breakout logic with volatility-adjusted trailing stops to define market direction.
While the underlying math is robust enough for various asset classes, this specific configuration is optimized for scalping operations on 1-minute and 5-minute timeframes. It aims to filter out the "noise" common in lower timeframes while reacting quickly to genuine breakouts.
Core Components
1. The Apex Engine (Staircase Logic) Unlike traditional moving averages that curve with price, this engine uses a "hard" breakout logic. It looks back at a specific number of bars (Sensitivity) to find the highest highs and lowest lows.
Bullish Flip: Occurs when the price closes below the calculated low of the previous trend.
Bearish Flip: Occurs when the price closes above the calculated high of the previous trend.
Trailing Stop: Once a trend is established, a trailing stop line is drawn. This line only moves in the direction of the trend (up for bullish, down for bearish) and never retraces, acting as a ratchet to lock in paper profits.
2. Volatility Normalization To prevent getting stopped out by random market noise (scam wicks), the indicator calculates the Average True Range (ATR). It multiplies this volatility metric by a user-defined deviation factor to determine exactly how far the stop line should be from the current price action.
3. The Hull Moving Average (HMA) Filter The script includes an optional 50-period Hull Moving Average. The HMA is known for being extremely fast and smooth, reducing lag compared to standard moving averages.
Visual Reference: You can plot the line to see the overall macro trend.
Hard Filter: You can enable a "Safety Filter" in the settings. If enabled, the system will only generate Buy signals if the price is above the HMA, and Sell signals if the price is below the HMA.
4. The Dashboard A data panel is located on the chart (customizable position) to provide instant numerical data without needing to calculate levels manually. It displays the current trend state, the exact price of the trailing stop, and the status of the HMA filter.
Settings & Configuration
Sensitivity (Lookback)
Default: 5
This is the primary setting for the Apex Engine. A setting of 5 is the "sweet spot" for 1-minute and 5-minute charts. It allows the system to react very quickly to sudden volume spikes. Increasing this number (e.g., to 10) will make the signals slower and more conservative.
Stop Deviation
Default: 3.0
This controls the "breathing room" for the trade. A value of 3.0 allows for standard volatility on minute charts without triggering a premature exit. Lowering this to 2.0 will result in tighter stops but more false signals.
HMA Filter
Use HMA as Filter? (Default: OFF):
When OFF, the system signals purely on price action breakouts (fastest).
When ON, the system waits for the price to align with the 50-period HMA before signaling (safest, but may delay entry).
How to Interpret Visuals
Candle Colors
Teal/Green: The market is in a Bullish regime.
Red/Pink: The market is in a Bearish regime.
The Line
The solid stepped line represents the hard invalidation point. If price closes beyond this line, the trend is considered over.
Diamond Signals
Light Green Diamond (Below Bar): Confirmed Buy Signal. A new bullish trend has started.
Light Red/Pink Diamond (Above Bar): Confirmed Sell Signal. A new bearish trend has started.
Trading Strategy Guide
The Scalp Entry
Ensure you are on a 1-minute or 5-minute timeframe.
Wait for a signal Diamond to close. Do not enter while the bar is still forming, as the signal may repaint (disappear) if the price retraces before the close.
Long Entry: Enter when a Green Diamond appears and the candle turns Teal.
Short Entry: Enter when a Red Diamond appears and the candle turns Red.
Risk Management
Stop Loss: Your invalidation level is the "Apex Stop" line. You can place your hard stop loss slightly beyond this line.
Take Profit: Because this is a trend-following system, it is often best to hold until the candle color changes, or to take profit at fixed Risk:Reward ratios (e.g., 1:1.5 or 1:2).
The HMA Nuance If you find the market is "choppy" (moving sideways), enable the "Use HMA as Filter" option in the settings. This will force the system to ignore signals that are counter-trend to the longer-term momentum.
Disclaimer
The information provided by the "Dark Vector Scalping" indicator and this accompanying guide is for educational and informational purposes only. It does not constitute financial, investment, or trading advice. Trading cryptocurrencies, stocks, and forex involves a high level of risk and may not be suitable for all investors. You could lose some or all of your initial investment.

Dark VectorThe Dark Vector is a professional-grade trend-following system designed to solve the two most common causes of trading losses: over-trading during chop and exiting trends too early.
Unlike standard indicators that continuously recalculate based on every price tick, this system operates on a strict "State Machine" logic. This means it tracks the current market phase and refuses to issue conflicting signals. If the system is Long, it mathematically cannot issue another Long signal until the previous trend has concluded.
The system relies on three core engines:
1. The Trend Architecture (Modified SuperTrend) The backbone of the system is an ATR-based trailing stop mechanism. It creates a dynamic trend line that adjusts to volatility. When volatility expands, the line widens to prevent premature stop-outs during market noise. When volatility contracts, the line tightens to protect profits.
2. The Noise Gate (Choppiness Index) This is the system's safety filter. It measures the fractal efficiency of the market—essentially determining if price is moving in a clear direction or moving sideways. When the market enters a consolidation phase (sideways chop), the Noise Gate activates, turning the candles gray and physically blocking all new entry signals. This prevents the user from entering trades in low-probability environments.
3. The Singularity State Machine This internal logic enforces trading discipline. It treats the trend as a binary state (Bullish or Bearish). It forces an alternating signal pattern, ensuring that you are only alerted to the specific moment a major trend reversal occurs, rather than being bombarded with repetitive signals during a long run.
Best Way to Use This System
To maximize profitability and minimize false positives, it is recommended to use the "Regime & Alignment" methodology outlined below.
1. The Traffic Light Rule
Before placing any trade, observe the color of the candlesticks on the chart:
Green Candles: The market is in a confirmed Bullish Impulse. You should only look for Long entries or hold existing positions. Shorting is statistically dangerous here.
Red Candles: The market is in a confirmed Bearish Impulse. You should only look for Short entries or hold cash. Buying the dip here is high-risk.
Gray Candles: The market is in a Chop/Squeeze regime. The Noise Gate is active. Do not open new positions. This indicates indecision, and the market is likely to destroy option premiums or stop out tight leverage. Wait for the candles to return to Green or Red before acting.
2. The Entry Trigger
Enter a trade only when a text label (LONG or SHORT) appears.
Long Signal: Occurs when price closes above the Trend Line AND the market is not in a Chop zone.
Short Signal: Occurs when price closes below the Trend Line AND the market is not in a Chop zone.
3. The Exit Strategy
There are two ways to manage the trade once active:
The Trend Follower (Conservative): Hold the position until the Trend Line flips color. This captures the maximum duration of the move but may give back some profit at the very end.
The Stop Loss (Active): The Trend Line (the white value in your dashboard) acts as your Trailing Stop. If a candle closes beyond this line, the trend is technically invalidated. You should exit immediately.
4. Multi-Timeframe Alignment (The Golden Rule)
The highest win rates are achieved when your trading timeframe aligns with the higher-order trend.
Step 1: Check the 4-Hour chart. Is the Trend Line Green?
Step 2: Switch to the 15-Minute chart.
Step 3: Only take the LONG signals on the 15-Minute chart. Ignore all Short signals.
Reasoning: Counter-trend trades often fail. By trading only in the direction of the higher timeframe, you are swimming with the current, not against it.
Recommended Settings by Style
Swing Trading (Daily/4H): Keep the Trend Factor at 4.0. This ignores daily noise and keeps you in the trade for weeks or months.
Day Trading (1H/15m): Lower the Trend Factor to 3.0. This makes the system more reactive to intraday reversals.
Scalping (5m): Lower the Trend Factor to 2.0 and the ATR Length to 7. This is aggressive and requires strict adherence to the Stop Loss.
Disclaimer
This indicator is for educational and informational purposes only. It does not constitute financial advice, investment advice, or a recommendation to buy or sell any asset. Trading cryptocurrencies, stocks, and futures involves a high degree of risk and the potential for significant financial loss. The user assumes all responsibility for their trading decisions. Past performance of any system or indicator is not indicative of future results. Always practice risk management and never trade with money you cannot afford to lose.

Super-AO with Risk Management Alerts Template - 11-29-25Super-AO with Risk Management: ALERTS & AUTOMATION Edition
Signal Lynx | Free Scripts supporting Automation for the Night-Shift Nation 🌙
1. Overview
This is the Indicator / Alerts companion to the Super-AO Strategy.
While the Strategy version is built for backtesting (verifying profitability and checking historical performance), this Indicator version is built for Live Execution.
We understand the frustration of finding a great strategy, only to realize you can't easily hook it up to your trading bot. This script solves that. It contains the exact same "Super-AO" logic and "Risk Management Engine" as the strategy version, but it is optimized to send signals to automation platforms like Signal Lynx, 3Commas, or any Webhook listener.
2. Quick Action Guide (TL;DR)
Purpose: Live Signal Generation & Automation.
Workflow:
Use the Strategy Version to find profitable settings.
Copy those settings into this Indicator Version.
Set a TradingView Alert using the "Any Alert() function call" condition.
Best Timeframe: 4 Hours (H4) and above.
Compatibility: Works with any webhook-based automation service.
3. Why Two Scripts?
Pine Script operates in two distinct modes:
Strategy Mode: Calculates equity, drawdowns, and simulates orders. Great for research, but sometimes complex to automate.
Indicator Mode: Plots visual data on the chart. This is the preferred method for setting up robust alerts because it is lighter weight and plots specific values that automation services can read easily.
The Golden Rule: Always backtest on the Strategy, but trade on the Indicator. This ensures that what you see in your history matches what you execute in real-time.
4. How to Automate This Script
This script uses a "Visual Spike" method to trigger alerts. Instead of drawing equity curves, it plots numerical values at the bottom of your chart when a trade event occurs.
The Signal Map:
Blue Spike (2 / -2): Entry Signal (Long / Short).
Yellow Spike (1 / -1): Risk Management Close (Stop Loss / Trend Reversal).
Green Spikes (1, 2, 3): Take Profit Levels 1, 2, and 3.
Setup Instructions:
Add this indicator to your chart.
Open your TradingView "Alerts" tab.
Create a new Alert.
Condition: Select SAO - RM Alerts Template.
Trigger: Select Any Alert() function call.
Message: Paste your JSON webhook message (provided by your bot service).
5. The Logic Under the Hood
Just like the Strategy version, this indicator utilizes:
SuperTrend + Awesome Oscillator: High-probability swing trading logic.
Non-Repainting Engine: Calculates signals based on confirmed candle closes to ensure the alert you get matches the chart reality.
Advanced Adaptive Trailing Stop (AATS): Internally calculates volatility to determine when to send a "Close" signal.
6. About Signal Lynx
Automation for the Night-Shift Nation 🌙
We are providing this code open source to help traders bridge the gap between manual backtesting and live automation. This code has been in action since 2022.
If you are looking to automate your strategies, please take a look at Signal Lynx in your search.
License: Mozilla Public License 2.0 (Open Source). If you make beneficial modifications, please release them back to the community!

OG INDICATORTrade Legacy All-in-One Institutional Indicator
Unlock institutional-grade trading with this comprehensive Pine Script indicator. Seamlessly integrates multiple EMAs, SMAs, VWAPs, and ORB displays into one effortless panel—mimicking pro standards for quick, intuitive analysis.
Per Trade Legacy (Jackie): "This is the only indicator you need for profitability." Pair it with your strategy for powerful confluence, boosting edge and profits.
Simple setup, zero clutter. Premium access via invite-only.
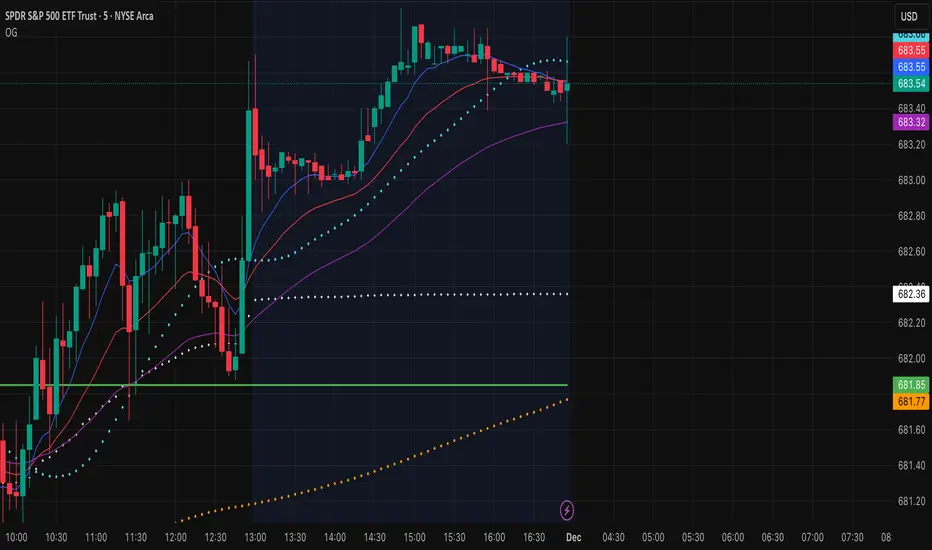
Buy Sell SignalBuy Sell Signal - EMA Crossover with Dynamic Risk Management
OVERVIEW
This indicator combines a dual EMA crossover system with ATR-based dynamic stop loss and take profit levels to provide complete trade management signals. Unlike basic EMA crossover scripts, this tool automatically calculates and displays entry points, stop losses, and take profit targets based on market volatility, offering traders a complete trading framework in a single indicator.
HOW IT WORKS
The indicator uses three core components working together:
Trend Detection: A fast EMA (default 5) and slow EMA (default 13) identify trend direction. When the fast EMA crosses above the slow EMA, it signals bullish momentum; when it crosses below, it signals bearish momentum.
Entry Validation: Optional candle confirmation filter ensures the crossover is accompanied by a bullish/bearish candle close, reducing false signals in choppy markets.
Risk Management: Uses ATR (Average True Range, default 14 periods) to calculate:
Stop Loss: Positioned below/above recent swing low/high minus ATR multiplier (default 0.5x)
Take Profit: Calculated using customizable risk-reward ratio (default 3:1)
KEY FEATURES
✅ Automatic Position Tracking: Monitors active trades and displays current position status (LONG/SHORT/No position)
✅ Visual Trade Management: Shows entry price (white dashed line), stop loss (red line), and take profit (green line) in real-time
✅ Trade Outcome Signals: Displays clear markers when TP is hit (🎯), SL is triggered (❌), or position is invalidated by opposite signal
✅ Information Dashboard: Live table showing entry price, SL, TP, and actual R:R ratio
✅ Smart Position Invalidation: Automatically closes and invalidates previous positions when opposite trend signal appears
✅ Customizable Alerts: Five alert conditions for BUY/SELL signals, TP hits, SL triggers, and invalidations
INPUTS
Fast EMA Length (default 5): Responsive to recent price action
Slow EMA Length (default 13): Defines broader trend direction
ATR Period (default 14): Volatility measurement period
SL Multiplier (default 0.5): Distance from swing point to stop loss
Risk:Reward Ratio (default 3.0): Target profit relative to risk
Candle Confirmation (default ON): Requires bullish/bearish candle on crossover
HOW TO USE
Apply the indicator to your chart (works on all timeframes)
Adjust EMA periods based on your trading style (shorter for scalping, longer for swing trading)
Set your preferred risk-reward ratio
Enable alerts for automated notifications
When a BUY/SELL signal appears, the indicator automatically calculates and displays your complete trade plan
Monitor the information table for live position updates
Exit when TP is reached or SL is triggered
TRADING METHODOLOGY
This script implements a momentum-following strategy based on exponential moving average crossovers, enhanced with volatility-adjusted risk parameters. The ATR-based stop loss adapts to market conditions—wider stops in volatile markets, tighter stops in calm markets. The position invalidation feature prevents traders from holding outdated positions when market sentiment shifts.
BEST PRACTICES
Use on trending markets for best results
Higher timeframes (4H, Daily) produce fewer but more reliable signals.
For scalpe use 5 and 15 minutes(Risk).
Consider market context and fundamental factors alongside signals
Adjust ATR multiplier based on asset volatility
Test different EMA combinations for your preferred instruments
ORIGINALITY
While EMA crossover systems are common, this script's value lies in its complete integration of entry logic, dynamic risk management, position tracking, and automated invalidation—features typically requiring multiple separate indicators. The ATR-based stop loss calculation and automatic R:R visualization provide practical trade execution guidance that basic crossover indicators lack.
Important Notes:
This indicator does not guarantee profitable trades
Always practice proper risk management
Backtest settings on historical data before live trading
Past performance does not indicate future results

Journal Diario Manual [KEKG]📊 Daily Trading Journal – Manual Profit & Risk Tracker
This indicator is a clean, fully customizable daily trading journal designed to help traders manually track their performance directly on the chart.
✅ Features:
• Manual input for:
• Take Profits (TP)
• Stop Losses (SL)
• Total TP Pips
• Total SL Pips
• Automatic Profit (Pips) calculation:
• Shows + in green for positive results
• Shows − in red for negative results
• Customizable reset system:
• Reset by Day
• Reset by Week
• Manual reset
• Optional reset at a specific time (AM/PM)
• Each reset method can be turned ON or OFF
• Fully adjustable colors:
• Default TP color: #66BB6A
• Default SL color: #F23645
• Editable profit colors and panel background
• Movable panel position (any screen corner)
• Transparent background by default
• Clean, left-aligned professional layout
🎯 Purpose:
This tool is built for discipline, consistency, and performance tracking, helping traders stay aware of:
• Daily results
• Total risk
• Overall profitability
Perfect for Forex, Indices, Commodities, and Crypto traders who want a simple but powerful on-chart journal without automation or broker connection.

200 Week MA Extensions (Crypto Currently Strategy)Bitcoin 200 Week MA Extensions
The 200-week moving average has never been breached in Bitcoin's history, making it one of the most reliable indicators for identifying absolute market bottoms. This indicator plots the 200 Week MA along with percentage extensions above it to help identify potential cycle tops and key resistance levels during bull markets.
What is the 200 Week MA?
The 200-week simple moving average is the average closing price of Bitcoin over the past 200 weeks (approximately 3.8 years). It's a ultra-long-term trend indicator that:
Has never been broken to the downside in Bitcoin's entire history
Acts as the ultimate floor for Bitcoin price during bear markets
Rises steadily over time, reflecting Bitcoin's long-term growth trajectory
Moves slowly, making it a stable reference point for market cycles
Key Components:
200 Week MA - Blue Line (Base Level)
The foundation line that has historically marked absolute bottoms
Currently around $62,000 (and rising ~$500-800 per week)
Touching this level has historically represented generational buying opportunities
Last tested during the COVID crash (March 2020) and 2022 bear market
+50% Extension - Green Line (1.5x the 200 Week MA)
First major resistance zone above the base
Often acts as support during healthy bull market corrections
Historically a comfortable zone for accumulation in early bull markets
+100% Extension - Yellow Line (2.0x the 200 Week MA)
Double the 200 Week MA value
Represents a well-developed bull market
Often tested multiple times during mid-cycle consolidations
Can act as strong resistance when first approached
+150% Extension - Orange Line (2.5x the 200 Week MA)
Advanced bull market territory
Historically marks the acceleration phase of bull runs
Breaking above this level often signals euphoric market conditions approaching
+200% Extension - Red Line (3.0x the 200 Week MA)
Triple the 200 Week MA value
Extreme overextension zone
Historically near or beyond previous cycle tops
Suggests extreme caution and profit-taking considerations
Historical Context:
2020-2021 Bull Market:
March 2020: Price touched the 200 Week MA (~$5,000) - absolute bottom
Throughout 2020: Price traded between +50% and +100% extensions
Late 2020 - Early 2021: Price broke above +100%, accelerated to +150%
April 2021 & November 2021: Price reached +200% extension area, marking local/cycle tops
2022 Bear Market:
Price fell from +200% extension back toward the 200 Week MA
June 2022: Price came within 10% of the 200 Week MA ($18,000)
Bounce from near the 200 Week MA marked the bear market bottom
2023-2024 Recovery:
Price recovered from near 200 Week MA back through the extension levels
Each extension level acted as resistance, then support as bull market developed
Current position relative to extensions helps gauge cycle maturity
How to Use This Indicator:
For Long-Term Accumulation:
At 200 Week MA: Maximum conviction buying zone - historically has never failed
+0% to +50%: Excellent accumulation zone, low risk relative to reward
+50% to +100%: Good accumulation zone during bull market dips
Above +100%: Consider reducing accumulation, focus on holding or taking profits
For Profit Taking:
Approaching +100%: Consider taking initial profits (10-20% of position)
+100% to +150%: Take incremental profits as price advances
+150% to +200%: Increase profit-taking pace significantly
Above +200%: Maximum caution - historically unsustainable levels
For Risk Management:
Distance from 200 Week MA indicates market risk level
Further above = higher risk, more extended, closer to top
Closer to = lower risk, better value, closer to bottom
Use extensions as profit-taking targets in bull markets
Use extensions as re-entry targets during corrections
For Cycle Timing:
Bear Market: Price converges toward 200 Week MA
Early Bull: Price in +0% to +50% range, building base
Mid Bull: Price in +50% to +100% range, healthy growth
Late Bull: Price in +100% to +150% range, acceleration
Euphoric Top: Price at +150% to +200%+, extreme extension
Key Insights:
The 200 Week MA as Ultimate Support:
Bitcoin has touched or approached this level during every major bear market
It rises consistently (~$30,000 per year currently), creating a rising floor
Breaking below would be unprecedented and signal a fundamental market structure change
Provides enormous psychological and technical support
Extension Levels as Resistance/Support:
Bull markets often stall at each extension level before breaking through
Once broken, extensions often flip from resistance to support
Rejections from higher extensions can signal local or cycle tops
Corrections back to lower extensions offer re-entry opportunities
Diminishing Returns:
Each cycle's top has formed at progressively lower extension multiples
2013: ~10x the then-200WMA
2017: ~5x the then-200WMA
2021: ~3x the then-200WMA
Suggests future tops may not reach +200% extension (market maturation)
Best Practices:
Do:
Use the 200 Week MA as your ultimate risk-off level for long-term holdings
Scale into positions as price approaches the 200 Week MA
Take profits incrementally as price rises through extensions
View corrections back to lower extensions as opportunities
Combine with other on-chain metrics (MVRV, Realized Price) for confirmation
Don't:
Expect the 200 Week MA to provide perfect entry timing (you might be early)
Assume price will reach +200% extension every cycle
Sell all holdings at first extension level during bull markets
Ignore price action and volume when making decisions
Panic if price approaches the 200 Week MA (historically the best time to buy)
Why This Indicator Works:
The 200 Week MA represents nearly 4 years of price data, which:
Encompasses approximately one full Bitcoin halving cycle
Smooths out all short and medium-term volatility
Reflects Bitcoin's true long-term adoption and growth trend
Provides a slow-moving, stable reference that doesn't whipsaw
The extension levels work because:
They create objective profit-taking targets based on historical overextension
They account for the rising base (200 Week MA) over time
They've proven reliable across multiple market cycles
They help remove emotion from buy/sell decisions
Technical Notes:
Calculations performed on weekly timeframe data for consistency
The indicator displays correctly on any chart timeframe (Daily, 4H, etc.)
Uses lookahead_on to prevent repainting and show consistent historical values
All extension levels update automatically as the 200 Week MA rises
Best viewed on logarithmic scale for full historical perspective
Important Reminders:
Past performance does not guarantee future results - while the 200 Week MA has never been breached, future market conditions could differ
Market maturation - as Bitcoin matures, cycle dynamics may change
Black swan events - unexpected macro events could temporarily break historical patterns
Not financial advice - this is an educational tool, always do your own research
Recommended Usage:
Best Timeframes: Daily, Weekly, Monthly charts
Pair With: MVRV Ratio, Realized Price, Stock-to-Flow, Fear & Greed Index
Update Frequency: Weekly (the base 200 Week MA only changes weekly)
Chart Type: Logarithmic scale recommended for full historical view
Strategy Example:
Buy aggressively when price is within 20% of 200 Week MA
Hold and accumulate between 200WMA and +50% extension
Begin scaling out profits at +100% extension (20% of position)
Scale out more at +150% extension (40% of position)
Significant profit-taking at +200% extension (remaining position)
Wait for next cycle and repeat
This indicator provides a simple, objective, and historically reliable framework for navigating Bitcoin's market cycles. By respecting the 200 Week MA as the ultimate floor and using the extensions as profit-taking guides, investors can remove emotion and develop disciplined strategies for long-term success.

Float Rotation TrackerFloat Rotation Tracker - Quick Reference Guide
What is Float Rotation?
Float Rotation = Cumulative Daily Volume ÷ Float
Example:
Float = 5,000,000 shares
Day Volume = 7,500,000 shares
Rotation = 7.5M ÷ 5M = 1.5x (150%)
When rotation hits 1x (100%), every available share has theoretically changed hands at least once during the trading day.
Why It Matters
RotationMeaningImplication0.5x50% of float tradedInterest building1.0x 🔥Full rotationExtreme interest confirmed2.0x 🔥🔥Double rotationVery high volatility3.0x 🔥🔥🔥Triple rotationRare - maximum volatility
Key insight: High rotation on a low-float stock = explosive potential
Float Classification
Float SizeClassificationRotation Impact≤ 2M🔥 MICROExtremely volatile, fast rotation≤ 5M🔥 VERY LOWExcellent momentum potential≤ 10MLOWGood for rotation plays> 10MNORMALNeeds massive volume to rotate
Rule of thumb: Focus on stocks with float under 10M for meaningful rotation signals.
Reading the Indicator
Rotation Line (Yellow)
Shows current rotation level
Rises throughout the day as volume accumulates
Crosses horizontal level lines at milestones
Level Lines
LineColorMeaning0.5Gray dotted50% rotation1.0Orange solidFull rotation2.0Red solidDouble rotation3.0Fuchsia solidTriple rotation
Volume Bars (Bottom)
ColorMeaningGrayBelow average volumeBlueNormal volume (1-2x avg)GreenHigh volume (2-5x avg)LimeExtreme volume (5x+ avg)
Milestone Markers
Circles appear when rotation crosses key levels
Labels show "50%", "1x", "2x", "3x🔥"
Background Color
Changes as rotation increases
Darker = higher rotation level
Info Table Explained
FieldDescriptionFloatShare count + classification (MICRO/LOW/NORMAL)SourceAuto ✓ = TradingView data / Manual = user enteredRotationCurrent rotation with emoji indicatorRotation %Same as rotation × 100Day VolumeCumulative volume todayTo XxVolume needed to reach next milestoneBar RVolCurrent bar's relative volumeMilestonesWhich levels have been hit todayPer RotationShares equal to one full rotationEst. TimeBars until next milestone (at current pace)
Trading with Float Rotation
Entry Signals
Early Entry (Higher Risk, Higher Reward)
Rotation approaching 0.5x
Strong price action (bull flag, breakout)
Rising relative volume bars
Confirmation Entry (Lower Risk)
Rotation at or above 1x
Price holding above VWAP
Continuous green/lime volume bars
Late Entry (Highest Risk)
Rotation above 2x
Only enter on clear pullback pattern
Tight stop required
Exit Signals
Warning Signs:
Rotation very high (2x+) with declining volume bars
Reversal candle after milestone
Price breaking below key support
Volume bars turning gray/blue after being green/lime
Take Profits:
Partial profit at each rotation milestone
Trail stop as rotation increases
Full exit on reversal pattern after 2x+ rotation
Best Setups
Ideal Float Rotation Play
✓ Float under 10M (preferably under 5M)
✓ Stock up 5%+ on the day
✓ News catalyst driving interest
✓ Rotation approaching or exceeding 1x
✓ Price above VWAP
✓ Volume bars green or lime
✓ Clear chart pattern (bull flag, flat top)
Red Flags to Avoid
✗ Float over 50M (hard to rotate meaningfully)
✗ Rotation high but price declining
✗ Volume bars turning gray after spike
✗ No clear catalyst
✗ Price below VWAP with high rotation
✗ Late in day (3pm+) after 2x rotation
Float Data Sources
If auto-detect doesn't work, get float from:
SourceHow to FindFinvizfinviz.com → ticker → "Shs Float"Yahoo FinanceFinance.yahoo.com → Statistics → "Float"MarketWatchMarketwatch.com → ticker → ProfileYour BrokerUsually in stock details/fundamentals
Note: Float can change due to offerings, buybacks, lockup expirations. Check recent data.
Settings Guide
Conservative Settings
Alert Level 1: 0.75 (75%)
Alert Level 2: 1.0 (100%)
Alert Level 3: 2.0 (200%)
Alert Level 4: 3.0 (300%)
High Vol Multiplier: 2.0
Extreme Vol Multiplier: 5.0
Aggressive Settings
Alert Level 1: 0.3 (30%)
Alert Level 2: 0.5 (50%)
Alert Level 3: 1.0 (100%)
Alert Level 4: 2.0 (200%)
High Vol Multiplier: 1.5
Extreme Vol Multiplier: 3.0
Alert Setup
Recommended Alerts
100% Rotation (1x) - Primary signal
Most important milestone
Confirms extreme interest
High Rotation + Extreme Volume
Combined condition
Very high probability signal
How to Set
Right-click chart → Add Alert
Condition: Float Rotation Tracker
Select desired milestone
Set notification (popup/email/phone)
Set expiration
Common Questions
Q: Why is my float showing "Manual (no data)"?
A: TradingView doesn't have float data for this stock. Enter the float manually in settings after looking it up on Finviz or Yahoo Finance.
Q: The rotation seems too high/low - is the float wrong?
A: Possibly. Cross-check float on Finviz. Recent offerings or share structure changes may not be reflected in TradingView's data.
Q: What if float rotates early in the day?
A: Early 1x rotation (within first hour) is very bullish - indicates massive interest. Watch for continuation patterns.
Q: High rotation but price is dropping?
A: This is distribution - large holders are selling into demand. High rotation doesn't guarantee price direction, just volatility.
Q: Can I use this for swing trading?
A: The indicator resets daily, so it's designed for intraday use. You could note multi-day rotation patterns manually.
Quick Decision Matrix
RotationPrice ActionVolumeDecision<0.5xStrong upHighWatch, early stage0.5-1xConsolidatingSteadyPrepare entry1x+Breaking outIncreasingEntry on pattern1x+DroppingHighAvoid - distribution2x+Strong upExtremePartial profit, trail stop2x+Reversal candleDecliningExit or avoid
Workflow Integration
MORNING ROUTINE:
1. Scan for gappers (5%+, high volume)
2. Check float on each candidate
3. Apply Float Rotation Tracker
4. Prioritize lowest float with building rotation
DURING SESSION:
5. Watch rotation levels on active trades
6. Enter on patterns when rotation confirms (0.5-1x)
7. Scale out as rotation increases
8. Exit or trail after 2x rotation
END OF DAY:
9. Note which stocks hit 2x+ rotation
10. Review rotation vs price action
11. Learn patterns for future trades
Combining with Other Indicators
IndicatorHow to Use Together5 PillarsScreen for low-float stocks firstGap & GoCheck rotation on gappersBull FlagEnter bull flags with 1x+ rotationVWAPOnly trade rotation plays above VWAPRSIWatch for divergence at high rotation
Key Takeaways
Float size matters - Lower float = faster rotation = more volatility
1x is the key level - Full rotation confirms extreme interest
Volume quality matters - Green/lime bars better than gray
Combine with price action - Rotation confirms, patterns trigger
Know when you're late - 2x+ rotation is late stage
Check your float data - Wrong float = wrong rotation calculation
Happy Trading! 🔥

Universal Scalper Indicator [Crypto/Forex/Gold]Universal Scalper Pro is an all-in-one scalping system designed for the 15-Minute Timeframe. It automates the analysis of trend, volatility, and risk management into a single, high-contrast dashboard.
Unlike standard crossover indicators, this system filters out low-volatility "noise" using a built-in ADX engine and automatically calculates dynamic Stop Loss and Take Profit levels based on market volatility (ATR).
It is engineered to work universally on:
Crypto (BTC, ETH, SOL, Altcoins)
Commodities (Gold, Silver, Oil)
Forex (Major & Minor Pairs)
Stocks (High volume tech stocks like NVDA, TSLA)
📈 How It Works (The Strategy)
1. The Trend Engine (9/21 EMA) The core logic utilizes a Fast (9) and Slow (21) Exponential Moving Average crossover.
Bullish Signal: The 9 EMA crosses above the 21 EMA.
Bearish Signal: The 9 EMA crosses below the 21 EMA. This specific combination is chosen for its responsiveness to 15-minute intraday trends.
2. The Noise Filter (ADX > 15) To prevent "whipsaws" (fake signals during sideways markets), the script includes a Volatility Filter based on the Average Directional Index (ADX).
Signals are rejected if the ADX is below 15.
This ensures you only receive alerts when there is sufficient momentum to sustain a move.
3. Dynamic Risk Management (ATR) The script uses the Average True Range (ATR) to calculate Stop Loss and Take Profit levels that adapt to the specific asset's volatility.
Stop Loss: Placed at 1.5x ATR from the entry. (Tight enough to preserve capital, wide enough to survive standard market noise).
Take Profit: Placed at 2.0x ATR from the entry. (Provides a healthy 1:1.3 Risk/Reward ratio).
🚀 Key Features
Universal Dashboard: A bottom-right panel displays the live Trend Status, Entry Price, Stop Loss, and Take Profit. It automatically formats decimals for any asset (e.g., 2 decimals for Gold, 5 for Forex, 8 for Crypto).
"Sticky" Memory: The dashboard retains the prices of the last valid signal, allowing you to manage your trade even after the signal candle closes.
Trend Cloud: A visual Green/Red zone between the EMAs helps you instantly identify the market bias.
Unified Alerts: A single alert setup ("Any alert() function call") sends the Asset Name, Entry, SL, and TP directly to your phone.
🛠️ How to Use
Timeframe: Set your chart to 15 Minutes (15m).
Wait for the Signal: Look for the "BUY" (Green) or "SELL" (Red) label on the chart.
Check the Dashboard: Ensure the "STATUS" is BULLISH (for buys) or BEARISH (for sells). If the status says "WAIT", do not trade.
Execute: Enter the trade using the exact Stop Loss and Take Profit levels shown on the dashboard.
⚠️ Risk Disclaimer
Trading financial markets involves high risk and may not be suitable for all investors. This indicator is a technical analysis tool and does not constitute financial advice. Past performance is not indicative of future results. Always practice with a demo account before trading real capital.
