Historical Volatility RatioThis script is a way to plot the ratio of short-term and long-term volatility. If the ratio is below 50% for a short/long term HV, we know that the market has the potential to make a large move as the volatility reverts back to its mean.
Credit to Dave Landry for this idea. Seems to be a nice predictor after looking at many breakouts after a pullback.
Defaults to 6-period and 100-period HV.
在脚本中搜索"pullback"

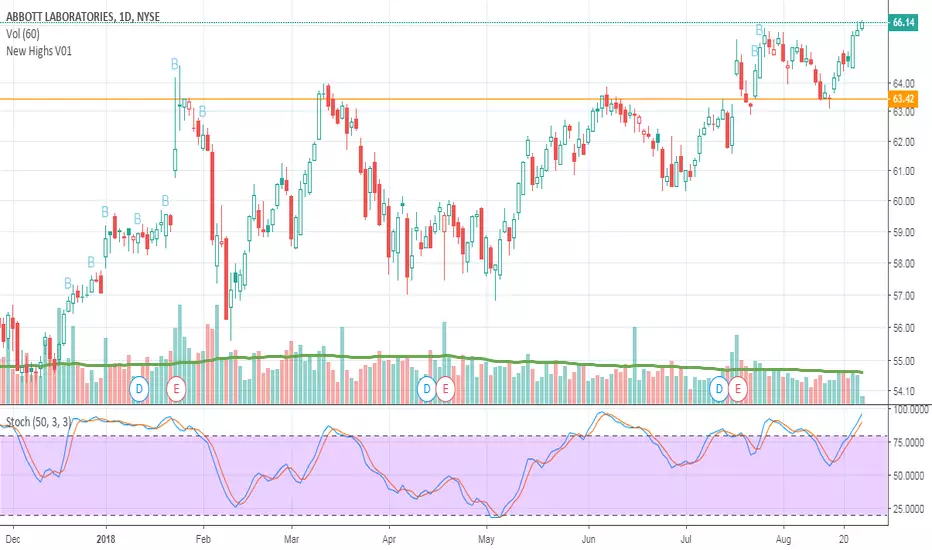
New Highs V01Script is meant for finding stocks in new uptrends and has had a pullback. Looking for support confirmation before going long. My first script.
SWING PointJust the movement of price and its swing: after a bottom or a top if there is a inversion of trend the price has to break some area. This script show the possibles zone of pullback. The background bars color suggest possible point of entry, but are still not accurate has they should be, so look at the break of res/sup by yourself.

Price Action Doji Harami v0.2 by JustUncleLThis is an updated and final version of this indicator. This version distinguishes between the true Harami and the other Doji candlestick patterns as used with the Heikin Ashi candle charts. These candle patterns indicate a potential trend reversal or pullback.
The patterns identified are:
- Bearish Harami (Red Highlight above Bar):
One to three (default 3) large body Bull (green) candles followed by a small (red)
or no body candle (less than 0.5pip) with wicks top and bottom that are at least 60% of candle.
- Bullish Harami (Green Highlight below Bar):
One to three (default 3) large body Bear (red) candles followed by a small (green)
or no body candle (less than 0.5pip) with wicks top and bottom that are at least 60% of candle.
- Bearish Doji (Fuchsia Highlight above Bar):
One to three (default 3) large body Bull (green) candles followed by a small (green)
with wicks top and bottom that are at least 60% of candle.
- Bullish Doji (Aqua Highlight below Bar):
One to three (default 3) large body Bear (red) candles followed by a small (red)
with wicks top and bottom that are at least 60% of candle.
You can optionally specify how large the candles prior to Harami/Doji are in pips, default is 0 pip.
If you set this to zero then it will have no candle size consideration. You can also specify how many look back candles (1-3) are used in Harami/Doji calculations (default 3).
Included option to perform Calculations purely on Heikin Ashi candles, this helps when you want to see the HA Doji/Harami bars with the normal candle stick chart.
Also can optionally set an alert condition for when Harami/Doji found, this also displays a circle on the bottom of the screen when alert is triggered.

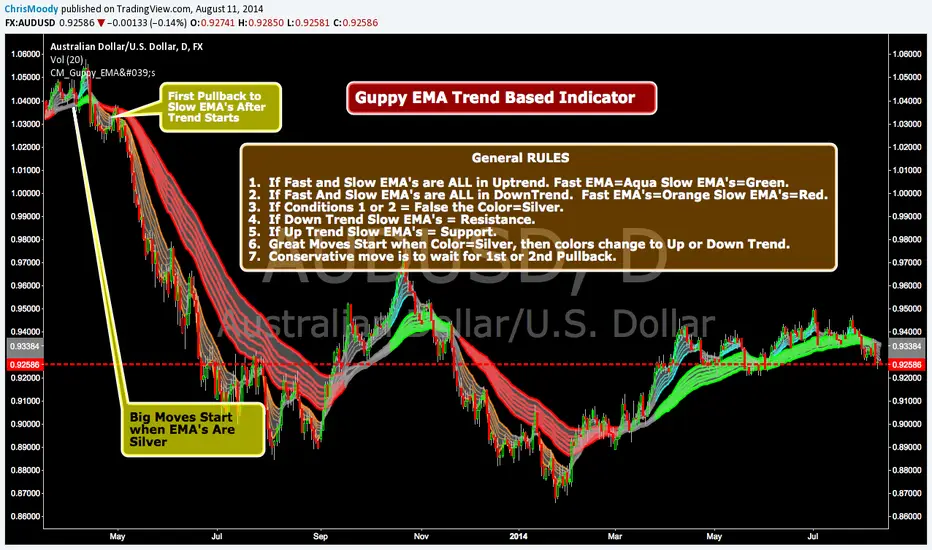
CM_Guppy_EMAGuppy EMA Trend Based Indicator Requested by 2use
General RULES
1. If Fast and Slow EMA's are ALL in Uptrend. Fast EMA=Aqua Slow EMA's=Green.
2. If Fast And Slow EMA's are ALL in DownTrend. Fast EMA's=Orange Slow EMA's=Red.
3. If Conditions 1 or 2 = False the Color=Silver.
4. If Down Trend Slow EMA's = Resistance.
5. If Up Trend Slow EMA's = Support.
6. Great Moves Start when Color=Silver, then colors change to Up or Down Trend.
7. Conservative move is to wait for 1st or 2nd Pullback.
MINI Lead Osc v2_ CCI_ Impulse_ REG🔹 MINI Lead Osc v2 — Momentum, Impulse & Early Reversal Tool
MINI Lead Osc v2 is a leading momentum oscillator designed to detect early shifts in market strength, impulse exhaustion, and potential reversals before they become obvious on price.
This indicator is part of the ICT Suite ecosystem and is engineered to work in confluence with:
Regression SuperTrend (WAIT)
Liquidity Oscillator (Structure & Bias)
Used together, they form a complete top-down trading framework.
⚙️ Core Logic
MINI Lead Osc v2 blends multiple engines into a single clean signal:
• CCI + RSI slope momentum
• ATR volatility shift
• Pivot-based divergence detection
• Adaptive Sensitivity+ engine
• Regression channel (linreg + RMSE bands)
The output is a normalized lead line that reacts before classic lagging indicators.
🚀 What This Indicator Is Best For
✔ Early trend continuation signals
✔ Detecting impulse starts, weakness, and distribution
✔ Filtering noise during ranges
✔ Momentum confirmation for pullback entries
✔ Spotting divergence without repainting
This is not a standalone “buy/sell spam” indicator — it is a decision-quality tool.
🔁 How to Use (Recommended Setup)
For best results, use MINI Lead Osc v2 together with:
1️⃣ Regression SuperTrend (WAIT)
→ Defines dominant trend & market regime
→ Filters counter-trend signals
2️⃣ Liquidity Oscillator (Structure)
→ Confirms break → pullback → continuation logic
→ Adds HTF bias & session context
3️⃣ MINI Lead Osc v2 (this script)
→ Times entries
→ Detects early momentum shifts
→ Confirms impulse quality
📌 Trade only when all three align.
🧠 Important Notes
• Signals are non-repainting (bar-close confirmed)
• Designed for discretionary trading, not automation
• Works best on 5m – 15m – 1h timeframes
• Crypto, Futures, and FX friendly
⚠️ Disclaimer
This indicator is for educational and analytical purposes only.
It does not constitute financial advice.
Always manage risk and confirm with price action.

My Swift-like Algo ALIMOJANIDSwift Algo Chart is a trend-following trading indicator designed to provide clear bias, precise entries, and visual risk management.
It combines EMA trend direction, pullback-based signals, market structure (HH/HL/LH/LL), and ATR-based Stop Loss & Take Profit levels to help traders make disciplined decisions.
🔑 Key Features
Trend Regime Detection
Identifies LONG, SHORT, or NO TRADE conditions using Fast & Slow EMAs.
Pullback Entry Signals
Signals appear only in the direction of the active trend, with optional RSI confirmation.
ATR-Based Risk Levels
Automatically plots SL, TP1, and TP2, including exact price values on the chart.
Preview Levels
Shows projected SL/TP levels when a trend is active, even before an entry.
Market Structure Visualization
Marks HH / HL / LH / LL, draws structure lines, and highlights BOS and CHOCH.
Clean & Non-Repainting Logic
Uses confirmed pivots and closed candles for stability.
Strategy-Compatible
Can be used for discretionary trading or full strategy backtesting.
🧠 Best Used For
Crypto, Forex, Indices
15m to 4H timeframes
Traders who want structure + trend + risk clarity in one tool

My Swift-like Algo J.ALIMOJANIDSwift Algo Chart — Trend, Structure & ATR Risk
Swift Algo Chart is a trend-following trading indicator designed to provide clear bias, precise entries, and visual risk management.
It combines EMA trend direction, pullback-based signals, market structure (HH/HL/LH/LL), and ATR-based Stop Loss & Take Profit levels to help traders make disciplined decisions.
🔑 Key Features
Trend Regime Detection
Identifies LONG, SHORT, or NO TRADE conditions using Fast & Slow EMAs.
Pullback Entry Signals
Signals appear only in the direction of the active trend, with optional RSI confirmation.
ATR-Based Risk Levels
Automatically plots SL, TP1, and TP2, including exact price values on the chart.
Preview Levels
Shows projected SL/TP levels when a trend is active, even before an entry.
Market Structure Visualization
Marks HH / HL / LH / LL, draws structure lines, and highlights BOS and CHOCH.
Clean & Non-Repainting Logic
Uses confirmed pivots and closed candles for stability.
Strategy-Compatible
Can be used for discretionary trading or full strategy backtesting.
🧠 Best Used For
Crypto, Forex, Indices
15m to 4H timeframes
Traders who want structure + trend + risk clarity in one tool

ADR% / ATR / LoD dist. Table - V2ADR% / ATR / LoD Distance Table (V2) + ATR Range Lines is a simple “daily volatility dashboard” that helps you quickly judge how extended a stock is during the day and where “normal” daily movement zones sit relative to price.
It’s designed to help you answer:
“Has this stock already made most of its usual daily move?”
“Am I chasing too late?”
“Where are typical +ATR / −ATR stretch and pullback zones?”
What you’ll see
ADR% (Average Daily Range %)
Shows the stock’s typical daily travel (low → high) as a percentage.
Example: ADR% = 4% means the stock often swings ~4% in a normal day.
ATR (Average True Range)
Shows the stock’s typical daily movement in price units ($ / points).
Example: ATR = 2.50 means it often moves about $2.50 per day.
LoD dist. (Low of Day distance)
Shows how far price is from today’s Low of Day, measured relative to ATR (as a %).
Higher % = more extended away from the day’s low.
Optional: ATR Range Lines (added in this version)
You can enable two guide lines that extend to the right:
ATR Up Line = Price + ATR
ATR Down Line = Price − ATR
These act like volatility guardrails to visualize “typical daily stretch” and “typical pullback” zones.
ATR “Live vs Locked” option (important)
Lock ATR to last completed day (no intraday updates):
ON (Locked): Uses the last completed daily ATR (yesterday’s finished value).
✅ ATR stays constant all day while the market is live.
OFF (Live): ATR can update intraday as today’s daily candle expands.
✅ ATR may change during the session.
Either way, ATR is still based on your chosen ATR Length (lookback period). Locking simply prevents the ATR from drifting intraday.
How to use it (Kullamägi-style principle)
Kristjan Kullamägi’s momentum style emphasizes pressing strength when conditions are right, but also respecting extension and risk/reward. This tool helps you quantify that:
If ADR%/ATR suggests the stock already moved near its usual daily range, chasing can be lower reward.
The ATR lines help you visualize when price is in a “normal stretch zone” vs a better risk area.
Locking ATR gives you stable intraday reference levels for cleaner execution.
Tips
Use ADR% to understand whether there’s likely “room” left in today’s move.
Use LoD dist. to quickly gauge if price is already far from the day’s low (extended).
Use ATR Up/Down Lines as a simple volatility framework for entries, add-ons, and risk planning.
Keep Lock ATR ON if you prefer stable levels throughout the session.
Credits
Original indicator concept & script: ArmerSchlucker
ADR% formula credit: MikeC / TheScrutiniser and GlinckEastwoot
Modifications (V2): TradersPod
Added optional ATR Up/Down lines extending to the right
Added “Lock ATR to last completed day” option for stable intraday ATR reference
Kept the original logic and purpose intact

Adaptive Log Trend Zones + Retest SignalsAdaptive Log Trend Zones + Retest Signals
Adaptive Log Trend Zones is a trend-following overlay built to identify high-probability breakout retests in strong market conditions. It combines logarithmic regression , volatility-adaptive behavior , and ATR-based trend zones to help traders stay aligned with dominant momentum while avoiding chop.
🔹 Core Features
Logarithmic Regression Midline
Uses linear regression on log price to better handle exponential market moves
Produces smoother, more realistic trend structure on higher timeframes
Volatility-Adaptive Lookback
Automatically expands or contracts the regression length based on ATR volatility
Reacts faster in high volatility, smoother in consolidation
Dynamic Trend Zones
Upper and lower bands are ATR-adjusted and trend-colored
Optional future projection for visual trend guidance
Breakout → Retest Signal Logic
Detects clean breakouts beyond the trend zone
Waits for a controlled pullback (retest) before signaling
Signals only trigger when trend strength is confirmed
Trend Quality Filter
Internal regime detection filters out low-quality, sideways conditions
Uses slope strength and volatility compression to validate entries
🔹 Signals
BUY : Bullish breakout followed by a valid retest in a trending regime
SELL : Bearish breakout followed by a valid retest in a trending regime
Signals are designed for trend continuation , not mean reversion.
🔹 Best Use Cases
Crypto, Forex, and Index markets
Higher timeframes (15m+ recommended)
Trend continuation and pullback strategies
⚠️ Notes
This indicator is not a standalone trading system . Always use proper risk management and confirm signals with structure, volume, or higher-timeframe context.
Designed for traders who prefer structure, patience, and momentum alignment.

Ultimate Futures Daytrade Suite v1 - The Strategy GuideHere is the complete **Strategy Guide** translated into English.
---
# 📘 Ultimate Futures Daytrade Suite – The Strategy Guide
### 1. The Visual Legend (What is what?)
Before you trade, you need to understand the hierarchy of your lines. Not every line has the same importance.
* **🟣 Daily EMA 50 (Neon Violet):** The **"Big Boss"**. It determines the **Macro Trend**.
* *Price above:* We are primarily looking for Longs.
* *Price below:* We are primarily looking for Shorts.
* **🟢 4h EMA 50 (Neon Green):** The **"Swing Trend"**. Your most important level for **Pullback Entries** (Re-entries).
* **🟡 POC (Gold) & TPO:** The **"Magnet"**. Price often returns here.
* *Rule:* Never open a trade directly *on* the POC (Risk of "Chop"). Use it as a **Target** (Take Profit).
* **🟠 IB High/Low (Orange Lines):** The **"Daily Structure"**.
* A breakout from the IB (Initial Balance) often indicates the trend direction for the day.
* **🟥/🟩 Boxes (Supply/Demand):** Resistance and Support zones from the 1h timeframe.
* **⬜ FVG Boxes:** "Gaps" in the market that are often filled.
---
### 2. The Trading Workflow (Top-Down Method)
Go through this mental checklist before every trade:
#### Step 1: Trend Check (The Traffic Light)
Look at the **Violet Line (Daily)** and the **Green Line (4h)**.
* **Bullish:** Price is above Violet AND above Green. -> *Focus: Buy dips.*
* **Bearish:** Price is below Violet AND below Green. -> *Focus: Sell rallies.*
* **Mixed:** Price is between Violet and Green. -> *Caution! Market is undecided (Range Trading).*
#### Step 2: Location (The Context)
Where is the price currently located?
* Are we at a **Green Demand Zone**?
* Are we testing the **4h EMA 50 (Green)** from above?
* Are we at the **VWAP**?
* *Never trade in "No Man's Land"!* Wait until the price touches one of your lines.
#### Step 3: Trigger (The Execution)
Now zoom into your lower timeframe (e.g., 5min or 15min).
* Wait for a reaction at the zone.
* Use the **EMA 9 (Yellow)** as a momentum trigger. If price breaks the EMA 9 and closes above/below it, that is your "Go".
---
### 3. The Setup Blueprints
Here are the two most profitable scenarios you can trade with this script:
#### A) The "Golden Trend" Setup (Long)
* **Context:** Price > **Daily EMA (Violet)**.
* **Preparation:** Price corrects (drops) back to the **4h EMA 50 (Green)** or to the **VWAP**.
* **Confluence:** Ideally, there is also a **Demand Zone (Green Box)** or an **FVG** at that level.
* **Entry:** As soon as a candle touches the zone and closes bullish again (or reclaims the EMA 9).
* **Stop-Loss:** Below the 4h EMA 50.
* **Take-Profit:** Next **Supply Zone (Red)** or the **IB High (Orange)**.
#### B) The "Daytrade Breakout" (Intraday)
* **Context:** Price opens inside yesterday's Value Area.
* **Signal:** Price breaks through the **IB High (Orange)** with momentum.
* **Filter:** Price must be above the **VWAP**.
* **Entry:** On the retest of the IB High or directly on the breakout.
* **Target:** Price often trends in that direction for the rest of the day.
---
### 4. Warning Signals (When NOT to trade)
1. **The "Concrete Ceiling":** If you want to go Long, but the **Violet Daily EMA 50** is running directly above you. This is massive resistance. Better wait until it is broken.
2. **The "POC Dance":** If price is dancing sideways around the **Gold Line (POC)**. This is a "No-Trade Zone". Day traders lose the most money here due to fees and whipsaws.
3. **Overextension:** If price is extremely far away from the **4h EMA 50 (Green)** (Rubber Band Effect). Do not enter in the trend direction here; wait for a pullback to the line.
### Summary
Your chart is now telling you a story:
* **Violet** tells you the Direction.
* **Green** gives you the Entry.
* **Red/Green Boxes** show you the Obstacles.
* **Yellow (EMA 9)** gives you the Timing.
Good luck with the Suite! This is a setup similar to what institutional traders use.

XAUUSD 15m - Clean Signals (Anti-Spam v3)This **XAUUSD 15m – Clean Signals (Anti-Spam v3)** is a trend-aligned signal indicator built around an **EMA basis + ATR channel**. It aims to produce **fewer but cleaner** long/short prompts. A 7-EMA acts as the basis line, ATR forms inner/outer bands, and a 50-EMA provides a trend filter. By default, it uses **ADX strength filtering** plus a **confirmation candle** rule to avoid choppy conditions and weak breakouts. Signals come in three types: **DR (pullback → reversal back above/below the basis)**, **MR (pierce the inner band then reclaim it)**, and **BO (inner-band breakout, off by default due to over-triggering)**. To control frequency, it adds a **cooldown (minimum bars between signals)** and a strict **arming/reset de-duplication**: after a same-direction signal fires, it won’t fire again until price “resets” by touching the inner band or the basis (user-selectable). A “room to outer band” filter helps prevent chasing near extremes. Overall, it’s designed for disciplined 15-minute momentum-pullback entries, especially during liquid sessions like London.

VWAP + EMA 20/50 Scalping PRO - PRAKASH✅ VWAP + EMA 20/50 SCALPING — PRO RULES
1️⃣ Chart Setup (30 seconds)
Timeframe: 1-min or 3-min
Indicators:
VWAP (Session)
EMA 20
EMA 50
Use on Index chart (NIFTY / SENSEX), not option chart
2️⃣ Trend Filter (FIRST CHECK)
Condition Market Bias
EMA 20 > EMA 50 Bullish
EMA 20 < EMA 50 Bearish
EMA 20 = EMA 50 (flat) ❌ No trade
👉 Never trade against EMA alignment
3️⃣ VWAP Position = Permission
Price vs VWAP Allowed Trade
Price above VWAP CE only
Price below VWAP PE only
Price cutting VWAP ❌ Skip
👉 VWAP decides BUY or SELL side
4️⃣ ENTRY SETUP (MOST IMPORTANT)
✅ CE ENTRY
EMA 20 > EMA 50
Price above VWAP
Pullback to EMA 20 or VWAP
Strong green candle close
✅ PE ENTRY
EMA 20 < EMA 50
Price below VWAP
Pullback to EMA 20 or VWAP
Strong red candle close
5️⃣ STOP LOSS & TARGET (FIXED)
Target: 10–15 points
SL:
Below EMA 20 (CE)
Above EMA 20 (PE)
Risk : Reward ≥ 1:2
❌ No SL = no trade
6️⃣ STRIKE SELECTION (OPTION SIDE)
Trade ATM or ±1 strike
Premium range: ₹80–₹150
Strike must move immediately
7️⃣ DO NOT TRADE WHEN ❌
EMA 20 & 50 flat
Price inside VWAP
First 5 minutes of market
Low volume candles

[CT] Daily & Weekly Percentage Price Oscillator Daily & Weekly Percentage Price Oscillator, or D&W PPO, is a dual-speed momentum oscillator that blends a slower “weekly-style” percentage oscillator with a faster “daily-style” percentage oscillator, then turns the relationship between them into a clean histogram that is easy to trade. The script builds four EMAs from the chart’s close. The first pair, L1 and L2, is used to create the W component, which behaves like a slow, higher-timeframe trend pressure line. W is calculated as the percentage distance between EMA(L1) and EMA(L2), normalized by EMA(L2). When W is rising and positive, it tells you the broader momentum is expanding upward, and when W is falling and negative, the broader momentum is expanding downward. The second pair, L3 and L4, creates the D component, which behaves like a faster, lower-timeframe momentum pulse, also expressed as a percentage but normalized by the same EMA(L2), so both components share a consistent “scale.” The script then combines them into R = W + D, which represents the total blended momentum, where W supplies the slow structure and D supplies the fast impulse.
The indicator is plotted as a histogram using “R − W,” and that choice is intentional. Because R = W + D, the histogram value “R − W” is mathematically identical to D. In other words, the columns you see are the fast momentum component, but anchored to a clear baseline that reflects whether the fast component is adding to, or subtracting from, the slower component’s trend context. The zero line is the equilibrium point where R equals W, meaning the fast component is neutral relative to the slow trend context. When the histogram is above zero, the fast component is contributing positive momentum and the script colors the columns with the Bull color, indicating that R is above W and the short-term push is aligned to the upside. When the histogram is below zero, the fast component is contributing negative momentum and the script colors the columns with the Bear color, indicating that R is below W and the short-term push is aligned to the downside. If you enable “Color price bars,” the chart candles are painted with the same logic so you can visually stay in sync with the fast momentum regime without staring at the panel.
How to trade it comes down to treating the histogram as your actionable trigger layer and using its behavior around the zero line as the decision boundary. A basic long framework is to prioritize long trades when the histogram is above zero and either expanding or printing consecutive positive columns, because that tells you the fast momentum pulse is supportive and not fighting the current regime. The cleanest long entries usually occur when the histogram flips from negative to positive and holds above zero for at least a bar or two, because that transition often marks the shift from pullback pressure into renewed upside impulse. You can add selectivity by watching for a “dip and re-strengthen” pattern above zero: after a positive run, the histogram contracts toward the baseline without breaking materially below it, then turns back up, which often corresponds to a controlled pullback followed by continuation. A basic short framework is the mirror image: prioritize shorts when the histogram is below zero and expanding downward, and treat flips from positive to negative that hold below zero as the higher-quality transition into downside impulse. In both directions, the histogram is especially useful for avoiding trades during momentum dead zones, because when columns chop tightly around the zero line with frequent flips, it is signaling indecision and a lack of clean directional impulse, which is where most “false starts” tend to happen.
Risk management with this tool is straightforward because the oscillator gives you a natural invalidation concept. For long trades, a common invalidation is the histogram losing the zero line and staying negative, since that indicates the fast component has turned from supportive to opposing. For short trades, invalidation is the histogram regaining the zero line and holding positive. Another practical way to manage trades is to use histogram contraction as an early warning that the impulse is weakening. If you are long and positive columns begin to shrink toward zero for several bars, you can tighten risk, take partials, or wait for a fresh expansion before adding. If you are short and negative columns begin to shrink toward zero, the same concept applies. The optional W line can be shown if you want a visual anchor of the slow component; while the histogram is already built to reflect the fast component relative to the slow context, viewing W can help you quickly recognize whether the larger momentum backdrop is generally rising or falling, which can be used as an additional bias filter for trade selection.
In practice, the D&W PPO is best used as a momentum alignment and timing tool: the slow component defines the “weather,” the fast component defines the “wind,” and the histogram tells you whether the wind is pushing with the weather or pushing against it. When the histogram is cleanly one-sided and expanding, it supports continuation-style trading and trend-following entries. When the histogram is choppy around zero, it warns you that conditions are rotational and patience usually pays.

Jake's Candle by Candle UpgradedJake's Candle by Candle Upgraded
The "Story of the Market" Automated
This is not just another signal indicator. Jake's Candle by Candle Upgraded is a complete institutional trading framework designed for high-precision scalping on the 1-minute and 5-minute timeframes.
Built strictly on the principles of Al Brooks Price Action and Smart Money Concepts (SMC), this tool automates the rigorous "Candle-by-Candle" analysis used by professional floor traders. It moves beyond simple pattern recognition to read the "Story" of the market—Context, Setup, and Pressure—before ever allowing a trade.
The Philosophy: Why This Tool Was Built
Most retail traders fail for two reasons:
Getting Trapped: They enter on the first sign of a reversal (H1/L1), which is often an institutional trap.
Trading Chop: They bleed capital during low-volume, sideways markets.
This tool solves both problems with an Algorithmic Discipline Engine. It does not guess. It waits for the specific "Second Leg" criteria used by institutions and physically disables itself during dangerous market conditions.
Key Features
1. The Context Dashboard (HUD)
A professional Heads-Up Display in the top-right corner keeps you focused on the macro picture while you scalp.
FLOW: Monitors the 20-period Institutional EMA. (Green = Bull Flow, Red = Bear Flow). You are prevented from trading against the dominant trend.
STATE: A built-in "Volatility Compressor." If it says "⚠️ CHOP / RANGE", the algorithm is disabled. It protects you from overtrading during lunch hours or low-volume zones.
SETUP: Live tracking of the Al Brooks leg count. It tells you exactly when the algorithm is "Waiting for Pullback" or "Searching for Entry."
2. Smart "Trap Avoidance" Logic (H2/L2)
This tool uses the "Gold Standard" of scalping setups: The High 2 (H2) and Low 2 (L2).
It ignores the first breakout attempt (Leg 1), acknowledging it as a potential trap.
It waits for the pullback and only signals on the Second Leg, statistically increasing the probability of a successful trend resumption.
3. Volatility-Adaptive Risk Management
Stop calculating pips in your head. The moment a signal is valid, the tool draws your business plan on the chart:
Stop Loss (Red Line): Automatically placed behind the "Signal Bar" (the candle that created the setup) based on strict price action rules.
Take Profit (Green Line): Automatically projected at a 1.5 Risk-to-Reward Ratio.
Smart Adaptation: The targets expand and contract based on real-time market volatility. If the market is quiet, targets are tighter. If explosive, targets are wider.
4. The "Snap Entry" Signal
The BUY and SELL badges are not lagging. They are programmed with "Stop Entry" logic—appearing the exact moment price breaks the structure of the Signal Bar, ensuring you enter on momentum, not hope.
How to Trade Strategy
Check the HUD: Ensure FLOW matches your direction and STATE says "✅ VOLATILE".
Wait for the Badge: Do not front-run the tool. Wait for the BUY or SELL badge to print.
Set Your Orders: Once the signal candle closes:
Place your Stop Loss at the Red Line.
Place your Take Profit at the Green Line.
Walk Away: The trade is now a probability event. Let the math play out.
Technical Specifications
Engine: Pine Script v6 (Strict Compliance).
Best Timeframes: 1m, 5m.
Best Assets: Indices (NQ, ES), Gold (XAUUSD), and high-volume Crypto (BTC, ETH).

SNIPER Mean Reversion V1MR SNIPER (Mean Reversion)
### When to Use
- Market is **IN BALANCE** (ranging, consolidating)
- Price **breaks out but FAILS** to hold
- **London session** or compressed summer conditions
- Failed breakouts returning to value
### The Setup Sequence
```
1. BALANCE DETECTED
└── Price rotating around POC
2. BREAKOUT ATTEMPT
└── Price pushes beyond Value Area
3. FAILURE + RECLAIM ← KEY MOMENT
└── Price comes BACK inside balance
└── DO NOT trade first move back!
4. PULLBACK INTO LVN
└── Wait for pullback after reclaim
5. AGGRESSION CONFIRMATION
└── Entry candle shows buy/sell pressure
└── Volume elevated (1.2×+ average)
└── Fat body (60%+ of range)
6. ENTRY → TARGET: POC
```
### Signal Labels
- **MR↑** = Mean Reversion Long (failed breakdown)
- **MR↓** = Mean Reversion Short (failed breakout)
- **S/A/B** = Signal quality tier
### Risk Management
- **Stop**: Below recent low (long) / Above recent high (short)
- **Target**: POC (center of value)
- **Risk**: 0.25-0.5% per trade
