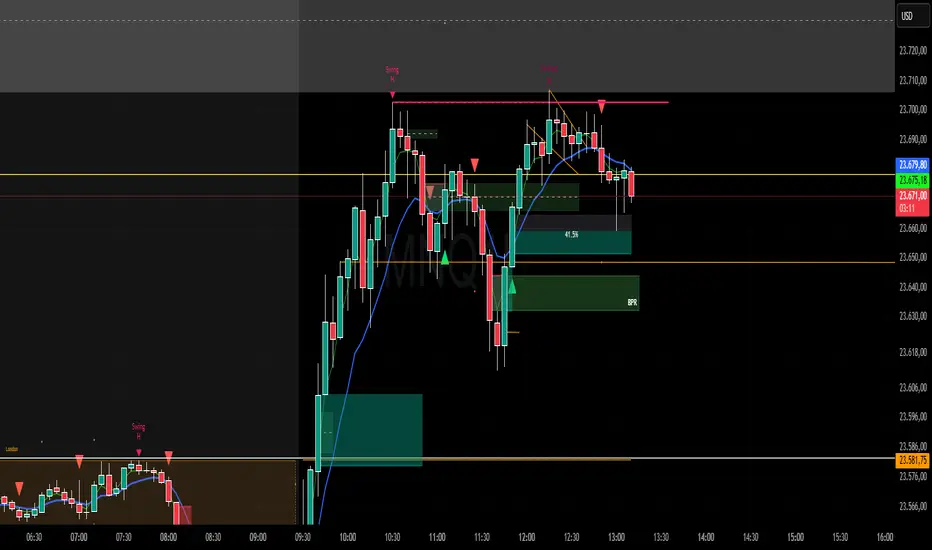
Sweep + Estructura + Pullback (Long & Short)Sweep + Estructura + Pullback (Long & Short)
EFECTIVO EN 5 MIN
在脚本中搜索"pullback"
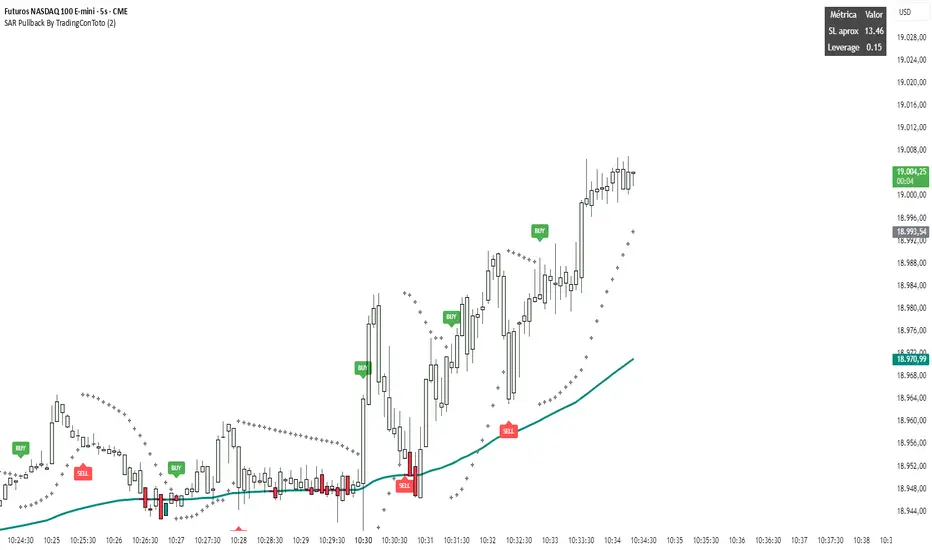
SAR Pullback By TradingConTotoName & Version
SAR Pullback UX Improved (Pine Script v5)
Core Logic
Calculates two EMAs (fast and slow) to identify overall trend direction.
Uses the Parabolic SAR to detect “flip” points (when SAR crosses price), marking micro-trend reversals.
Micro-Trend Extremes
Tracks the highest high after a bullish flip (SAR below price) and the lowest low after a bearish flip (SAR above price).
These extremes feed into the stop-loss approximation.
Approximate Stop-Loss (“SL aprox”)
If SAR is below price (bullish), SL ≔ (micro-trend high − current SAR).
If SAR is above price (bearish), SL ≔ (current SAR − micro-trend low).
Leverage Calculation
User-defined “UR in USD” input.
Computes leverage as UR ÷ SL, giving you an estimate of position sizing potential.
On-Chart Signals
BUY label at each bullish flip, with SL and leverage printed.
SELL label at each bearish flip, likewise showing SL and leverage.
Customizable UI
Inputs to toggle display of SL, leverage, or both.
Choose your UR value, panel background/text colors, and BUY/SELL label colors.
Panel position fixed at top-right by default, showing a 2×3 table:
Header row (“Metric” / “Value”)
“SL aprox” row
“Leverage” row
Visuals
Plots the slow EMA colored by trend.
Draws SAR as crosses.
Bar colors shade green/red according to bullish/bearish conditions.
Semi-transparent, styled panel for quick glance of key metrics.
This indicator combines trend filtering, automated stop-loss sizing, and leverage guidance into a single, fully-configurable Pine Script tool—giving you clear on-chart signals plus a neat metrics panel for streamlined decision-making.
Supply and Demand Daily [LuxAlgo]The Supply and Demand Daily indicator displays daily supply and demand areas on the user's chart. These areas are constructed using the market data within a previous daily interval.
This script makes use of the same logic as our previous Supply and Demand Visible Range indicator .
🔶 USAGE
The supply/demand areas & levels displayed by the indicator aim to provide potential support/resistance levels for users. Supply areas highlight where buyers are willing to exit the market and sell the asset, thus providing resistance and potentially causing prices to reverse or bounce back downwards, while demand areas highlights where buyers were willing to purchase the asset, thus providing support and potentially causing prices to reverse or bounce back upwards.
Historical areas allow the user to study the evolution of supply/demand from one day to another. Wider areas highlight prices avoiding reverting to this area, while thinner areas highlight prices returning more frequently to them.
Trends can be determined by looking at the price position relative to the previous day's supply/demand areas. Price breaking down from the demand zone is indicative of a downtrend, while price breaking above the supply zone is indicative of an uptrend.
Pullback/throwback scenarios can also be common using this indicator.
🔶 SETTINGS
Threshold %: Percentage of the total visible range volume used as a threshold to set supply/demand areas. Higher values return wider areas.
Resolution: Determines the number of bins used to find each area. Higher values will return more precise results.
Intra-bar TF: Timeframe used to obtain intra-bar data.
🔶 RELATED SCRIPTS

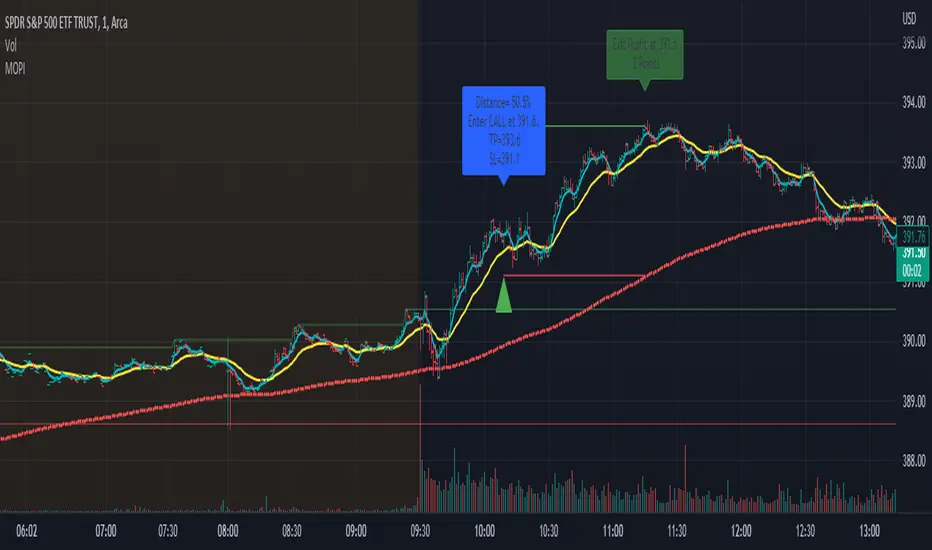
Morning Option Pullback IndicatorI designed this indicator to help me identify Option CALL and PUT signals for the QQQ and SPY on the 1 min chart.
Summary of how it works
1. It identifies the Pre-Market channel High and Low and draws green and red lines for the day at these levels.
2. Waits for a morning or afternoon sessions breakout/breakdown of price out of that channel.
3. The buy a CALL or PUT signal is when price pulls back to the EMA Medium line after breaking out of the channel.
4. Settings allow adjusting of when the signal happens
5. EMA Short (5) and EMA Medium (20) must stay apart for a selectable number of bars
6. For a CALL signal, the Price and EMA Medium (20) must be above the Pre Market High line when price pulls back to EMA Medium (20) line
7. There is a selectable adjustment to allow the signal to trigger when the price comes within a close enough range of the EMA Medium and PM High lines
8. There is a TICK.US filter that you can use to only signal a CALL when the TICK.US 10 min chart shows the average of the EMA5 and EMA20 is over 100
9. It has Buy and Sell signal Alerts and user adjustable Stop Loss and Profit Taker settings.
10. EMA Settings are adjustable and can show up to 3 EMA's on the chart. I personally like the EMA5 and 20. Others may use something similar like 9 and 21. It's user selectable.
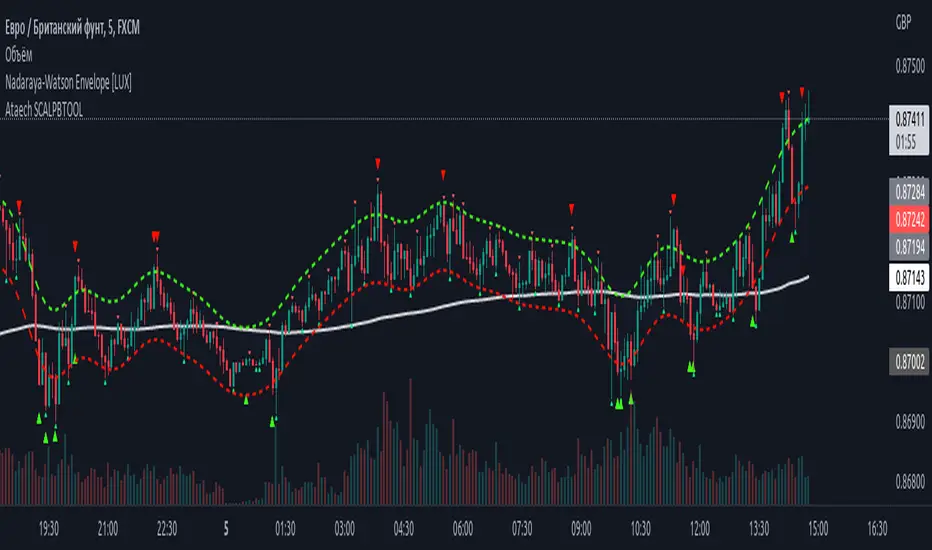
100400 Scalping PullBack Tool R1.1100400 Scalping PullBack Tool R1.1
The following tool smooths the price data using the Nadaraya-Watson estimator, a simple Kernel regression method. We make use of the Gaussian kernel as a weighting function.
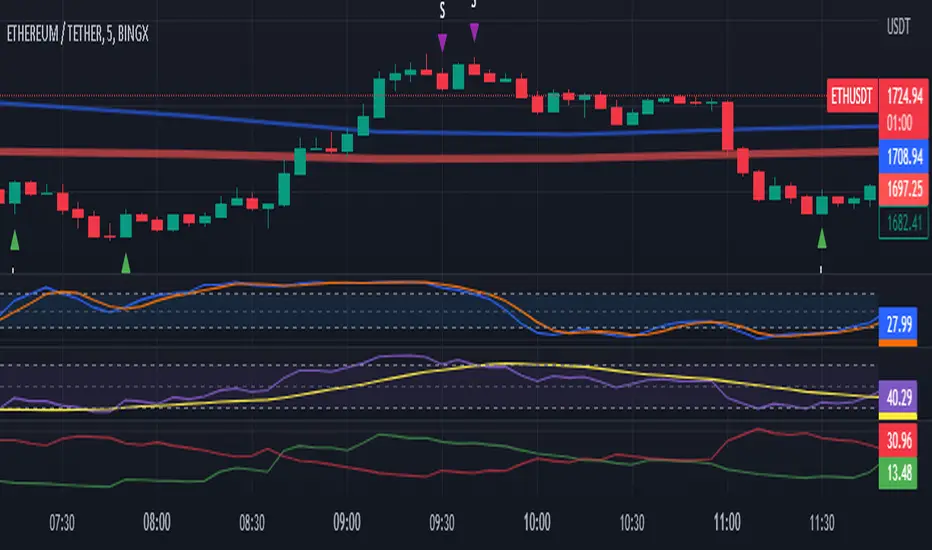
2 Ema Pullback StrategyHi everyone!
CAUTION... This is only an indicator. Do not rely 100% on it.
I made this indicator hoping to help everyone with this specific Pull Back Scalping Strategy.
RULES:
Time Chart of 5minuts
LONG Condition - "EMA Red Line" below the "EMA Blue Line" and wait for a green long signal.
SHORT Condition - "EMA Red Line" below the "EMA Blue Line" and wait for a red short signal
Feel free to add any adjustments or give feedback so we can improve.
The strategy idea and guidelines came from "The Master" Juan Luis.
Autor: © Germangroa

2 EMA PullbackHi everyone!
CAUTION... This is only an indicator. Do not rely 100% on it.
I made this indicator hoping to help everyone with this specific Pull Back Scalping Strategy.
RULES:
Time Chart of 5minuts
Long Condition - "EMA Red Line" below the "EMA Blue Line" and wait for a green long signal.
Short Condition - "EMA Red Line" below the "EMA Blue Line" and wait for a red short signal
Feel free to add any adjustments or give feedback so we can improve.
The strategy idea and guidelines came from the "Master Juan Luis"
Autor: © Germangroa
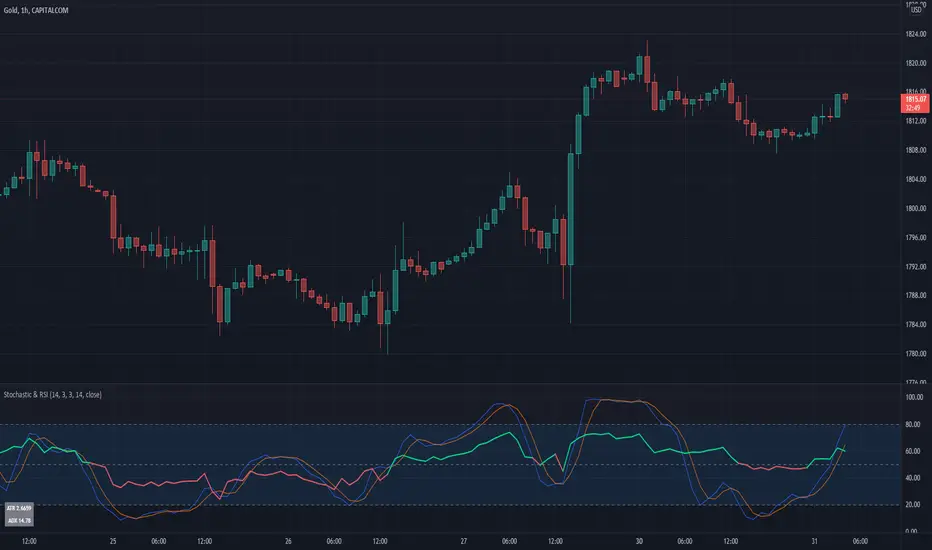
Stochastic & RSIThis script is a simple extension of the Built-In Stochastic RSI that also plots the RSI and prints the values of ATR and ADX of the last bar of the current timeframe to a small table in the corner.
The script can be used to define the entry for a trade when the stochastics crossed and RSI is below or above 0.50 (for going long or short).
OANDA:BTCUSD
I like to use the Stochastics and RSI indicators for pullback strategies, and with this inidcator you dont have to add both indicators to your setup. The ATR can be used to define the value of your stop-loss and the ADX (e.g. > 25) give you a hint for the strength of the current trend.
Entry master RSI pullbackSimply using a single RSI and placing a signal after it crosses the 50 level after being overbought or oversold in the same direction.

Excellent ADXThe Average Directional movement indeX (ADX) is an indicator that helps you determine the trend direction, pivot points, and much more else! But it looks not so easy as other famous indicators. It seems strange or even terrible, but don't be afraid. Let's understand how it works and get its power into your analysis tactics.
In the beginning, imagine a drunk man goes through a ladder: step by step. Up, up, down, up, down, down, up...
How can we understand which direction he goes? Exactly! We can count the number of steps in each direction. In the above example, in the upward – 4, in the downward – 3. So, it looks like he goes in an upward direction.
The ADX indicator counts the same steps, but for price. The size of each step equals 1 ATR for "DI Length" candles. On the indicator chart, we have the green and red lines. The green line represents a number of steps upward. The red line shows one downward. When the red line upper green, then the price goes below, then the trend is directed down. Later the green line comes above the red one, and then the trend changes the direction to upward. Wow? After that, you can easy detect the trend direction on the market!
But it is still not the end. On the chart, we also have the fat blue line. This is the ADX line, and it represents the power of the trend. It is calculated from a distance between the green and red curves. The ADX line value grows if the distance is increased. If the movement is really powerful, then a number of steps into a direction much more prominent than one in an opposed direction. Then the blue line grows faster. But if the growth has stopped and the blue line turns back or already had changed self-direction, then it is a signal that the trend has ended too. It's an excellent sign to close the position (but not always). Easy? Not quite. Thresholds help you there. The indicator has two additional parameters: upper and lower thresholds to evaluate the trend-over signal strength. An u-turn of the ADX line above the upper threshold sends a strong signal. If one occurs between both thresholds, it is a bit weak signal. But if the blue line goes below the lower threshold, it looks like there is no trend, and the price goes side. We can also say that the price goes side when the ADX value gradually falls down.
The Excellent ADX indicator helps you catch pivot/pullback signals based on green, red, and blue lines. Each such signal is highlighted as a green (buy) or red (sell) dot on the plot. The size of the dot represents the strength of the signal. You can also check the position of green and red lines from each other to determine the trend direction and the place where it has been changed. The Excellent ADX indicator helps you there too. It highlights the trend direction by the background-color, so you'll never miss it! The Excellent ADX good compliance with the Price Channel indicator built for the same length. You can use them together to be on a trend wave always!

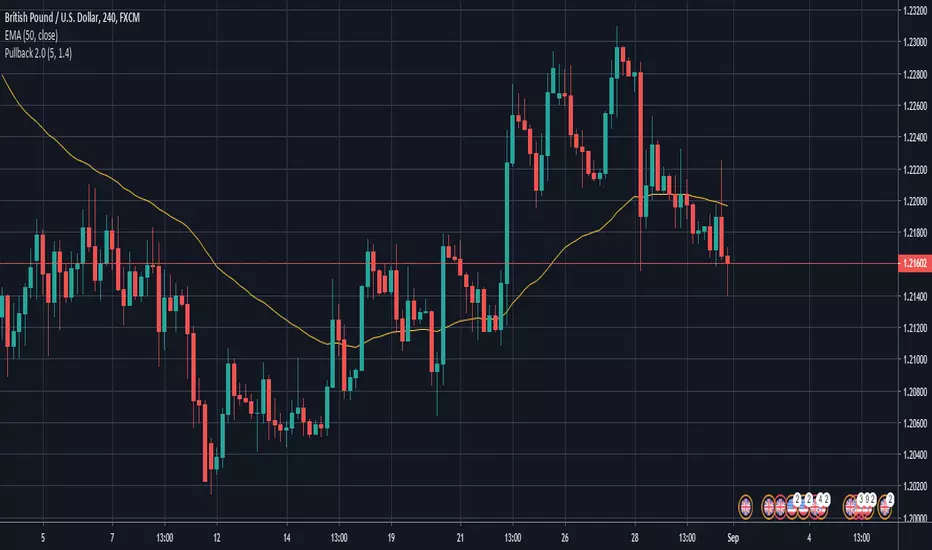
EMA Pullback StudyA colored EMA (period can be chosen via inputs).
A signal is generated on the first price touch of the EMA following the price floating above or below it for several bars.
- If EMA is green and a green up arrow appears (price touch), look for buys.
- If EMA is red and a red down arrow appears look for sells.
Can be used with a longer period MA to confirm overall direction, MTF, chop zone, etc.
May wish to enter on the signal, or wait for price to turn back in direction of the trend.
Still in development!

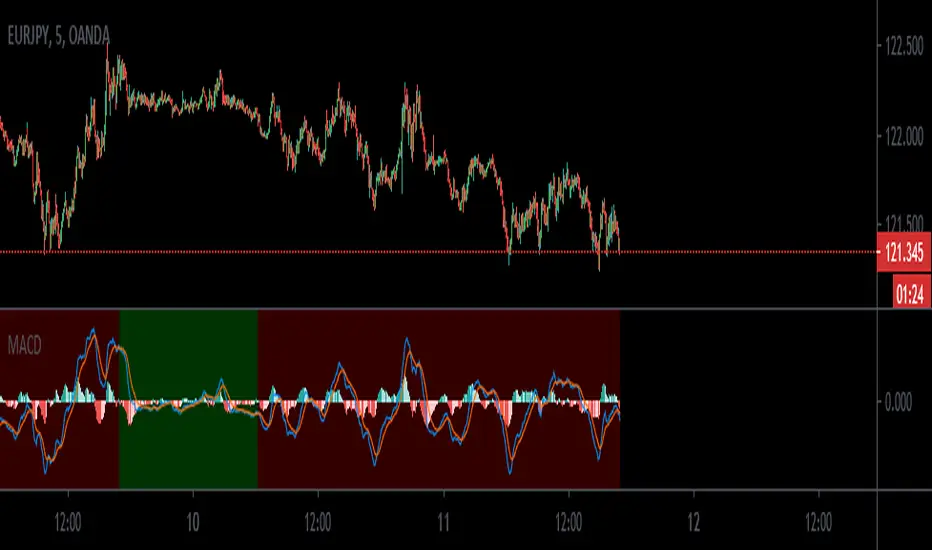
MACD_trendtraderThis is my modified macd indicator. It uses moving averages to determine the trend of the market. It is best used on lower time frames such as 5min and 15min. I found it useful especially with Forex pairs and also traditional markets.
This indicator will help you get in at a pullback in a trending market.
RED background tells you the trend is down. A possible entry happens when you get a sell signal from the macd oscillator above the 0 line.
GREEN background tells you the trend is up. A possible entry happens when you get a buy signal from the macd oscillator below the 0 line.
a couple of examples:
Leave your feedback in the comments. Enjoy:)
Mean Deviation IndexThe Mean Deviation Index (MDX) is used to see how much price is deviating from the mean. This indicator takes both volatility and mean deviation in consideration.
It uses the standard deviation of the ATR to filter an EMA, and uses this as the mean. It then only plots > or < 0 if price is more than one x ATR away from the mean. If index is positive, the background turns green, meaning price is more than 1 x ATR above the mean. If the index is negative, the background turns red, meaning price is more than 1 x ATR below the mean. This setting can be changed by changing the setting "ATR Multiplier", but the default is 1 x ATR.
There are two main ways to use this index.
1. Use it aggressively to find trends (by combining it with other indicators) by entereding each time the background changes color to green for longs or red for shorts.
2. Use it spot breakouts, waiting for a pullback, and then entering on the next move in the same direction. In this context for a short, you wait for the background color to turn green, then wait for the index to pull back, and then enter once it starts moving up again.

The Trading Channel (EAP Course) - Pullback Indicator 1.0I've recently subscribed to TTC's EAP course and created this script to help me.
This is a script to assist with backtesting the strategy outlined in the course. It follows the 5 basic rules of entry.
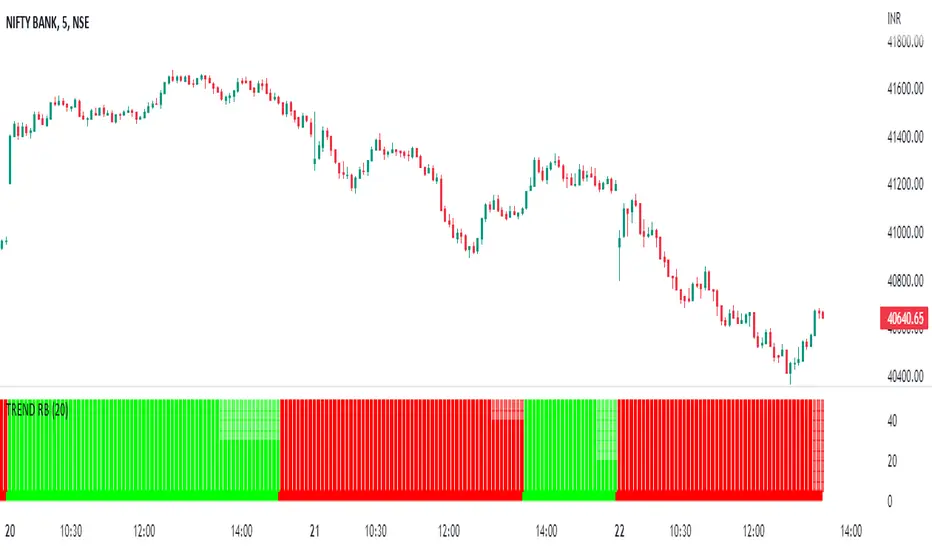
TREND RBReduce Fake Signals, and identify the trend and use as double confirmation
How Does it work ?
- it calculates main trend direction by using the length that is user-defined. so you can change it as you wish
- then it calculates trend direction for each 9 lower lengths. if you set the length = 20 then the lengths are 19, 18,...11
- and it checks if the trend directions that came from lower lengths is same or not with main trend direction.
- it changes the trend color of the ribbon.
Pullback StrategyBTCUSD -- 5 min
BUY POSITION
1 : Fast ema is above medium ema and medium ema is above slow ema
2 : The price drops below the fast ema but not the slow ema
3 : The price rises above the fast ema
SELL POSITION
1 : Fast ema is below medium ema and medium ema is below slow ema
2 : the Price rises above fast ema but not slow ema
3 : The price drops back below the fast ema

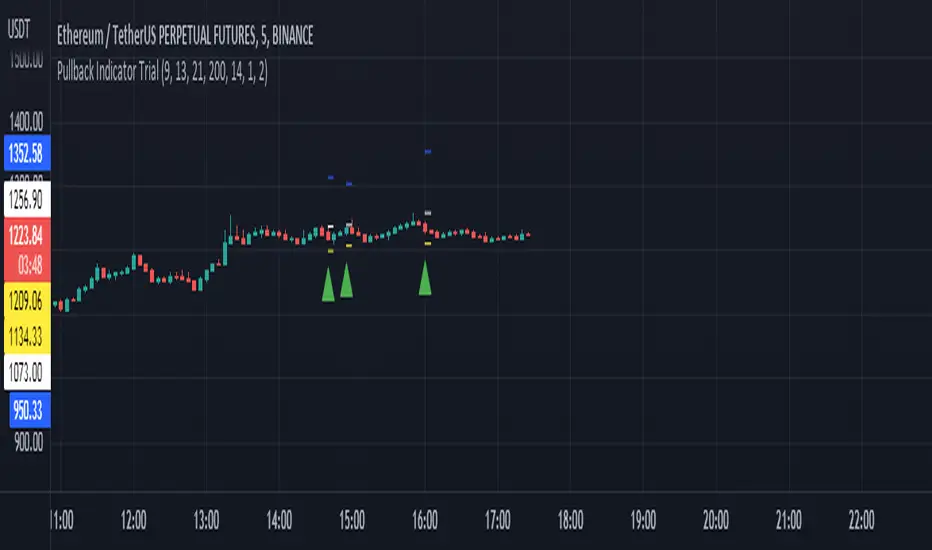
Pullback Indicator Trial- Credits to ZenAndTheArtOfTrading
- Contains 3 EMA's: 8, 13, 21
- Plots Entry Price, Stop Price, and Target Price (Recommend using Stop Market or Stop Limit Orders)
- If Buy Entry Price is not hit and a new Buy signal appears, you can create multiple orders or ignore the new one or cancel the previous and take the new signal. As for Sell signals, do the opposite.
- If Buy Entry Price is not hit and a Sell signal appears, decide to take trade at your own discretion and vice versa(sell side).
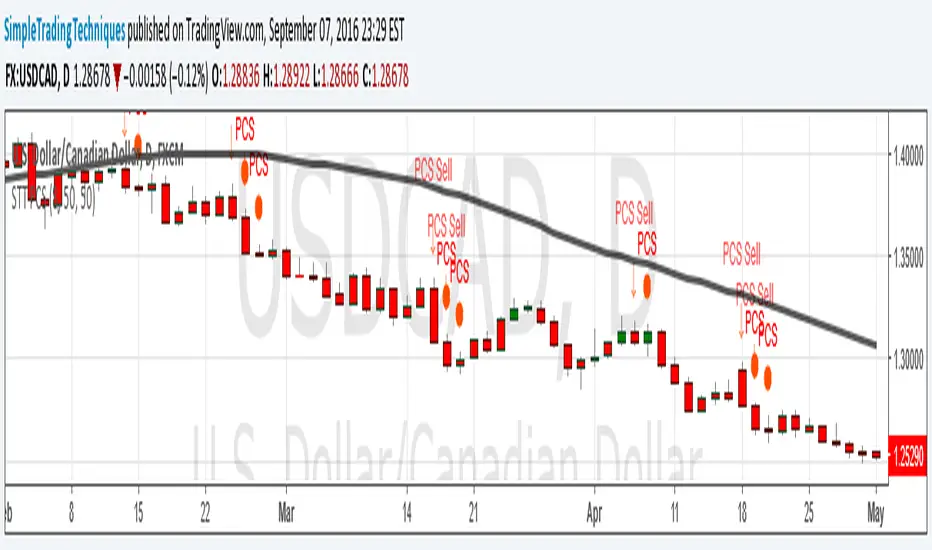
PULLBACK CANDLESTICK STRATEGY BY SIMPLE TRADING TECHNIQUESArrow represent trade setup
Circle represent triggering of the trade
--------------------------------------------------------------------
1. Where to place stop loss?
2. Where to exit the trade?
3. How to protect gains in your trade?
4. How to apply money management rule?
5. How to trade gap opening?
Yetty Trades ORB Strat With Key Levels NQ RTHMust Have Confirmation of ORB on 5 and 15 Min chart. Follow Retracement.
Key Daily & HTF Levels
Track intraday, daily, weekly, and monthly H/L - RTH daily levels ignore pre-market
Current Day H/L (RTH Only)
Previous Day H/L (RTH Only)
2 Days Previous H/L
Pre-Market H/L (Separate)
Weekly H/L
Monthly H/L
NEW
Open Price Levels
Previous period opening prices - key mean reversion and magnet levels
Previous Day Open (PDO)
Previous Week Open (PWO)
Previous Month Open (PMO)
NY Open Line
London Open Line
Session Levels
Monitor Asian and London session highs, lows, and opens
Asian Session H/L
London Session H/L
NY Open Price
London Open Price
Customizable Times
15-Min Opening Range + Signals
Current day only OR box - resets daily + breakout signals with pullback & volume confirmation
Current Day Only
No Historical Clutter
ORB Midpoint Line
Breakout/Pullback Signals
Volume Confirmation
Adjustable Signal Size
NEW
VWAP + SD Bands
VWAP with Standard Deviation bands for institutional-grade analysis
Intraday VWAP
±1 SD Band (Green)
±2 SD Band (Orange)
±3 SD Band (Red)
Dynamic S/R
NEW
Pivot Points
Classic daily pivot points with support and resistance levels
Daily Pivot (P)
R1 & R2 Resistance
S1 & S2 Support
Based on Prior Day
NEW
Fair Value Gaps (FVG)
Smart Money / ICT concept - highlight price imbalances that tend to fill
Bullish FVGs (Green)
Bearish FVGs (Red)
Adjustable Lookback
Min Gap Size Filter
Moving Averages + Strategy
EMAs with built-in Double EMA Pullback buy/sell signal strategy
9 EMA
21 EMA
200 EMA
EMA Pullback Signals
HTF EMA Filter
NEW
200 EMA Bounce Signals
Detect when price uses 200 EMA as dynamic support or resistance
Support Bounce (Green)
Resistance Bounce (Red)
Touch Distance Filter
Confirmation Bars
NEW
Signal Filters
Filter signals by higher timeframe trend and high-volume trading hours
HTF EMA Trend Filter
Time-Based Filter
Power Hour 1 (9:30-11:30)
Power Hour 2 (2:00-4:00)
NEW
ATR-Based Stop Levels
Automatic stop loss suggestions based on ATR when signals fire
14-Period ATR
1.5x ATR Multiplier
Visual Stop Markers
Risk Management
NEW
Statistics Table
On-chart performance dashboard with customizable metrics
Win Rate Display
Total Signal Count
Buy/Sell Breakdown
Position Options
Reversal Patterns
Automatically detect bullish and bearish hammer candlestick patterns
Bullish Hammers
Bearish Hammers
Visual Labels
Fully Customizable - All New Features OFF by Default
Every level has individual controls. New features are disabled by default to keep your chart clean - enable what you need!
Toggle Any Level On/Off
Line Style Per Level
Line Width Per Level
4 Label Display Types
Custom Colors
Solid / Dashed / Dotted
VWAP Band Multipliers
FVG Size Filters
ATR Multiplier
Stats Display Options
HTF Timeframe Choice
Power Hour Times
Trading Strategy Guide
How to use this indicator for breakout trading with pullback entries
Phase 1
Identify Setup
Look for price consolidating near key levels (previous day H/L, session H/L)
Check if price is respecting EMAs (9, 21, or 200)
Note the opening range box boundaries
Watch for price approaching VWAP
Phase 2
Wait for Breakout
Wait for price to break above/below opening range
Look for breakout beyond session highs/lows
Confirm with volume and momentum
Watch for bullish/bearish hammer patterns at key levels
Phase 3
Enter on Pullback
After breakout, wait for price to pull back to EMAs
Look for price to retest the opening range boundary
Enter when price finds support/resistance at key levels
Use hammer patterns as entry confirmation signals
Grizzology-Style Clean Layout
• Daily Reset: All levels automatically reset each day - no historical clutter
• Current Day Only: Opening Range box only shows for today's session
• Clean Lines: Levels use lines instead of extending plots for cleaner charts
• Labels: CDH, CDL, PDH, PDL, PMH, PML labels for easy identification
• Pre-Market: Track pre-market high/low levels (04:00-09:30)
Trading Tips
• Risk Management: Always use stop losses below/above key levels
• Confirmation: Wait for multiple indicators to align before entering
• Time of Day: Breakouts during London/New York open tend to be more reliable
• Volume: Higher volume on breakouts increases probability of success
• False Breakouts: Opening range helps filter out early false moves
Example Trade Setup
1. Market Opens: Opening range box forms in first 15 minutes (9:30-9:45 AM)
2. Consolidation: Price trades within the OR box, respecting boundaries
3. Breakout: Price breaks above OR high with strong momentum, confirmed by volume
4. Pullback: Price pulls back to test the OR high (now support) and 21 EMA
5. Entry: Bullish hammer forms at the pullback level → Enter long
6. Target: Previous day high or session high
7. Stop Loss: Below the pullback low or below OR box

MINI Lead Osc v2_ CCI_ Impulse_ REG🔹 MINI Lead Osc v2 — Momentum, Impulse & Early Reversal Tool
MINI Lead Osc v2 is a leading momentum oscillator designed to detect early shifts in market strength, impulse exhaustion, and potential reversals before they become obvious on price.
This indicator is part of the ICT Suite ecosystem and is engineered to work in confluence with:
Regression SuperTrend (WAIT)
Liquidity Oscillator (Structure & Bias)
Used together, they form a complete top-down trading framework.
⚙️ Core Logic
MINI Lead Osc v2 blends multiple engines into a single clean signal:
• CCI + RSI slope momentum
• ATR volatility shift
• Pivot-based divergence detection
• Adaptive Sensitivity+ engine
• Regression channel (linreg + RMSE bands)
The output is a normalized lead line that reacts before classic lagging indicators.
🚀 What This Indicator Is Best For
✔ Early trend continuation signals
✔ Detecting impulse starts, weakness, and distribution
✔ Filtering noise during ranges
✔ Momentum confirmation for pullback entries
✔ Spotting divergence without repainting
This is not a standalone “buy/sell spam” indicator — it is a decision-quality tool.
🔁 How to Use (Recommended Setup)
For best results, use MINI Lead Osc v2 together with:
1️⃣ Regression SuperTrend (WAIT)
→ Defines dominant trend & market regime
→ Filters counter-trend signals
2️⃣ Liquidity Oscillator (Structure)
→ Confirms break → pullback → continuation logic
→ Adds HTF bias & session context
3️⃣ MINI Lead Osc v2 (this script)
→ Times entries
→ Detects early momentum shifts
→ Confirms impulse quality
📌 Trade only when all three align.
🧠 Important Notes
• Signals are non-repainting (bar-close confirmed)
• Designed for discretionary trading, not automation
• Works best on 5m – 15m – 1h timeframes
• Crypto, Futures, and FX friendly
⚠️ Disclaimer
This indicator is for educational and analytical purposes only.
It does not constitute financial advice.
Always manage risk and confirm with price action.

eBacktesting - Learning: Fibonacci RetracementeBacktesting - Learning: Fibonacci Retracement helps you practice one of the most common “pullback” tools in trading: Fibonacci retracements.
It automatically finds the most recent swing and draws your chosen Fibonacci levels (for example 0.382, 0.5, 0.618, 0.786) so you can clearly see where price is pulling back into “discount/premium” areas. When price taps a level (or the Golden Zone), the indicator marks it so you can review what happened next and build pattern recognition.
These indicators are built to pair perfectly with the eBacktesting extension, where traders can practice these concepts step-by-step. Backtesting concepts visually like this is one of the fastest ways to learn, build confidence, and improve trading performance.
Educational use only. Not financial advice.

Pro-Vision ATR + ExhaustionThis indicator is designed to provide Real-Time Volatility Guardrails. Unlike standard ATR indicators that plot a single line at the bottom of your chart, this tool projects volatility "shells" directly onto the price action from the current candle.
It answers the most critical question in a live trade: "How far can this stock move right now before it is statistically exhausted?"
The Components
Current ATR Centerpiece: The lines originate from the most recent price action, updating live with every tick.
Target Lines (1.5x ATR - Yellow): These represent the "Normal Expected Move." In a healthy trend, price often reaches these levels without much resistance.
Exhaustion Lines (3.0x ATR - Red): These represent "Extreme Volatility." Statistically, it is rare for price to sustain a move beyond 3x its average range in a single period without a pullback or consolidation.
How to Trade It
1. Profit Taking (The "Target" Exit)
If you are in a long position and price hits the Yellow Upper Line, it has achieved its expected volatility move for that timeframe.
Strategy: Scale out 50% of your position here. This locks in gains based on math rather than emotion.
2. Reversal Trading (The "Exhaustion" Play)
When price pierces or touches the Red Exhaustion Line, the asset is "overbought" or "oversold" relative to its recent volatility.
Strategy: Look for a reversal candle (like a shooting star or hammer) touching the red line.
The Trade: Short the asset at the red line with a tight stop, or close your long position immediately. These levels often act as "invisible" ceilings.
3. Setting "Smart" Stop Losses
Standard stops are often placed at arbitrary percentages. Using this indicator, you can place your stop just outside the 1.5x ATR line.
Strategy: If you enter a trade and price moves past the opposite ATR line, the volatility has shifted against you, and the original trade thesis is likely invalid.
4. Filtering Bad Entries (The "Don't Chase" Rule)
Strategy: If you are looking to go Long, but the price is already sitting at the Yellow Line, the "meat of the move" is likely over.
Rule: Never enter a new position if the price is already 75% of the way to the Red Exhaustion line. Wait for a mean reversion back to the middle.

NeuraCloud - Ichimoku (Purple Kumo) + Alerts (Minimal)NeuraCloud is a clean, modern interpretation of the Ichimoku Cloud, designed to identify trend direction, market structure, and key support/resistance zones at a glance.
The purple cloud (Kumo) acts as a dynamic trend filter:
• Price above the cloud indicates bullish conditions
• Price below the cloud indicates bearish conditions
• Price inside the cloud signals consolidation or uncertainty
NeuraCloud combines the cloud with Tenkan-sen and Kijun-sen to highlight momentum shifts, pullbacks, and trend continuation opportunities. Built-in alerts notify you of price/cloud breaks, momentum crosses, and cloud flips, helping you stay aligned with high-probability market structure.
Ideal for trend traders, swing traders, and multi-timeframe analysis, NeuraCloud keeps charts clean while delivering clear market context.
