Linear Trajectory & Volume StructureThe Linear Trajectory & Volume Structure indicator is a comprehensive trend-following system designed to identify market direction, volatility-adjusted channels, and high-probability entry points. Unlike standard Moving Averages, this tool utilizes Linear Regression logic to calculate the "best fit" trajectory of price, encased within volatility bands (ATR) to filter out market noise.
It integrates three core analytical components into a single interface:
Trend Engine: A Linear Regression Curve to determine the mean trajectory.
Volume Verification: Filters signals to ensure price movement is backed by market participation.
Market Structure: Identifies previous high-volume supply and demand zones for support and resistance analysis.
2. Core Components and Logic
The Trajectory Engine
The backbone of the system is a Linear Regression calculation. This statistical method fits a straight line through recent price data points to determine the current slope and direction.
The Baseline: Represents the "fair value" or mean trajectory of the asset.
The Cloud: Calculated using Average True Range (ATR). It expands during high volatility and contracts during consolidation.
Trend Definition:
Bullish: Price breaks above the Upper Deviation Band.
Bearish: Price breaks below the Lower Deviation Band.
Neutral/Chop: Price remains inside the cloud.
Smart Volume Filter
The indicator includes a toggleable volume filter. When enabled, the script calculates a Simple Moving Average (SMA) of the volume.
High Volume: Current volume is greater than the Volume SMA.
Signal Validation: Reversal signals and structure zones are only generated if High Volume is present, reducing the likelihood of trading false breakouts on low liquidity.
Volume Structure (Smart Liquidity)
The script automatically plots Support (Demand) and Resistance (Supply) boxes based on pivot points.
Creation: A box is drawn only if a pivot high or low is formed with High Volume (if the volume filter is active).
Mitigation: The boxes extend to the right. If price breaks through a zone, the box turns gray to indicate the level has been breached.
3. Signal Guide
Trend Reversals (Buy/Sell Labels)
These are the primary signals indicating a potential change in the macro trend.
BUY Signal: Appears when price closes above the upper volatility band after previously being in a downtrend.
SELL Signal: Appears when price closes below the lower volatility band after previously being in an uptrend.
Pullbacks (Small Circles)
These are continuation signals, useful for adding to positions or entering an existing trend.
Long Pullback: The trend is Bullish, but price dips momentarily below the baseline (into the "discount" area) and closes back above it.
Short Pullback: The trend is Bearish, but price rallies momentarily above the baseline (into the "premium" area) and closes back below it.
4. Configuration and Settings
Trend Engine Settings
Trajectory Length: The lookback period for the Linear Regression. This is the most critical setting for tuning sensitivity.
Channel Multiplier: Controls the width of the cloud.
1.0: Aggressive. Results in narrower bands and earlier signals, but more false positives.
1.5: Balanced (Default).
2.0+: Conservative. Creates a wide channel, filtering out significant noise but delaying entry signals.
Signal Logic
Show Trend Reversals: Toggles the main Buy/Sell labels.
Show Pullbacks: Toggles the re-entry circle signals.
Smart Volume Filter: If checked, signals require above-average volume. Unchecking this yields more signals but removes the volume confirmation requirement.
Volume Structure
Show Smart Liquidity: Toggles the Support/Resistance boxes.
Structure Lookback: Defines how many bars constitute a pivot. Higher numbers identify only major market structures.
Max Active Zones: Limits the number of boxes on the chart to prevent clutter.
5. Timeframe Optimization Guide
To maximize the effectiveness of the Linear Trajectory, you must adjust the Trajectory Length input based on your trading style and timeframe.
Scalping (1-Minute to 5-Minute Charts)
Recommended Length: 20 to 30
Multiplier: 1.2 to 1.5
Logic: Fast-moving markets require a shorter lookback to react quickly to micro-trend changes.
Day Trading (15-Minute to 1-Hour Charts)
Recommended Length: 55 (Default)
Multiplier: 1.5
Logic: A balance between responsiveness and noise filtering. The default setting of 55 is standard for identifying intraday sessions.
Swing Trading (4-Hour to Daily Charts)
Recommended Length: 89 to 100
Multiplier: 1.8 to 2.0
Logic: Swing trading requires filtering out intraday noise. A longer length ensures you stay in the trade during minor retracements.
6. Dashboard (HUD) Interpretation
The Head-Up Display (HUD) provides a summary of the current market state without needing to analyze the chart visually.
Bias: Displays the current trend direction (BULLISH or BEARISH).
Momentum:
ACCELERATING: Price is moving away from the baseline (strong trend).
WEAKENING: Price is compressing toward the baseline (potential consolidation or reversal).
Volume: Indicates if the current candle's volume is HIGH or LOW relative to the average.
Disclaimer
*Trading cryptocurrencies, stocks, forex, and other financial instruments involves a high level of risk and may not be suitable for all investors. This indicator is a technical analysis tool provided for educational and informational purposes only. It does not constitute financial advice, investment recommendations, or a guarantee of profit. Past performance of any trading system or methodology is not necessarily indicative of future results.
在脚本中搜索"pullback"

Momentum Day Trading ToolkitMomentum Day Trading Toolkit
Complete User Guide
Table of Contents
Overview
Quick Start
The Dashboard
Module 1: 5 Pillars Screener
Module 2: Gap & Go
Module 3: Bull Flag / Flat Top
Module 4: Float Rotation
Module 5: R2G / G2R
Module 6: Micro Pullback
Signal Reference
Quality Score
Settings Guide
Alerts Setup
Trading Workflows
Troubleshooting
Overview
The Momentum Day Trading Toolkit combines 6 powerful indicators into one unified system for day trading momentum stocks.
ModulePurpose① 5 PillarsConfirms stock is "in play"② Gap & GoPre-market levels & gap analysis③ Bull Flag / Flat TopClassic breakout patterns④ Float RotationMeasures true interest level⑤ R2G / G2RTracks prior close crosses⑥ Micro PullbackPrecision continuation entries
All modules work together - the dashboard shows you everything at a glance, and you can enable/disable any module you don't need.
Quick Start
Step 1: Add to Chart
Add the indicator to any stock chart
Recommended timeframes: 1-minute, 5-minute, or 15-minute
Step 2: Check the Dashboard (Top Right)
Look for:
Status = Current state (Scanning, Entry Signal, etc.)
Quality Score = Setup rating out of 10
Green checkmarks (✓) = Criteria passing
Step 3: Watch for Entry Signals
Triangles, circles, diamonds below bars = Entry signals
Arrows = R2G/G2R crosses
Step 4: Set Alerts
Right-click chart → Add Alert
Select "Momentum Day Trading Toolkit"
Choose your alert condition
The Dashboard
The dashboard in the top-right corner gives you instant analysis:
┌─────────────────────────────┐
│ MOMENTUM TOOLKIT │
├─────────────────────────────┤
│ Status │ 🎯 ENTRY SIGNAL │
│ Day │ 🟢 GREEN │
│ Gap │ +8.5% 🔥 │
│ RVol │ 3.2x ✓ │
│ Rotation │ 1.45x 🔥 │
│ Float │ 5.2M 🔥 │
│ Change │ +12.3% ✓ │
│ Pattern │ BULL FLAG! │
│ EMA 9/20 │ Above Both ✓ │
│ VWAP │ Above ✓ │
│ Prior Cl │ 5.91 │
│ PM High │ 9.11 ✓ │
│ Price │ 9.46 ✓ │
└─────────────────────────────┘
Dashboard Row Reference
RowWhat It ShowsGood ValuesStatusCurrent state🎯 ENTRY SIGNALDayGreen/Red vs prior close🟢 GREENGapGap % from prior close🔥 (5%+) or 🔥🔥 (10%+)RVolRelative volume✓ (2x+) or ✓✓ (5x+)RotationFloat rotation🔥 (1x) or 🔥🔥 (2x+)FloatFloat in millions🔥 (<5M) or Low (<10M)ChangeDaily % change✓ (meets minimum)PatternPattern statusBREAKOUT!EMA 9/20Trend positionAbove Both ✓VWAPVWAP positionAbove ✓Prior CloseKey R2G levelReference pricePM HighPre-market high✓ = Above itPriceCurrent price✓ = In range
Status Messages
StatusMeaningActionScanning...Looking for setupsWait✅ ALL PILLARSStock qualifiesWatch for pattern⏳ PATTERN FORMINGSetup developingGet ready🎯 ENTRY SIGNALSignal triggeredExecute trade
Module 1: 5 Pillars Screener
What It Does
Confirms the stock meets basic criteria to be worth trading.
The 5 Pillars
PillarDefaultWhy It MattersRelative Volume2x+ (5x for "strong")Confirms unusual interestDaily Change5%+Stock is movingPrice Range$1-$20Sweet spot for momentumFloat Size<20M sharesLower float = bigger moves
Visual Indicator
Green background appears when ALL pillars pass
Dashboard Shows
Individual pillar status with ✓ checkmarks
Quality score includes pillar factors
Settings
SettingDefaultDescriptionMin RVol2.0xMinimum relative volumeStrong RVol5.0xVolume for full qualificationMin Change5%Minimum daily moveMin Price$1Minimum stock priceMax Price$20Maximum stock priceMax Float20MMaximum float size
Module 2: Gap & Go
What It Does
Analyzes pre-market gaps and displays key price levels.
Key Levels Displayed
LevelColorDescriptionPrior CloseOrangeYesterday's close - THE key levelPM HighGreenPre-market high - breakout levelPM LowRedPre-market low - support
Gap Classification
Gap SizeRatingMeaning5-9.9%🔥 QualifyingWorth watching10%+🔥🔥 StrongHigh priority
Entry Signal
Small green triangle = PM High Breakout
How to Trade
Stock gaps up in pre-market
Wait for market open
Look for break above PM High
Enter on breakout with stop below PM Low
Settings
SettingDefaultDescriptionMin Gap %5%Qualifying gap thresholdStrong Gap %10%Strong gap thresholdShow PM LevelsONDisplay PM high/low lines
Module 3: Bull Flag / Flat Top
What It Does
Detects classic continuation patterns and signals breakouts.
Bull Flag Pattern
▲ BREAKOUT (Entry Signal)
│
┌────┴────┐
│ Pullback │ ← 2-5 red candles
│ (flag) │ Max 50% retrace
└─────────┘
│
┌────┴────┐
│ Pole │ ← 3+ green candles
│ (move) │ Strong momentum
└─────────┘
Flat Top Pattern
═══════════════ Resistance (2+ touches)
│
▲ BREAKOUT above resistance
Entry Signals
SignalShapeColorPatternBull Flag Breakout▲ TriangleLimeFlag breaks upFlat Top Breakout◆ DiamondAquaResistance breaks
How to Trade Bull Flag
See 3+ green candles (the pole)
Price pulls back 2-5 red candles
Pullback stays above 50% of move
Enter on break above pullback high
Stop below pullback low
Settings
SettingDefaultDescriptionMin Pole Candles3Green candles neededMax Pullback5Max red candles allowedMax Retrace50%Max pullback depthFT Touches2Resistance touches neededFT Lookback10Bars to check for resistance
Module 4: Float Rotation
What It Does
Tracks how many times the entire float has traded hands today.
The Formula
Rotation = Cumulative Day Volume ÷ Float
Rotation Levels
RotationEmojiMeaning0.5x—Half float traded1.0x🔥FULL rotation - significant!2.0x🔥🔥Double rotation - extreme3.0x+🔥🔥🔥Triple rotation - rare event
Why It Matters
High rotation = Extreme interest
Everyone who owns shares has likely traded
Often precedes explosive moves
Shows "real" demand beyond just volume
Dashboard Shows
Current rotation level
Fire emojis for milestones
Settings
SettingDefaultDescriptionFloat SourceAutoAuto-detect or manualManual Float10MIf auto fails, use thisAlert Level1.0xAlert when rotation hits this
Module 5: R2G / G2R
What It Does
Tracks when price crosses the prior day's close - a key psychological level.
Red to Green (R2G) 🟢
Prior Close ─────────────────
↗ CROSS TO GREEN
↗
(opened red)
Stock opened below prior close (red)
Crosses above prior close (green)
BULLISH signal
Green to Red (G2R) 🔴
(opened green)
↘
↘ CROSS TO RED
Prior Close ─────────────────
Stock opened above prior close (green)
Crosses below prior close (red)
BEARISH signal
Entry Signals
SignalShapeColorMeaningR2G↑ ArrowLimeCrossed to greenG2R↓ ArrowRedCrossed to red
Why R2G Matters
Bears who shorted get squeezed
Creates FOMO buying
Prior close becomes support
Momentum often continues
Dashboard Shows
Current day status (🟢 GREEN / 🔴 RED)
Whether R2G or G2R occurred (R2G ✓ or G2R ✓)
Settings
SettingDefaultDescriptionRequire Opposite OpenONR2G needs red openShow Prior CloseONDisplay the line
Module 6: Micro Pullback
What It Does
Finds precision entries on brief 1-3 candle pullbacks after strong moves.
The Pattern
▲ ENTRY (break pullback high)
│
┌──┴───┐
│ 1-3 │ ← Micro pullback (brief!)
│ red │ Stop = low of this
└──────┘
│
┌──┴───┐
│ 3+ │ ← Strong move
│green │ Momentum building
└──────┘
Why Micro Pullbacks Work
Tight stop = Pullback low is close
Momentum intact = Only paused briefly
Early entry = Catch continuation early
Clear trigger = Break of pullback high
Entry Signal
SignalShapeColorMicro Pullback Entry● CircleYellow
How to Trade
See 3+ green candles (strong move)
1-3 red candles (brief pause)
Pullback stays above 50% retrace
Enter when green candle breaks pullback high
Stop at pullback low
Settings
SettingDefaultDescriptionMin Green Candles3Candles before pullbackMax Pullback3Max red candlesMax Retrace50%Max pullback depth
Signal Reference
All Entry Signals (Below Bar)
ShapeColorSignalModule▲ Large TriangleLimeBull Flag BreakoutPatterns◆ DiamondAquaFlat Top BreakoutPatterns● CircleYellowMicro Pullback EntryMicro PB▲ Small TriangleGreenPM High BreakoutGap & Go↑ ArrowLimeRed to GreenR2G/G2R
Warning Signals (Above Bar)
ShapeColorSignalModule↓ ArrowRedGreen to RedR2G/G2R
Optional Forming Signals (Disabled by Default)
ShapeColorSignal🚩 FlagFaded LimeBull Flag Forming● CircleFaded YellowMicro PB Forming
Enable "Show 'Forming' Markers" in settings to see these
Quality Score
The quality score (0-10) rates the overall setup strength.
Scoring Breakdown
FactorPointsRVol 5x++2RVol 2x++1Daily change 5%++1Low float (<20M)+1Strong gap (10%+)+2Qualifying gap (5%+)+1Rotation 1x++2Rotation 0.5x++1Above EMA 20+1
Score Interpretation
ScoreGradeAction8-10A+Best setups - full position6-7AGood setups - standard size4-5BAverage - reduced size0-3CWeak - skip or paper trade
Settings Guide
Module Toggles
Turn each module ON/OFF:
SettingDefaultDescription① 5 Pillars ScreenerONStock qualification② Gap & Go AnalysisONGap & level analysis③ Bull Flag / Flat TopONPattern detection④ Float RotationONRotation tracking⑤ R2G / G2R TrackerONPrior close crosses⑥ Micro PullbackONPullback entries
Visual Settings
SettingDefaultDescriptionShow DashboardONDisplay info tableTable SizeNormalSmall/Normal/LargeShow Entry SignalsONDisplay entry shapesShow 'Forming' MarkersOFFShow pattern formingShow Key LevelsONPrior close, PM levelsShow EMA 9/20ONTrend EMAsShow VWAPONVWAP line
Recommended Presets
Minimal (Clean Chart)
Show Dashboard: ON
Show Entry Signals: ON
Show 'Forming' Markers: OFF
Show Key Levels: OFF
Show EMA: OFF
Show VWAP: OFF
Standard (Balanced)
All defaults
Full Analysis
All settings ON
Alerts Setup
Available Alerts
AlertTriggerAny Bullish EntryAny entry signal firesBull Flag BreakoutBull flag breaks outFlat Top BreakoutFlat top breaks outMicro Pullback EntryMicro PB triggersPM High BreakoutBreaks above PM highRed to GreenR2G crossGreen to RedG2R crossFloat RotationHits rotation level5 Pillars PassAll pillars qualifyPattern FormingPattern starts formingHigh Quality EntryEntry with score 7+/10
How to Set Alerts
Right-click on chart
Select "Add Alert"
Condition: "Momentum Day Trading Toolkit"
Select alert type from dropdown
Set expiration and notifications
Click "Create"
Recommended Alerts
For Active Trading:
Any Bullish Entry
High Quality Entry
For Watchlist Monitoring:
5 Pillars Pass
Float Rotation
Trading Workflows
Workflow 1: Full Qualification
Step 1: 5 PILLARS
└─→ Wait for "✅ ALL PILLARS" status
Step 2: CHECK SETUP
└─→ Quality score 6+?
└─→ Above EMA and VWAP?
Step 3: WAIT FOR ENTRY
└─→ Bull Flag, Flat Top, or Micro PB signal
Step 4: EXECUTE
└─→ Enter on signal
└─→ Stop below pattern low
└─→ Target 2:1 minimum
Workflow 2: Gap & Go
Step 1: PRE-MARKET
└─→ Stock gaps 5%+ (shows in Gap row)
Step 2: MARKET OPEN
└─→ Note PM High level (green line)
Step 3: WAIT FOR BREAK
└─→ PM High Breakout signal (small triangle)
Step 4: CONFIRM
└─→ R2G if opened red (double confirmation)
└─→ RVol 2x+
Step 5: EXECUTE
└─→ Enter on PM High break
└─→ Stop below PM Low
Workflow 3: Micro Pullback Scalp
Step 1: FIND MOMENTUM
└─→ Stock moving, 3+ green candles
Step 2: WAIT FOR PAUSE
└─→ 1-3 red candles (brief pullback)
Step 3: ENTRY
└─→ Yellow circle signal appears
Step 4: QUICK TRADE
└─→ Enter at signal
└─→ Tight stop at pullback low
└─→ Quick target (1:1 to 2:1)
Troubleshooting
Q: Lines are moving/jumping on real-time chart?
A: This was fixed in latest version. Make sure you have the newest code. Lines now lock in place at market open.
Q: Too many signals, chart is cluttered?
A:
Turn off "Show 'Forming' Markers"
Disable modules you don't need
Use "Minimal" visual preset
Q: No signals appearing?
A:
Check if "Show Entry Signals" is ON
Make sure relevant module is enabled
Stock may not meet pattern criteria
Q: Dashboard shows wrong float?
A:
TradingView float data isn't available for all stocks
Switch Float Source to "Manual"
Enter correct float in millions
Q: PM High/Low not showing?
A:
Only appears during market hours
Needs pre-market data to calculate
Check if "Show Key Levels" is ON
Q: Quality score seems wrong?
A:
Score updates in real-time
Check individual factors in dashboard
RVol and rotation change throughout day
Q: Alert not triggering?
A:
Make sure alert is set on correct symbol
Check alert hasn't expired
Verify condition is set correctly
Quick Reference Card
Entry Signals
▲ Lime Triangle = Bull Flag Breakout
◆ Aqua Diamond = Flat Top Breakout
● Yellow Circle = Micro Pullback
▲ Green Triangle = PM High Break
↑ Lime Arrow = R2G (bullish)
↓ Red Arrow = G2R (bearish)
Dashboard Quick Read
🎯 = Entry signal active
✅ = All pillars pass
🟢 = Day is green
🔥 = Strong (gap/rotation)
✓ = Criteria met
✗ = Criteria failed
Quality Score
8-10 = A+ (Best)
6-7 = A (Good)
4-5 = B (Average)
0-3 = C (Weak)
Key Levels
Orange Line = Prior Close (R2G level)
Green Line = PM High (breakout level)
Red Line = PM Low (support)
Purple Line = VWAP
Yellow/Orange = EMA 9/20
Happy Trading! 🎯📈
For questions or issues, use TradingView's comment section on the indicator page.

Bull Flag & Flat Top Breakout DetectorBull Flag & Flat Top Detector - Quick Reference Guide
Pattern Overview
🚩 Bull Flag
╱╲
╱ ╲ ← Pullback (2-5 red candles)
╱ ╲
╱ ╲____
╱ ╲
│ │
│ THE POLE │ ← Strong upward move (3+ green candles)
│ │
└──────────────┘
What to look for:
Strong initial move (the "pole") - 3+ green candles, 3%+ move
Brief pullback - 2-5 candles, less than 50% retracement
Pullback should "drift" lower, not crash
Entry on first candle to make new high after pullback
📊 Flat Top Breakout
════════════════ ← Resistance (multiple touches)
↑ ↑ ↑
╱╲ ╱╲ ╱╲
╱ ╲╱ ╲╱ ╲ ← Consolidation
╱ ╲
╱ ╲
What to look for:
Multiple touches of same resistance level (2+)
Tight consolidation range
Each failed breakout builds pressure
Entry on convincing break above resistance with volume
Signal Types
SignalShapeColorMeaningBull Flag Breakout▲ TriangleLimeEntry signal - go longFlat Top Breakout◆ DiamondAquaEntry signal - go longBear Flag Breakout▼ TriangleRedShort entry (if enabled)Pattern Forming🚩 FlagFaded GreenBull flag developingPattern Forming■ SquareFaded BlueFlat top developing
Level Lines Explained
LineColorStyleMeaningEntryLimeSolidBreakout trigger priceStop LossRedDashedExit if price falls hereTarget 1AquaDottedFirst profit target (2R)Target 2YellowDottedSecond profit target (3R)
Info Table Reference
FieldWhat It ShowsBull FlagScanning / Forming 🚩 / Breakout ✓Flat TopScanning / Forming 📊 / Breakout ✓PullbackCandle count + retracement %Rel VolumeCurrent bar vs averageEMA 20Above ✓ or Below ✗VWAPAbove ✓ or Below ✗Green StreakConsecutive green candles (pole)ResistanceTouch count for flat top
Trading Checklist
Before Entry ✅
Pattern status shows "FORMING" or "BREAKOUT"
Price above EMA (table shows ✓)
Price above VWAP (table shows ✓)
Relative volume 1.5x+ (ideally 2x+)
Stock is in play (up 5%+ on day, has catalyst)
Market direction supportive (not fighting trend)
Entry Execution
Wait for breakout candle to form
Confirm volume spike on breakout
Enter as close to entry line as possible
Set stop loss at red dashed line
Know your target levels
Trade Management
If no immediate follow-through → consider exit ("breakout or bailout")
Take 50% off at Target 1
Move stop to breakeven
Let remainder run toward Target 2
Exit fully if price returns below entry
Bull Flag Quality Checklist
Pole Quality:
FactorIdealAcceptableAvoidGreen candles5+3-4Less than 3Move size10%+3-10%Less than 3%VolumeIncreasingSteadyDecliningCandle bodiesLargeMediumSmall/doji
Pullback Quality:
FactorIdealAcceptableAvoidCandle count2-34-56+RetracementUnder 38%38-50%Over 50%VolumeDecliningSteadyIncreasingCharacterOrderly driftChoppySharp drop
Flat Top Quality Checklist
FactorGood SetupWeak SetupTouches3+ at same levelOnly 2, widely spacedToleranceVery tight (0.2%)Loose (1%+)Duration5-15 barsToo short or too longVolumeDrying upErraticPrior trendUpSideways/down
Common Mistakes to Avoid
❌ Entering too early
Wait for actual breakout, not anticipation
"Forming" ≠ "Breakout"
❌ Ignoring volume
No volume = likely false breakout
Require 1.5x+ relative volume minimum
❌ Fighting the trend
Check EMA and VWAP status
Both should be ✓ for high probability
❌ Wide stops
Stop should be below pullback low
If stop is too wide, skip the trade
❌ Holding losers
"Breakout or bailout" - if it doesn't work, exit
Failed breakouts often reverse hard
❌ Chasing extended moves
If you missed entry, wait for next pattern
Don't chase 5+ candles after breakout
Risk Management Rules
Position Sizing
Risk Amount = Account × Risk % (typically 1-2%)
Position Size = Risk Amount ÷ (Entry - Stop)
Example:
Account: $25,000
Risk: 1% = $250
Entry: $5.00
Stop: $4.70
Risk per share: $0.30
Position Size: $250 ÷ $0.30 = 833 shares
Risk-Reward Targets
TargetR MultipleExample (risk $0.30)Target 12:1+$0.60 ($5.60)Target 23:1+$0.90 ($5.90)
Timeframe Guide
TimeframeProsConsBest For1-minMore patterns, precise entryNoisy, false signalsScalping5-minGood balance, cleaner patternsFewer signalsDay trading15-minHigh quality patternsMiss fast movesSwing entries
Settings Quick Reference
Default Settings (Balanced)
Pole: 3 candles, 3% move
Pullback: 2-5 candles, 50% max retrace
Volume: 1.5x required
Filters: EMA + VWAP ON
Aggressive Settings
Pole: 2 candles, 2% move
Pullback: 2-6 candles, 60% max retrace
Volume: 1.2x required
Filters: VWAP OFF
Conservative Settings
Pole: 4 candles, 5% move
Pullback: 2-4 candles, 40% max retrace
Volume: 2.0x required
Filters: Both ON
Alert Setup
Recommended Alerts
"Bull Flag Forming"
Get early warning as pattern develops
Prepare your position size and levels
"Bull Flag Breakout"
Primary entry alert
React quickly when triggered
"Any Bullish Breakout"
Catch both bull flags and flat tops
Good for watchlist scanning
Alert Setup Steps
Right-click chart → Add Alert
Condition: Select "Bull Flag & Flat Top Breakout Detector"
Choose alert type from dropdown
Set expiration and notification method
Troubleshooting
Q: Patterns not detecting?
Lower the Min Pole Move % setting
Reduce Min Pole Candles requirement
Check that price is in acceptable range
Q: Too many false signals?
Increase volume multiplier to 2.0x
Enable both EMA and VWAP filters
Increase Min Pole Move %
Q: Levels not showing?
Enable "Show Entry Line", "Show Stop Loss", "Show Targets"
Check "Max Patterns to Display" setting
Q: Info table not visible?
Enable "Show Info Table" in settings
Try different table position
Pattern Combinations
Best Setups (A+ Quality)
Bull flag on a gap day (Gap & Go → Bull Flag)
Flat top at pre-market high resistance
Pattern forming above VWAP with 5x+ volume
Avoid These
Bull flag below VWAP
Flat top in downtrending stock
Low volume patterns
Patterns late in the day (after 2pm)
Daily Routine
Pre-Market (7-9am)
Build watchlist of gappers (5%+, high volume)
Apply indicator to top 3-5 candidates
Note pre-market levels
Market Open (9:30-10:30am)
Watch for "FORMING" status on watchlist
Prepare entries as patterns develop
Execute on breakout signals
Manage trades according to plan
Midday (10:30am-2pm)
Look for second-wave patterns
Be more selective (less momentum)
Consider tighter stops
Close (2-4pm)
Generally avoid new patterns
Manage existing positions
Review day's trades

Triple-EMA Cloud (3× configurable EMAs + timeframe + fill)About This Script
Name: Triple-EMA Cloud (3× configurable EMAs + timeframe + fill)
What it does:
The script plots three Exponential Moving Averages (EMAs) on your chart.
You can set each EMA’s length (how many bars or days it averages over), source (for example, closing price, opening price, or the midpoint of high + low), and timeframe (you can have one EMA use daily data, another hourly data, etc.).
The indicator draws a “cloud” or channel by shading the area between the outermost two EMAs of the three. This lets you see a band or zone that the price is moving in, defined by those EMAs.
You also get full control over how each of the three EMA‐lines looks: color, thickness, transparency, and plot style (solid line, steps, circles, etc.).
How to Use It (for Beginners)
Here’s how a trader who’s new to charts can use this tool, especially when looking for pullbacks or undercut price action.
Key Concepts
Trend: Imagine the market price is generally going up or down. EMAs are a way to smooth out price movements so you can see the trend more clearly.
Pullback: When a price has been going up (an uptrend), sometimes it dips down a little before going up again. That dip is the pullback. It’s a chance to enter or add to a position at a “better price.”
Undercut: This is when price drops below an important level (for example an EMA) and then comes back up. It looks like it broke below, but then it recovers. That may show reverse pressure or strength building.
How the Script Helps With Pullbacks & Undercuts
Marking Trend Zones with the Cloud
The cloud between the outer EMA lines gives you a zone of expected support/resistance. If the price is above the cloud, that zone can act like a “floor” in uptrends; if it is below, the cloud might act like a “ceiling” in downtrends.
Watching Price vs the EMAs
If the price pulls back toward the cloud (or toward one of the EMAs) and then bounces back up, that’s a signal that the uptrend might continue.
If the price undercuts (goes a bit below) one of the EMAs or the cloud and then returns above it, that can also be a signal. It suggests that even though there was a temporary drop, buyers stepped in.
Using the Three EMAs for Confirmation
Because the script uses three EMAs, you can see how tightly or loosely they are spaced.
If all three EMAs are broadly aligned (for example, in an uptrend: shorter length above longer length, each pulling from reliable price source), that gives more confidence in trend strength.
If the middle EMA (or different source/timeframe) is holding up as support while others are above, it strengthens signal.
Entry & Exit Points
Entry: For example, after a pullback toward the cloud or “mid‐EMA”, wait for price to show a bounce up. That could be a better entry than buying at the top.
Stop Loss / Risk: You might place a stop loss just below the cloud or the lowest of your selected EMAs so that if price breaks through, the idea is invalidated.
Profit Target: Could be a recent high, resistance level, or a fixed reward-risk multiple (for example aiming to make twice what you risked).
Practical Steps for New Traders
Set up the EMAs
Choose simple lengths like 10, 21, 50.
For example, EMA #1 = length 10, source Close, timeframe “current chart”; EMA #2 = length 21, source (H+L)/2; EMA #3 = length 50, maybe timeframe daily.
Observe the Price Action
When price moves up, then dips, see if it comes back near the shaded cloud or one of the EMAs.
See if the dip touches the EMAs lightly (not a big drop) and then price starts climbing again.
Look for undercuts
If price briefly goes below a line (or below cloud) and then closes back above, that’s undercut + recovery. That bounce back is often meaningful.
Manage risk
Only put in money you can afford to lose.
Use small position size until you get comfortable.
Use stop-loss (as mentioned) in case the price doesn’t bounce as expected.
Practice
Put this indicator on charts (stocks you follow) in past time periods. See how price behaved with pullbacks / undercuts relative to the EMAs & cloud. This helps you learn to see signals.
What It Doesn’t Do (and What to Be Careful Of)
It doesn’t predict the future — it simply shows zones and trends. Price can still break down through the cloud.
In a “choppy” market (i.e. when price is going up and down without a clear trend), signals from EMAs / clouds are less reliable. You’ll get more “false bounces.”
Under / overshoots & big news events can break through clean levels, so always watch for confirmation (volume, price behavior) before putting big money in.

Custom Candlestick Pattern IndicatorCustom Candlestick Pattern Indicator - Buy Signal Based on Green Candles Breaking Previous Lows
Overview:
This custom candlestick pattern indicator is designed to highlight potential buy opportunities based on a simple yet powerful candlestick pattern. The indicator identifies green candles that break below the low of the previous candle. This combination may signal a potential market reversal or a bullish continuation after a pullback, depending on the market context. Traders can use this indicator to detect areas where prices may be bouncing from recent lows, indicating a potential buying opportunity.
Pattern Explanation:
The strategy underlying this indicator is a two-part condition that must be met before a buy signal is generated:
Green Candle: A green candle forms when the closing price of the current candle is higher than its opening price. This visually represents bullish momentum as buyers have taken control, closing the price higher than where it opened.
Breaking the Previous Low: The low of the current candle must be lower than the low of the previous candle. This suggests that, despite initial bearish pressure during the candle formation (which drove the price below the previous candle's low), buyers stepped in to push the price higher by the candle’s close. This pattern can signify a potential reversal or bullish continuation, as it demonstrates that buyers are overcoming initial selling pressure.
When the Pattern Occurs:
This pattern is particularly interesting to traders who look for potential reversal signals after a brief decline in price.
It may also work well in markets where pullbacks are common, as this pattern could mark the end of a retracement and the resumption of the bullish trend.
How the Indicator Works:
Green Candle: The indicator first identifies a green candle, where the close of the candle is greater than its open (close > open). This signals that the current period closed higher than it opened, which is generally a bullish sign.
Breaking Previous Low: The indicator checks if the current candle's low is below the low of the previous candle (low < low ). If this condition is met, it means the price dropped below the previous candle's low but was still able to close higher (green candle), signaling a potential reversal or buying opportunity.
Buy Signal: If both conditions are true (green candle + breaking previous low), the indicator plots a buy signal below the candle in the form of an upward-facing triangle labeled "Buy" in green. This serves as a visual cue for traders to consider entering a buy position.
Optional Previous Low Plot: For added reference, the indicator plots the previous candle's low as a red step-line on the chart. This helps traders visualize when the price has dipped below the prior candle's low, making it easier to spot instances where the pattern is forming.
How to Use:
This indicator can be used across multiple timeframes, whether you’re trading short-term intraday patterns or longer-term swing trades.
It works well in markets that experience pullbacks or minor retracements, as the pattern it identifies suggests a rejection of lower prices followed by a push higher.
Traders can combine this indicator with other technical analysis tools (such as moving averages, support/resistance levels, or momentum oscillators) to strengthen the buy signals and add more context to the trading decision.
Example Scenarios:
Reversal Signal: Suppose a market has been in a minor downtrend, and suddenly a green candle forms after a low that breaks the previous day’s low. This indicator would generate a buy signal, suggesting the downtrend may be losing strength and that buyers are taking control. This could be an early indication of a reversal.
Bullish Continuation After Pullback: Imagine a market in a steady uptrend experiences a temporary pullback. The price breaks the previous candle’s low, but the current candle closes higher (green candle). This buy signal could indicate that the pullback is over, and the uptrend is likely to continue.
Advantages:
Simplicity: This indicator relies on basic price action (green candles and lows) without requiring complicated indicators or oscillators, making it easy to understand and use.
Visual Alerts: The plotted buy signals and previous lows provide a clear, visual representation on the chart, simplifying decision-making for traders.
Versatility: It can be applied across different timeframes and asset classes (stocks, forex, crypto, etc.), making it a versatile tool for all kinds of traders.
Limitations:
As with any single indicator or pattern, this should not be used in isolation. It is important to incorporate broader market context, support/resistance levels, and other forms of analysis to avoid false signals.
The pattern tends to be more effective when there’s sufficient market liquidity and may perform better in trending or volatile markets compared to sideways or flat markets.

Xtrender and TSI FusionXtrender and TSI Fusion Indicator
I created this indicator for myself. I was inspired by the indicators created by Bjorgum, Duyck and QuantTherapy and decided to create multiple indicators that either work well combined with their indicators or something new that applies some of their indicator concepts. I decided to share all of the indicator I have created because I believe in learning and earing together as a community. If you guys have any questions or suggestions write them.
Overview: The Xtrender and TSI Fusion Indicator is a powerful tool designed to help traders analyze market momentum, trends, and potential reversals. By combining Xtrender with the True Strength Index (TSI), this indicator provides a comprehensive view of market dynamics, making it easier to identify trading opportunities.
Image: Timeframe is set to daily
Features:
1.Xtrender Analysis:
Short-Term Xtrender: Visualizes short-term momentum using RSI-based calculations on EMA differences. This helps in identifying immediate market trends and pullbacks.
Image above: showcases Short-Term Xtrender
Xtrender T3: A smoothed version of the Xtrender that reduces noise and highlights significant trend changes.
Image above: showcases Xtrender T3 with Xtrender T3 color
2.TSI (True Strength Index):
TSI Value: Measures momentum by comparing price changes over two time periods, offering a clear view of trend strength.
TSI Signal Line: A smoothed version of the TSI value, used to generate buy and sell signals when crossed by the TSI.
Image: showcases TSI Value with TSI Signal Line
TSI Histogram: Shows the difference between the TSI and its signal line, highlighting potential reversals and trend continuations.
Image: showcases TSI Histogram
3.Color Coding and Visual Cues:
Trend Colors: The indicator uses dynamic colors to represent bullish or bearish conditions, making it easy to interpret market sentiment.
Background Color : The background changes color based on TSI signals, further aiding in visual trend analysis.
Image: showcases Background color and Zero line
How to Use
1.Xtrender Analysis:
Short-Term Xtrender: The short-term Xtrender is plotted as columns, changing color based on its direction and value. Green or lime indicates positive momentum, while red or maroon indicates negative momentum.
Xtrender T3: The Xtrender T3 line (black) represents a smoothed version of the short-term Xtrender, providing a clearer picture of the overall trend. The color of this line changes based on the Xtrender's value, helping you spot potential trend changes.
2.TSI (True Strength Index):
TSI Value and Signal Line: The TSI value is plotted as a line, with its color changing based on its relationship to the signal line. A crossover of the TSI above the signal line suggests a potential bullish move, while a crossover below indicates a bearish trend.
TSI Histogram: The histogram represents the difference between the TSI and its signal line. Positive values indicate bullish momentum, while negative values suggest bearish momentum.
3.Background Color:
The background color changes based on the TSI signal, with a greenish hue indicating bullish conditions and a reddish hue indicating bearish conditions. This provides a quick visual reference for market sentiment.
4.Zero Line:
A horizontal gray dotted line at the zero level helps you easily identify when the Xtrender or TSI crosses into positive or negative territory, signaling potential trend shifts.
Image above: Timeframe on daily with the individual elements combined
Example of Use:
•Trend Confirmation: Use the Xtrender and Xtrender T3 to confirm the direction of the trend. If both are aligned with the same color and direction, it increases the probability of a strong trend.
•Momentum Reversals: Watch for TSI crosses and histogram shifts to identify potential reversals. For example, a TSI crossover above its signal line with a corresponding change in the histogram from negative to positive could signal a buying opportunity.
•Pullbacks: Identify pullbacks within a trend by observing temporary shifts in the short-term Xtrender or TSI histogram. Use these signals to enter trades in the direction of the overall trend.
Image above: Showcases, Trend confirmation, reversal and pullbacks on daily timeframe.
Customization:
•TSI Speed: Choose between "Fast" and "Slow" TSI settings based on your trading style. Fast settings are more responsive to price changes, while slow settings offer smoother signals.
•Color Settings: Customize the colors for bullish, bearish, and neutral TSI conditions to match your personal preferences or chart theme.
This indicator is versatile and can be used for various trading strategies, from trend following to momentum trading, making it a valuable tool in any trader's arsenal.
My Scripts/Indicators/Ideas /Systems that I share are only for educational purposes

Trend Pivot Retracements▶ OVERVIEW
Trend Pivot Retracements identifies market trend direction using a Donchian-style channel and dynamically highlights retracement zones during trending conditions. It calculates the percentage pullbacks from recent highs and lows, plots labeled zones with varying intensity, and visually connects key retracement pivots. The indicator also emphasizes price proximity to trend boundaries by dynamically adjusting the thickness of plotted trend bands.
▶ TREND DETECTION & BAND STRUCTURE
The indicator determines the current trend by checking for new 50-bar extremes:
Uptrend: If a new highest high is made, the trend is considered bullish.
Downtrend: If a new lowest low is made, the trend is considered bearish.
Uptrend Band: Plots the 50-bar lowest low as a trailing support level.
Downtrend Band: Plots the 50-bar highest high as a trailing resistance level.
Thickness Variation: The thickness of the band increases the further price moves from it, indicating overextension.
▶ RETRACEMENT LABELING SYSTEM
During a trend, the indicator monitors pivot points in the opposite direction to measure retracements:
Bullish Retracement:
Triggered when a pivot low forms during an uptrend.
Measures % pullback from the most recent swing high (searched up to 20 bars back).
Plots a bold horizontal line at the low and a dashed diagonal from the previous swing high.
Adds a “-%” label above the low; intensity is based on recent 50 pullbacks.
Bearish Retracement:
Triggered when a pivot high forms during a downtrend.
Measures % pullback from the previous swing low (up to 20 bars back).
Plots a bold horizontal line at the high and a dashed diagonal from the prior swing low.
Adds a “%” label below the high with gradient color based on the past 50 extremes.
▶ PIVOT CONNECTION LINES
Each retracement includes a visual connector:
A diagonal dashed line linking the swing extreme (20 bars back) to the retracement point.
This line visually traces the path of price retreat within the trend.
Helps traders understand where the retracement originated and how steep it was.
▶ TREND SWITCH SIGNALS
When trend direction changes:
A diamond marker is plotted on the new pivot confirming the trend shift.
Green diamonds signal new bullish trends at fresh lows.
Magenta diamonds signal new bearish trends at fresh highs.
▶ COLOR INTENSITY & CONTEXTUAL AWARENESS
To help interpret the magnitude of retracements:
The % labels are color-coded using a gradient scale that references the max of the last 50 pullbacks.
Stronger pullbacks result in deeper color intensity, signaling more significant corrections.
Trend bands also use standard deviation normalization to adjust line thickness based on how far price has moved from the band.
This creates a visual cue for potential exhaustion or volatility extremes.
▶ USAGE
Trend Pivot Retracements is a powerful tool for traders who want to:
Identify trend direction and contextual pullbacks within those trends.
Spot key retracement points that may serve as entry opportunities or reversal signals.
Use visual retracement angles to understand market pressure and trend maturity.
Read dynamic band thickness as an alert for price stretch, potential mean reversion, or breakout setups.
▶ CONCLUSION
Trend Pivot Retracements gives traders a clean, visually expressive way to monitor trending markets, while capturing and labeling meaningful retracements. With adaptive color intensity, diagonal connectors, and smart trend switching, it enhances situational awareness and provides immediate clarity on trend health and pullback strength.

Keltner Channel Enhanced [DCAUT]█ Keltner Channel Enhanced
📊 ORIGINALITY & INNOVATION
The Keltner Channel Enhanced represents an important advancement over standard Keltner Channel implementations by introducing dual flexibility in moving average selection for both the middle band and ATR calculation. While traditional Keltner Channels typically use EMA for the middle band and RMA (Wilder's smoothing) for ATR, this enhanced version provides access to 25+ moving average algorithms for both components, enabling traders to fine-tune the indicator's behavior to match specific market characteristics and trading approaches.
Key Advancements:
Dual MA Algorithm Flexibility: Independent selection of moving average types for middle band (25+ options) and ATR smoothing (25+ options), allowing optimization of both trend identification and volatility measurement separately
Enhanced Trend Sensitivity: Ability to use faster algorithms (HMA, T3) for middle band while maintaining stable volatility measurement with traditional ATR smoothing, or vice versa for different trading strategies
Adaptive Volatility Measurement: Choice of ATR smoothing algorithm affects channel responsiveness to volatility changes, from highly reactive (SMA, EMA) to smoothly adaptive (RMA, TEMA)
Comprehensive Alert System: Five distinct alert conditions covering breakouts, trend changes, and volatility expansion, enabling automated monitoring without constant chart observation
Multi-Timeframe Compatibility: Works effectively across all timeframes from intraday scalping to long-term position trading, with independent optimization of trend and volatility components
This implementation addresses key limitations of standard Keltner Channels: fixed EMA/RMA combination may not suit all market conditions or trading styles. By decoupling the trend component from volatility measurement and allowing independent algorithm selection, traders can create highly customized configurations for specific instruments and market phases.
📐 MATHEMATICAL FOUNDATION
Keltner Channel Enhanced uses a three-component calculation system that combines a flexible moving average middle band with ATR-based (Average True Range) upper and lower channels, creating volatility-adjusted trend-following bands.
Core Calculation Process:
1. Middle Band (Basis) Calculation:
The basis line is calculated using the selected moving average algorithm applied to the price source over the specified period:
basis = ma(source, length, maType)
Supported algorithms include EMA (standard choice, trend-biased), SMA (balanced and symmetric), HMA (reduced lag), WMA, VWMA, TEMA, T3, KAMA, and 17+ others.
2. Average True Range (ATR) Calculation:
ATR measures market volatility by calculating the average of true ranges over the specified period:
trueRange = max(high - low, abs(high - close ), abs(low - close ))
atrValue = ma(trueRange, atrLength, atrMaType)
ATR smoothing algorithm significantly affects channel behavior, with options including RMA (standard, very smooth), SMA (moderate smoothness), EMA (fast adaptation), TEMA (smooth yet responsive), and others.
3. Channel Calculation:
Upper and lower channels are positioned at specified multiples of ATR from the basis:
upperChannel = basis + (multiplier × atrValue)
lowerChannel = basis - (multiplier × atrValue)
Standard multiplier is 2.0, providing channels that dynamically adjust width based on market volatility.
Keltner Channel vs. Bollinger Bands - Key Differences:
While both indicators create volatility-based channels, they use fundamentally different volatility measures:
Keltner Channel (ATR-based):
Uses Average True Range to measure actual price movement volatility
Incorporates gaps and limit moves through true range calculation
More stable in trending markets, less prone to extreme compression
Better reflects intraday volatility and trading range
Typically fewer band touches, making touches more significant
More suitable for trend-following strategies
Bollinger Bands (Standard Deviation-based):
Uses statistical standard deviation to measure price dispersion
Based on closing prices only, doesn't account for intraday range
Can compress significantly during consolidation (squeeze patterns)
More touches in ranging markets
Better suited for mean-reversion strategies
Provides statistical probability framework (95% within 2 standard deviations)
Algorithm Combination Effects:
The interaction between middle band MA type and ATR MA type creates different indicator characteristics:
Trend-Focused Configuration (Fast MA + Slow ATR): Middle band uses HMA/EMA/T3, ATR uses RMA/TEMA, quick trend changes with stable channel width, suitable for trend-following
Volatility-Focused Configuration (Slow MA + Fast ATR): Middle band uses SMA/WMA, ATR uses EMA/SMA, stable trend with dynamic channel width, suitable for volatility trading
Balanced Configuration (Standard EMA/RMA): Classic Keltner Channel behavior, time-tested combination, suitable for general-purpose trend following
Adaptive Configuration (KAMA + KAMA): Self-adjusting indicator responding to efficiency ratio, suitable for markets with varying trend strength and volatility regimes
📊 COMPREHENSIVE SIGNAL ANALYSIS
Keltner Channel Enhanced provides multiple signal categories optimized for trend-following and breakout strategies.
Channel Position Signals:
Upper Channel Interaction:
Price Touching Upper Channel: Strong bullish momentum, price moving more than typical volatility range suggests, potential continuation signal in established uptrends
Price Breaking Above Upper Channel: Exceptional strength, price exceeding normal volatility expectations, consider adding to long positions or tightening trailing stops
Price Riding Upper Channel: Sustained strong uptrend, characteristic of powerful bull moves, stay with trend and avoid premature profit-taking
Price Rejection at Upper Channel: Momentum exhaustion signal, consider profit-taking on longs or waiting for pullback to middle band for reentry
Lower Channel Interaction:
Price Touching Lower Channel: Strong bearish momentum, price moving more than typical volatility range suggests, potential continuation signal in established downtrends
Price Breaking Below Lower Channel: Exceptional weakness, price exceeding normal volatility expectations, consider adding to short positions or protecting against further downside
Price Riding Lower Channel: Sustained strong downtrend, characteristic of powerful bear moves, stay with trend and avoid premature covering
Price Rejection at Lower Channel: Momentum exhaustion signal, consider covering shorts or waiting for bounce to middle band for reentry
Middle Band (Basis) Signals:
Trend Direction Confirmation:
Price Above Basis: Bullish trend bias, middle band acts as dynamic support in uptrends, consider long positions or holding existing longs
Price Below Basis: Bearish trend bias, middle band acts as dynamic resistance in downtrends, consider short positions or avoiding longs
Price Crossing Above Basis: Potential trend change from bearish to bullish, early signal to establish long positions
Price Crossing Below Basis: Potential trend change from bullish to bearish, early signal to establish short positions or exit longs
Pullback Trading Strategy:
Uptrend Pullback: Price pulls back from upper channel to middle band, finds support, and resumes upward, ideal long entry point
Downtrend Bounce: Price bounces from lower channel to middle band, meets resistance, and resumes downward, ideal short entry point
Basis Test: Strong trends often show price respecting the middle band as support/resistance on pullbacks
Failed Test: Price breaking through middle band against trend direction signals potential reversal
Volatility-Based Signals:
Narrow Channels (Low Volatility):
Consolidation Phase: Channels contract during periods of reduced volatility and directionless price action
Breakout Preparation: Narrow channels often precede significant directional moves as volatility cycles
Trading Approach: Reduce position sizes, wait for breakout confirmation, avoid range-bound strategies within channels
Breakout Direction: Monitor for price breaking decisively outside channel range with expanding width
Wide Channels (High Volatility):
Trending Phase: Channels expand during strong directional moves and increased volatility
Momentum Confirmation: Wide channels confirm genuine trend with substantial volatility backing
Trading Approach: Trend-following strategies excel, wider stops necessary, mean-reversion strategies risky
Exhaustion Signs: Extreme channel width (historical highs) may signal approaching consolidation or reversal
Advanced Pattern Recognition:
Channel Walking Pattern:
Upper Channel Walk: Price consistently touches or exceeds upper channel while staying above basis, very strong uptrend signal, hold longs aggressively
Lower Channel Walk: Price consistently touches or exceeds lower channel while staying below basis, very strong downtrend signal, hold shorts aggressively
Basis Support/Resistance: During channel walks, price typically uses middle band as support/resistance on minor pullbacks
Pattern Break: Price crossing basis during channel walk signals potential trend exhaustion
Squeeze and Release Pattern:
Squeeze Phase: Channels narrow significantly, price consolidates near middle band, volatility contracts
Direction Clues: Watch for price positioning relative to basis during squeeze (above = bullish bias, below = bearish bias)
Release Trigger: Price breaking outside narrow channel range with expanding width confirms breakout
Follow-Through: Measure squeeze height and project from breakout point for initial profit targets
Channel Expansion Pattern:
Breakout Confirmation: Rapid channel widening confirms volatility increase and genuine trend establishment
Entry Timing: Enter positions early in expansion phase before trend becomes overextended
Risk Management: Use channel width to size stops appropriately, wider channels require wider stops
Basis Bounce Pattern:
Clean Bounce: Price touches middle band and immediately reverses, confirms trend strength and entry opportunity
Multiple Bounces: Repeated basis bounces indicate strong, sustainable trend
Bounce Failure: Price penetrating basis signals weakening trend and potential reversal
Divergence Analysis:
Price/Channel Divergence: Price makes new high/low while staying within channel (not reaching outer band), suggests momentum weakening
Width/Price Divergence: Price breaks to new extremes but channel width contracts, suggests move lacks conviction
Reversal Signal: Divergences often precede trend reversals or significant consolidation periods
Multi-Timeframe Analysis:
Keltner Channels work particularly well in multi-timeframe trend-following approaches:
Three-Timeframe Alignment:
Higher Timeframe (Weekly/Daily): Identify major trend direction, note price position relative to basis and channels
Intermediate Timeframe (Daily/4H): Identify pullback opportunities within higher timeframe trend
Lower Timeframe (4H/1H): Time precise entries when price touches middle band or lower channel (in uptrends) with rejection
Optimal Entry Conditions:
Best Long Entries: Higher timeframe in uptrend (price above basis), intermediate timeframe pulls back to basis, lower timeframe shows rejection at middle band or lower channel
Best Short Entries: Higher timeframe in downtrend (price below basis), intermediate timeframe bounces to basis, lower timeframe shows rejection at middle band or upper channel
Risk Management: Use higher timeframe channel width to set position sizing, stops below/above higher timeframe channels
🎯 STRATEGIC APPLICATIONS
Keltner Channel Enhanced excels in trend-following and breakout strategies across different market conditions.
Trend Following Strategy:
Setup Requirements:
Identify established trend with price consistently on one side of basis line
Wait for pullback to middle band (basis) or brief penetration through it
Confirm trend resumption with price rejection at basis and move back toward outer channel
Enter in trend direction with stop beyond basis line
Entry Rules:
Uptrend Entry:
Price pulls back from upper channel to middle band, shows support at basis (bullish candlestick, momentum divergence)
Enter long on rejection/bounce from basis with stop 1-2 ATR below basis
Aggressive: Enter on first touch; Conservative: Wait for confirmation candle
Downtrend Entry:
Price bounces from lower channel to middle band, shows resistance at basis (bearish candlestick, momentum divergence)
Enter short on rejection/reversal from basis with stop 1-2 ATR above basis
Aggressive: Enter on first touch; Conservative: Wait for confirmation candle
Trend Management:
Trailing Stop: Use basis line as dynamic trailing stop, exit if price closes beyond basis against position
Profit Taking: Take partial profits at opposite channel, move stops to basis
Position Additions: Add to winners on subsequent basis bounces if trend intact
Breakout Strategy:
Setup Requirements:
Identify consolidation period with contracting channel width
Monitor price action near middle band with reduced volatility
Wait for decisive breakout beyond channel range with expanding width
Enter in breakout direction after confirmation
Breakout Confirmation:
Price breaks clearly outside channel (upper for longs, lower for shorts), channel width begins expanding from contracted state
Volume increases significantly on breakout (if using volume analysis)
Price sustains outside channel for multiple bars without immediate reversal
Entry Approaches:
Aggressive: Enter on initial break with stop at opposite channel or basis, use smaller position size
Conservative: Wait for pullback to broken channel level, enter on rejection and resumption, tighter stop
Volatility-Based Position Sizing:
Adjust position sizing based on channel width (ATR-based volatility):
Wide Channels (High ATR): Reduce position size as stops must be wider, calculate position size using ATR-based risk calculation: Risk / (Stop Distance in ATR × ATR Value)
Narrow Channels (Low ATR): Increase position size as stops can be tighter, be cautious of impending volatility expansion
ATR-Based Risk Management: Use ATR-based risk calculations, position size = 0.01 × Capital / (2 × ATR), use multiples of ATR (1-2 ATR) for adaptive stops
Algorithm Selection Guidelines:
Different market conditions benefit from different algorithm combinations:
Strong Trending Markets: Middle band use EMA or HMA, ATR use RMA, capture trends quickly while maintaining stable channel width
Choppy/Ranging Markets: Middle band use SMA or WMA, ATR use SMA or WMA, avoid false trend signals while identifying genuine reversals
Volatile Markets: Middle band and ATR both use KAMA or FRAMA, self-adjusting to changing market conditions reduces manual optimization
Breakout Trading: Middle band use SMA, ATR use EMA or SMA, stable trend with dynamic channels highlights volatility expansion early
Scalping/Day Trading: Middle band use HMA or T3, ATR use EMA or TEMA, both components respond quickly
Position Trading: Middle band use EMA/TEMA/T3, ATR use RMA or TEMA, filter out noise for long-term trend-following
📋 DETAILED PARAMETER CONFIGURATION
Understanding and optimizing parameters is essential for adapting Keltner Channel Enhanced to specific trading approaches.
Source Parameter:
Close (Most Common): Uses closing price, reflects daily settlement, best for end-of-day analysis and position trading, standard choice
HL2 (Median Price): Smooths out closing bias, better represents full daily range in volatile markets, good for swing trading
HLC3 (Typical Price): Gives more weight to close while including full range, popular for intraday applications, slightly more responsive than HL2
OHLC4 (Average Price): Most comprehensive price representation, smoothest option, good for gap-prone markets or highly volatile instruments
Length Parameter:
Controls the lookback period for middle band (basis) calculation:
Short Periods (10-15): Very responsive to price changes, suitable for day trading and scalping, higher false signal rate
Standard Period (20 - Default): Represents approximately one month of trading, good balance between responsiveness and stability, suitable for swing and position trading
Medium Periods (30-50): Smoother trend identification, fewer false signals, better for position trading and longer holding periods
Long Periods (50+): Very smooth, identifies major trends only, minimal false signals but significant lag, suitable for long-term investment
Optimization by Timeframe: 1-15 minute charts use 10-20 period, 30-60 minute charts use 20-30 period, 4-hour to daily charts use 20-40 period, weekly charts use 20-30 weeks.
ATR Length Parameter:
Controls the lookback period for Average True Range calculation, affecting channel width:
Short ATR Periods (5-10): Very responsive to recent volatility changes, standard is 10 (Keltner's original specification), may be too reactive in whipsaw conditions
Standard ATR Period (10 - Default): Chester Keltner's original specification, good balance between responsiveness and stability, most widely used
Medium ATR Periods (14-20): Smoother channel width, ATR 14 aligns with Wilder's original ATR specification, good for position trading
Long ATR Periods (20+): Very smooth channel width, suitable for long-term trend-following
Length vs. ATR Length Relationship: Equal values (20/20) provide balanced responsiveness, longer ATR (20/14) gives more stable channel width, shorter ATR (20/10) is standard configuration, much shorter ATR (20/5) creates very dynamic channels.
Multiplier Parameter:
Controls channel width by setting ATR multiples:
Lower Values (1.0-1.5): Tighter channels with frequent price touches, more trading signals, higher false signal rate, better for range-bound and mean-reversion strategies
Standard Value (2.0 - Default): Chester Keltner's recommended setting, good balance between signal frequency and reliability, suitable for both trending and ranging strategies
Higher Values (2.5-3.0): Wider channels with less frequent touches, fewer but potentially higher-quality signals, better for strong trending markets
Market-Specific Optimization: High volatility markets (crypto, small-caps) use 2.5-3.0 multiplier, medium volatility markets (major forex, large-caps) use 2.0 multiplier, low volatility markets (bonds, utilities) use 1.5-2.0 multiplier.
MA Type Parameter (Middle Band):
Critical selection that determines trend identification characteristics:
EMA (Exponential Moving Average - Default): Standard Keltner Channel choice, Chester Keltner's original specification, emphasizes recent prices, faster response to trend changes, suitable for all timeframes
SMA (Simple Moving Average): Equal weighting of all data points, no directional bias, slower than EMA, better for ranging markets and mean-reversion
HMA (Hull Moving Average): Minimal lag with smooth output, excellent for fast trend identification, best for day trading and scalping
TEMA (Triple Exponential Moving Average): Advanced smoothing with reduced lag, responsive to trends while filtering noise, suitable for volatile markets
T3 (Tillson T3): Very smooth with minimal lag, excellent for established trend identification, suitable for position trading
KAMA (Kaufman Adaptive Moving Average): Automatically adjusts speed based on market efficiency, slow in ranging markets, fast in trends, suitable for markets with varying conditions
ATR MA Type Parameter:
Determines how Average True Range is smoothed, affecting channel width stability:
RMA (Wilder's Smoothing - Default): J. Welles Wilder's original ATR smoothing method, very smooth, slow to adapt to volatility changes, provides stable channel width
SMA (Simple Moving Average): Equal weighting, moderate smoothness, faster response to volatility changes than RMA, more dynamic channel width
EMA (Exponential Moving Average): Emphasizes recent volatility, quick adaptation to new volatility regimes, very responsive channel width changes
TEMA (Triple Exponential Moving Average): Smooth yet responsive, good balance for varying volatility, suitable for most trading styles
Parameter Combination Strategies:
Conservative Trend-Following: Length 30/ATR Length 20/Multiplier 2.5, MA Type EMA or TEMA/ATR MA Type RMA, smooth trend with stable wide channels, suitable for position trading
Standard Balanced Approach: Length 20/ATR Length 10/Multiplier 2.0, MA Type EMA/ATR MA Type RMA, classic Keltner Channel configuration, suitable for general purpose swing trading
Aggressive Day Trading: Length 10-15/ATR Length 5-7/Multiplier 1.5-2.0, MA Type HMA or EMA/ATR MA Type EMA or SMA, fast trend with dynamic channels, suitable for scalping and day trading
Breakout Specialist: Length 20-30/ATR Length 5-10/Multiplier 2.0, MA Type SMA or WMA/ATR MA Type EMA or SMA, stable trend with responsive channel width
Adaptive All-Conditions: Length 20/ATR Length 10/Multiplier 2.0, MA Type KAMA or FRAMA/ATR MA Type KAMA or TEMA, self-adjusting to market conditions
Offset Parameter:
Controls horizontal positioning of channels on chart. Positive values shift channels to the right (future) for visual projection, negative values shift left (past) for historical analysis, zero (default) aligns with current price bars for real-time signal analysis. Offset affects only visual display, not alert conditions or actual calculations.
📈 PERFORMANCE ANALYSIS & COMPETITIVE ADVANTAGES
Keltner Channel Enhanced provides improvements over standard implementations while maintaining proven effectiveness.
Response Characteristics:
Standard EMA/RMA Configuration: Moderate trend lag (approximately 0.4 × length periods), smooth and stable channel width from RMA smoothing, good balance for most market conditions
Fast HMA/EMA Configuration: Approximately 60% reduction in trend lag compared to EMA, responsive channel width from EMA ATR smoothing, suitable for quick trend changes and breakouts
Adaptive KAMA/KAMA Configuration: Variable lag based on market efficiency, automatic adjustment to trending vs. ranging conditions, self-optimizing behavior reduces manual intervention
Comparison with Traditional Keltner Channels:
Enhanced Version Advantages:
Dual Algorithm Flexibility: Independent MA selection for trend and volatility vs. fixed EMA/RMA, separate tuning of trend responsiveness and channel stability
Market Adaptation: Choose configurations optimized for specific instruments and conditions, customize for scalping, swing, or position trading preferences
Comprehensive Alerts: Enhanced alert system including channel expansion detection
Traditional Version Advantages:
Simplicity: Fewer parameters, easier to understand and implement
Standardization: Fixed EMA/RMA combination ensures consistency across users
Research Base: Decades of backtesting and research on standard configuration
When to Use Enhanced Version: Trading multiple instruments with different characteristics, switching between trending and ranging markets, employing different strategies, algorithm-based trading systems requiring customization, seeking optimization for specific trading style and timeframe.
When to Use Standard Version: Beginning traders learning Keltner Channel concepts, following published research or trading systems, preferring simplicity and standardization, wanting to avoid optimization and curve-fitting risks.
Performance Across Market Conditions:
Strong Trending Markets: EMA or HMA basis with RMA or TEMA ATR smoothing provides quicker trend identification, pullbacks to basis offer excellent entry opportunities
Choppy/Ranging Markets: SMA or WMA basis with RMA ATR smoothing and lower multipliers, channel bounce strategies work well, avoid false breakouts
Volatile Markets: KAMA or FRAMA with EMA or TEMA, adaptive algorithms excel by automatic adjustment, wider multipliers (2.5-3.0) accommodate large price swings
Low Volatility/Consolidation: Channels narrow significantly indicating consolidation, algorithm choice less impactful, focus on detecting channel width contraction for breakout preparation
Keltner Channel vs. Bollinger Bands - Usage Comparison:
Favor Keltner Channels When: Trend-following is primary strategy, trading volatile instruments with gaps, want ATR-based volatility measurement, prefer fewer higher-quality channel touches, seeking stable channel width during trends.
Favor Bollinger Bands When: Mean-reversion is primary strategy, trading instruments with limited gaps, want statistical framework based on standard deviation, need squeeze patterns for breakout identification, prefer more frequent trading opportunities.
Use Both Together: Bollinger Band squeeze + Keltner Channel breakout is powerful combination, price outside Bollinger Bands but inside Keltner Channels indicates moderate signal, price outside both indicates very strong signal, Bollinger Bands for entries and Keltner Channels for trend confirmation.
Limitations and Considerations:
General Limitations:
Lagging Indicator: All moving averages lag price, even with reduced-lag algorithms
Trend-Dependent: Works best in trending markets, less effective in choppy conditions
No Direction Prediction: Indicates volatility and deviation, not future direction, requires confirmation
Enhanced Version Specific Considerations:
Optimization Risk: More parameters increase risk of curve-fitting historical data
Complexity: Additional choices may overwhelm beginning traders
Backtesting Challenges: Different algorithms produce different historical results
Mitigation Strategies:
Use Confirmation: Combine with momentum indicators (RSI, MACD), volume, or price action
Test Parameter Robustness: Ensure parameters work across range of values, not just optimized ones
Multi-Timeframe Analysis: Confirm signals across different timeframes
Proper Risk Management: Use appropriate position sizing and stops
Start Simple: Begin with standard EMA/RMA before exploring alternatives
Optimal Usage Recommendations:
For Maximum Effectiveness:
Start with standard EMA/RMA configuration to understand classic behavior
Experiment with alternatives on demo account or paper trading
Match algorithm combination to market condition and trading style
Use channel width analysis to identify market phases
Combine with complementary indicators for confirmation
Implement strict risk management using ATR-based position sizing
Focus on high-quality setups rather than trading every signal
Respect the trend: trade with basis direction for higher probability
Complementary Indicators:
RSI or Stochastic: Confirm momentum at channel extremes
MACD: Confirm trend direction and momentum shifts
Volume: Validate breakouts and trend strength
ADX: Measure trend strength, avoid Keltner signals in weak trends
Support/Resistance: Combine with traditional levels for high-probability setups
Bollinger Bands: Use together for enhanced breakout and volatility analysis
USAGE NOTES
This indicator is designed for technical analysis and educational purposes. Keltner Channel Enhanced has limitations and should not be used as the sole basis for trading decisions. While the flexible moving average selection for both trend and volatility components provides valuable adaptability across different market conditions, algorithm performance varies with market conditions, and past characteristics do not guarantee future results.
Key considerations:
Always use multiple forms of analysis and confirmation before entering trades
Backtest any parameter combination thoroughly before live trading
Be aware that optimization can lead to curve-fitting if not done carefully
Start with standard EMA/RMA settings and adjust only when specific conditions warrant
Understand that no moving average algorithm can eliminate lag entirely
Consider market regime (trending, ranging, volatile) when selecting parameters
Use ATR-based position sizing and risk management on every trade
Keltner Channels work best in trending markets, less effective in choppy conditions
Respect the trend direction indicated by price position relative to basis line
The enhanced flexibility of dual algorithm selection provides powerful tools for adaptation but requires responsible use, thorough understanding of how different algorithms behave under various market conditions, and disciplined risk management.

Post-Open Long Strategy with ATR-based Stop Loss and Take ProfitThe "Post-Open Long Strategy with ATR-Based Stop Loss and Take Profit" is designed to identify buying opportunities after the German and US markets open. It combines various technical indicators to filter entry signals, focusing on breakout moments following price lateralization periods.
Key Components and Their Interaction:
Bollinger Bands (BB):
Description: Uses BB with a 14-period length and standard deviation multiplier of 1.5, creating narrower bands for lower timeframes.
Role in the Strategy: Identifies low volatility phases (lateralization). The lateralization condition is met when the price is near the simple moving average of the BB, suggesting an imminent increase in volatility.
Exponential Moving Averages (EMA):
10-period EMA: Quickly detects short-term trend direction.
200-period EMA: Filters long-term trends, ensuring entries occur in a bullish market.
Interaction: Positions are entered only if the price is above both EMAs, indicating a consolidated positive trend.
Relative Strength Index (RSI):
Description: 7-period RSI with a threshold above 30.
Role in the Strategy: Confirms the market is not oversold, supporting the validity of the buy signal.
Average Directional Index (ADX):
Description: 7-period ADX with 7-period smoothing and a threshold above 10.
Role in the Strategy: Assesses trend strength. An ADX above 10 indicates sufficient momentum to justify entry.
Average True Range (ATR) for Dynamic Stop Loss and Take Profit:
Description: 14-period ATR with multipliers of 2.0 for Stop Loss and 4.0 for Take Profit.
Role in the Strategy: Adjusts exit levels based on current volatility, enhancing risk management.
Resistance Identification and Breakout:
Description: Analyzes the highs of the last 20 candles to identify resistance levels with at least two touches.
Role in the Strategy: A breakout above this level signals a potential continuation of the bullish trend.
Time Filters and Market Conditions:
Trading Hours: Operates only during the opening of the German market (8:00 - 12:00) and US market (15:30 - 19:00).
Panic Candle: The current candle must close negative, leveraging potential emotional reactions in the market.
Avoiding Entry During Pullbacks:
Description: Checks that the two previous candles are not both bearish.
Role in the Strategy: Avoids entering during a potential pullback, improving trade success probability.
Post-Open Long Strategy with ATR-Based Stop Loss and Take Profit
The "Post-Open Long Strategy with ATR-Based Stop Loss and Take Profit" is designed to identify buying opportunities after the German and US markets open. It combines various technical indicators to filter entry signals, focusing on breakout moments following price lateralization periods.
Key Components and Their Interaction:
Bollinger Bands (BB):
Description: Uses BB with a 14-period length and standard deviation multiplier of 1.5, creating narrower bands for lower timeframes.
Role in the Strategy: Identifies low volatility phases (lateralization). The lateralization condition is met when the price is near the simple moving average of the BB, suggesting an imminent increase in volatility.
Exponential Moving Averages (EMA):
10-period EMA: Quickly detects short-term trend direction.
200-period EMA: Filters long-term trends, ensuring entries occur in a bullish market.
Interaction: Positions are entered only if the price is above both EMAs, indicating a consolidated positive trend.
Relative Strength Index (RSI):
Description: 7-period RSI with a threshold above 30.
Role in the Strategy: Confirms the market is not oversold, supporting the validity of the buy signal.
Average Directional Index (ADX):
Description: 7-period ADX with 7-period smoothing and a threshold above 10.
Role in the Strategy: Assesses trend strength. An ADX above 10 indicates sufficient momentum to justify entry.
Average True Range (ATR) for Dynamic Stop Loss and Take Profit:
Description: 14-period ATR with multipliers of 2.0 for Stop Loss and 4.0 for Take Profit.
Role in the Strategy: Adjusts exit levels based on current volatility, enhancing risk management.
Resistance Identification and Breakout:
Description: Analyzes the highs of the last 20 candles to identify resistance levels with at least two touches.
Role in the Strategy: A breakout above this level signals a potential continuation of the bullish trend.
Time Filters and Market Conditions:
Trading Hours: Operates only during the opening of the German market (8:00 - 12:00) and US market (15:30 - 19:00).
Panic Candle: The current candle must close negative, leveraging potential emotional reactions in the market.
Avoiding Entry During Pullbacks:
Description: Checks that the two previous candles are not both bearish.
Role in the Strategy: Avoids entering during a potential pullback, improving trade success probability.
Entry and Exit Conditions:
Long Entry:
The price breaks above the identified resistance.
The market is in a lateralization phase with low volatility.
The price is above the 10 and 200-period EMAs.
RSI is above 30, and ADX is above 10.
No short-term downtrend is detected.
The last two candles are not both bearish.
The current candle is a "panic candle" (negative close).
Order Execution: The order is executed at the close of the candle that meets all conditions.
Exit from Position:
Dynamic Stop Loss: Set at 2 times the ATR below the entry price.
Dynamic Take Profit: Set at 4 times the ATR above the entry price.
The position is automatically closed upon reaching the Stop Loss or Take Profit.
How to Use the Strategy:
Application on Volatile Instruments:
Ideal for financial instruments that show significant volatility during the target market opening hours, such as indices or major forex pairs.
Recommended Timeframes:
Intraday timeframes, such as 5 or 15 minutes, to capture significant post-open moves.
Parameter Customization:
The default parameters are optimized but can be adjusted based on individual preferences and the instrument analyzed.
Backtesting and Optimization:
Backtesting is recommended to evaluate performance and make adjustments if necessary.
Risk Management:
Ensure position sizing respects risk management rules, avoiding risking more than 1-2% of capital per trade.
Originality and Benefits of the Strategy:
Unique Combination of Indicators: Integrates various technical metrics to filter signals, reducing false positives.
Volatility Adaptability: The use of ATR for Stop Loss and Take Profit allows the strategy to adapt to real-time market conditions.
Focus on Post-Lateralization Breakout: Aims to capitalize on significant moves following consolidation periods, often associated with strong directional trends.
Important Notes:
Commissions and Slippage: Include commissions and slippage in settings for more realistic simulations.
Capital Size: Use a realistic trading capital for the average user.
Number of Trades: Ensure backtesting covers a sufficient number of trades to validate the strategy (ideally more than 100 trades).
Warning: Past results do not guarantee future performance. The strategy should be used as part of a comprehensive trading approach.
With this strategy, traders can identify and exploit specific market opportunities supported by a robust set of technical indicators and filters, potentially enhancing their trading decisions during key times of the day.

DTFX Algo Zones [SamuraiJack Mod]CME_MINI:NQ1!
Credits
This indicator is a modified version of an open-source tool originally developed by Lux Algo. I literally modded their indicator to create the DTFX Algo Zones version, incorporating additional features and refinements. Special thanks to Lux Algo for their original work and for providing the open-source code that made this development possible.
Introduction
DTFX Algo Zones is a technical analysis indicator designed to automatically identify key supply and demand zones on your chart using market structure and Fibonacci retracements. It helps traders spot high-probability reversal areas and important support/resistance levels at a glance. By detecting shifts in market structure (such as Break of Structure and Change of Character) and highlighting bullish or bearish zones dynamically, this tool provides an intuitive framework for planning trades. The goal is to save traders time and improve decision-making by focusing attention on the most critical price zones where market bias may confirm or reverse.
Logic & Features
• Market Structure Shift Detection (BOS & CHoCH): The indicator continuously monitors price swings and marks significant structure shifts. A Break of Structure (BOS) occurs when price breaks above a previous swing high or below a swing low, indicating a continuation of the current trend. A Change of Character (ChoCH) is detected when price breaks in the opposite direction of the prior trend, often signaling an early trend reversal. These moments are visually marked on the chart, serving as anchor points for new zones. By identifying BOS and ChoCH in real-time, the DTFX Algo Zones indicator ensures you’re aware of key trend changes as they happen.
• Auto-Drawn Fibonacci Supply/Demand Zones: Upon a valid structure shift, the indicator plots a Fibonacci-based zone between the breakout point and the preceding swing high/low (the source of the move). This creates a shaded area or band of Fibonacci retracement levels (for example 38.2%, 50%, 61.8%, etc.) representing a potential support zone in an uptrend or resistance zone in a downtrend. These supply/demand zones are derived from the natural retracement of the breakout move, highlighting where price is likely to pull back. Each zone is essentially an auto-generated Fibonacci retracement region tied to a market structure event, which traders can use to anticipate where the next pullback or bounce might occur.
• Dynamic Bullish and Bearish Zones: The DTFX Algo Zones indicator distinguishes bullish vs. bearish zones and updates them dynamically as new price action unfolds. Bullish zones (formed after bullish BOS/ChoCH) are typically highlighted in one color (e.g. green or blue) to indicate areas of demand/support where price may bounce upward. Bearish zones (formed after bearish BOS/ChoCH) are shown in another color (e.g. red/orange) to mark supply/resistance where price may stall or reverse downward. This color-coding and real-time updating allow traders to instantly recognize the market bias: for instance, a series of bullish zones implies an uptrend with multiple support levels on pullbacks, while consecutive bearish zones indicate a downtrend with resistance overhead. As old zones get invalidated or new ones appear, the chart remains current with the latest key levels, eliminating clutter from outdated levels.
• Flexible Customization: The indicator comes with several options to tailor the zones to your trading style. You can filter which zones to display – for example, show only the most recent N zones or limit to only bullish or only bearish zones – helping declutter the chart and focus on recent, relevant levels. There are settings to control zone extension (how far into the future the zones are drawn) and to automatically invalidate zones once they’re no longer relevant (for instance, if price fully breaks through a zone or a new structure shift occurs that supersedes it). Additionally, the Fibonacci retracement levels within each zone are customizable: you can choose which retracement percentages to plot, adjust their colors or line styles, and decide whether to fill the zone area for visibility. This flexibility ensures the DTFX Algo Zones can be tuned for different markets and strategies, whether you want a clean minimalist look or detailed zones with multiple internal levels.
Best Use Cases
DTFX Algo Zones is a versatile indicator that can enhance various trading strategies. Some of its best use cases include:
• Identifying High-Probability Reversal Zones: Each zone marks an area where price has a higher likelihood of stalling or reversing because it reflects a significant prior swing and Fibonacci retracement. Traders can watch these zones for entry opportunities when the market approaches them, as they often coincide with order block or strong supply/demand areas. This is especially useful for catching trend reversals or pullbacks at points where risk is lower and potential reward is higher.
• Spotting Key Support and Resistance: The automatically drawn zones act as dynamic support (below price) and resistance (above price) levels. Instead of manually drawing Fibonacci retracements or support/resistance lines, you get an instant map of the key levels derived from recent price action. This helps in quickly identifying where the next bounce (support) or rejection (resistance) might occur. Swing traders and intraday traders alike can use these zones to set alerts or anticipate reaction areas as the market moves.
• Trend-Following Entries: In a trending market, the indicator’s zones provide ideal areas to join the trend on pullbacks. For example, in an uptrend, when a new bullish zone is drawn after a BOS, it indicates a fresh demand zone – buying near the lower end of that zone on a pullback can offer a low-risk entry to ride the next leg up. Similarly, in a downtrend, selling rallies into the highlighted supply zones can position you in the direction of the prevailing trend. The zones effectively serve as a roadmap of the trend’s structure, allowing trend traders to buy dips and sell rallies with greater confidence.
• Mean-Reversion and Range Trading: Even in choppy or range-bound markets, DTFX Algo Zones can help find mean-reversion trades. If price is oscillating sideways, the zones at extremes of the range might mark where momentum is shifting (ChoCH) and price could swing back toward the mean. A trader might fade an extended move when it reaches a strong zone, anticipating a reversion. Additionally, if multiple zones cluster in an area across time (creating a zone overlap), it often signifies a particularly robust support/resistance level ideal for range trading strategies.
In all these use cases, the indicator’s ability to filter out noise and highlight structurally important levels means traders can focus on higher-probability setups and make more informed trading decisions.
Strategy – Pullback Trading with DTFX Algo Zones
One of the most effective ways to use the DTFX Algo Zones indicator is trading pullbacks in the direction of the trend. Below is a step-by-step strategy to capitalize on pullbacks using the zones, combining the indicator’s signals with sound price action analysis and risk management:
1. Identify a Market Structure Shift and Trend Bias: First, observe the chart for a recent BOS or ChoCH signal from the indicator. This will tell you the current trend bias. For instance, a bullish BOS/ChoCH means the market momentum has shifted upward (bullish bias), and a new demand zone will be drawn. A bearish structure break indicates downward momentum and creates a supply zone. Make sure the broader context supports the bias (e.g., if multiple higher timeframe zones are bullish, focus on long trades).
2. Wait for the Pullback into the Zone: Once a new zone appears, don’t chase the price immediately. Instead, wait for price to retrace back into that highlighted zone. Patience is key – let the market come to you. For a bullish setup, allow price to dip into the Fibonacci retracement zone (demand area); for a bearish setup, watch for a rally into the supply zone. Often, the middle of the zone (around the 50% retracement level) can be an optimal area where price might slow down and pivot, but it’s wise to observe price behavior across the entire zone.
3. Confirm the Entry with Price Action & Confluence: As price tests the zone, look for confirmation signals before entering the trade. This can include bullish reversal candlestick patterns (for longs) or bearish patterns (for shorts) such as engulfing candles, hammers/shooting stars, or doji indicating indecision turning to reversal. Additionally, incorporate confluence factors to strengthen the setup: for example, check if the zone overlaps with a key moving average, a round number price level, or an old support/resistance line from a higher timeframe. You might also use an oscillator (like RSI or Stochastic) to see if the pullback has reached oversold conditions in a bullish zone (or overbought in a bearish zone), suggesting a bounce is likely. The more factors aligning at the zone, the more confidence you can have in the trade. Only proceed with an entry once you see clear evidence of buyers defending a demand zone or sellers defending a supply zone.
4. Enter the Trade and Manage Risk: When you’re satisfied with the confirmation (e.g., price starts to react positively off a demand zone or shows rejection wicks in a supply zone), execute your entry in the direction of the original trend. Immediately set a stop-loss order to control risk: for a long trade, a common placement is just below the demand zone (a few ticks/pips under the swing low that formed the zone); for a short trade, place the stop just above the supply zone’s high. This way, if the zone fails and price continues beyond it, your loss is limited. Position size the trade so that this stop-loss distance corresponds to a risk you are comfortable with (for example, 1-2% of your trading capital).
5. Take Profit Strategically: Plan your take-profit targets in advance. A conservative approach is to target the origin of the move – for instance, in a long trade, you might take profit as price moves back up to the swing high (the 0% Fibonacci level of the zone) or the next significant zone or resistance level above. This often yields at least a 1:1 reward-to-risk ratio if you entered around mid-zone. More aggressive trend-following traders may leave a portion of the position running beyond the initial target, aiming for a larger move in line with the trend (for example, new higher highs in an uptrend). You can also trail your stop-loss upward behind new higher lows (for longs) or lower highs (for shorts) as the trend progresses, locking in profit while allowing for further gains.
6. Monitor Zone Invalidation: Even after entering, keep an eye on the behavior around the zone and any new zones that may form. If price fails to bounce and instead breaks decisively through the entire zone, respect that as an invalidation – the market may be signaling a deeper reversal or that the signal was false. In such a case, it’s better to exit early or stick to your stop-loss than to hold onto a losing position. The indicator will often mark or no longer highlight zones that have been invalidated by price, guiding you to shift focus to the next opportunity.
Risk Management Tips:
• Always use a stop-loss and don’t move it farther out in hope. Placing the stop just beyond the zone’s far end (the swing point) helps protect you if the pullback turns into a larger reversal.
• Aim for a favorable risk-to-reward ratio. With pullback entries near the middle or far end of a zone, you can often achieve a reward that equals or exceeds your risk. For example, risking 20 pips to make 20+ pips (1:1 or better) is a prudent starting point. Adjust targets based on market structure – if the next resistance is 50 pips away, consider that upside against your risk.
• Use confluence and context: Don’t take every zone signal in isolation. The highest probability trades come when the DTFX Algo Zone aligns with other analysis (trend direction, chart patterns, higher timeframe support/resistance, etc.). This filtered approach will reduce trades taken in weak zones or counter-trend traps.
• Embrace patience and selectivity: Not all zones are equal. It can be wise to skip very narrow or insignificant zones and wait for those that form after a strong BOS/ChoCH (indicating a powerful move). Larger zones or zones formed during high-volume times tend to produce more reliable pullback opportunities.
• Review and adapt: After each trade, note how price behaved around the zone. If you notice certain Fib levels (like 50% or 61.8%) within the zone consistently provide the best entries, you can refine your approach to focus on those. Similarly, adjust the indicator’s settings if needed – for example, if too many minor zones are cluttering your screen, limit to the last few or increase the structure length parameter to capture only more significant swings.
⸻
By combining the DTFX Algo Zones indicator with disciplined confirmation and risk management, traders can improve their timing on pullback entries and avoid chasing moves. This indicator shines in helping you trade what you see, not what you feel – the clearly marked zones and structure shifts keep you grounded in price action reality. Whether you’re a trend trader looking to buy the dip/sell the rally, or a reversal trader hunting for exhaustion points, DTFX Algo Zones provides a robust visual aid to elevate your trading decisions. Use it as a complementary tool in your analysis to stay on the right side of the market’s structure and enhance your trading performance.

[3Commas] HA & MAHA & MA
🔷What it does: This tool is designed to test a trend-following strategy using Heikin Ashi candles and moving averages. It enters trades after pullbacks, aiming to let profits run once the risk-to-reward ratio reaches 1:1 while securing the position.
🔷Who is it for: It is ideal for traders looking to compare final results using fixed versus dynamic take profits by adjusting parameters and trade direction—a concept applicable to most trading strategies.
🔷How does it work: We use moving averages to define the market trend, then wait for opposite Heikin Ashi candles to form against it. Once these candles reverse in favor of the trend, we enter the trade, using the last swing created by the pullback as the stop loss. By applying the breakeven ratio, we protect the trade and let it run, using the slower moving average as a trailing stop.
A buy signal is generated when:
The previous candle is bearish (ha_bear ), indicating a pullback.
The fast moving average (ma1) is above the slow moving average (ma2), confirming an uptrend.
The current candle is bullish (ha_bull), showing trend continuation.
The Heikin Ashi close is above the fast moving average (ma1), reinforcing the bullish bias.
The real price close is above the open (close > open), ensuring bullish momentum in actual price data.
The signal is confirmed on the closed candle (barstate.isconfirmed) to avoid premature signals.
dir is undefined (na(dir)), preventing repeated signals in the same direction.
A sell signal is generated when:
The previous candle is bullish (ha_bull ), indicating a temporary upward move before a potential reversal.
The fast moving average (ma1) is below the slow moving average (ma2), confirming a downtrend.
The current candle is bearish (ha_bear), showing trend continuation to the downside.
The Heikin Ashi close is below the fast moving average (ma1), reinforcing bearish pressure.
The real price close is below the open (close < open), confirming bearish momentum in actual price data.
The signal is confirmed after the candle closes (barstate.isconfirmed), avoiding premature entries.
dir is undefined (na(dir)), preventing consecutive signals in the same direction.
In simple terms, this setup looks for trend continuation after a pullback, confirming entries with both Heikin Ashi and real price action, supported by moving average alignment to avoid false signals.
If the price reaches a 1:1 risk-to-reward ratio, the stop will be moved to the entry point. However, if the slow moving average surpasses this level, it will become the new exit point, acting as a trailing stop
🔷Why It’s Unique
Easily visualizes the benefits of using risk-to-reward ratios when trading instead of fixed percentages.
Provides a simple and straightforward approach to trading, embracing the "keep it simple" concept.
Offers clear visualization of DCA Bot entry and exit points based on user preferences.
Includes an option to review the message format before sending signals to bots, with compatibility for multi-pair and futures contract pairs.
🔷 Considerations Before Using the Indicator
⚠️Very important: The indicator must be used on charts with real price data, such as Japanese candlesticks, line charts, etc. Do not use it on Heikin Ashi charts, as this may lead to unrealistic results.
🔸Since this is a trend-following strategy, use it on timeframes above 4 hours, where market noise is reduced and trends are clearer. Also, carefully review the statistics before using it, focusing on pairs that tend to have long periods of well-defined trends.
🔸Disadvantages:
False Signals in Ranges: Consolidating markets can generate unreliable signals.
Lagging Indicator: Being based on moving averages, it may react late to sudden price movements.
🔸Advantages:
Trend Focused: Simplifies the identification of trending markets.
Noise Reduction: Uses Heikin Ashi candles to identify trend continuation after pullbacks.
Broad Applicability: Suitable for forex, crypto, stocks, and commodities.
🔸The strategy provides a systematic way to analyze markets but does not guarantee successful outcomes. Use it as an additional tool rather than relying solely on an automated system.
Trading results depend on various factors, including market conditions, trader discipline, and risk management. Past performance does not ensure future success, so always approach the market cautiously.
🔸Risk Management: Define stop-loss levels, position sizes, and profit targets before entering any trade. Be prepared for potential losses and ensure your approach aligns with your overall trading plan.
🔷 STRATEGY PROPERTIES
Symbol: BINANCE:BTCUSDT (Spot).
Timeframe: 4h.
Test Period: All historical data available.
Initial Capital: 10000 USDT.
Order Size per Trade: 1% of Capital, you can use a higher value e.g. 5%, be cautious that the Max Drawdown does not exceed 10%, as it would indicate a very risky trading approach.
Commission: Binance commission 0.1%, adjust according to the exchange being used, lower numbers will generate unrealistic results. By using low values e.g. 5%, it allows us to adapt over time and check the functioning of the strategy.
Slippage: 5 ticks, for pairs with low liquidity or very large orders, this number should be increased as the order may not be filled at the desired level.
Margin for Long and Short Positions: 100%.
Indicator Settings: Default Configuration.
MA1 Length: 9.
MA2 Length: 18.
MA Calculations: EMA.
Take Profit Ratio: Disable. Ratio 1:4.
Breakeven Ratio: Enable, Ratio 1:1.
Strategy: Long & Short.
🔷 STRATEGY RESULTS
⚠️Remember, past results do not guarantee future performance.
Net Profit: +324.88 USDT (+3.25%).
Max Drawdown: -81.18 USDT (-0.78%).
Total Closed Trades: 672.
Percent Profitable: 35.57%.
Profit Factor: 1.347.
Average Trade: +0.48 USDT (+0.48%).
Average # Bars in Trades: 13.
🔷 HOW TO USE
🔸 Adjust Settings:
The default values—MA1 (9) and MA2 (18) with EMA calculation—generally work well. However, you can increase these values, such as 20 and 40, to better identify stronger trends.
🔸 Choose a Symbol that Typically Trends:
Select an asset that tends to form clear trends. Keep in mind that the Strategy Tester results may show poor performance for certain assets, making them less suitable for sending signals to bots.
🔸 Experiment with Ratios:
Test different take profit and breakeven ratios to compare various scenarios—especially to observe how the strategy performs when only the trade is protected.
🔸This is an example of how protecting the trade works: once the price moves in favor of the position with a 1:1 risk-to-reward ratio, the stop loss is moved to the entry price. If the Slow MA surpasses this level, it will act as a trailing stop, aiming to follow the trend and maximize potential gains.
🔸In contrast, in this example, for the same trade, if we set a take profit at a 1:3 risk-to-reward ratio—which is generally considered a good risk-reward relationship—we can see how a significant portion of the upward move is left on the table.
🔸Results Review:
It is important to check the Max Drawdown. This value should ideally not exceed 10% of your capital. Consider adjusting the trade size to ensure this threshold is not surpassed.
Remember to include the correct values for commission and slippage according to the symbol and exchange where you are conducting the tests. Otherwise, the results will not be realistic.
If you are satisfied with the results, you may consider automating your trades. However, it is strongly recommended to use a small amount of capital or a demo account to test proper execution before committing real funds.
🔸Create alerts to trigger the DCA Bot:
Verify Messages: Ensure the message matches the one specified by the DCA Bot.
Multi-Pair Configuration: For multi-pair setups, enable the option to add the symbol in the correct format.
Signal Settings: Enable whether you want to receive long or short signals (Entry | TP | SL), copy and paste the the messages for the DCA Bots configured.
Alert Setup:
When creating an alert, set the condition to the indicator and choose "alert() function call only.
Enter any desired Alert Name.
Open the Notifications tab, enable Webhook URL, and paste the Webhook URL.
For more details, refer to the section: "How to use TradingView Custom Signals".
Finalize Alerts: Click Create, you're done! Alerts will now be sent automatically in the correct format.
🔷 INDICATOR SETTINGS
MA 1: Fast MA Length
MA 2: Slow MA Length
MA Calc: MA's Calculations (SMA,EMA, RMA,WMA)
TP Ratio: This is the take profit ratio relative to the stop loss, where the trade will be closed in profit.
BE Ratio: This is the breakeven ratio relative to the stop loss, where the stop loss will be updated to breakeven or if the MA2 is greater than this level.
Strategy: Order Type direction in which trades are executed.
Use Custom Test Period: When enabled signals only works in the selected time window. If disabled it will use all historical data available on the chart.
Test Start and End: Once the Custom Test Period is enabled, here you select the start and end date that you want to analyze.
Check Messages: Enable the table to review the messages to be sent to the bot.
Entry | TP | SL: Enable this options to send Buy Entry, Take Profit (TP), and Stop Loss (SL) signals.
Deal Entry and Deal Exit : Copy and paste the message for the deal start signal and close order at Market Price of the DCA Bot. This is the message that will be sent with the alert to the Bot, you must verify that it is the same as the bot so that it can process properly so that it executes and starts the trade.
DCA Bot Multi-Pair: You must activate it if you want to use the signals in a DCA Bot Multi-pair in the text box you must enter (using the correct format) the symbol in which you are creating the alert, you can check the format of each symbol when you create the bot.
👨🏻💻💭 We hope this tool helps enhance your trading. Your feedback is invaluable, so feel free to share any suggestions for improvements or new features you'd like to see implemented.
__
The information and publications within the 3Commas TradingView account are not meant to be and do not constitute financial, investment, trading, or other types of advice or recommendations supplied or endorsed by 3Commas and any of the parties acting on behalf of 3Commas, including its employees, contractors, ambassadors, etc.

SGM Gold Day Trading EMAsWhat it does
This tool plots four Exponential Moving Averages (EMAs) with practical default periods for gold intraday analysis: 9 (Momentum), 21 (Pullback), 50 (Trend Filter), and 200 (Macro). The goal is to provide a clear, multi-horizon structure so traders can quickly assess momentum, pullbacks, intermediate trend, and long-term bias on the same chart.
How it works (method)
Each line is a standard EMA computed on the close price.
The defaults map to common roles:
EMA 9 – Momentum: immediate changes in short-term flow.
EMA 21 – Pullback: typical retracement area within ongoing trends.
EMA 50 – Trend Filter: medium-term confirmation of direction.
EMA 200 – Macro: long-term bias and market context.
Optional dynamic color for EMA9/EMA21 highlights whether EMA9 ≥ EMA21 (green) or not (red). This is a visual aid only; it does not generate signals.
Originality & usefulness
The script focuses on clarity and control rather than automation. It combines a neutral, high-contrast palette with independent line thickness per EMA and an optional visual crossover mode. The configuration encourages disciplined analysis across time horizons without embedding opaque entry/exit logic.
Inputs & customization:
Periods: 9, 21, 50, 200 (all adjustable).
Colors: fully customizable for each EMA; optional crossover color mode for 9/21.
Line thickness: set individually per EMA to emphasize your primary reference.
How to use:
Add the script on any timeframe/asset (gold defaults are provided but not required).
Use EMA 200 for long-term bias; trade with caution against it.
Use EMA 50 to filter intermediate trend; prefer setups aligned with it.
Watch EMA 21 as a pullback reference within trends.
Use EMA 9 to gauge momentum around pullbacks/breakouts.
(Optional) Enable the crossover color to quickly see when momentum (9) is above/below pullback (21).
Notes & limitations:
This script does not produce buy/sell signals or alerts.
It is intended as a visual framework to support analysis and risk management.
Always validate with your own rules, risk controls, and market conditions.

Impulse Convexity Trend Gate [T1][T69]OVERVIEW 🧭
• A price-only trend engine that opens a “gate” only when trend strength, acceleration, and impulse dominance align.
• Built from three cooperating parts: adaptive slope, directional convexity, and an impulse-vs-pullback ratio.
• Output is a bounded oscillator (−100…+100) plus side-specific gate states (bull/bear), with optional pullback and weakness highlights.
THE IDEA & USEFULNESS 🧪
• Not a simple mashup: each component plays a distinct role—slope for direction, convexity for acceleration agreement, and an impulse ratio to suppress correction noise.
• Adaptive EMA length (series-based) lets the midline adjust to conditions without external indicators.
• Approximation of hyperbolic tangent and clamp keep signals bounded and stable while avoiding library dependencies.
• Designed to help trend traders act only when continuation is likely, and stand down during pullbacks or chop.
HOW IT WORKS (PIPELINE) ⚙️
• Price transform
• Uses log price for scale stability.
• Adaptive midline
• Volatility-aware EMA length is clamped between minimum and maximum, then applied via a custom recursive EMA.
• Slope & convexity
• Slope (first difference of the midline) defines direction; convexity (second difference) verifies acceleration agrees with that direction.
• Impulse vs pullback ratio (R)
• Sums directional progress versus counter-direction pullbacks over a window; requires impulse to dominate.
• Normalization & score
• Slope and convexity are normalized by recent dispersion; combined into a raw score and squashed to −100…+100 using manual tanh.
• Trend gate
• Gate opens only when: R ≥ threshold, |normalized slope| ≥ threshold, and slope/convexity share the same sign.
• States & visuals
• Bull/Bear Gate Entry when gate is open, oscillator crosses ±15 in the correct direction, price is on the correct side of the midline, and slope/convexity agree.
• Pullbacks mark counter-moves while a gate is active; Weakness flags specific fade patterns after pullbacks.
FEATURES ✨
• Bull and Bear Gate Entries (green/red columns).
• Pullback shading and optional trend-weakness highlights (yellow/orange + teal/maroon).
• Background tint reflects the active side (bull or bear).
• Pure price logic; no volume or external filters required.
HOW TO USE 🎯
• Regime filter
• Trade only in the direction of the open gate; ignore signals when the gate is closed.
• Pullback entries
• During an open gate, wait for a pullback zone, then act on trend-resumption (e.g., oscillator re-push through ±15 or structure break in gate direction).
• Exits & risk
• Consider trimming when the oscillator relaxes toward 0 while the gate remains open, or when convexity flips against slope and R deteriorates.
• Timeframes & markets
• Suited for trend following on crypto/FX/indices from M30 to 4H/1D; raise thresholds on lower timeframes to reduce noise.
CONFIGURATION 🔧
• Impulse ratio gate (R ≥): raises/lowers the standard for continuation dominance.
• Slope strength gate (|sN| ≥): controls how strong a slope must be to count.
• Show Pullback Impulse (toggle): enable/disable pullback highlights.
• Show Trend Weakness (toggle): enable/disable weakness flags.
LIMITATIONS ⚠️
• As a trend tool, it can lag at regime transitions; expect whipsaws in tight ranges.
• Parameters are instrument- and timeframe-dependent; tune thresholds before live use.
• Pullback/weakness flags are contextual—not trade signals by themselves; use them with gate state and your execution rules.
ADVANCED TIPS 🛠️
• Tighten R and slope thresholds for lower timeframes; loosen for higher timeframes.
• Pair with NNFX-style money management and pair-level filters; let the gate be the confirmation layer, not the entry trigger by itself.
• Batch-test across 100+ symbols, export metrics, and run Monte Carlo to validate LLN reliability and Sharpe/IQR stability.
• For system hedging, disable entries when both sides trigger on the same asset to avoid internal conflict.
NOTES 📝
• Price-only construction reduces data-vendor differences and keeps behavior consistent across markets.
• Manual tanh/clamp ensure stable, bounded scores even during extremes.
DISCLAIMER 🛡️
• For research and education. No financial advice. Test thoroughly, size conservatively, and respect your risk rules.
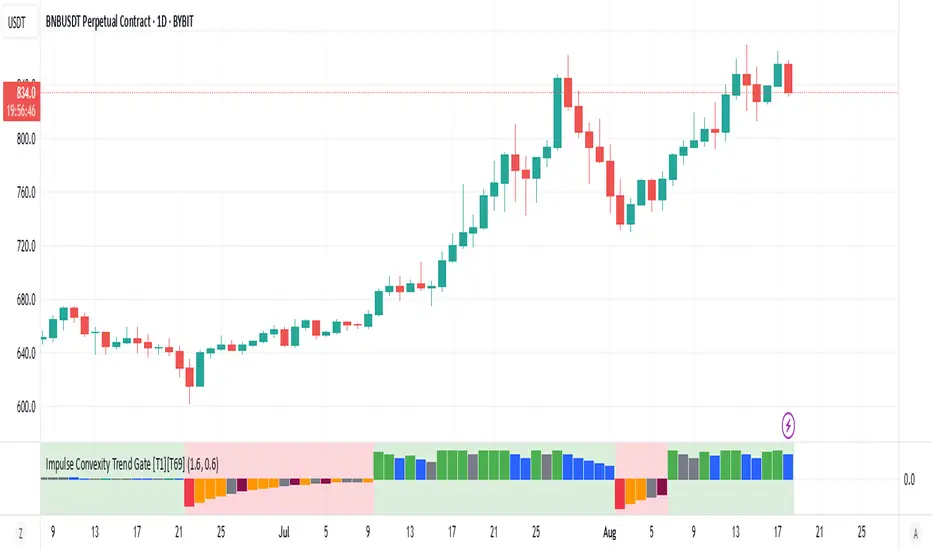
10% Drop from Current High - Akshay10% Drop from Current High TradingView Indicator
Description:
The "10% Drop from Current High" indicator dynamically tracks the highest price within a user-defined period and highlights when the current price drops by a specified percentage. This tool is invaluable for traders looking to monitor significant pullbacks or corrections from recent highs.
Key Features:
Customizable Drop Percentage:
Allows users to set the percentage drop to track, with a default value of 10%.
Configurable via an input field to suit different trading strategies and market conditions.
Lookback Period:
Tracks the highest price over a user-defined lookback period (default is 20 bars).
This ensures the indicator adapts to short-term or long-term market conditions based on user preferences.
Dynamic Levels:
Current High Level: Plots the highest price within the lookback period in blue.
Drop Level: Plots the calculated drop level (e.g., 10% below the current high) in red.
Visual Alerts:
Background Highlighting:
A translucent red background appears when the current price is at or below the drop level, signaling a significant pullback.
Shape Marker:
A downward label is plotted below the bar when the price touches or falls below the drop level, providing cSet Alerts:lear visual feedback.
Overlay on Price Chart:
The indicator is plotted directly on the price chart (overlay=true), ensuring seamless integration with other technical analysis tools.
Use Case:
This indicator is designed for traders who want to:
Monitor Pullbacks:
Identify when the price of an asset experiences a defined percentage drop from its recent high, signaling potential reversal zones or buying opportunities.
Use visual cues to react quickly to price movements.
Analyze Trends:
Combine with other indicators to assess the strength of trends and corrections.
Customization Options:
Drop Percentage: Adjust the percentage drop to track based on asset volatility and trading strategy.
Lookback Period: Modify the lookback period to focus on short-term (e.g., 5 bars) or long-term (e.g., 50 bars) price highs.
This indicator provides a flexible and intuitive way to track price pullbacks, helping traders make informed decisions and stay ahead in dynamic market conditions.
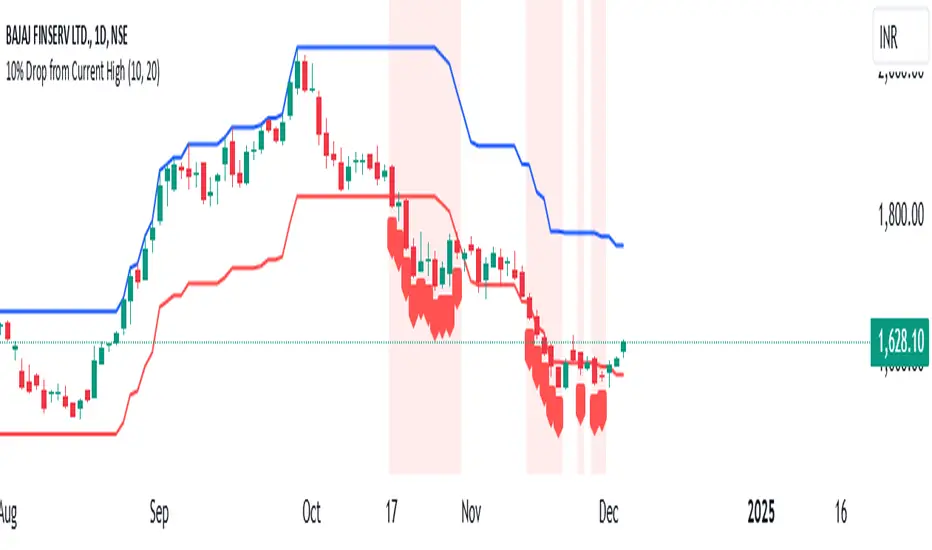
Larry Connors 3 Day High/Low StrategyThe Larry Connors 3 Day High/Low Strategy is a short-term mean-reversion trading strategy that is designed to identify potential buying opportunities when a security is oversold. This strategy is based on the principles developed by Larry Connors, a well-known trading system developer and author.
Key Strategy Elements:
1. Trend Confirmation: The strategy first confirms that the security is in a long-term uptrend by ensuring that the closing price is above the 200-day moving average (condition1). This rule helps filter trades to align with the longer-term trend.
2. Short-Term Pullback: The strategy looks for a short-term pullback by ensuring that the closing price is below the 5-day moving average (condition2). This identifies potential entry points when the price temporarily moves against the longer-term trend.
3. Three Consecutive Lower Highs and Lows:
• The high and low two days ago are lower than those of the day before (condition3).
• The high and low yesterday are lower than those of two days ago (condition4).
• Today’s high and low are lower than yesterday’s (condition5).
These conditions are used to identify a sequence of declining highs and lows, signaling a short-term pullback or oversold condition in the context of an overall uptrend.
4. Entry and Exit Signals:
• Buy Signal: A buy order is triggered when all the above conditions are met (buyCondition).
• Sell Signal: A sell order is executed when the closing price is above the 5-day moving average (sellCondition), indicating that the pullback might be ending.
Risks of the Strategy
1. Mean Reversion Failure: This strategy relies on the assumption that prices will revert to the mean after a short-term pullback. In strong downtrends or during market crashes, prices may continue to decline, leading to significant losses.
2. Whipsaws and False Signals: The strategy may generate false signals, especially in choppy or sideways markets where the price does not follow a clear trend. This can lead to frequent small losses that can add up over time.
3. Dependence on Historical Patterns: The strategy is based on historical price patterns, which do not always predict future price movements accurately. Sudden market news or economic changes can disrupt the pattern.
4. Lack of Risk Management: The strategy as written does not include stop losses or position sizing rules, which can expose traders to larger-than-expected losses if conditions change rapidly.
About Larry Connors
Larry Connors is a renowned trader, author, and founder of Connors Research and TradingMarkets.com. He is widely recognized for his development of quantitative trading strategies, especially those focusing on short-term mean reversion techniques. Connors has authored several books on trading, including “Short-Term Trading Strategies That Work” and “Street Smarts,” co-authored with Linda Raschke. His strategies are known for their systematic, rules-based approach and have been widely used by traders and investment professionals.
Connors’ research often emphasizes the importance of trading with the trend, managing risk, and using statistically validated techniques to improve trading outcomes. His work has been influential in the field of quantitative trading, providing accessible strategies for traders at various skill levels.
References
1. Connors, L., & Raschke, L. (1995). Street Smarts: High Probability Short-Term Trading Strategies.
2. Connors, L. (2009). Short-Term Trading Strategies That Work.
3. Fama, E. F., & French, K. R. (1988). Permanent and Temporary Components of Stock Prices. Journal of Political Economy, 96(2), 246-273.
This strategy and its variations are popular among traders looking to capitalize on short-term price movements while aligning with longer-term trends. However, like all trading strategies, it requires rigorous backtesting and risk management to ensure its effectiveness under different market conditions.

Dip Hunter [BackQuant]Dip Hunter
What this tool does in plain language
Dip Hunter is a pullback detector designed to find high quality buy-the-dip opportunities inside healthy trends and to avoid random knife catches. It watches for a quick drop from a recent high, checks that the drop happened with meaningful participation and volatility, verifies short-term weakness inside a larger uptrend, then scores the setup and paints the chart so you can act with confidence. It also draws clean entry lines, provides a meter that shows dip strength at a glance, and ships with alerts that match common execution workflows.
How Dip Hunter thinks
It defines a recent swing reference, measures how far price has dipped off that high, and only looks at candidates that meet your minimum percentage drop.
It confirms the dip with real activity by requiring a volume spike and a volatility spike.
It checks structure with two EMAs. Price should be weak in the short term while the larger context remains constructive.
It optionally requires a higher-timeframe trend to be up so you focus on pullbacks in trending markets.
It bundles those checks into a score and shows you the score on the candles and on a gradient meter.
When everything lines up it paints a green triangle below the bar, shades the background, and (if you wish) draws a horizontal entry line at your chosen level.
Inputs and what they mean
Dip Hunter Settings
• Vol Lookback and Vol Spike : The script computes an average volume over the lookback window and flags a spike when current volume is a multiple of that average. A multiplier of 2.0 means today’s volume must be at least double the average. This helps filter noise and focuses on dips that other traders actually traded.
• Fast EMA and Slow EMA : Short-term and medium-term structure references. A dip is more credible if price closes below the fast EMA while the fast EMA is still below the slow EMA during the pullback. That is classic corrective behavior inside a larger trend.
• Price Smooth : Optional smoothing length for price-derived series. Use this if you trade very noisy assets or low timeframes.
• Volatility Len and Vol Spike (volatility) : The script checks both standard deviation and true range against their own averages. If either expands beyond your multiplier the market confirms the move with range.
• Dip % and Lookback Bars : The engine finds the highest high over the lookback window, then computes the percentage drawdown from that high to the current close. Only dips larger than your threshold qualify.
Trend Filter
• Enable Trend Filter : When on, Dip Hunter will only trigger if the market is in an uptrend.
• Trend EMA Period : The longer EMA that defines the session’s backbone trend.
• Minimum Trend Strength : A small positive slope requirement. In practice this means the trend EMA should be rising, and price should be above it. You can raise the value to be more selective.
Entries
• Show Entry Lines : Draws a horizontal guide from the signal bar for a fixed number of bars. Great for limit orders, scaling, or re-tests.
• Line Length (bars) : How far the entry guide extends.
• Min Gap (bars) : Suppresses new entry lines if another dip fired recently. Prevents clutter during choppy sequences.
• Entry Price : Choose the line level. “Low” anchors at the signal candle’s low. “Close” anchors at the signal close. “Dip % Level” anchors at the theoretical level defined by recent_high × (1 − dip%). This lets you work resting orders at a consistent discount.
Heat / Meter
• Color Bars by Score : Colors each candle using a red→white→green gradient. Red is overheated, green is prime dip territory, white is neutral.
• Show Meter Table : Adds a compact gradient strip with a pointer that tracks the current score.
• Meter Cells and Meter Position : Resolution and placement of the meter.
UI Settings
• Show Dip Signals : Plots green triangles under qualifying bars and tints the background very lightly.
• Show EMAs : Plots fast, slow, and the trend EMA (if the trend filter is enabled).
• Bullish, Bearish, Neutral colors : Theme controls for shapes, fills, and bar painting.
Core calculations explained simply
Recent high and dip percent
The script finds the highest high over Lookback Bars , calls it “recent high,” then calculates:
dip% = (recent_high − close) ÷ recent_high × 100.
If dip% is larger than Dip % , condition one passes.
Volume confirmation
It computes a simple moving average of volume over Vol Lookback . If current volume ÷ average volume > Vol Spike , we have a participation spike. It also checks 5-bar ROC of volume. If ROC > 50 the spike is forceful. This gets an extra score point.
Volatility confirmation
Two independent checks:
• Standard deviation of closes vs its own average.
• True range vs ATR.
If either expands beyond Vol Spike (volatility) the move has range. This prevents false triggers from quiet drifts.
Short-term structure
Price should close below the Fast EMA and the fast EMA should be below the Slow EMA at the moment of the dip. That is the anatomy of a pullback rather than a full breakdown.
Macro trend context (optional)
When Enable Trend Filter is on, the Trend EMA must be rising and price must be above it. The logic prefers “micro weakness inside macro strength” which is the highest probability pattern for buying dips.
Signal formation
A valid dip requires:
• dip% > threshold
• volume spike true
• volatility spike true
• close below fast EMA
• fast EMA below slow EMA
If the trend filter is enabled, a rising trend EMA with price above it is also required. When all true, the triangle prints, the background tints, and optional entry lines are drawn.
Scoring and visuals
Binary checks into a continuous score
Each component contributes to a score between 0 and 1. The script then rescales to a centered range (−50 to +50).
• Low or negative scores imply “overheated” conditions and are shaded toward red.
• High positive scores imply “ripe for a dip buy” conditions and are shaded toward green.
• The gradient meter repeats the same logic, with a pointer so you can read the state quickly.
Bar coloring
If you enable “Color Bars by Score,” each candle inherits the gradient. This makes sequences obvious. Red clusters warn you not to buy. White means neutral. Increasing green suggests the pullback is maturing.
EMAs and the trend EMA
• Fast EMA turns down relative to the slow EMA inside the pullback.
• Trend EMA stays rising and above price once the dip exhausts, which is your cue to focus on long setups rather than bottom fishing in downtrends.
Entry lines
When a fresh signal fires and no other signal happened within Min Gap (bars) , the indicator draws a horizontal level for Line Length bars. Use these lines for limit entries at the low, at the close, or at the defined dip-percent level. This keeps your plan consistent across instruments.
Alerts and what they mean
• Market Overheated : Score is deeply negative. Do not chase. Wait for green.
• Close To A Dip : Score has reached a healthy level but the full signal did not trigger yet. Prepare orders.
• Dip Confirmed : First bar of a fresh validated dip. This is the most direct entry alert.
• Dip Active : The dip condition remains valid. You can scale in on re-tests.
• Dip Fading : Score crosses below 0.5 from above. Momentum of the setup is fading. Tighten stops or take partials.
• Trend Blocked Signal : All dip conditions passed but the trend filter is offside. Either reduce risk or skip, depending on your plan.
How to trade with Dip Hunter
Classic pullback in uptrend
Turn on the trend filter.
Watch for a Dip Confirmed alert with green triangle.
Use the entry line at “Dip % Level” to stage a limit order. This keeps your entries consistent across assets and timeframes.
Initial stop under the signal bar’s low or under the next lower EMA band.
First target at prior swing high, second target at a multiple of risk.
If you use partials, trail the remainder under the fast EMA once price reclaims it.
Aggressive intraday scalps
Lower Dip % and Lookback Bars so you catch shallow flags.
Keep Vol Spike meaningful so you only trade when participation appears.
Take quick partials when price reclaims the fast EMA, then exit on Dip Fading if momentum stalls.
Counter-trend probes
Disable the trend filter if you intentionally hunt reflex bounces in downtrends.
Require strong volume and volatility confirmation.
Use smaller size and faster targets. The meter should move quickly from red toward white and then green. If it does not, step aside.
Risk management templates
Stops
• Conservative: below the entry line minus a small buffer or below the signal bar’s low.
• Structural: below the slow EMA if you aim for swing continuation.
• Time stop: if price does not reclaim the fast EMA within N bars, exit.
Position sizing
Use the distance between the entry line and your structural stop to size consistently. The script’s entry lines make this distance obvious.
Scaling
• Scale at the entry line first touch.
• Add only if the meter stays green and price reclaims the fast EMA.
• Stop adding on a Dip Fading alert.
Tuning guide by market and timeframe
Equities daily
• Dip %: 1.5 to 3.0
• Lookback Bars: 5 to 10
• Vol Spike: 1.5 to 2.5
• Volatility Len: 14 to 20
• Trend EMA: 100 or 200
• Keep trend filter on for a cleaner list.
Futures and FX intraday
• Dip %: 0.4 to 1.2
• Lookback Bars: 3 to 7
• Vol Spike: 1.8 to 3.0
• Volatility Len: 10 to 14
• Use Min Gap to avoid clusters during news.
Crypto
• Dip %: 3.0 to 6.0 for majors on higher timeframes, lower on 15m to 1h
• Lookback Bars: 5 to 12
• Vol Spike: 1.8 to 3.0
• ATR and stdev checks help in erratic sessions.
Reading the chart at a glance
• Green triangle below the bar: a validated dip.
• Light green background: the current bar meets the full condition.
• Bar gradient: red is overheated, white is neutral, green is dip-friendly.
• EMAs: fast below slow during the pullback, then reclaim fast EMA on the bounce for quality continuation.
• Trend EMA: a rising spine when the filter is on.
• Entry line: a fixed level to anchor orders and risk.
• Meter pointer: right side toward “Dip” means conditions are maturing.
Why this combination reduces false positives
Any single criterion will trigger too often. Dip Hunter demands a dip off a recent high plus a volume surge plus a volatility expansion plus corrective EMA structure. Optional trend alignment pushes odds further in your favor. The score and meter visualize how many of these boxes you are actually ticking, which is more reliable than a binary dot.
Limitations and practical tips
• Thin or illiquid symbols can spoof volume spikes. Use larger Vol Lookback or raise Vol Spike .
• Sideways markets will show frequent small dips. Increase Dip % or keep the trend filter on.
• News candles can blow through entry lines. Widen stops or skip around known events.
• If you see many back-to-back triangles, raise Min Gap to keep only the best setups.
Quick setup recipes
• Clean swing trader: Trend filter on, Dip % 2.0 to 3.0, Vol Spike 2.0, Volatility Len 14, Fast 20 EMA, Slow 50 EMA, Trend 100 EMA.
• Fast intraday scalper: Trend filter off, Dip % 0.7 to 1.0, Vol Spike 2.5, Volatility Len 10, Fast 9 EMA, Slow 21 EMA, Min Gap 10 bars.
• Crypto swing: Trend filter on, Dip % 4.0, Vol Spike 2.0, Volatility Len 14, Fast 20 EMA, Slow 50 EMA, Trend 200 EMA.
Summary
Dip Hunter is a focused pullback engine. It quantifies a real dip off a recent high, validates it with volume and volatility expansion, enforces corrective structure with EMAs, and optionally restricts signals to an uptrend. The score, bar gradient, and meter make reading conditions instant. Entry lines and alerts turn that read into an executable plan. Tune the thresholds to your market and timeframe, then let the tool keep you patient in red, selective in white, and decisive in green.

RSI mura visionOverview
The Enhanced RSI with Custom 40/60 Zones is a Pine Script™ v6 open-source indicator that builds on the classic Relative Strength Index by adding two additional horizontal levels at 40 and 60, alongside the standard 30/70. These extra zones help you identify early momentum shifts and distinguish trending markets from ranging ones with greater precision.
Key Features & Originality
* Custom Mid-Zones (40/60): Standard RSI signals can be noisy around the 50 midpoint. By marking 40 as a “weak momentum” threshold and 60 as a “strong momentum” confirmation, you get clearer entry and exit cues.
* Color-Coded Zones: The RSI line changes color when crossing 40, 50, 60, 70, and 30, letting you visually spot momentum acceleration or deceleration.
* Configurable Alerts: Built-in alert conditions fire when RSI crosses 40 or 60 in either direction, so you never miss a potential trend onset or exhaustion.
* Lightweight & Clean: No external dependencies, no look-ahead bias, and minimal repainting—ideal for both novice and professional traders.
How It Works
1. Momentum Decomposition: The standard 14-period RSI measures overbought/oversold extremes. Adding 40/60 lets you see when momentum shifts from neutral to bullish (crossing above 60) or bearish (dropping below 40) earlier than the classic 70/30 thresholds.
2. Trend Confirmation vs. Pullbacks: Readings between 40–60 often correspond to healthy pullbacks within a trend. A bounce off 40 suggests continuation; a rejection at 60 warns of a deeper pullback or reversal.
Usage & Inputs
* RSI Length (default 14): Period for calculating RSI.
* Level Inputs: Customize levels for overbought (70), support (60), neutral (50), weak (40), and oversold (30).
* Alert Toggles: Enable/disable alerts on each cross.
Why This Adds Value
* Early Signals: Capture trend beginnings before the market reaches extreme overbought/oversold levels.
* Noise Reduction: Filter sideways chop by watching the 40–60 corridor.
* Flexibility: Works on any timeframe or ticker.
Pine Script™ Version: v6
Open-Source License: MPL-2.0
Feel free to fork, modify, and share.

Volume Weighted RSI (VW RSI)The Volume Weighted RSI (VW RSI) is a momentum oscillator designed for TradingView, implemented in Pine Script v6, that enhances the traditional Relative Strength Index (RSI) by incorporating trading volume into its calculation. Unlike the standard RSI, which measures the speed and change of price movements based solely on price data, the VW RSI weights its analysis by volume, emphasizing price movements backed by significant trading activity. This makes the VW RSI particularly effective for identifying bullish or bearish momentum, overbought/oversold conditions, and potential trend reversals in markets where volume plays a critical role, such as stocks, forex, and cryptocurrencies.
Key Features
Volume-Weighted Momentum Calculation:
The VW RSI calculates momentum by comparing the volume associated with upward price movements (up-volume) to the volume associated with downward price movements (down-volume).
Up-volume is the volume on bars where the closing price is higher than the previous close, while down-volume is the volume on bars where the closing price is lower than the previous close.
These volumes are smoothed over a user-defined period (default: 14 bars) using a Running Moving Average (RMA), and the VW RSI is computed using the formula:
\text{VW RSI} = 100 - \frac{100}{1 + \text{VoRS}}
where
\text{VoRS} = \frac{\text{Average Up-Volume}}{\text{Average Down-Volume}}
.
Oscillator Range and Interpretation:
The VW RSI oscillates between 0 and 100, with a centerline at 50.
Above 50: Indicates bullish volume momentum, suggesting that volume on up bars dominates, which may signal buying pressure and a potential uptrend.
Below 50: Indicates bearish volume momentum, suggesting that volume on down bars dominates, which may signal selling pressure and a potential downtrend.
Overbought/Oversold Levels: User-defined thresholds (default: 70 for overbought, 30 for oversold) help identify potential reversal points:
VW RSI > 70: Overbought, indicating a possible pullback or reversal.
VW RSI < 30: Oversold, indicating a possible bounce or reversal.
Visual Elements:
VW RSI Line: Plotted in a separate pane below the price chart, colored dynamically based on its value:
Green when above 50 (bullish momentum).
Red when below 50 (bearish momentum).
Gray when at 50 (neutral).
Centerline: A dashed line at 50, optionally displayed, serving as the neutral threshold between bullish and bearish momentum.
Overbought/Oversold Lines: Dashed lines at the user-defined overbought (default: 70) and oversold (default: 30) levels, optionally displayed, to highlight extreme conditions.
Background Coloring: The background of the VW RSI pane is shaded red when the indicator is in overbought territory and green when in oversold territory, providing a quick visual cue of potential reversal zones.
Alerts:
Built-in alerts for key events:
Bullish Momentum: Triggered when the VW RSI crosses above 50, indicating a shift to bullish volume momentum.
Bearish Momentum: Triggered when the VW RSI crosses below 50, indicating a shift to bearish volume momentum.
Overbought Condition: Triggered when the VW RSI crosses above the overbought threshold (default: 70), signaling a potential pullback.
Oversold Condition: Triggered when the VW RSI crosses below the oversold threshold (default: 30), signaling a potential bounce.
Input Parameters
VW RSI Length (default: 14): The period over which the up-volume and down-volume are smoothed to calculate the VW RSI. A longer period results in smoother signals, while a shorter period increases sensitivity.
Overbought Level (default: 70): The threshold above which the VW RSI is considered overbought, indicating a potential reversal or pullback.
Oversold Level (default: 30): The threshold below which the VW RSI is considered oversold, indicating a potential reversal or bounce.
Show Centerline (default: true): Toggles the display of the 50 centerline, which separates bullish and bearish momentum zones.
Show Overbought/Oversold Lines (default: true): Toggles the display of the overbought and oversold threshold lines.
How It Works
Volume Classification:
For each bar, the indicator determines whether the price movement is upward or downward:
If the current close is higher than the previous close, the bar’s volume is classified as up-volume.
If the current close is lower than the previous close, the bar’s volume is classified as down-volume.
If the close is unchanged, both up-volume and down-volume are set to 0 for that bar.
Smoothing:
The up-volume and down-volume are smoothed using a Running Moving Average (RMA) over the specified period (default: 14 bars) to reduce noise and provide a more stable measure of volume momentum.
VW RSI Calculation:
The Volume Relative Strength (VoRS) is calculated as the ratio of smoothed up-volume to smoothed down-volume.
The VW RSI is then computed using the standard RSI formula, but with volume data instead of price changes, resulting in a value between 0 and 100.
Visualization and Alerts:
The VW RSI is plotted with dynamic coloring to reflect its momentum direction, and optional lines are drawn for the centerline and overbought/oversold levels.
Background coloring highlights overbought and oversold conditions, and alerts notify the trader of significant crossings.
Usage
Timeframe: The VW RSI can be used on any timeframe, but it is particularly effective on intraday charts (e.g., 1-hour, 4-hour) or daily charts where volume data is reliable. Shorter timeframes may require a shorter length for increased sensitivity, while longer timeframes may benefit from a longer length for smoother signals.
Markets: Best suited for markets with significant and reliable volume data, such as stocks, forex, and cryptocurrencies. It may be less effective in markets with low or inconsistent volume, such as certain futures contracts.
Trading Strategies:
Trend Confirmation:
Use the VW RSI to confirm the direction of a trend. For example, in an uptrend, look for the VW RSI to remain above 50, indicating sustained bullish volume momentum, and consider buying on pullbacks when the VW RSI dips but stays above 50.
In a downtrend, look for the VW RSI to remain below 50, indicating sustained bearish volume momentum, and consider selling on rallies when the VW RSI rises but stays below 50.
Overbought/Oversold Conditions:
When the VW RSI crosses above 70, the market may be overbought, suggesting a potential pullback or reversal. Consider taking profits on long positions or preparing for a short entry, but confirm with price action or other indicators.
When the VW RSI crosses below 30, the market may be oversold, suggesting a potential bounce or reversal. Consider entering long positions or covering shorts, but confirm with additional signals.
Divergences:
Look for divergences between the VW RSI and price to spot potential reversals. For example, if the price makes a higher high but the VW RSI makes a lower high, this bearish divergence may signal an impending downtrend.
Conversely, if the price makes a lower low but the VW RSI makes a higher low, this bullish divergence may signal an impending uptrend.
Momentum Shifts:
A crossover above 50 can signal the start of bullish momentum, making it a potential entry point for long trades.
A crossunder below 50 can signal the start of bearish momentum, making it a potential entry point for short trades or an exit for long positions.
Example
On a 4-hour SOLUSDT chart:
During an uptrend, the VW RSI might rise above 50 and stay there, confirming bullish volume momentum. If it approaches 70, it may indicate overbought conditions, as seen near a price peak of 145.08, suggesting a potential pullback.
During a downtrend, the VW RSI might fall below 50, confirming bearish volume momentum. If it drops below 30 near a price low of 141.82, it may indicate oversold conditions, suggesting a potential bounce, as seen in a slight recovery afterward.
A bullish divergence might occur if the price makes a lower low during the downtrend, but the VW RSI makes a higher low, signaling a potential reversal.
Limitations
Lagging Nature: Like the traditional RSI, the VW RSI is a lagging indicator because it relies on smoothed data (RMA). It may not react quickly to sudden price reversals, potentially missing the start of new trends.
False Signals in Ranging Markets: In choppy or ranging markets, the VW RSI may oscillate around 50, generating frequent crossovers that lead to false signals. Combining it with a trend filter (e.g., ADX) can help mitigate this.
Volume Data Dependency: The VW RSI relies on accurate volume data, which may be inconsistent or unavailable in some markets (e.g., certain forex pairs or futures contracts). In such cases, the indicator’s effectiveness may be reduced.
Overbought/Oversold in Strong Trends: During strong trends, the VW RSI can remain in overbought or oversold territory for extended periods, leading to premature exit signals. Use additional confirmation to avoid exiting too early.
Potential Improvements
Smoothing Options: Add options to use different smoothing methods (e.g., EMA, SMA) instead of RMA for the up/down volume calculations, allowing users to adjust the indicator’s responsiveness.
Divergence Detection: Include logic to detect and plot bullish/bearish divergences between the VW RSI and price, providing visual cues for potential reversals.
Customizable Colors: Allow users to customize the colors of the VW RSI line, centerline, overbought/oversold lines, and background shading.
Trend Filter: Integrate a trend strength filter (e.g., ADX > 25) to ensure signals are generated only during strong trends, reducing false signals in ranging markets.
The Volume Weighted RSI (VW RSI) is a powerful tool for traders seeking to incorporate volume into their momentum analysis, offering a unique perspective on market dynamics by emphasizing price movements backed by significant trading activity. It is best used in conjunction with other indicators and price action analysis to confirm signals and improve trading decisions.

Percentile Calculation @xcod33This script calculates the current price percentile based on the highest and lowest price range in the last 52 weeks.
How to Use:
This script will provide the current price percentile relative to the 52-week price range on your chart. You can use it as an indicator to help identify where the current price stands relative to the historical price range in that period.
Targeted Market:
This script can be applied to various financial markets, including stocks, forex, indices, commodities, and others. It is not limited to a specific market and can be used across various trading instruments.
Market Conditions:
Here are some market conditions where this script can be useful:
1. Identifying Price Extremes: By looking at the current percentile, you can see if the price is near the highest or lowest extremes in the last 52 weeks. If the percentile is close to 0%, it means the price is near the lowest, while a percentile close to 100% indicates the price is near the highest.
Finding Consolidation Patterns: You can identify whether the price is within a certain range by looking at the percentile. If the percentile is around 50%, it indicates a relatively consistent price range.
2. Identifying Breakouts and Pullbacks: When the price is outside the historical range and the percentile approaches 100%, it indicates a breakout. When the price retraces back to the range and the percentile approaches 50%, it indicates a pullback.
3. However, keep in mind that this indicator only provides an additional perspective on the price relative to the 52-week range. It is not recommended to use this indicator as the sole basis for trading decisions. Always use further analysis and other indicators to confirm your trading signals.
Credit :
- M Rico Aditya Prayoga | Author
- Tri Okta Setiawan Marblo | Maker of formulas and ideas
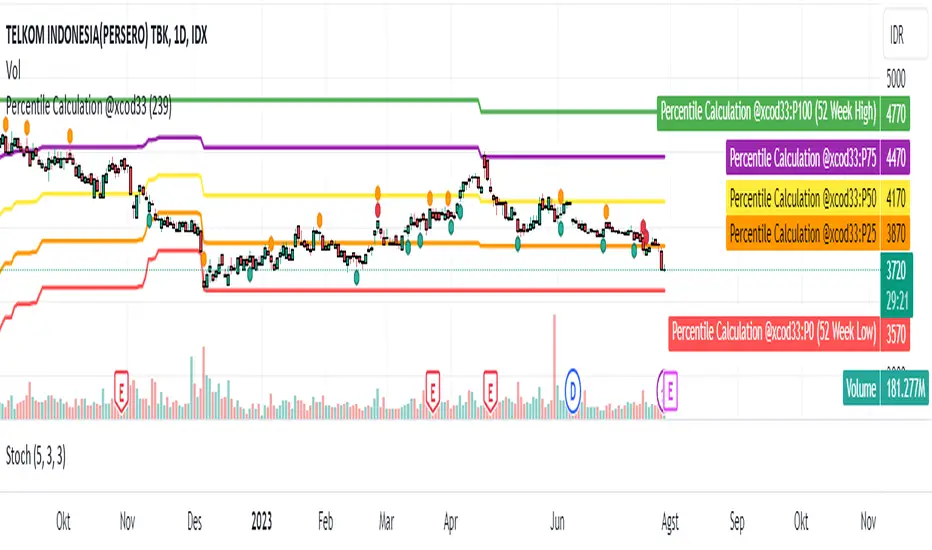
HTR Reclaim Hunter
🏹 HTR Reclaim Hunter
(1H Execution + Zones + 4H Bias)
HTR Reclaim Hunter is a trend-continuation indicator designed to identify high-probability pullback & reclaim entries using multi-timeframe bias, EMA structure, and dynamic reclaim zones.
This indicator is best suited for swing trading and intraday continuation setups, especially in trending markets.
🔑 CORE CONCEPT
Trade WITH the higher-timeframe trend.
Enter on pullbacks.
Confirm strength on reclaim.
HTR Reclaim Hunter combines:
4H trend bias
1H execution logic
EMA reclaim structure
Supply & demand reclaim zones
Built-in SL / TP visualization
🧭 RECOMMENDED SETTINGS
Best timeframe: 1H (designed for this)
Markets: Stocks, Crypto, Futures, Forex
Works best in: Trending markets (not chop)
📊 WHAT YOU SEE ON THE CHART
🔹 EMA Structure
EMA 50 (green): Trend filter
EMA 9 (colored): Momentum & pullback guide
🔹 Reclaim Zones
Green boxes: Support / demand zones
Red boxes: Resistance / supply zones
These zones highlight areas where price previously reacted and may reclaim.
🔹 Trade Signals
LONG label: Bullish reclaim setup
SHORT label: Bearish reclaim setup
🔹 Risk Levels (Optional)
Stop Loss (Red)
TP1 (Orange)
TP2 (Green)
🟢 LONG TRADE RULES
A LONG signal appears when ALL of the following are true:
4H trend is bullish
Price above 4H EMA 50
EMA 50 is rising
1H trend is bullish
Price above EMA 50
EMA 9 above EMA 50
Pullback occurs
Price pulls back below EMA 9
Reaches or taps EMA 50
Reclaim confirmation
Strong bullish candle closes back above EMA 9
Candle is not a doji
Signal prints
A green LONG label appears
👉 This indicates a trend continuation entry, not a reversal.
🔴 SHORT TRADE RULES
A SHORT signal appears when ALL of the following are true:
4H trend is bearish
Price below 4H EMA 50
EMA 50 is falling
1H trend is bearish
Price below EMA 50
EMA 9 below EMA 50
Pullback occurs
Price pulls back above EMA 9
Reaches or taps EMA 50
Reclaim confirmation
Strong bearish candle closes back below EMA 9
Candle is not a doji
Signal prints
A red SHORT label appears
🛑 STOP LOSS & TAKE PROFIT
When enabled, the indicator automatically plots:
Stop Loss
Based on recent swing high / low
TP1
1R (1× risk)
TP2
Configurable runner target (default 2R)
These are visual guides only — always manage risk according to your plan.
⚠️ IMPORTANT NOTES
This indicator is not meant for ranging or choppy markets
Best results occur when:
EMA 50 is clearly sloped
Price respects reclaim zones
Always confirm with:
Market structure
Volume
Higher-timeframe context
🔔 ALERTS
Alerts are available for:
HRH LONG
HRH SHORT
Alerts trigger on confirmed reclaim signals, not on every pullback.
❗ DISCLAIMER
This indicator is for educational purposes only.
It does not provide financial advice.
Always test and manage risk appropriately.
🏹 FINAL TIP
HTR Reclaim Hunter works best when you are patient.
Skip chop.
Wait for clean trends.
Hunt only high-quality reclaims.
If you want, I can also:
Write a short description version
Create a “Quick Start” section
Add example captions for screenshots
Help you choose TradingView tags & category
trend-following
ema reclaim
pullback strategy
multi-timeframe
price action

Multi-MA + Trend StatusMulti-MA + Trend Status is a streamlined trend analysis tool designed to simplify market state identification using a robust Moving Average (MA) crossover logic. By analyzing the relationship between price and three key Moving Averages (Fast, Medium, and Slow), this indicator instantly classifies the market into one of 9 distinct trend phases, displayed as a clean, non-intrusive text overlay on your chart.
Created by ivanpsh (MIT License).
Key Features
9 Distinct Trend States: Automatically detects and displays specific market conditions:
🟢 Bullish Phases: Uptrend, Bullish Crossover, Fast Bullish Crossover, Bottom Bounce.
🔴 Bearish Phases: Downtrend, Bearish Crossover, Fast Bearish Crossover, Top Pullback, Dead Cat Bounce.
Visual Simplicity: Displays the current market status in a large, transparent text overlay (Bottom Right by default) that provides instant clarity without cluttering your analysis.
Multi-Timeframe (MTF) Support: Monitor the trend of a higher timeframe (e.g., Daily) while trading on a lower timeframe (e.g., 5-minute) without switching charts.
Fully Configurable MAs:
Types: Supports SMA, EMA, RMA (Wilder's), WMA, and VWMA.
Lengths: Fully adjustable lengths (Defaults: 20, 50, 250).
Source: Calculation source is customizable (Close, Open, High, Low, HL2, etc.).
Integrated MA Overlay: Optionally view the actual Moving Average lines on the chart.
Color Coded: Fast (Purple), Medium (Orange), and Slow (Red) for easy differentiation.
Toggle: Lines are visible by default but can be hidden instantly via settings.
How It Works
The indicator logic compares the current Price against three Moving Averages (Default: 20, 50, 250) to determine the market "Health":
Uptrend: Price > 20 > 50 > 250 (Strongest Bullish Signal)
Downtrend: Price < 20 < 50 < 250 (Strongest Bearish Signal)
Crossovers: Identifies early reversals when Fast/Medium MAs cross the Slow MA.
Bounces & Pullbacks: Identifies specific retracement patterns (e.g., "Bottom Bounce" or "Top Pullback") where price interacts with MAs in a counter-trend move.
Settings Guide
Indicator Timeframe: Select the timeframe used for calculations (Default: Chart).
MA Type: Choose the averaging method (Default: SMA).
Visuals: Customize text size, screen position, and opacity.
Show 'No Match' Text: By default, the text overlay hides if the market is choppy and fits none of the 9 specific states. You can enable this to see a "No Logic Match" status instead.
This script is open-source under the MIT license. Feel free to use, study, and modify it for your own trading systems.

EMA 50/200/100 [NevoxCore]⯁ OVERVIEW
EMA 50/200/100 is a clean EMA trio for trend mapping.
It highlights the classic 50/200 bias, keeps a constant EMA-100 anchor in white, plots cross dots, and can mark the first pullback back to a target EMA within an ATR tolerance.
Solid bias bar coloring (Nevox pink/orange or classic green/red) and compact visuals make it fast and reliable with no repainting.
⯁ HOW IT WORKS
Calculates Fast EMA 50, Slow EMA 200, and an always-on EMA 100 (white).
Bias = Fast vs. Slow: Fast > Slow → long regime; Fast < Slow → short regime.
Cross dots appear at confirmed 50/200 crosses (once per bar close).
First Pullback: after a cross, the script arms a window and marks the first return to the chosen EMA (100 or Fast) within ATR × tolerance.
Bar coloring is solid by regime (pink/orange by default, classic green/red when enabled).
No lookahead; signals confirm on bar close.
⯁ KEY FEATURES
• EMA 50/200 with EMA-100 anchor (always visible, white)
• Cross Up/Down dots (style-configurable)
• First Pullback marker (toggle) with ATR tolerance & window
• Solid bias bar coloring (Nevox or classic)
• Optional bias fill between Fast/Slow
• Minimal 1-cell HUD (OFF by default)
• Ready-made alerts with clean prefixes
⯁ SETTINGS (quick)
Visual: Classic colors toggle; Bias Fill (ON); Fill Transparency (85); Bar Color (solid, ON; auto-disabled when Classic is ON).
Core: Source = Close; EMA Fast = 50; EMA Slow = 200.
Pullback: Show marker (ON); Target EMA = EMA 100; Tolerance × ATR = 0.5; Max Bars After Cross = 40; ATR Length = 14.
HUD: Mini HUD OFF; Position selector.
Status Line: OFF by default (optional EMA values).
⯁ ALERTS (built-in)
• Cross Up (Fast above Slow) — confirmed at bar close
• Cross Down (Fast below Slow) — confirmed at bar close
• First Pullback LONG — first return to target after long cross
• First Pullback SHORT — first return to target after short cross
Prefix: EMA and message includes {{ticker}} {{interval}} @ {{close}}.
Suggested: set TradingView alerts to Once Per Bar Close.
⯁ HOW TO USE
• Read trend quickly: 50 above 200 with a rising 100 = healthy long bias.
• Use the First Pullback to time entries after a cross (default target = EMA 100).
• Tune Tolerance × ATR by symbol/TF; 0.3–0.7 is a good start.
• Keep charts clean: bias fill + barcolor ON; switch to Classic for green/red if preferred.
⯁ WHY IT’S DIFFERENT
It preserves the classic 50/200 logic but adds a consistent EMA-100 anchor, a single, one-shot pullback detector, and clean bias bars — all in a lightweight overlay with no repaint tricks.
⯁ DISCLAIMER
Backtest and paper-trade before using live. Not financial advice. Performance depends on market, timeframe, and parameters.

True Trend Oscillator [wbburgin]The True Trend oscillator identifies trending or ranging markets with a stochastic ATR and RSI. Here are some examples for how it can be used.
Uptrends
If the candlesticks are lime green, this signals an uptrend. On the oscillator, you can identify an uptrend if the bull strength (the green line) is above the bear strength (the red line). The strength of the uptrend and the downtrend can be found by looking at the slope of these lines.
Downtrends
If the candlesticks are red, this signals a downtrend. On the oscillator, notice how the bear strength line is above the bull strength line.
Ranging Markets and Pullbacks
The True Trend oscillator can also be used to identify ranging markets or pullbacks. Let's look at the previous example again:
If you notice that the bull and bear lines are bouncing above the red weak-trend zone (as in the example above), this signals an extended trend. On the contrary, when the bull and bear lines fall into the weak-trend zone, this may indicate a larger pullback or a range to look to enter a trade again, as in this example, where the ranging candles in gray demonstrate temporary pullbacks in a larger bullish trend:
Ranges can also occur before trend reversals, so a range may also indicate a smart time to secure profits.
You can customize the ranging threshold in the settings. It can be set from 0-100 because the indicator is a stochastic.
Hope you all find this indicator useful!
