Uber REX Oscillator [UTS]The Rex Oscillator measures market behavior based on the relationship of the close to the open, high and low values of the same bar. A big difference between the high and close on a bar indicates weakness, and wide disparity between the low and close indicates strength. The difference between open and close also indicates market performance.
When the Rex Oscillator turns positive in a bearish trend, a reversal is indicated. Likewise, Rex turning negative in a bull market indicates a reversal to the downside.
General Usage
The Rex Oscillator is mostly used as a Reversal and Exit indicator.
Signals are created when Rex is crossing the Signal line. They that can be used to EXIT or LONG/SHORT a trade.
It is worth investing the time and fine-tune the settings: e.g. SuperSmoothed 16 and HMA 40 provides decent results.
Moving Averages
16 different Moving Averages are available:
ALMA (Arnaud Legoux Moving Average)
DEMA (Double Exponential Moving Average)
EMA (Exponential Moving Average)
FRAMA (Fractal Adaptive Moving Average)
HMA (Hull Moving Average)
JURIK (Jurik Moving Average)
KAMA (Kaufman Adaptive Moving Average)
Kijun (Kijun-sen / Tenkan-sen of Ichimoku)
LSMA (Least Square Moving Average)
RMA (Running Moving Average)
SMA (Simple Moving Average)
SuperSmoothed (Super Smoothed Moving Average)
TEMA (Triple Exponential Moving Average)
VWMA (Volume Weighted Moving Average)
WMA (Weighted Moving Average)
ZLEMA (Zero Lag Moving Average)
A freely determinable length allows for sensitivity adjustments that fits your own requirements.
Alerts
Traders can easily use the reversal signal to trigger alerts from:
Cross Up
Cross Down
Those values are > zero if a condition is triggered.
Alert condition example: "Cross Up" - "Greater Than" - "0"
Trend Visualization
Optional: If the signal line trend direction is DOWN it is painted red. If the trend direction is UP the signal line is painted in green.
在脚本中搜索"reversal"

DepthHouse - Trend & Reversal CandlesticksDepth House Trend and Reversal Candlestick Indicato r is a custom trading tool designed to help traders determine trend direction, and possible trend reversal points.
Here is a video which I give a brief overview and show it in action:
youtu.be
How it works:
Based on the default settings, there are 5 primary colors that each have their own possible signal.
The colors are:
Green - Trending upwards
Red – Trending downwards
Lime –Trending upwards with a chance of reversal
Orange – Trending downwards with a chance of reversal
Grey – General trend is unknown
Please Note: There are NOT trading signals. Each colored candle represents nothing other than a possibility of which way the trend may go. Be sure to use your own adequate analysis. Use at your own financial risk.
How to get:
As you can see this is an invite only script. In the coming months this indicator, along with many others will become pay to use only. (website on my profile page)
However all my indicators will be FREE until May 1, 2018 . So please try them out!
To take advantage of this FREE trial:
1. Subscribe to my YouTube channel. I have many more videos to come! Maybe even leave a comment of what you would like to see next!
2. Comment on this indicator post! Maybe even give me a follow :D
I hope you all enjoy!!
Indicator website: depthhouse.com

Fractal Reversal Stage 2Fractal Reversal Stage - is a high-precision trend-following and reversal indicator designed to capture market exhaustion points with mathematical accuracy. It utilizes a multi-timeframe analysis approach, combining momentum filtering with price action confirmation.
The indicator is built on a Non-Repainting Algorithm. Once a candle closes and a signal (BUY/SELL) is printed, it is fixed and will not disappear or shift. This makes it a reliable tool for both manual trading and alert-based strategies. The system includes a built-in state machine to manage trades, trailing trend lines, and a re-entry (averaging) system to optimize positions during deep pullbacks.
Main Features
Anti-Repaint Shield: Signals are confirmed only after the candle closes.
MTF Momentum Filter: Uses a higher timeframe RSI to filter out market noise.
State Machine Logic: Automatically tracks your trade from entry to exit.
Dynamic Re-entry: Provides signals to add to a position during extreme volatility.
Manual: Arguments & Settings
1. Timeframes / Таймфреймы
Working TF (Candles): The timeframe where you look for entry patterns and where the trend line is drawn.
RSI Filter TF: The timeframe for the momentum filter. Usually set higher than the Working TF to identify the global trend.
2. RSI Settings / Настройки RSI
RSI Length: The period for RSI calculation. Lower values are more sensitive; higher values are smoother.
Auto-Adjust Levels: When enabled, the script automatically tightens or loosens entry levels based on the RSI period.
Manual OB/OS Levels: Manually set the "Pale Zone" levels where the indicator starts looking for a trade.
3. Logic & Filters / Логика
Re-entry Dist (ATR Mult): Controls how far the price must move against you before an "Add" (▲/▼) signal appears. Uses ATR for volatility adjustment.
ATR Period: The lookback period for volatility calculation.
Min. Body %: A filter for candle strength. It requires the candle body to be a certain percentage of the total candle range to validate a signal.
4. Visuals / Визуал
Trend Line Width: Adjusts the thickness of the tracking line.
Colors: Customizable colors for exit dots and overbought/oversold background zones.
BUY/SELL Labels: Primary entry signals confirmed at the close of the candle.
Chevrons (▲/▼): Averaging points (Re-entry). These appear when the price moves against the initial trade into extreme zones, signaling an opportunity to optimize the position.
Black Dots: Trade Closure. These dots at the end of the trend lines mark the final exit point where the position should be fully closed.
Trend Lines: Visual tracking of the current active trade.
💡 Recommended Settings for Ethereum (ETH/USDT)
This specific configuration is optimized for the cyclical nature of Ethereum, aiming for "peak-to-peak" trade management:
Working TF: 15 min
RSI Filter TF: 2 hours
RSI Length: 10
Re-entry Dist: 1.5
ATR Period: 14
Min. Body %: 0.6
Note: Markets are diverse. You MUST adjust these settings for each specific coin or asset to account for different volatility and liquidity levels.
For questions regarding setup or optimization, please send a private message.
//______________________________________________________________________________//
Fractal Reversal Stage — это высокоточный трендовый и разворотный индикатор, разработанный для фиксации точек истощения рынка с математической точностью. Он использует мультифрактальный анализ, сочетая импульсную фильтрацию с подтверждением ценового действия.
Алгоритм индикатора не перерисовывает график. Как только свеча закрывается и появляется сигнал (BUY/SELL), он фиксируется и больше не исчезает. Это делает его надежным инструментом как для ручной торговли, так и для стратегий на основе алертов. Система включает в себя встроенную логику управления состоянием сделки, линии сопровождения тренда и систему усреднения (Re-entry).
Основные характеристики
Защита от перерисовки: Сигналы подтверждаются только после закрытия свечи.
MTF Фильтр: Использование старшего таймфрейма RSI для фильтрации рыночного шума.
Логика состояний: Автоматическое ведение сделки от входа до выхода.
Динамическое усреднение: Сигналы для добора позиции при экстремальной волатильности.
Мануал: Аргументы и Настройки
1. Timeframes / Таймфреймы
Working TF (Candles): Рабочий таймфрейм свечей, на котором ищутся паттерны и строится линия тренда.
RSI Filter TF: Таймфрейм для RSI фильтра. Обычно ставится выше рабочего для определения глобального тренда.
2. RSI Settings / Настройки RSI
RSI Length: Период расчета RSI. Меньшие значения более чувствительны, большие — более плавные.
Auto-Adjust Levels: При включении скрипт сам корректирует уровни входа в зависимости от периода RSI.
Manual OB/OS Levels: Ручная настройка уровней «бледной зоны», где начинается поиск сделки.
3. Logic & Filters / Логика
Re-entry Dist (ATR Mult): Определяет, как далеко цена должна уйти против вас, чтобы появился сигнал «Add» (▲/▼). Использует ATR для подстройки под волатильность.
ATR Period: Период усреднения волатильности.
Min. Body %: Фильтр силы свечи. Требует, чтобы тело свечи составляло определенный % от всего диапазона свечи.
4. Visuals / Визуал
Метки BUY/SELL: Основные сигналы на вход, подтвержденные закрытием свечи.
Шевроны (▲/▼): Точки для усреднения (Re-entry). Появляются, когда цена идет против сделки в экстремальные зоны, давая сигнал на добор позиции.
Чёрные точки: Закрытие сделки. Эти точки на концах линий тренда обозначают место выхода, где позиция должна быть полностью закрыта.
Линии тренда: Визуальное сопровождение активной сделки.
💡 Пример настройки для Ethereum (ETH/USDT)
Данная конфигурация оптимизирована для цикличного движения Эфира и нацелена на максимально точный выход на пиках:
Рабочий ТФ: 15 мин
ТФ Фильтра RSI: 2 часа
Период RSI: 10
Dist. Re-entry: 1.5
ATR Period: 14
Мин. тело свечи: 0.6
Важно: Рынки различаются. Вы ДОЛЖНЫ подбирать индивидуальные настройки для каждой монеты или актива, учитывая их волатильность и ликвидность.
По вопросам настройки и оптимизации пишите в личные сообщения.

Quasimodo (QML) Pattern [Kodexius]Quasimodo (QML) Pattern is a market structure indicator that automatically detects Bullish and Bearish Quasimodo formations using confirmed swing pivots, then visualizes the full structure directly on the chart. The script focuses on the classic liquidity-grab narrative of the QML: a sweep beyond a prior swing (the Head) followed by a decisive market structure break (MSB), leaving behind a clearly defined reaction zone between the Left Shoulder and the Head.
Detection is built on pivot highs and lows, so patterns are evaluated only after swing points are validated. Once a valid 4 pivot sequence is identified, the indicator draws the pattern legs, highlights the internal triangle area to emphasize the grab, marks the MSB leg, and projects a QML zone that can be used as a potential area of interest for retests.
This tool is designed for traders who work with structure, liquidity concepts, and reversal/continuation triggers, and who want a clean, repeatable QML visualization without manually marking swings.
🔹 Features
🔸 Confirmed Pivot Based Structure Mapping
The script uses classic built-in pivot logic to detect swing highs and swing lows.
🔸 Automatic Bullish and Bearish QML Detection
The indicator evaluates the most recent 4 pivots and checks for a valid alternating sequence (High-Low-High-Low or Low-High-Low-High). When the sequence matches QML requirements, the script classifies the setup as bullish or bearish:
Bullish logic (structure reversal up):
- Left Shoulder is a pivot Low
- Head is a lower Low than the Left Shoulder (liquidity sweep)
- MSB pivot exceeds the Reaction pivot
Bearish logic (structure reversal down):
- Left Shoulder is a pivot High
- Head is a higher High than the Left Shoulder (liquidity sweep)
- MSB pivot breaks below the Reaction pivot
🔸 Full Pattern Visualization (Legs + Highlighted Core)
When a pattern triggers, the script draws:
Three main legs: Left Shoulder to Reaction, Reaction to Head, Head to MSB
A shaded triangular highlight over the internal structure to make the liquidity-grab shape easy to spot at a glance
🔸 QML Zone Projection
A QML Zone box is drawn using the price range defined between the Left Shoulder and the Head, then extended to the right to remain visible as price develops. This zone is intended to act as a practical reference area for potential retests and reaction planning after MSB confirmation.
🔸 MSB Emphasis
A dotted MSB line is drawn between the Reaction point and the MSB point to visually emphasize the confirmation leg that completes the pattern logic.
🔸 Clean Point Tagging and Directional Labeling
Key points are labeled directly on the chart:
- “LS” at the Left Shoulder
- “Head” at the sweep pivot
- “MSB” at the break pivot
A directional label (“Bullish QML” or “Bearish QML”) is also printed to quickly identify the detected bias.
🔸 Configurable Visual Style
All main visual components are user configurable:
- Bullish and bearish colors
- Line width
- Label size
🔸 Efficient Update Logic
Pattern checks are only performed when a new pivot is confirmed, avoiding unnecessary repeated calculations on every bar. The most recent pattern’s projected elements (zone and label positioning) are updated as new bars print to keep the latest setup readable.
🔹 Calculations
This section summarizes the core logic used for detection and plotting.
1. Pivot Detection (Swing Highs and Lows)
The script relies on confirmed pivots using the user inputs:
Left Bars: how many bars must exist to the left of the pivot
Right Bars: how many bars must exist to the right to confirm it
float ph = ta.pivothigh(leftLen, rightLen)
float pl = ta.pivotlow(leftLen, rightLen)
When a pivot is confirmed, its true bar index is the pivot bar, not the current bar, so the script stores:
bar_index
2. Pivot Storage and History Window
Each pivot is stored as a structured object containing:
- price
- index
- isHigh (true for pivot high, false for pivot low)
A rolling history is maintained (up to 50 pivots) to keep processing stable and memory usage controlled.
3. Sequence Validation (Alternation Check)
The pattern evaluation always uses the latest 4 pivots:
p0: Left Shoulder candidate
p1: Reaction candidate
p2: Head candidate
p3: MSB candidate
Before checking bullish/bearish rules, the script enforces alternating pivot types:
bool correctSequence =
(p0.isHigh != p1.isHigh) and
(p1.isHigh != p2.isHigh) and
(p2.isHigh != p3.isHigh)
This prevents invalid structures like consecutive highs or consecutive lows from being interpreted as QML.
4. Bullish QML Conditions
A bullish QML is evaluated when the Left Shoulder is a Low:
Head must be lower than Left Shoulder (sweep)
MSB must be higher than Reaction (break)
if not p0.isHigh
if p2.price < p0.price and p3.price > p1.price
// Bullish QML confirmed
Interpretation:
p2 < p0 represents the liquidity grab below the prior swing low
p3 > p1 represents the market structure break above the reaction high
5. Bearish QML Conditions
A bearish QML is evaluated when the Left Shoulder is a High:
Head must be higher than Left Shoulder (sweep)
MSB must be lower than Reaction (break)
if p0.isHigh
if p2.price > p0.price and p3.price < p1.price
// Bearish QML confirmed
Interpretation:
p2 > p0 represents the liquidity grab above the prior swing high
p3 < p1 represents the market structure break below the reaction low
6. Drawing Logic (Structure, Highlight, Zone, Labels)
When confirmed, the script draws:
Three connecting legs (LS to Reaction, Reaction to Head, Head to MSB)
A shaded triangle using a transparent “ghost” line to enable filling
A dotted MSB emphasis line between Reaction and MSB
A QML Zone box spanning the LS to Head price range and projecting to the right
Point labels: LS, Head, MSB
A direction label: “Bullish QML” or “Bearish QML”
7. Latest Pattern Extension
To keep the newest setup readable, the script updates the most recently detected pattern by extending its projected elements as new bars print:
QML zone right edge is pushed forward
The main label x position is pushed forward
This keeps the last identified QML zone visible as price evolves, without having to redraw historical patterns on every bar.

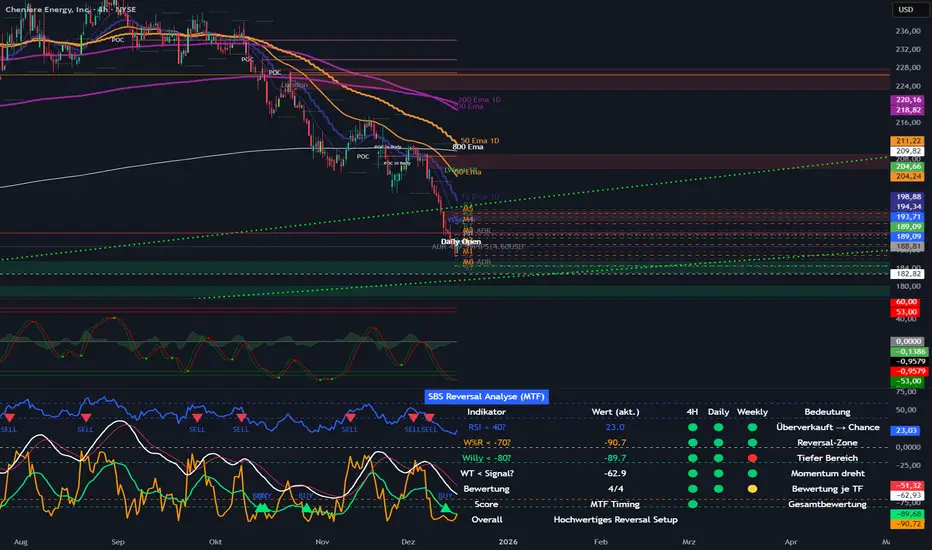
SBS Reversal Engine MTFSBS Reversal Engine (MTF) is a professional multi-timeframe indicator designed to identify high-quality reversal zones across stocks, crypto, and indices.
It combines RSI, Williams %R, a smoothed Williams oscillator ("Willy"), and a proprietary WaveTrend momentum filter to evaluate market conditions across 4H, Daily, and Weekly timeframes.
A visual traffic-light system provides a clear overview of oversold conditions, momentum shifts, and multi-timeframe alignment.
The integrated MTF Score System helps traders focus on high-quality setups where market structure, context, and timing align.
This indicator is an analytical tool and does not constitute financial advice.
© Step Buy Step 2025 – All rights reserved
Candle Reversal Pattern Detector (Trend-Filtered)This indicator is designed to highlight potential reversal moments in price action while keeping them aligned with the broader market context. The focus is on clarity, selectivity, and visual simplicity. Very fast trading.
Core concept
The tool observes candle behavior to identify situations where market control may be shifting. These situations are considered relevant only when they are consistent with the prevailing directional environment, helping to avoid counterproductive signals.
Context awareness
Signals are filtered using a directional reference, so reversal patterns are shown only when they appear within a coherent market phase. This helps reduce noise and emphasizes higher-quality situations.
Visual approach
Signals are displayed directly on the chart using clear, minimal markers. Optional labels can be enabled to provide immediate visual recognition without cluttering the price action.
How to use it
This indicator is best used as a decision-support tool rather than a standalone trading system. It works well when combined with basic structure reading and higher-timeframe context.
Best conditions
Most effective in markets that respect directional movement and show clean price behavior. In very choppy or low-structure environments, signals should be interpreted with discretion.
For educational and analytical purposes only. Always test across different instruments and timeframes before relying on it.

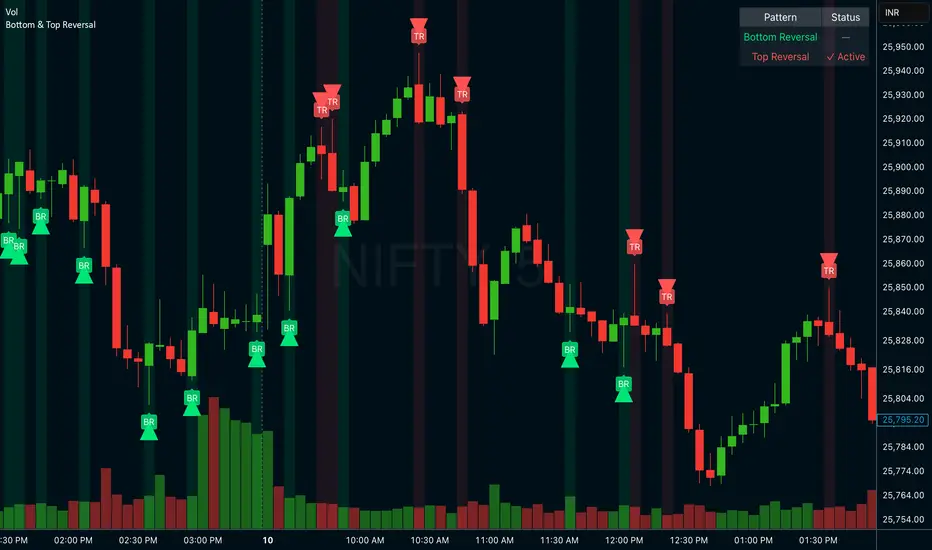
Bottom & Top ReversalBottom & Top Reversal
Bottom Reversal (Bullish):
Opens gap down but recovers strongly
Makes new low but closes above previous close
Lime green arrow + label
Top Reversal (Bearish):
Opens gap up but fails
Makes new high but closes below previous close
Red arrow + label
Extra features:
Status table showing active patterns
Toggle each pattern on/off
Background highlights
Alert system
CVD Candle Divergence IndicatorThis indicator identifies potential reversal points by comparing the direction of price candles with the direction of cumulative volume delta (CVD) candles, while applying additional filters based on RSI behavior, volume strength, and candlestick wick structure.
It aims to highlight situations where price movement and volume delta disagree, which can signal fading momentum or absorption.
Core Concept
The script combines several independent conditions that must occur simultaneously before a signal is displayed on the chart. A signal appears only when all filters agree, reducing the number of low-quality or noise-based setups.
1. CVD Candle Direction
The indicator uses TradingView’s built-in function for volume delta candles. These candles summarize buying and selling aggression derived from lower-timeframe volume.
A CVD green candle indicates more buyer-initiated volume.
A CVD red candle indicates more seller-initiated volume.
The script looks for instances where price and CVD candles disagree:
Bullish signal: price candle is green while CVD candle is red
Bearish signal: price candle is red while CVD candle is green
This creates a form of divergence using volume delta instead of price highs and lows.
2. RSI Context Filter
Momentum is evaluated through RSI. Instead of relying only on standard overbought/oversold levels, the script also includes a recency filter based on the RSI midline (50 level).
RSI Threshold
Users can specify the RSI value required for bullish and bearish conditions.
Recency Filter
The indicator only allows signals if RSI has crossed the 50 level within a user-defined number of bars. This prevents signals during extended one-directional trends where divergence is less meaningful.
3. Volume Strength Filter
Signals are filtered through a volume-based requirement:
Current volume must exceed a moving average of volume multiplied by a user-defined factor.
This ensures that signals appear only during periods with sufficient participation and reduces noise during low-volume consolidation.
4. Wick-to-Body Ratio Filter
To incorporate price-action characteristics, the script evaluates the wick structure of each candle:
Bullish signals require a sufficiently large lower wick relative to the total candle range.
Bearish signals require a sufficiently large upper wick relative to the total candle range.
The wick percentage is fully configurable.
This adds a rejection or absorption component to the logic and prevents signals on weak or indecisive candles.
Signal Conditions
A bullish signal appears when all of the following are true:
Price candle is green
RSI is below the bullish threshold
CVD candle is red
Volume is above its threshold (if enabled)
RSI has interacted with the 50 level recently
Lower wick meets the wick-percentage requirement
A bearish signal requires the opposite conditions:
Price candle is red
RSI is above the bearish threshold
CVD candle is green
Volume is above its threshold (if enabled)
RSI recently interacted with the 50 level
Upper wick meets the wick-percentage requirement
Signals appear as arrows directly on the chart.
Use Cases
This indicator is intended for traders who work with:
Momentum shifts
Volume delta analysis
Candle structure-based confirmation
Reversal or exhaustion setups
Divergence concepts beyond price highs/lows
It does not predict market direction. Instead, it highlights areas where multiple conditions suggest a potential imbalance between price movement and volume delta.
I would strongly suggest to use this indicator only on timeframes 2-15m.
Here are a few examples:

Multi-Layer Reversal Pro [The_lurker]🔮 MULTI-LAYER REVERSAL PRO
💡 CONCEPT
─────────────────────────────────────────────────────────────
An intelligent indicator that detects potential market reversal
points through multi-layer analysis combining momentum indicators,
Smart Money Concepts, and an advanced confirmation system.
HOW IT WORKS:
1. When prices reach exhaustion levels, market behavior is
analyzed through key Smart Money Concepts
2. When SMC concepts align with exhaustion, additional
advanced confirmations are activated
3. When all conditions are met, the appropriate signal appears
🥇 Gold 5M Tips
═════════════════════════════════════════════════════════════
📊 SIGNAL TYPES
═════════════════════════════════════════════════════════════
🟢 BUY SIGNALS
─────────────────────────────────────────────────────────────
BUY
Confirmed buy signal - all conditions met
Confidence: HIGH ●●●
E.BUY (Early Buy)
Early buy opportunity - strong exhaustion + high ADX
Confidence: MEDIUM ●●○
🔴 SELL SIGNALS
─────────────────────────────────────────────────────────────
SELL
Confirmed sell signal - all conditions met
Confidence: HIGH ●●●
E.SELL (Early Sell)
Early sell opportunity - strong exhaustion + high ADX
Confidence: MEDIUM ●●○
🟡 YELLOW WARNING
─────────────────────────────────────────────────────────────
Yellow candle = Warning of potential nearby reversal
→ Action: Monitor only, do not rush
⚠️ CLOSE TRADE
─────────────────────────────────────────────────────────────
"Close Trade ⚠️" appears when:
- A yellow warning candle appeared
- The next candle closed below the TP level
→ Meaning: Exit long position + automatic short entry
═════════════════════════════════════════════════════════════
🎯 QUICK ACTION GUIDE
═════════════════════════════════════════════════════════════
BUY / SELL
Confidence: HIGH
✅ Direct entry
E.BUY / E.SELL
Confidence: MEDIUM
⚡ Cautious entry / smaller size
Yellow Candle
Confidence: ALERT
👁️ Monitor only
Close Trade
Confidence: URGENT
🚪 Immediate exit
⚠️ DISCLAIMER
━━━━━━━━━━━━━━━━━━━━━━━━━━━━━━━━━━━━━━━━━━━
This indicator is for educational purposes only. Past performance does not
guarantee future results. Always use proper risk management and conduct your
own analysis before making trading decisions.
═════════════════════════════════════════════════════════════
مؤشر الانعكاس الذكي متعدد الطبقات
═════════════════════════════════════════════════════════════
💡 الفكرة
─────────────────────────────────────────────────────────────
مؤشر ذكي يكتشف نقاط الانعكاس المحتملة في السوق عبر تحليل
متعدد الطبقات يجمع بين مؤشرات الزخم ومفاهيم Smart Money
مع نظام تأكيدات متقدم.
آلية العمل:
1. عند وصول الأسعار إلى مراحل التشبع ، يتم تحليل سلوك السوق من عدة نقاط جوهرية تعتمد على مفاهيم Smart Money
2. عند تطابق مفاهيم SMC مع التشبع ، تُفعَّل تأكيدات متقدمة
3. عند تحقق جميع الشروط، تظهر الإشارة المناسبة
🥇 نصيحة للذهب 5 دقائق
═════════════════════════════════════════════════════════════
📊 أنواع الإشارات
═════════════════════════════════════════════════════════════
🟢 إشارات الشراء
─────────────────────────────────────────────────────────────
1- شراء BUY
إشارة شراء مؤكدة - استوفت جميع الشروط
الثقة: عالية ●●●
2- شراء مبكر E.BUY
فرصة شراء مبكرة - تشبع قوي + ADX عالي
الثقة: متوسطة ●●○
🔴 إشارات البيع
─────────────────────────────────────────────────────────────
1- بيع SELL
إشارة بيع مؤكدة - استوفت جميع الشروط
الثقة: عالية ●●●
2- بيع مبكر E.SELL
فرصة بيع مبكرة - تشبع قوي + ADX عالي
الثقة: متوسطة ●●○
🟡 التحذير الأصفر
─────────────────────────────────────────────────────────────
الشمعة الصفراء = تحذير من احتمال انعكاس قريب
← التصرف: راقب فقط ولا تتسرع
⚠️ إغلاق الصفقة
─────────────────────────────────────────────────────────────
تظهر علامة "إغلاق الصفقة ⚠️" عندما:
- ظهرت شمعة تحذير صفراء
- الشمعة التالية أغلقت تحت مستوى TP
← المعنى: إشارة خروج من الشراء + فتح صفقة بيع تلقائياً
═════════════════════════════════════════════════════════════
🎯 دليل التصرف السريع
═════════════════════════════════════════════════════════════
شراء/بيع BUY / SELL
الثقة: عالية
✅ دخول مباشر
شراء مبكر/ بيع مبكر E.BUY / E.SELL
الثقة: متوسطة
⚡ دخول بحذر أو حجم أقل
شمعة صفراء
الثقة: تنبيه
👁️ مراقبة فقط
إغلاق صفقة
الثقة: عاجل
🚪 خروج فوري
═════════════════════════════════════════════════════════════
⚠️ إخلاء المسؤولية
━━━━━━━━━━━━━━━━━━━━━━━━━━━━━━━━━━━━━━━━━━━
هذا المؤشر للأغراض التعليمية فقط. الأداء السابق لا يضمن النتائج المستقبلية.
استخدم دائماً إدارة مخاطر مناسبة وقم بتحليلك الخاص قبل اتخاذ قرارات التداول.

Aurora Reversal Suite: Liquidity & Inversion ModelConcept & Methodology The Aurora Reversal Suite is not a general-purpose indicator; it is a hard-coded algorithmic implementation of a specific institutional reversal model often referred to as the "2022 Mentorship Model" or "Sweep-to-Inversion" setup.
While many scripts display Liquidity Sweeps or Fair Value Gaps individually, this script solves the problem of "confluence fatigue" by algorithmically enforcing a strict order of operations. It does not alert on every sweep; it alerts only when a specific sequence of price action events occurs in a verified order.
The Algorithmic Logic (How it Works) The core value of this script lies in its conditional filtering logic, which automates the following manual verification process:
Event A: Liquidity Sweep
The script first monitors key institutional levels: Previous Day High/Low, Session High/Low (Asia/London/NY), and dynamic Swing Points.
It detects a "Sweep" event when price breaches a level but fails to close beyond it (or closes back inside within a defined lookback period).
Event B: Displacement & Inversion
Unlike standard FVG indicators, this script searches specifically for Inversion FVGs (iFVG) that form immediately following the sweep event.
The script logic requires that the iFVG be created by the displacement leg that reverses the sweep. This binds the "Entry Signal" directly to the "Liquidity Event."
Event C: Algorithmic Filtering (The "Strict" Mode)
To filter out false positives common in choppy markets, the script applies a multi-layer filter before printing a signal:
Volume Qualification: The signal bar's volume must exceed a user-defined multiple of the N-period average volume (default 1.5x) to confirm institutional participation.
SMT Divergence Filter: The script cross-references a correlated asset (e.g., NQ vs. ES or EU vs. DXY). If enabled, a signal is only valid if the correlated asset failed to make a matching high/low at the moment of the sweep (SMT Divergence).
Bias Alignment: The script calculates directional bias using a waterfall logic (Daily > 4H > 1H). Signals counter to this calculated bias are suppressed in "Strict" mode.
Included Features & Components
Automated Market Structure: Real-time labeling of BOS (Break of Structure) and MSS (Market Structure Shift) based on swing point logic.
Session Killzones: Visual boxes for Asia, London, and NY sessions with auto-extending high/low lines to track session liquidity.
Multi-Timeframe Dashboard: A calculated table displaying the trend state of the Daily, 4H, and 1H timeframes to assist with top-down analysis.
Power of 3 (PO3) Overlay: Visualization of higher-timeframe candle geometry on lower-timeframe charts to identify accumulation/distribution phases.
Why This Mashup is Necessary Attempting to trade this specific reversal model using separate indicators results in chart clutter and conflicting signals. By combining the Sweep detection, iFVG creation, and SMT filtering into a single codebase, we can programmatically eliminate "naked" sweeps that have no displacement, providing a cleaner and more objective view of the market structure.
Settings & Customization
Signal Mode: Choose between "Simple" (Price Action only) or "Strict" (Trend + Volume filtered).
SMT Input: Manually define the correlated asset ticker for divergence checks.
Visuals: Fully customizable colors for Bullish/Bearish scenarios to fit light or dark themes.
Disclaimer This script is a tool for market analysis and does not guarantee future results. It is intended to assist traders in identifying high-probability setups based on historical price action concepts.

Brian Shannon Market Structure + Reversal Engine Shannon Market Structure & Reversal Engine
This indicator is based on the concepts from Brian Shannon's book, *Technical Analysis Using Multiple Timeframes*. It focuses on **Market Structure**, **Trend Alignment**, and **Volume Weighted Average Price (VWAP)** to identify low-risk, high-probability trade setups. It automates the identification of the 4 Market Stages and provides actionable entry/exit signals based on momentum shifts and institutional value levels.
**Key Visuals:**
1. **Trend Ribbon:**
* **Green:** Stage 2 Markup (Bullish). The 10, 20, and 50 SMAs are aligned upward. Look for LONGS.
* **Red:** Stage 4 Decline (Bearish). The 10, 20, and 50 SMAs are aligned downward. Look for SHORTS.
* **Gray:** Stage 1 or 3 (Neutral). Moving averages are tangled. Avoid trading or reduce size.
2. **VWAP (Orange Line):** The "Institutional Truth." Used as a dynamic support/resistance level.
3. **Signals:**
* **"L" (Green):** Long Entry. Triggered when price reclaims the VWAP while the intermediate trend is bullish.
* **"S" (Red):** Short Entry. Triggered when price loses the VWAP while the intermediate trend is bearish.
* **"Rev" (X):** Reversal Warning. Triggered when the Short-Term trend (10 SMA) crosses the Intermediate-Term trend (20 SMA), signaling a loss of momentum.
-----
### **Instructions: How to Trade This**
**1. The Setup (Context)**
* **Check the Dashboard:** Look at the "Daily Trend" box in the top right. If it says "Stage 2 (Bull)," you are primarily looking for **Long** trades. Do not fight the Daily trend.
* **Check the Ribbon:** On your trading timeframe (e.g., 5m, 15m, 30m), wait for the ribbon to turn **Green**.
**2. The Entry (Timing)**
* **Wait for the "L":** Do not buy just because the ribbon is green. Wait for price to pull back towards the Orange VWAP line and then cross back above it.
* **The Signal:** When the **"L"** label appears, it means price has reclaimed value and momentum is aligned. This is your trigger.
**3. The Exit / Defense (Risk Management)**
* **Stop Loss:** Place your stop below the most recent swing low or below the VWAP.
* **Reversal Warning:** If you see an **Orange "Rev" X** appear at the top of a candle, the fast momentum is breaking down. This is not a signal to short, but a signal to **take profits** or tighten your stop loss immediately.
**4. The Rules (Brian Shannon's Philosophy)**
* **Innocent Until Proven Guilty:** If the ribbon is Green and rising, stay with the trend.
* **Guilty Until Proven Innocent:** If the ribbon is Red and falling, stay short or in cash.
* **Don't Predict:** Do not buy at the absolute bottom. Wait for the ribbon to turn and the VWAP to be reclaimed. Better to buy higher with confirmation than lower with hope.
Timeframe, Rating, Adjustments Needed
Intraday (1m - 4h), Perfect, "Use exactly as is. This is the ""sweet spot"" for this script."
Daily (1D),Good, "Turn OFF ""Show Session VWAP"" in settings. Use the Ribbon for Stage Identification."
Weekly/Monthly, Okay, "Turn OFF VWAP. Ignore the ""L/S"" entry signals (as they rely on VWAP). Use strictly for the Ribbon color (Green = Long Term Bull Market)."

2-Close + Bar 5 Reversal (Scan Ready)Bulkowski's Bullish 2-Step Reversal
Bar 1 Any price bar.
Bar 2 Price makes a low below bar 1 with a lower close, too.
Bar 3 Price has a low below bar 2 but a close above bar 1 (which will also be above bar 2's close). Bars 1 to 3 form a 2-close reversal pattern.
Bar 4 Makes a close below bar 3's close.
Bar 5 Has a low below bar 4 but closes above bars 3 and 4.
Breakout Breaks out upward 79% of the time in stocks.
From his page: thepatternsite.com

Delta Zones Smart Money Concept (SMC) UT Trend Reversal Mul.Sig.🚀 What's New in This Version (V5 Update)
This version is a major overhaul focused on improving trade entry timing and risk management through enhanced UT Bot functionality:
Integrated UT Trailing Stop (ATR-based): The primary trend filter and moving stop-loss mechanism is now fully integrated.
Pre-Warning Line: A revolutionary feature that alerts traders when the price penetrates a specific percentage distance (customizable) from the UT Trailing Stop before the main reversal signal fires.
"Ready" Signal: Plots a "Ready" warning label on the chart and triggers an alert condition (UT Ready Long/Short) for pre-emptive trade preparation.
V5 Compatibility: All code has been optimized for Pine Script version 5, utilizing the modern array and type structures for efficient Order Block and Breaker Block detection.
💡 How to Use This Indicator
This indicator works best when confirming signals across different components:
1. Identify the Trend Bias (UT Trailing Stop)
Uptrend: UT Trailing Stop line is Green (Focus only on Buy/Long opportunities).
Downtrend: UT Trailing Stop line is Red (Focus only on Sell/Short opportunities).
2. Prepare for Entry (Warning Line)
Action: When you see the "Ready" label or the price hits the Pre-Warning Line (Dotted Orange Line), this is your alert to prepare for a trend flip, or to tighten the stop on your current trade.
3. Confirm the Entry (Multi-Signals)
Look for a primary entry signal that aligns with the desired trend:
High-Conviction Entry: Wait for the UT Buy/Sell label (confirmed trend flip) AND a Combined Buy/Sell arrow (confirmed by your selected Oscillator settings).
High-Liquidity Entry: Look for a Delta Zone Box forming near an active Order Block or Breaker Block (SMC zones), and then confirm with a UT or Combined Signal.
4. Manage Risk (Trailing Stop)
Always set your initial Stop Loss (SL) either just outside the opposite Order Block or at the UT Trailing Stop level itself.
If the price closes back across the UT Trailing Stop, exit your position immediately, as the trend bias has officially shifted.
Features & Components
1. Delta Zones (Liquidity/Wick Pressure)
Identifies periods of extreme buying or selling pressure based on wick-to-body ratios and standard deviation analysis.
Plots colored pressure boxes (Buy/Sell) to highlight potential exhaustion points or institutional activity.
2. Smart Money Concepts (SMC)
Automatically detects and plots Order Blocks (OBs) and Breaker Blocks (BBs) based on confirmed Market Structure Breaks (MSBs).
Includes Chop Control logic to remove less reliable Breaker Blocks.
3. UT Bot Trailing Stop & Warning Line
UT Trailing Stop (ATR-based): Plots a dynamic trend line (Green/Red) that acts as a moving stop-loss and primary trend filter.
Ready/Warning Signals: Alerts traders (via the "Ready" label and orange lines) when the price enters a "Pre-Reversal Zone" near the Trailing Stop.
4. Multi-Indicator Confirmation (Filters)
Includes customizable signals based on the crossover/crossunder of RSI, CCI, and Stochastic indicators against configurable Overbought/Oversold levels.
Allows selection of combination signals (e.g., RSI & CCI, All Combined, etc.) for high-conviction entries.

Huli (Reversal) PatternsThis indicator identifies and highlights specific candlestick patterns that commonly appear at potential reversal points in price action. The indicator scans for five distinct pattern types and visually marks them on your chart with customizable colors and optional signal shapes.
Pattern Detection:
Doji - Identifies candles with minimal body size relative to their range
Outside Bars - Detects engulfing patterns where the current bar completely contains the previous bar's range
Pin Bars - Recognizes candles with long wicks and small bodies at potential swing points
212 Pattern - Marks three-bar reversal formations with specific high/low relationships
222 Pattern - Identifies more complex three-bar reversal structures
Key Features:
Individual Pattern Controls - Enable/disable each pattern type independently
Volume Filtering - Optional volume increase requirement for each pattern (can be toggled on/off per pattern type)
Lookback Period - Adjustable lookback bars for each pattern to confirm swing highs/lows (default: 30 bars)
Visual Customization - Choose how patterns are highlighted:
Body only coloring
Body + wick coloring
Body + border coloring
Full candle coloring (body, wick, and border)
Signal Shapes - Optional arrows, triangles, diamonds, or dots to mark pattern occurrences
Custom Candle Colors - Apply custom colors to non-pattern candles for better visual organization
Pattern Priority System - When multiple patterns occur simultaneously, the indicator displays only the highest priority pattern (222 > 212 > Pin > Outside > Doji)
Configuration:
Each pattern type includes its own settings group where you can adjust colors, enable/disable volume requirements, and set lookback periods. The indicator allows for precise tuning to match your analysis preferences without cluttering the chart.
All patterns are evaluated using price structure and optionally volume, providing visual cues where multiple technical factors align. The indicator serves as a pattern recognition tool to assist in identifying areas of interest for further analysis.

Uptrick: Dynamic Z-Score DivergenceIntroduction
Uptrick: Dynamic Z-Score Divergence is an oscillator that combines multiple momentum sources within a Z-Score framework, allowing for the detection of statistically significant mean-reversion setups, directional shifts, and divergence signals. It integrates a multi-source normalized oscillator, a slope-based signal engine, structured divergence logic, a slope-adaptive EMA with dynamic bands, and a modular bar coloring system. This script is designed to help traders identify statistically stretched conditions, evolving trend dynamics, and classical divergence behavior using a unified statistical approach.
Overview
At its core, this script calculates the Z-Score of three momentum sources—RSI, Stochastic RSI, and MACD—using a user-defined lookback period. These are averaged and smoothed to form the main oscillator line. This normalized oscillator reflects how far short-term momentum deviates from its mean, highlighting statistically extreme areas.
Signals are triggered when the oscillator reverses slope within defined inner zones, indicating a shift in direction while the signal remains in a statistically stretched state. These mean-reversion flips (referred to as TP signals) help identify turning points when price momentum begins to revert from extended zones.
In addition, the script includes a divergence detection engine that compares oscillator pivot points with price pivot points. It confirms regular bullish and bearish divergence by validating spacing between pivots and visualizes both the oscillator-side and chart-side divergences clearly.
A dynamic trend overlay system is included using a Slope Adaptive EMA (SA-EMA). This trend line becomes more responsive when Z-Score deviation increases, allowing the trend line to adapt to market conditions. It is paired with ATR-based bands that are slope-sensitive and selectively visible—offering context for dynamic support and resistance.
The script includes configurable bar coloring logic, allowing users to color candles based on oscillator slope, last confirmed divergence, or the most recent signal of any type. A full alert system is also built-in for key signals.
Originality
The script is based on the well-known concept of Z-Score valuation, which is a standard statistical method for identifying how far a signal deviates from its mean. This foundation—normalizing momentum values such as RSI or MACD to measure relative strength or weakness—is not unique to this script and is widely used in quantitative analysis.
What makes this implementation original is how it expands the Z-Score foundation into a fully featured, signal-producing system. First, it introduces a multi-source composite oscillator by combining three momentum inputs—RSI, Stochastic RSI, and MACD—into a unified Z-Score stream. Second, it builds on that stream with a directional slope logic that identifies turning points inside statistical zones.
The most distinctive additions are the layered features placed on top of this normalized oscillator:
A structured divergence detection engine that compares oscillator pivots with price pivots to validate regular bullish and bearish divergence using precise spacing and timing filters.
A fully integrated slope-adaptive EMA overlay, where the smoothing dynamically adjusts based on real-time Z-Score movement of RSI, allowing the trend line to become more reactive during high-momentum environments and slower during consolidation.
ATR-based dynamic bands that adapt to slope direction and offer real-time visual zones for support and resistance within trend structures.
These features are not typically found in standard Z-Score indicators and collectively provide a unique approach that bridges statistical normalization, structure detection, and adaptive trend modeling within one script.
Features
Z-Score-based oscillator combining RSI, StochRSI, and MACD
Configurable smoothing for stable composite signal output
Buy/Sell TP signals based on slope flips in defined zones
Background highlighting for extreme outer bands
Inner and outer zones with fill logic for statistical context
Pivot-based divergence detection (regular bullish/bearish)
Divergence markers on oscillator and price chart
Slope-Adaptive EMA (SA-EMA) with real-time adaptivity based on RSI Z-Score
ATR-based upper and lower bands around the SA-EMA, visibility tied to slope direction
Configurable bar coloring (oscillator slope, divergence, or most recent signal)
Alerts for TP signals and confirmed divergences
Optional fixed Y-axis scaling for consistent oscillator view
The full setup mode can be seen below:
Input Parameters
General Settings
Full Setup: Enables rendering of the full visual system (lines, bands, signals)
Z-Score Lookback: Lookback period for normalization (mean and standard deviation)
Main Line Smoothing: EMA length applied to the averaged Z-Score
Slope Detection Index: Used to calculate directional flips for signal logic
Enable Background Highlighting: Enables visual region coloring in
overbought/oversold areas
Force Visible Y-Axis Scale: Forces max/min bounds for a consistent oscillator range
Divergence Settings
Enable Divergence Detection: Toggles divergence logic
Pivot Lookback Left / Right: Defines the structure of oscillator pivot points
Minimum / Maximum Bars Between Pivots: Controls the allowed spacing range for divergence validation
Bar Coloring Settings
Bar Coloring Mode:
➜ Line Color: Colors bars based on oscillator slope
➜ Latest Confirmed Signal: Colors bars based on the most recent confirmed divergence
➜ Any Latest Signal: Colors based on the most recent signal (TP or divergence)
SA-EMA Settings
RSI Length: RSI period used to determine adaptivity
Z-Score Length: Lookback for normalizing RSI in adaptive logic
Base EMA Length: Base length for smoothing before adaptivity
Adaptivity Intensity: Scales the smoothing responsiveness based on RSI deviation
Slope Index: Determines slope direction for coloring and band logic
Band ATR Length / Band Multiplier: Controls the width and responsiveness of the trend-following bands
Alerts
The script includes the following alert conditions:
Buy Signal (TP reversal detected in oversold zone)
Sell Signal (TP reversal detected in overbought zone)
Confirmed Bullish Divergence (oscillator HL, price LL)
Confirmed Bearish Divergence (oscillator LH, price HH)
These alerts allow integration into automation systems or signal monitoring setups.
Summary
Uptrick: Dynamic Z-Score Divergence is a statistically grounded trading indicator that merges normalized multi-momentum analysis with real-time slope logic, divergence detection, and adaptive trend overlays. It helps traders identify mean-reversion conditions, divergence structures, and evolving trend zones using a modular system of statistical and structural tools. Its alert system, layered visuals, and flexible input design make it suitable for discretionary traders seeking to combine quantitative momentum logic with structural pattern recognition.
Disclaimer
This script is for educational and informational purposes only. No indicator can guarantee future performance, and trading involves risk. Always use risk management and test strategies in a simulated environment before deploying with live capital.

Trend or Reversal (NQ optimized)This indicator is a session-aware trade map for NQ futures that combines VWAP, an adaptive Opening Range Box (ORB), prior-day/weekly value areas, and CVD-based divergences into a single confluence engine. It scores trend and reversal setups separately on every bar, then selects one best signal per bar (long or short) so you’re never flooded with conflicting entries.
Key features
Adaptive ORB box (RTH only): First 5–15 minutes after 9:30 ET (length auto-adjusts with ADX). The box defines the opening auction; once it closes, those highs/lows are locked as ORB breakout levels for the rest of the session.
Dynamic bias: Bias flips between bullish, bearish, or neutral based on ORB breaks and how price + EMA9 behave around VWAP.
Value-area context: Uses yesterday’s and last week’s VAH/VAL (70% range model) to define “safer” long/short zones (above VAL for longs, below VAH for shorts).
Session CVD & divergence: Builds a running intraday Cumulative Volume Delta and flags bullish/bearish divergences at extremes.
Confluence scoring: Four internal scores—Trend Long, Trend Short, Reversal Long, Reversal Short—each built from multiple factors (bias, VWAP, ORB, value areas, divergence). The side with the stronger score that passes its threshold prints:
T-LONG / T-SHORT for trend continuation
R-L / R-S for mean-reversion (fade) setups
How to use
Treat T-signals as your primary entries in strong directional moves, aligned with VWAP and ORB/value-area structure.
Treat R-signals as tactical fade opportunities into extremes, preferably at prior VAH/VAL or ORB edges and supported by CVD divergence.
The indicator is not a standalone system—combine it with your own execution rules, risk management, and higher-timeframe context. Not Financial Advice

Volume Climax Reversal (VCR) — Catch Exhaustion Tops & BottomsNew! VCR spots exhaustion spikes at highs/lows using volume extremes + price action + VWAP context.
If you trade parabolic runners, indices, or mean-reversion edges, VCR helps you time the backside (shorts) and fade capitulation (longs) with clean, rule-based signals.
What it does
Detects volume climax: current volume > SMA(len) × multiplier and a new volume high in the lookback.
Confirms price context: makes a higher high (for tops) or lower low (for bottoms).
Filters with VWAP (optional): bearish signals only below VWAP, bullish signals only above VWAP.
Optional wick filter: requires an exhaustion wick > body to reduce chop.
Why traders like it
Clear entries: “VCR↓” (bearish) at exhaustion tops, “VCR↑” (bullish) at washout lows.
Fewer false signals: VWAP gating + wick filter focus on true climaxes.
Built-in alerts: set once, get notified on your phone/desktop when a setup appears.
How I trade it (simple playbook)
Bearish reversal (short / puts)
Wait for VCR↓ (exhaustion at/near HH).
Look for a lower high that fails to reclaim the signal candle high.
Enter on the break of that lower-high candle low.
Stop above the signal wick high.
Covers/targets: VWAP first; then 20–30% fade from the local top / prior demand.
Bullish reversal (long / calls)
Wait for VCR↑ (capitulation at/near LL).
Look for a higher low that holds above the signal candle low.
Enter on the break of the HL candle high.
Stop below the signal wick low.
Targets: VWAP first; then prior supply/MA bands.
Tip for small-cap/“Dux” style: VCR pairs perfectly with a gap + high USD-rotation scan. Let them blow off, then use VCR for the timing.
Inputs (tune to your market)
Volume SMA Length (default 20)
Volume Spike Multiplier (default 2.0)
Lookback High / Low (default 10 / 10)
Require VWAP confirmation? (on)
Use wick filter? (on)
Works on stocks, indices, futures, crypto.
Timeframes: 1–15m for day trading; 1h–4h–D for swing.
Alerts
Set one (or both) alerts and forget it:
Bearish Volume Climax — VCR↓
Bullish Volume Climax — VCR↑
You’ll get instant notifications when a qualified top/bottom prints.
Best practices
Don’t countertrend the first front-side ramp—wait for the VCR and a lower-high/higher-low.
Respect VWAP: it’s your first profit-taking and a bias filter.
Size small into volatility; widen stops in fast markets.
Combine with your watchlist filters (gap %, float/O/S, USD rotation, session timing).
What’s included
Clean visual signals (triangles + subtle background shading)
Session-anchored VWAP
Alert conditions that appear in TradingView’s alert menu
Sensible defaults + clear docs (this post)
FAQ
Q: Does it repaint?
No. VCR uses completed-bar data; signals print end-of-bar.
Q: Which markets?
Anything with volume: US equities, futures, crypto, indices.
Q: Can I use it for scalps?
Yes—1–5m with wick filter on and VWAP required works well.
Get more / upgrades
I’m iterating fast (MTF filter, heatmap panel, combined “one-alert” mode).
Want the pro template with dashboard & combined alerts? Message me on TV or DM / email you@domain.com
.
Risk Notice
This is educational research, not financial advice. Markets carry risk—always manage position size and use stops.
If this helped you, smash the 👍 and ⭐ — it really helps!
#volume #vwap #reversal #exhaustion #trendreversal #smallcaps #scalping #daytrading #swingtrading #stocks #futures #crypto #indicator

Session Breakout, Retest, Reversal + Large Move Alert## **Session Breakout, Retest, Reversal + Large Move Alert**
### Overview
A powerful multi-functional indicator designed for day traders and futures traders to identify session-based breakout opportunities, retest confirmations, and significant price movements across all futures contracts (Gold, E-mini S&P 500, Nasdaq, Crude Oil, and more).
### Key Features
**📊 Pre-Market Session Tracking**
- Automatically calculates pre-market/overnight session highs and lows
- Displays session ranges with customizable colors and styling
- Extends lines through the entire trading session for easy reference
- Supports overnight sessions (e.g., 4 PM – 7:30 AM for Gold futures)
**🚀 Breakout Detection**
- Identifies breakouts above/below pre-market highs and lows
- Uses close-price confirmation to filter false signals from wicks
- Displays "BO ↑" and "BO ↓" labels at breakout points
- Generates instant alerts when breakouts occur
**♻️ Retest Failed Tracking**
- Monitors price retests after breakouts
- Detects when retests fail to reach previous support/resistance
- Labels "RF" (Retest Failed) for high-probability trade setups
- Helps identify reversal opportunities
**📈 First 5-Minute Analysis**
- Captures first 5 minutes of market open (customizable timeframe)
- Tracks first 5-minute highs and lows separately
- Essential for mean-reversion and breakout confirmation strategies
- Blue lines extend through the trading session for easy tracking
**⚡ Large Move Alerts**
- Detects significant price movements based on point thresholds
- Individual thresholds for 5+ different symbols:
- GC (Gold): 15 points
- ES (E-mini S&P 500): 15 points
- NQ (E-mini Nasdaq): 50 points
- CL (Crude Oil): 1.5 points
- Custom: Fully adjustable
- Auto-detects symbol from chart ticker
- Labels show exact point movement and candle direction
### Customization Options
**Symbol Configuration**
- **Auto-Mode**: Automatically detects trading symbol from chart ticker
- **Manual-Mode**: Select specific symbol (GC, ES, NQ, CL, or Custom)
**Session Settings**
- Fully customizable pre-market session time (24-hour format)
- Adjustable market open time for first 5-minute window
- Market close hour and minute configuration
- Support for any timezone
**Point Move Thresholds by Symbol**
- Set independent thresholds for each of your trading symbols
- Quickly adjust settings when switching between different futures
- Includes helpful tooltips for recommended values
**Display & Styling**
- Toggle all visual elements on/off individually
- Customizable colors for all lines and labels:
- Pre-market high/low colors
- Breakout labels (up/down)
- Retest failed labels
- First 5-minute session lines
- Large move indicators
- Text size options: tiny, small, normal, large, huge
### How It Works
1. **Session Tracking**: The indicator identifies your pre-market session and marks the high and low with labeled lines (PH/PL)
2. **Breakout Signal**: Once the market opens, it monitors for close prices above/below the pre-market levels and alerts you with "BO ↑" or "BO ↓"
3. **Retest Confirmation**: After a breakout, it tracks retests and labels "RF" when the retest fails to reach the opposite extreme, confirming trade direction
4. **Large Move Detection**: Simultaneously monitors for significant point moves that exceed your symbol-specific thresholds
5. **Alert Triggers**: Get real-time alerts for:
- Breakout Up/Down
- Any Breakout
- Large Move events
### Alert Conditions
The indicator includes four alert conditions:
- **Breakout Up Alert**: Price closes above pre-market high
- **Breakout Down Alert**: Price closes below pre-market low
- **Any Breakout Alert**: Either breakout condition triggers
- **Large Move Alert**: Point movement exceeds threshold for current symbol
### Ideal For
- ✅ Day traders (breakout/retest strategies)
- ✅ Futures traders (Gold, Oil, Stock Index Contracts)
- ✅ Intraday scalpers (first 5-minute analysis)
- ✅ Swing traders (session-based levels)
- ✅ Multi-symbol traders (independent thresholds per symbol)
### Disclaimer
This indicator is designed for educational and informational purposes. Past performance does not guarantee future results. Always use proper risk management and position sizing. Test thoroughly on historical data before trading live.

26 EMA Reversal LogicThis indicator identifies two distinct price behaviours on the daily charts of SPY, SPX, QQQ, or IXIC, using the 26-period EMA as a reference. It plots one signal per downtrend — either a yellow circle (bearish continuation) or a green circle (bullish reversal) — and locks further signals until price closes above the 26 EMA.
The yellow circles are when we close below the 26-day EMA and the next day we make a lower low.
The green circles are when we close below the 26-day EMA and the next day we actually open higher and that low is never revisited.
Symbol Restriction
Only works on: SPY, SPX, QQQ, IXIC
On any other symbol, the script will display an error and stop.
Timeframe Restriction
DAILY chart only — will show an error on any other timeframe.
Core Logic: Two-Candle Pattern Detection
Both signals start with the same Day 1 condition:
Day 1: The candle closes below the 26 EMA
From there, Day 2 determines the signal:
Yellow Circle (Bearish Continuation)
Plotted BELOW the Day 2 candle
Conditions:
Day 1 closed below the 26 EMA
Day 2 makes a lower low than Day 1’s low → low < low Interpretation:
Price is weakening — pushing to new lows below the EMA.
Confirms downward momentum.
Green Circle (Bullish Reversal / Failed Breakdown)
Plotted ABOVE the Day 2 candle
Conditions:
Day 1 closed below the 26 EMA
Day 2 opens higher than Day 1’s close → open > close
Day 2’s low never revisits Day 1’s low → low >= low Interpretation:
Buyers defend the prior low with a higher open — classic false breakdown.
Suggests a potential reversal higher.
One Signal Per Downtrend (Lock & Reset)
After either a yellow or green circle is plotted, no more circles appear
Prevents clutter — focuses on first meaningful reaction
Reset Rule:
Lock is released only when price closes above the 26 EMA
Best Used On
Daily timeframe
SPY, SPX, QQQ, IXIC only
With trend, volume, or broader market context

Ultimate Scalping IndicatorOverview
The Confluence Signal Indicator is a precision-built scalping tool designed to identify high-probability reversal points in the market.
It combines three core technical elements:
Trend
Mean reversion
Momentum
into a single, efficient system.
By filtering out weak RSI signals and focusing only on setups that align with trend direction and recent momentum shifts, this indicator delivers cleaner and more accurate short-term trade signals.
Core Components
200-Period Moving Average (MA200, 5-Minute Timeframe)
The MA200 is always calculated from the 5-minute chart, regardless of your current timeframe. It defines the macro trend direction and ensures that all trades align with the prevailing momentum.
Session VWAP (Volume-Weighted Average Price)
The VWAP tracks the real-time average price weighted by volume for the current trading session. It acts as a dynamic mean-reversion level and helps identify key areas of institutional activity and short-term balance.
RSI (Relative Strength Index)
The indicator uses a standard 14-period RSI to detect overbought and oversold market conditions.
A “recency filter” is added to ensure signals only appear when RSI has recently transitioned from strength to weakness or vice versa, reducing false signals in trending markets.
Signal Logic
Bullish Signal (Green Arrow)
A bullish reversal signal is plotted below a candle when:
Price is above both the 5-minute MA200 and the Session VWAP.
RSI is oversold (below 30).
The last time RSI was above 50 occurred within the last 10 candles before going oversold.
This ensures that the dip is a fresh pullback within an uptrend, not a prolonged oversold condition.
Bearish Signal (Red Arrow)
A bearish reversal signal is plotted above a candle when:
Price is below both the 5-minute MA200 and the Session VWAP.
RSI is overbought (above 70).
The last time RSI was below 50 occurred within the last 10 candles before going overbought.
This ensures that the overbought reading follows a recent move from weakness, identifying potential short entries in a downtrend.
Recommended Usage
This is a scalping-focused indicator, intended for use on timeframes of 5 minutes or lower. Therefore I would highly recommend to use it on Equity futures trading, such as NQ!, ES!, GC! and so on.
It performs best when combined with additional tools such as support and resistance zones, order blocks, or liquidity levels for context.
Avoid counter-trend signals unless confirmed by price structure or volume behavior.

LucciThis indicator identifies trade setups based on session liquidity levels and price structure analysis during New York trading sessions.
Unlike basic support/resistance indicators, this system tracks untested session extremes and monitors their interaction with price. It combines break-and-retest mechanics with bounce detection at key liquidity zones, providing multiple entry methodologies within a single framework.
METHODOLOGY:
The system maps high/low points from each trading session (Asia: 6PM-3AM, London: 3AM-8AM, NY: 8AM-5PM EST) and monitors price behavior around these levels. It identifies two primary setup types: momentum continuation after level breaks and reversal bounces at untested extremes. Visual differentiation shows which levels remain untested (darker) versus swept levels (lighter).
SETUP IDENTIFICATION:
Break & Retest Signals:
- Detects breaks of NY Open range (15-minute candle at 8:00 AM EST)
- Waits minimum bars after break before validating retest
- Triggers when price returns to level within tolerance zone
Bounce Signals:
- Identifies approaches to untested session highs/lows
- Optional wick confirmation for reversal validation
- Signals when price rejects from liquidity zone
CONFIGURATION OPTIONS:
Entry Parameters:
- Min Bars After Break: 1-10 (delay before retest valid)
- Retest Tolerance: 0.1-10 points (precision of level test)
- Bounce Zone: 0.5-5 points (distance from level)
- Wick Confirmation: On/off reversal filter
Risk Management:
- Risk Reward Options: 1:3, 1:5, or Custom (1:1 to 1:10)
- Stop Loss: Configurable in points
- Max Daily Signals: 1-5 trade limiter
- Trading Hours: Customizable active window
Visual Elements:
- Session Levels: Orange (Asian), Yellow (London), Blue (NY)
- Signal Markers: Triangles (B&R), Diamonds (Bounce)
- TP/SL Lines: Automatic calculation and display
- Info Table: Shows bias, untested levels, daily signals
OPTIMAL USAGE:
Trading Windows:
- 9:30-11:00 AM EST: Primary trading window
- First touch of untested levels: Highest probability
- 15-minute timeframe: Recommended for futures
- Volume filter: Optional quality enhancement
Signal Prioritization:
- Untested levels provide stronger reactions
- Multiple confirmations increase probability
- Respect market structure and session context
- Combine with volume for filtering
TECHNICAL SPECIFICATIONS:
- Multi-timeframe: Uses 15-minute data for NY Open
- Session-based: Resets levels at session transitions
- Alert system: Detailed messages with levels
- Position tracking: Manages active trades visually
IMPORTANT NOTES:
This tool maps liquidity zones based on session extremes and price structure. No trading system guarantees profits. Combine with market context and proper risk management. Designed for active intraday trading on liquid instruments.
The indicator provides objective level identification while requiring trader discretion for optimal results.

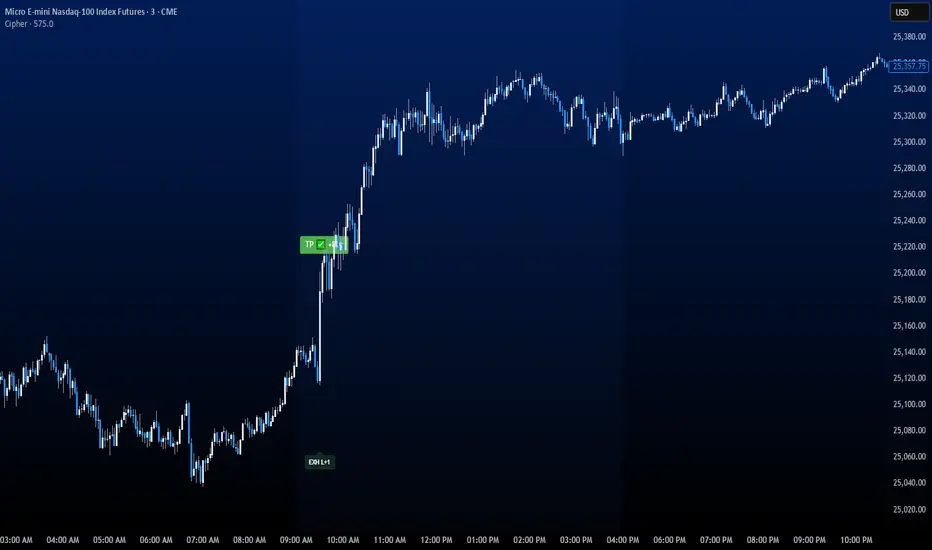
CipherThis indicator identifies potential reversal points through volume exhaustion analysis combined with multi-factor confirmation, volume distribution patterns at price extremes, market state classification based on volatility characteristics, and time-weighted probability calculations. Each component reduces false signals that single-factor indicators typically produce.
METHODOLOGY:
The system continuously monitors market conditions across multiple dimensions. When volume patterns indicate potential exhaustion at significant price levels, it checks for alignment with favorable market conditions and statistical probabilities. Signals only generate when multiple factors confirm, with entry triggered on momentum continuation beyond the exhaustion point.
COMPLETE USAGE GUIDE:
Signal Identification:
- "EXH L+2" = Long exhaustion with 2 confirmations
- "EXH S+3" = Short exhaustion with 3 confirmations
- Higher confirmation numbers indicate stronger setups
Entry Execution:
- Dashed lines mark entry trigger levels
- Entry activates when price breaks trigger within specified bar window
- Buffer setting controls distance from exhaustion bar (ticks)
Position Management:
- Automatic stop loss and target levels display on entry
- Green lines = profit targets
- Red lines = stop loss levels
- Info panel shows real-time position status
CONFIGURABLE PARAMETERS:
Timing Controls:
- Entry Buffer: 0-5 ticks (momentum confirmation distance)
- Max Bars to Wait: 3-10 bars (entry window duration)
- Session Times: Separate London/New York parameters
Sensitivity Settings:
- Volume Multiplier: 1.5-3.0 (vs 20-bar average)
- Lambda Values: Setup frequency expectations per session
- Stop Distances: Session-specific risk parameters
Risk Controls:
- Daily Win Limit: Stops after profitable day
- Daily Loss Limit: Prevents excessive drawdown
- Maximum Daily Trades: Controls overtrading
PERFORMANCE OPTIMIZATION:
Best Trading Windows:
- 10:00 AM EST: Primary reversal window
- 9:30-9:45 AM EST: Opening range exhaustion
- 3:00-4:00 AM EST: European session setups
- 2:30 PM EST: Afternoon reversal potential
Session Characteristics:
- London (2-9 AM EST): Lower frequency, cleaner setups
- New York (9 AM-4 PM EST): Higher frequency, requires filtering
- Background colors indicate active sessions
RISK PARAMETERS:
- Default Stops: 30-40 ticks (session-dependent)
- Risk:Reward Ratios: 1:1.5 to 1:3 (configurable)
- Trade Frequency: 2-4 quality setups weekly
VISUAL REFERENCE:
- Orange Background: London session active
- Blue Background: New York session active
- Yellow Markers: Exhaustion points identified
- Dashed Lines: Pending entry levels
- Solid Lines: Active trade levels
- Info Table: Statistics and system status
IMPORTANT CONSIDERATIONS:
This tool identifies potential setups based on rule-based analysis. Traders should understand that no system guarantees profits and should use appropriate risk management. The indicator works best on 3-minute and 5-minute timeframes in liquid markets. Combine with market context and price action understanding for optimal results.
TECHNICAL REQUIREMENTS:
- Best suited for index and commodites
- Optimized for 3M and 5M
- Requires volume data for proper function
- Best results with consistent market participation
Percentile Rank Oscillator (Price + VWMA)A statistical oscillator designed to identify potential market turning points using percentile-based price analytics and volume-weighted confirmation.
What is PRO?
Percentile Rank Oscillator measures how extreme current price behavior is relative to its own recent history. It calculates a rolling percentile rank of price midpoints and VWMA deviation (volume-weighted price drift). When price reaches historically rare levels – high or low percentiles – it may signal exhaustion and potential reversal conditions.
How it works
Takes midpoint of each candle ((H+L)/2)
Ranks the current value vs previous N bars using rolling percentile rank
Maps percentile to a normalized oscillator scale (-1..+1 or 0–100)
Optionally evaluates VWMA deviation percentile for volume-confirmed signals
Highlights extreme conditions and confluence zones
Why percentile rank?
Median-based percentiles ignore outliers and read the market statistically – not by fixed thresholds. Instead of guessing “overbought/oversold” values, the indicator adapts to current volatility and structure.
Key features
Rolling percentile rank of price action
Optional VWMA-based percentile confirmation
Adaptive, noise-robust structure
User-selectable thresholds (default 95/5)
Confluence highlighting for price + VWMA extremes
Optional smoothing (RMA)
Visual extreme zone fills for rapid signal recognition
How to use
High percentile values –> statistically extreme upward deviation (potential top)
Low percentile values –> statistically extreme downward deviation (potential bottom)
Price + VWMA confluence strengthens reversal context
Best used as part of a broader trading framework (market structure, order flow, etc.)
Tip: Look for percentile spikes at key HTF levels, after extended moves, or where liquidity sweeps occur. Strong moves into rare percentile territory may precede mean reversion.
Suggested settings
Default length: 100 bars
Thresholds: 95 / 5
Smoothing: 1–3 (optional)
Important note
This tool does not predict direction or guarantee outcomes. It provides statistical context for price extremes to help traders frame probability and timing. Always combine with sound risk management and other tools.
