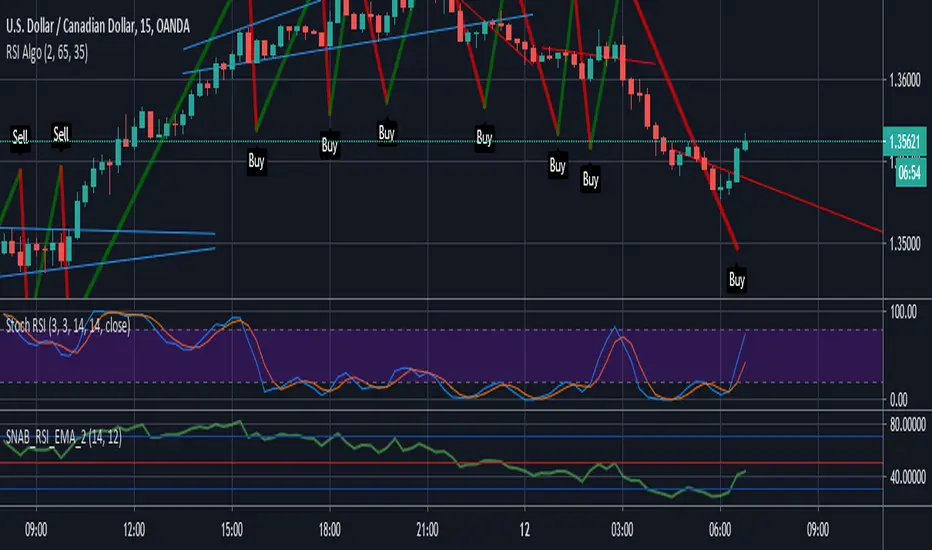
RSI + MACD + EMA Buy/Sell ComboRSI + MACD + EMA Buy/Sell Combo with signals if all 2 lines up it will create buy and cell signals
在脚本中搜索"rsi"
RSI-CCI Momentum ScreenerRSI-CCI Momentum Screener;
How to Use:
Apply this script to 1H or 4H timeframe
Works well for NSE stocks, crypto, or forex
Look for a green label “BUY” that shows when the screener conditions are met

RSI HeatmapRSI Heatmap right on your chart. Cold and Hot areas means oversold and overbought cycles respectly.


RSI MTF TableRSI MTF covers the timeframes 1m, 5m, 15m, 1H, 4H and Daily
Works on any intraday chart and appears in bottom left of screen
Can customise colors and transparency

rsi and macdRSI and MACD in the chart:
- small circles -> oversold/overbought
- big circles -> oversold/overbought rising/falling
- small diamonds -> macd over/under signal with macd over/under zero
Please comment if you have an idea to improve it ;)

RSI BAR COLOR (KETT)RSI BAR COLOR
1) White - looking for a long
2) Orange - looking for a short
3) Gray - think
//-----------
1) Белый - ищем вход в LONG
2) Оранжевый - ищем вход в SHORT
3) Серый - думаем
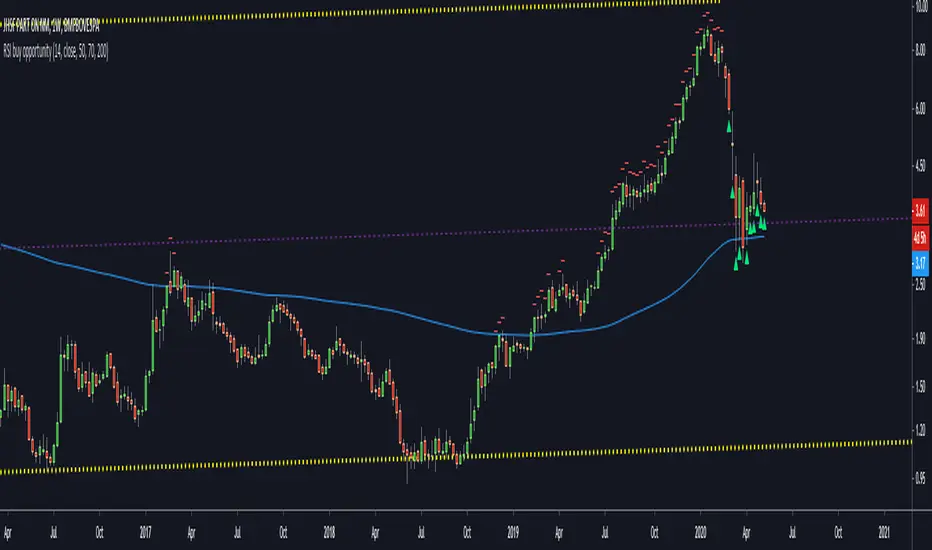
RSI buy opportunityRSI buy opportunity is an indicator to look for the best entries on weekly charts.
It depends on each stock and the values should change to optimize the entry.
Buy when green triangle shows up.
Never buy when red signal appears.