SMT for Time-Based Sessions [ufo]SMT for Time-Based Sessions identifies when one asset breaks a session’s high/low while another correlated asset fails to do so. This imbalance often signals engineered liquidity grabs, reversals, or continuation setups. By focusing on divergences within specific trading sessions (London, New York AM, Lunch, New York PM, Asia, Daily or your own custom windows), the tool filters out noise and pinpoints only the most meaningful SMT divergences across multiple symbols in real-time.
Core Concept:
SMT (Smart Money Technique/Tool/Time) is a concept popularized by Inner Circle Trader (ICT) that suggests that when correlated or inversely correlated instruments fail to confirm each other's price movements (e.g., one breaks a high/low while the other doesn’t), it often indicates:
Liquidity manipulation by institutional players
Potential reversal points in the market
Weakness or strength in the current trend
Stop hunt operations before significant moves
This indicator identifies these divergences by comparing your chart symbol against up to two comparison symbols across different sessions and timeframes.
How Time-Based SMT Works:
Unlike basic divergence tools, this indicator is built specifically for Session-Based and Timeframe-Based SMT tracking. It continuously monitors intraday sessions and higher timeframes, then plots divergences the moment they occur.
Time-Based Session SMT
Session Tracking: Monitors highs and lows during each session
Post-Session Analysis: After a session ends, tracks whether price breaks session levels
Divergence Detection: When the main symbol breaks a high/low but comparison symbols don’t (or vice versa), an SMT signal is triggered
(e.g. Nasdaq traded above London high while S&P500 does not)
Visual Confirmation: Lines connect the session reference to the current extreme, with labels showing the diverging session, high/low, and symbol, this information is also displayed in the Info Panel
This will update if a new high/low extreme is made while the SMT is still valid, if invalidated these will be removed from the chart
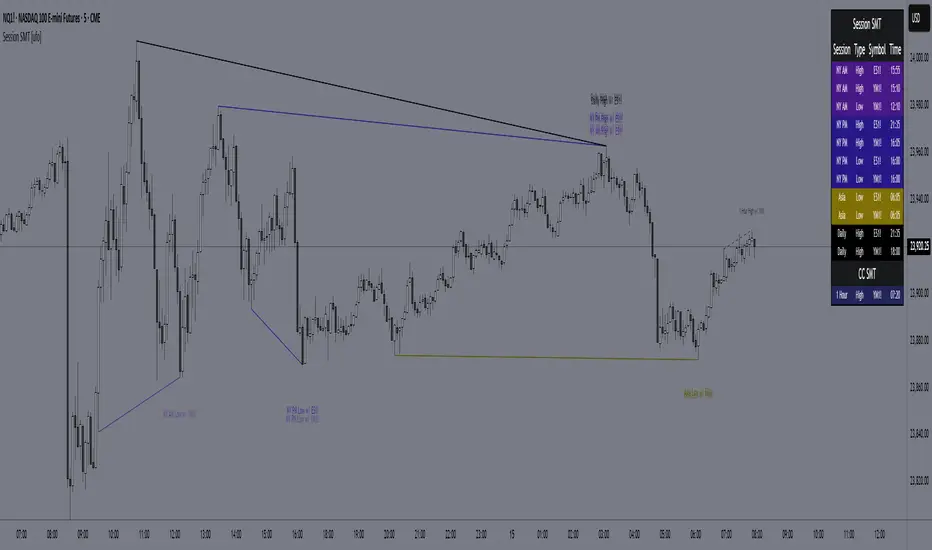
Example:
This NQ chart includes ES and YM as comparison symbols. At 03:20 AM New York time, both ES and YM broke the Asia session low (20:00 – 00:00), while NQ did not. This creates a bullish session divergence , which the indicator immediately detects and plots.
Although the chart shows three symbols for illustration, you don’t need to manually monitor comparison charts when using this indicator, the SMT divergence will be plotted automatically as soon as it occurs
Consecutive Candle SMT (CC SMT)
Previous Candle Reference: Uses the previous candle's high/low from the selected timeframe
Real-Time Comparison: Monitors if current price breaks these levels across all symbols
Instant Detection: Triggers SMT immediately when divergence occurs
Dynamic Updates: Lines and labels update in real-time as new extremes form and are automatically removed if invalidated
Example:
Here I configured CC SMT Timeframe 1 to monitor the previous 4-hour candle’s high/low. On this NQ chart with ES as a comparison symbol, ES broke above the prior 4-hour high at 14:00 New York time, while NQ did not, showing relative weakness creating a bearish CC SMT divergence
This chart is just an illustration. The indicator will automatically plot SMT divergences on your main chart, regardless of the timeframe you’re viewing
How To Use:
This indicator is not a buy/sell signal on its own. Instead, it is designed to highlight Time-Based SMT divergences so you can combine them with your existing trading strategy or model. It should be used as an extra layer of confluence, helping you confirm trade ideas.
Select your comparison symbols
For example:
Futures: NQ vs ES/YM
Forex: EURUSD vs GBPUSD/DXY(inversely)
Crypto: BTC vs ETH
Commodities: Gold vs Silver
Choose which sessions or candle timeframes you want the indicator to monitor
Watch for divergences the indicator plots when one symbol breaks a high/low while the other does not
Use these divergences as confluence, alongside your own strategy and risk management rules
Key Features:
Multiple Comparison Symbols
Symbol 1 & Symbol 2: Compare your main chart against up to 2 correlated instruments
Symbol Inversion: Perfect for inversely correlated pairs (e.g., EURUSD vs DXY)
Session-Based SMT Tracking
Monitors 7 fully customizable trading sessions with the default being:
London Session (2:00-5:00 NY time)
NY AM Session (9:30-12:00 NY time)
Lunch Session (12:00-13:00 NY time)
NY PM Session (13:00-16:00 NY time)
Asia Session (20:00-00:00 NY time)
Custom Session 6 (if you want to add an extra session)
Daily Session (18:00-18:00 NY time)
Fully customizable session times and names
Automatically detects when the main symbol breaks a session high/low while comparison symbols don't (and vice versa)
Consecutive Candle SMT (CC SMT)
Monitors 3 customizable timeframes
Tracking of divergences based on specific timeframe candles (15min, 60min, 4 hour, weekly, etc.)
Identifies when the current price breaks the previous candle's high/low differently than comparison symbols
Maintains history of past SMTs (configurable)
Timeframe 3 supports custom time shifts for non-standard candle boundaries
Example: 90min timeframe with a +60 shift changes the candle range from:
00:00-01:30, 01:30-03:00 etc
to:
01:00-02:30, 02:30-04:00 etc
Visual Customization
Line Styles: Customize the line styles for different symbols
Colors: Unique color schemes for instant session identification
Adjustable Offsets: Fine-tune label positions with multiplier settings
Show/Hide Controls: Complete control over visual elements
Custom Labels: Customize the SMT labels for highs and lows
Information Panel
Active SMT Conditions: Live tracking of all current divergences
Session Names: Clear identification of which session created the SMT
Symbol Information: Shows which comparison symbol is diverging
Timestamps: Optional time display showing when SMT was first detected
Flexible Positioning: 8 different panel positions
Smart Display Modes: Options to hide inactive sessions/timeframes
Alert System
Configurable alerts for specific sessions or timeframes
Get notified when new divergences appear instantly
Clear, informative alert descriptions
How To Setup Alerts:
Enable the "Enable Alerts" in the settings
Choose which sessions/timeframes to receive alerts for by choosing it in the setting below
(If you select "All Sessions" you will only be alerted for all the sessions you have enabled in the indicator settings)
Create an alert (ALT+A shortcut) or click the the 3 dots on the indicator "Add alert on Session SMT "
- Condition = Session SMT
- Function = Any alert() function call
- Alert name (Message) = Anything you prefer (e.g. SMT Alert)
If you want to create another alert for different settings, first input the new settings in the indicator, then create a new alert.
Note: Previous alerts will continue to notify you based on the settings they were originally set for, even if you change the indicator setting.
How This Helps Your Trading:
This tool automates the heavy lifting of tracking divergences across multiple markets and sessions, continuously monitoring highs and lows in real time and plotting only the most meaningful SMT signals so you can focus on execution, not chart-watching.
在脚本中搜索"session"
Timezone Sessions by CaydenFXThis indicator is used to tell when each market is in session. This is based on the Los Angeles time frame. You can customize the colors and opacity of each session. The sessions include London, New York, Sydney, and Tokyo. I only have three sessions being displayed in the picture.
Kviateq - Session PivotsFirst of all, I must say that this script wouldn't be possible without the help of one of the best script developers on TradingView - @ahancock (thanks a bunch for your help)
This script draws opening ranges for each of the sessions - Tokyo, London and New York and plots session high, low and pivot range of the previous session.
So if you trade London session - you would only take longs if we're above the Tokyo pivot range and vice versa for shorts.
Often times previous session's highs act as resistance and lows act as support, so careful trading around those levels.
It is obviously meant for lower timeframes, since each of the sessions only lasts a few hours.
Default settings are set to the exchange that I use and my timezone (GMT +7), so you might need to adjust the settings accordingly.
Tokyo - 12am GMT
London - 7am GMT
New York - 12pm GMT

ADO Sessions Indicator - New York, London, Asia - CustomizableADO Sessions is a clean and flexible session-highlighting indicator for intraday traders.
It allows you to clearly visualize the New York , London , and Asia trading sessions directly on your chart, with full control over how each session is displayed.
This indicator is designed for traders who want clarity without clutter.
Key Features
Three Major Trading Sessions
New York
London
Asia
Three Display Modes per Session
Off – No background, only session name and vertical start/end lines
Price Only – Background highlights only the session’s price range (High–Low)
Full Session – Background covers the entire chart vertically during the session
Session Labels
Session names are displayed at the session start
Labels stay aligned with the session when scrolling the chart
Vertical Session Lines
Precise vertical lines at session start and end
Always visible, independent of the background mode
Highly Customizable
Enable or disable each session independently
Custom colors and transparency per session
Works on all intraday timeframes
Compatible with crypto, futures, and forex markets
Why ADO Sessions
Clean visuals without clutter
No repainting
Built for professional intraday and session-based trading
Use Cases
Session-based trading strategies
Liquidity and volatility analysis
Market open and close timing
Crypto, futures, and forex trading
ADO Sessions focuses on one thing only:
making trading sessions clear, accurate, and fully customizable.

RegimeWorks Context Overlay Sessions Regime Panel OutcomeMost traders ask: “Where can I enter?”
This indicator asks a better question:
“Do I even have permission to trade?”
RegimeWorks is a decision framework, not a signal generator.
It helps you filter the market before you think about entries.
RegimeWorks shows when the market has permission to trade, not when you should.
Use it to filter bad setups and focus your attention where it matters.
What This Indicator Actually Does
1) Broker-Aligned Behavior Sessions (XAUUSD)
Visualizes the real participation windows on the Fusion feed:
London Behavior: 15:00–18:00 UTC+2
NY Behavior: 21:00–00:00 UTC+2
These are liquidity behaviors, not textbook FX clocks.
The goal is simple: trade only when the market is awake.
2) High-Timeframe Permission Layer
A structured HTF filter combining:
EMA alignment & direction
ATR expansion vs baseline
Slope agreement
Stretch / over-extension guard
This becomes a single answer:
Regime VALID → continuation is allowed
Regime INVALID → stand aside
Reversal Permitted → only when trend is weak and not stretched
The panel translates conditions into plain language:
Continuation Permitted (London)
No Trade – Conditions Not Met
Reversal Permitted (NY)
It teaches process without exposing any private entry logic.
How to Use (3 Steps)
Start with the panel.
If Regime = INVALID → you’re done. No trade.
Check the session.
Closed session = no business trading.
Read the Outcome line.
It tells you what behavior is allowed — not what button to press.
Regime → Session → Setup → Execution
Best Chart Setup
XAUUSD on 1H / 4H
Keep panel visible for journaling
Use “No Trade” days as part of your edge
Who This Is For
Traders tired of overtrading
Anyone building rule-based discipline
Educators who want a clean context layer
Disclaimers
Educational tool only.
Not financial advice.
Risk management remains your responsibility.
RegimeWorks — Trade Permission First

Session Ranges Pro+Session Range Zones – Professional Edition
OVERVIEW
Professional visualization of the classic opening-range / Initial Balance concept across Asian, London, and Regular (US) sessions.
Displays the high/low of the user-defined opening window as thick, hierarchical filled zones with optional Fibonacci and standard-deviation extensions plus full alerting.
CONCEPT BACKGROUND
Using the high and low of the first 30–60 minutes of a session as key support/resistance is public-domain knowledge that has been standard in institutional trading for decades (Initial Balance, Opening Range, Session Range, etc.).
On TradingView the same principle was popularized under the name “Defining / DealingRange / DR/IDR” by TheMas7er and others.
IMPLEMENTATION & VALUE ADDED
This indicator follows the established, public-domain range-calculation methodology but has been completely rewritten with the following original enhancements:
• Clean, filled High / Mid / Low zones for instant visual hierarchy
• Intuitive Asian / London / Regular session labelling and fully custom timing
• Comprehensive dynamic & static Fibonacci and 50%/100% standard-deviation extensions
• Alert conditions on every zone, midline, opening level, and extension line
• Modern, modular code architecture using arrays and custom drawing functions
• No repainting, lightweight performance on any intraday timeframe
HOW TO USE
Apply to 1–15 min charts. Select desired sessions and formation period (30 or 60 min typical).
Shaded zones serve as primary support/resistance; extensions provide measured-move targets.
CREDIT & TRANSPARENCY
Core methodology: public domain (Initial Balance / Opening Range / Session Range).
Early TradingView popularization of the DR/IDR naming and feature set: TheMas7er **(with thanks to community contributors like bmsitiaan and trading-guide for refinements)**.
**Utilizes PineCoders' VisibleChart library for optimized chart rendering.**
This script uses the same foundational principle and logical input options but is an independent implementation. All visual presentation, zone system, multi-session handling, extension systems, alerting framework, and underlying code structure are original.
DISCLAIMER
For educational and informational purposes only. Not financial advice. Past performance is no guarantee of future results. Test thoroughly on your instruments and timeframes.

London ORB + Session High/Low + FVGLondon ORB + Session High/Low + FVG
📘 Script Description: London ORB + Session High/Low + Fair Value Gap
This script is designed to assist intraday traders during the London session open by combining:
🕒 1. Opening Range Breakout (ORB)
Captures the high and low of the first 15-minute candle after the London open (08:00–08:15 GMT).
Draws lines and labels for the ORB High and Low levels.
Detects breakouts above or below the ORB and plots a triangle signal at the breakout bar.
🌐 2. Asian & US Session Levels
Automatically marks the highs and lows of the Asian (00:00–06:00 GMT) and US (13:30–20:00 GMT) sessions.
Useful for identifying prior session liquidity zones, key support/resistance levels, and potential reaction areas.
📉 3. Fair Value Gaps (FVG)
Highlights imbalances in price action between non-overlapping candles (also known as FVGs or inefficiencies).
Draws a shaded box between candles where gaps exist:
Green for bullish FVGs
Red for bearish FVGs
🔔 4. Alert Support
Optional alerts are built in for:
Long breakout (price breaks above ORB)
Short breakout (price breaks below ORB)
🎯 Use Case
Perfect for:
Day traders looking to capitalize on early volatility at the London open
Traders using liquidity-based strategies, retests, or gap-fills
Visualizing and aligning with prior session highs/lows for structure and context

FX Sessions w/ Watermark
This my own implementation of the session ranges using Pinescript V5. This indicator allows you to define 3 different sessions, namely Asian, London, and New York.
The first setting on Top is the Timezone. By default it is set to GMT +4 which is the timezone for NY.
Next is a customizable Watermark and sub watermark to allow you to input a meaningful text. It has also an option to show or hide the currency/symbol info.
Features
Define session based on customizable timezone.
Add big watermark text and customize its size, color, and position
Add sub watermark text and customize its size, color, and position
Add option to show symbol info and adjust its size, color, and position
Option to add True New York Midnight Divider
Option to define the Asian, London, and New York opening and closing session.

VWAP 3x Session Reset- This VWAP aims to be used with futures and forex.
- The VWAP is reset at the beginning of each session.
- 3 different sessions can be specified.
- The lines are not drawn when there is no active session.
- The upper and lower bands with standard deviation 2 are also drawn.
Info: The time zone of the picture is Europe/Berlin

Hotch SessionSimple Session timer with separate session for Asia, Europe, and the Americas plus an extra custom session timer. each can be turned on and off separately.
The indicator also plots the highs and lows of each session.
This code was modified from the Session timer code found in the original "The Arty" by PheonixBinary but expanded to better include all trading sessions.
The code was written in a manner to be as compact as possible. I had looked at many other Session timers and found entire input sections that were longer than the entirety of this indicator.
Please feel free to use this code in any manner you choose permission not required.

ICT Session Killzone Boxes & DeviationsICT Killzone Sessions Boxes & Deviations is a convenience indicator that marks out past and future ICT killzones for Asia, London, and New York, London Close and CBDR.
The boxes highlights the highest and lowest candle opens of that session/killzone, which is what the deviations are based on. Two lines mark out the highest high and lowest low of that session.
This indicator also includes New York midnight opening price and a vertical divider showing you that time.
Future killzones are also marked out.
All times are set to GMT-4 so these boxes should work across most exchanges. Times and code can be changed if a few don't match up.
Included are week of day labels for your convenience.
For those who are unfamiliar, ICT Killzones are optimal times to look for trades during or before a session, often providing entry for trades with orderblock tests, FVG fills or stophunts.
Please note: This indicator only works well on 1HR timeframe and below. The default max timeframe setting is set to 15min, which can be changed in the menu.
There may be some bugs so please highlight anything you find in the comments below :)
Shout out to @Ryazn for all the ideas!
Fusion: Forex sessions with daylight savingsThis has multiple ways to see Forex sessions as I found both on the main chart and on a separate chart useful at different times so this gives you the benefit of both.
When you want to use this separate from your main chart uncheck it the option "On main chart".
On the main chart we can show:
The legend
Boxes
Labels
Breakout check area
Start & end labels
On any other chart area we can show:
The legend
Horizontal bars representing the sessions.
All objects are color coded and the legend shows the color codes.
Credit:
Blended my own sessions indicator and "FX Market Sessions" by boidoki
The code is structured to easily drop into a bigger system so use it as a lone indicator or add the code to some bigger project you are creating.
Finally, if you find value please do make a comment, give thumbs up etc.
Enjoy and good luck!

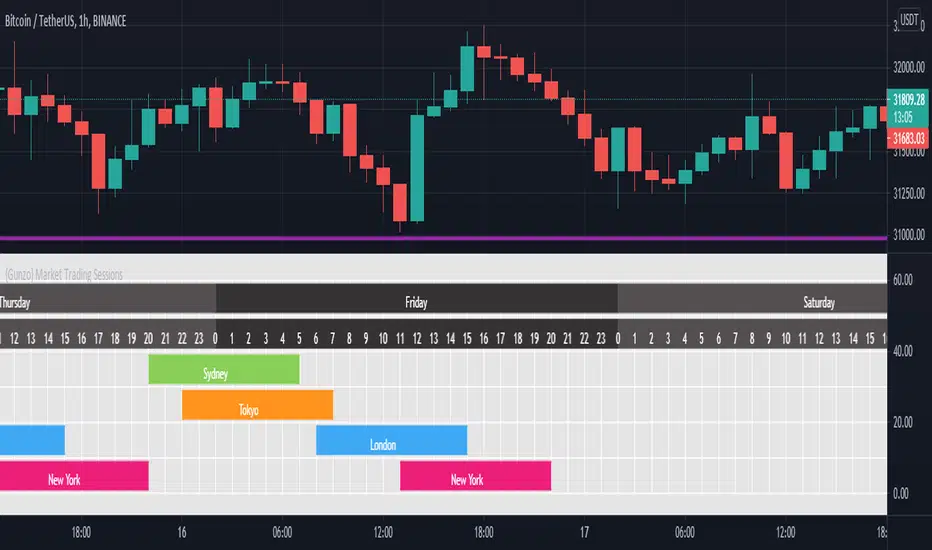
{Gunzo} Market Trading Sessions (Tokyo, London, New York)Market Trading Sessions is a tool designed to help traders to find the best times of the day for price action trading. It displays non-overlapping visuals for the major trading sessions : Oceania, Asia, Europe, and USA.
OVERVIEW :
This tool has been designed to match all the following requirements that I needed for optimal usage :
Display opening and closing of main markets
See clearly market sessions (non-overlapping colors)
Display Sydney session if wanted
Display GMT hours and days
Visually pleasing design and colors
Highly configurable
As I had trouble finding a script matching all these criteria, I created this tool and I'm sharing it with the TradingView community, hoping you will find it useful too.
SETTINGS :
Display market sessions on weekends : Display theoretical market sessions times on the weekend which can be useful for non forex markets.
Display session for Oceania\Sydney : Display "Oceania\Sydney" trading session
Display session for Asia\Tokyo : Display "Asia\Tokyo" trading session
Display session for Europe\London : Display "Europe\London" trading session
Display session for USA\New York : Display "USA\New York" trading session
Display session names : Display names of the session on the visual
Oceania color : Configurable color for the "Oceania\Sydney" sessions
Asia color : Configurable color for the "Asia\Tokyo" sessions
Europe color : Configurable color for the "Europe\London" sessions
USA color : Configurable color for the "USA\New York" sessions
Background color : Configurable color for the table background
Border color : Configurable color for the table borders
Text color : Configurable color for the table text
Header color : Configurable color for the table header (even days)
Header color (alternate) : Configurable color for the table header (odd days)
Simple Market Session by GavThis is a simple script to highlight market sessions.
It highlights Sydney, Tokyo, London, and New York sessions with transparent background colors.
You are able to change session times, color, and transparency.

Sessions with Opening/Closing, Multi timeframeSessions with Opening & Closing is a simple and lightweight TradingView indicator that automatically marks the opening and closing moments of the major trading sessions directly on your chart.
It visually highlights:
Asian Session
European Session
U.S. Session
Each session opening and closing is shown with:
A vertical line on the exact candle where the session starts or ends
A label showing the session name and whether it is an Open or Close
This helps traders easily identify session transitions, which are often associated with changes in liquidity, volatility, and market behavior.
How It Works
The script checks whether the current candle falls inside a predefined session time range based on a selected time zone.
When the session state changes:
From inactive → active → it draws an Open marker
From active → inactive → it draws a Close marker
This is done for each session independently (Asia, Europe, USA), so you can clearly see when one session starts or ends relative to the others.
The indicator does not repaint and uses only confirmed candle information.
Sessions Used (default)
These are the default session times (you can change them in the code):
Asia: 19:00 – 01:00
Europe: 02:00 – 10:00
USA: 09:30 – 16:00
All times are interpreted according to the selected time zone.
How to Change the Time Zone
At the top of the script you will find this line:
tz = "America/La_Paz"
To change the time zone, simply replace "America/La_Paz" with your desired zone.
Examples:
tz = "America/New_York" // New York
tz = "Europe/London" // London
tz = "Asia/Tokyo" // Tokyo
tz = "Australia/Sydney" // Sydney
tz = "UTC" // Coordinated Universal Time
TradingView uses standard IANA time zone names.
You can find the full list here: en.wikipedia.org
Who Is This Indicator For?
This indicator is useful for:
Session-based traders
Liquidity traders
Forex, indices, and crypto traders
Anyone who wants to understand when major market sessions begin and end
Final Notes
Works on all timeframes.
Does not repaint.
Can be used on Forex, Crypto, Indices, and Futures.
Fully customizable (sessions, colors, labels, and time zone).
If you like this indicator or find it useful, feel free to like it or leave feedback — and happy trading! 🚀📈

6-9 session & levels6-9 Session & Levels - Customizable Range Analysis Indicator
Description:
This indicator provides comprehensive session-based range analysis designed for intraday traders. It calculates and displays key levels based on a customizable session period (default 6:00-9:00 AM ET).
Core Features:
Session Tracking
Monitors user-defined session times with timezone support
Displays session open, high, and low levels
Highlights session range with optional box visualization
Shows previous day RTH (Regular Trading Hours: 9:30 AM - 4:00 PM) levels
Range Levels
25%, 50%, and 75% range levels within the session
Range deviations at 0.5x, 1.0x, and 2.0x multiples
Fibonacci extension levels (customizable, default 1.33x and 1.66x)
Optional fill zones between Fibonacci levels
Time Zone Highlighting
Marks the 9:40-9:50 AM period as a potential reversal zone
Vertical lines with shading to identify key time windows
Statistical Analysis
Calculates mean and median extension levels based on historical sessions
Displays statistics table showing current range, average range, range difference, and z-score
Customizable sample size (1-100 sessions) for statistical calculations
Option to anchor extensions from either session open or high/low points
Input Settings Explained:
Session Settings
Levels Session Time: Define your session window in HHMM-HHMM format (default: 0600-0900)
Time Zone: Choose from UTC, America/New_York, America/Chicago, America/Los_Angeles, Europe/London, or Asia/Tokyo
Anchor Settings
Show Session Anchor: Toggle the session anchor line (marks session open price at 6:00 AM)
Anchor Style/Color/Width: Customize appearance (Solid/Dashed/Dotted, color, 1-4 width)
Show Anchor Label: Display price label for the anchor
Session Open Line: Similar options for the session open reference line
Range Box Settings
Show Range Box: Display a shaded rectangle highlighting the session high-to-low range
Range Box Color: Set the box background color and transparency
Range Levels (25%/50%/75%)
Show Range Levels: Toggle all three intermediate levels on/off
Individual Level Styling: Each level (25%, 50%, 75%) has its own color, style, and width settings
Show Range Level Labels: Display price labels for each level
Range Deviations
Show Range Deviations: Toggle deviation levels on/off
0.5x/1.0x/2.0x Settings: Each deviation multiplier can be customized with its own color, line style (Solid/Dashed/Dotted), and width
Show Range Deviation Labels: Display labels showing the deviation price levels
Previous Day RTH Levels
Show Previous RTH Levels: Display yesterday's regular trading hours high and low
RTH High/Low Styling: Separate color, style, and width settings for each level
Show Previous RTH Labels: Toggle price labels for RTH levels
Time Zones
Show 9:40-9:50 AM Zone: Highlight this specific time period with vertical lines and shading
Zone Color: Set the background fill color for the time zone
Zone Label Color/Text: Customize the label appearance and text
Fibonacci Extension Settings
Show Fibonacci Extensions: Toggle Fib levels on/off
Fib Extension Color/Style/Width: Customize line appearance
Show Fib Extension Labels: Display price labels
Fib Ext Level 1/2: Set custom multipliers (default 1.33 and 1.66, range 0-5 in 0.1 increments)
Show Fibonacci Fills: Display shaded zones between Fib levels
Fib Fill Color: Customize the fill color and transparency
Session High/Low Settings
Show Session High/Low Lines: Display the actual session extremes
Style/Color/Width: Customize line appearance
Show Labels: Toggle price labels for high/low levels
Extension Stats Settings
Show Statistical Levels on Chart: Display mean and median extension levels based on historical data
Extension Anchor Point: Choose whether to anchor from "Open" or "High/Low" of the session
Number of Sessions for Statistics: Set sample size (1-100, default 60) for calculating averages
Mean/Median High Extension: Separate styling for each statistical level (color, style, width)
Mean/Median Low Extension: Separate styling for downside statistical levels
Tables
Show Statistics Table: Display a summary table with current range, average range, difference, z-score, and sample size
Table Position: Choose from 9 positions (Bottom/Middle/Top + Center/Left/Right)
Table Text Size: Select from Auto, Tiny, Small, Normal, Large, or Huge
Display Settings
Projection Offset: Number of bars to extend lines forward (default 24)
Label Size: Choose from Tiny, Small, Normal, or Large
Price Decimal Precision: Set decimal places for price labels (0-6)
How It Works:
The indicator tracks the specified session period and calculates the session's open, high, low, and range. At the end of the session (9:00 AM by default), it projects all configured levels forward for the trading day. The statistical features analyze the last N sessions (you choose the number) to calculate typical extension behavior from either the session open or the session high/low points.
The z-score calculation helps identify whether the current session's range is normal, expanded, or contracted compared to recent history, allowing traders to adjust expectations for the rest of the day.
Use Case:
This indicator helps traders identify key support and resistance levels based on early session price action, understand current range context relative to historical averages, and spot potential reversal zones during specific time periods.
Note: This indicator is for informational purposes only and does not constitute investment advice. Always perform your own analysis before making trading decisions.

Session HL + Candles + AMD (Nephew_Sam_)Session HL + Candles + AMD (Nephew_Sam_)
This indicator marks out intraday sessions summarized into single candles, with an additional option to mark out the HL of each session. Perfect for understanding AMD within a glance (accumulation-manipulation-distribution)
Features:
Session High/Low lines with customizable colors and labels
Optional session candles displayed on the right side of the chart
Timezone support for global traders
Customizable bull/bear candle colors
Works on timeframes up to 1 hour
Perfect for:
Identifying session liquidity levels
Tracking session ranges and breakouts
Multi-timeframe session analysis
ICT methodology traders
Settings:
Choose your timezone for accurate session detection
Toggle session candles and HL lines independently
Customize colors, line styles, and labels
Set maximum timeframe (up to 1 hour)
TLC sessionA Professional Intraday Session Tracker with VWAP and Economic Event Integration
Description
This indicator provides visual tracking of major trading sessions (Asian, London, New York) combined with VWAP calculations and macroeconomic event zones. It's designed for intraday traders who need to monitor session overlaps, liquidity periods, and high-impact news events.
The basic script of trading sessions was taken as a basis and refined for greater convenience.
Key Features:
Customizable Session Tracking: Visualize up to 3 trading sessions with adjustable time zones (supports IANA & GMT formats)
Dynamic VWAP Integration: Built-in Volume-Weighted Average Price calculation
Macro Event Zones: Highlights key economic announcement windows (adjustable for summer/winter time)
Price Action Visualization: Displays open/close prices, session ranges, and average price levels
Automatic DST Adjustment: Uses IANA timezone database for daylight savings awareness
How It Works
1. Trading Session Detection
Three fully configurable sessions (e.g., Asia, London, New York)
Each session displays:
Colored background zone
Opening price (dashed line)
Closing price (dashed line)
Average price (dotted line)
Optional label with session name
2. VWAP Calculation
Standard Volume-Weighted Average Price plotted as circled line
Helps identify fair value within each session
3. Macro Event Zones
Special highlighted period for economic news releases
Automatically adjusts for summer/winter time
Default set to 1000-1200 (summer) or 0900-1100 (winter) GMT-5 (US session open)
Why This Indicator is Unique
Multi-Session Awareness
Unlike simple session indicators, this tool:
Tracks price development within each session
Shows session overlaps (critical for volatility periods)
Maintains separate VWAP calculations across sessions
Professional-Grade Features
IANA timezone support (automatic DST handling)
Customizable visual elements (toggle labels, ranges, averages)
Object-based architecture (clean, efficient rendering)
News event integration (helps avoid trading during high-impact releases)
Usage Recommendations
Best Timeframes
1-minute to 1-hour charts (intraday focus)
Not recommended for daily+ timeframes
Trading Applications
1. Session Breakout Strategy: Trade breakouts when London/New York sessions open
2. VWAP Reversion: Fade moves that deviate too far from VWAP
3. News Avoidance: Reduce position sizing during macro event windows
Visual Example
Asian session (red)
London session (blue)
New York session (purple)
Macro event zone (white)
VWAP line (gold circles)
The basic script of trading sessions was taken as a basis and refined for greater convenience.

ICT Macro Sessions by @zeusbottradingICT Macro Sessions Indicator
The ICT Macro Sessions Indicator is a powerful tool designed for traders who follow the ICT (Inner Circle Trader) methodology and want to optimize their trading during specific high-probability time intervals. This indicator highlights all the key macro sessions throughout the trading day in the GMT+8 (Hong Kong) time zone.
What Does the Indicator Do?
This indicator visually marks ICT Macro Sessions on your trading chart using background colors and optional labels. Each session corresponds to specific time intervals when institutional activity is most likely to drive price action. By focusing on these periods, traders can align their strategies with market volatility and liquidity, increasing their chances of success.
Highlighted Sessions
The indicator covers all major ICT Macro Sessions, each with a unique color for easy identification:
London Macro 1 (15:33–16:00 GMT+8):
- Marks the early London session, often characterized by strong directional moves.
London Macro 2 (17:03–17:30 GMT+8):
- Captures the mid-London session, where price frequently reacts to liquidity levels.
New York AM Macro 1 (22:50–23:10 GMT+8):
- Highlights the start of the New York session, a prime time for price reversals or continuations.
New York AM Macro 2 (23:50–00:10 GMT+8):
- Focuses on late-morning New York activity, often aligning with key news releases.
New York Lunch Macro (00:50–01:10 GMT+8):
- Covers the lunch period in New York, where price may consolidate or set up for afternoon moves.
New York PM Macro 1 (02:10–02:40 GMT+8):
- Tracks post-lunch activity in New York, often featuring renewed volatility.
New York PM Macro 2 (04:15–04:45 GMT+8):
- Captures late-session moves as institutional traders finalize their positions.
Features of the Indicator
Fixed Time: The indicator is pre-configured for GMT+8 but it will adapt automatically to your timezone. No need to change anything in the code.
Background Highlighting: Each session is visually marked with a unique background color for quick recognition.
Optional Labels: Traders can enable or disable labels for each session, providing flexibility in how information is displayed.
Session Toggles: You can choose which sessions to display based on your trading preferences and strategy.
Intraday Timeframes: The indicator is optimized for intraday charts with timeframes of 45 minutes or less. You can change it to anything you like.
Why Use This Indicator?
The ICT Macro Sessions Indicator helps traders focus on the most critical times of the trading day when institutional activity is at its peak. These periods often coincide with significant price movements, making them ideal for scalping, day trading, or even swing trading setups. By visually highlighting these sessions, the indicator eliminates guesswork and allows traders to plan their trades with precision.

Trading Sessions [ArtiumPro]ArtiumPro Sessions is packed with tons of features and alerts to help you with your trading. It is public so enjoy it!
- History - Yes or No, No will show the most current session only.
- Pre-Sessions Range with Opening Range Breakout Alerts
- Pre-Sessions Range Can Be Listed From 15 minutes To 4 hours
- Sessions Line Style - Solid, Dash, or Dots
- Sessions Box - Default 1 Can Be Increased
- Sessions Closed Icon - Yes or No, No will show an icon on all previous sessions not active
- Pip Session Ranges
- Lookback (minutes) will color code opening range settings which you can also use for testing previous sessions ranges to help with strategies
Sessions Alerts
- Sessions Start/End
- Opening Range Breakouts
- Price Crossed Session's High/Low After Session Closed
Time Zones Supported:
- America/Los_Angeles - America/New_York - America/El_Salvador - America/Chicago - America/Argentina/Buenos_Aires
- Europe/London - Europe/Berlin - Europe/Moscow
- Asia/Dubai - Asia/Bangkok - Asia/Hong_Kong - Asia_Tokyo
- Australia/Bribane - Austalia/Sydney
- India/Kolkota
New York Session
London Sessions
Asian Sessions
Indian Sessions
[UTILS] Session Input ParserAn utility function to parse session inputs. Extracts hours, minutes and weekdays (if defined) and returns a tuple as the result.
_parseSession(sessionString) => (hourStart, minuteStart, hourEnd, minuteEnd, weekdaysArray)
Examples presented on the chart.

Trade Session Marker of trade session
If you do not want painting all session, you should set -1 in the SessionStart
and SessionEnd
