Daily Session DividerThis script draws vertical lines showing the new daily sessions. These will only be displayed when it's on an intraday timeframe (lower than daily timeframe).
Settings:
Line Color: Choose the color you want and change the opacity
Line Width: If you want a thicc line. Defaults to 1 (recommended setting)
Line Style: Choose between solid (default), dashed, or dotted
在脚本中搜索"session"

ICT MacrosThis script allows traders to visualize the range of time when a macro (an automated series of instructions/trades from large fund traders, executed by an algorithm) will likely occur in the market. It does this by drawing vertical lines and labels on the chart at these specific times:
(Macro Open) - 9:50 AM EST
(Macro Close) - 10:10 AM EST
(Macro Open) - 10:50 AM EST
(Macro Close) - 11:10 AM EST
(Macro Open) - 1:10 PM EST
(Macro Close) - 1:40 PM EST
(Macro Open) - 3:15 PM EST
(Macro Close) - 3:45 PM EST
The theory behind the use of these macros - is that the market will either seek buy side or sell side liquidity, or seek to rebalance price at a point of interest in between the open and close of the macro. Traders who follow this theory can use that information to anticipate how price might behave.
When a macro occurs, the script draws a vertical line on the chart using a dotted line style with a user-defined color. Additionally, a label is placed above the line to indicate whether it is a Macro Open or Macro Close event.
To preserve space, the labels are abbreviated on chart - "Macro Open" (M.O.) and "Macro Close" (M.C.) for both the morning and afternoon trading sessions. The labels may be turned on/off by the user.
The script also includes alerts that can notify traders when a macro occurs. These alerts can be set to go off once per bar close, and the alert message indicates the specific macro type and time.
This script is entirely open-source, meaning that traders can read the code and modify it as needed. Credit to the foundation of this script goes to TradingView user @rickyzcarroll for his open source Strat Assistant Hour Flip script. Important changes include the specific time changes and alert function.

Ultimate Time Filter V1The only time filter that you will ever need.
Easily filter for:
--> Start/End Dates
--> Weekdays
--> 1 or 2 Daily Trade Sessions.
This is open source on purpose so you can enjoy ease of use on your own codes. Simply copy the code and use the variable "inTime" to filter bars that fit your time constraints.
I spent a lot more time on this than I'd like to admit but so be it. Any comments for improvements, or questions on how to use the script is appreciated. Or if you wanna chat about trading / pine script hit me up on Discord.
Cheers

NQ 5x Daily SessionsThis indicator automatically plots horizontal lines for the Daily Open as well as four of the most significant trading milestones of the day (CET/Berlin time). It helps you instantly identify psychological price levels and institutional opening marks directly on your chart.
Features:
Key Time Stamps: Automatic lines for the daily opening price and specific session opens at 08:00 (Frankfurt/Pre-Market), 10:00, 14:00, and 15:30 (NYSE Open).
Fully Customizable:
Control line thickness, label visibility, and the extension of current intraday lines via the settings menu.
Trading Application:
These levels often act as significant Support & Resistance during intraday trading. The 08:00 and 15:30 marks, in particular, frequently represent turning points or the start of strong trends, as trading volume spikes significantly during these windows.

TOA SESSION INDICATOR PRO - MARKED WITH COLORSThis indicator is made for The Orderflow Academy community.
You can see the highs and lows of the sessions in colors.

NY Session Start & End LinesDraws a vertical line at the start and end of regular trading hours for the NY session.

Daily 5 & 20 (Session Lines)Daily 5 & 20 Moving Average Levels
This indicator plots the Daily 5-period and Daily 20-period moving averages as horizontal levels on any timeframe. Each level starts at the first bar of the trading day and extends only to the current price, keeping the chart clean and focused on the active session.
The levels update once per day using confirmed daily data and are designed to act as intraday bias, support, and resistance references. Labels are aligned on the right side for a minimal, institutional-style presentation.
Useful for:
Intraday trading on lower timeframes
Identifying daily trend bias
Mean reversion and pullback setups
Futures, stocks, ETFs, and options
No future extension, no repainting, and no unnecessary clutter.
-Golden Zone Family

Macro PO3 + Sessions + H/L LevelsMacro power of 3
Session highs lows
previous days highs and lows
previous week highs and lows

ICT Master: Type-Safe Sessions & FVGsasia, london , new york session and killzones used by ict and other top traders

Prop ES Bollinger Bands Strat during Single/Dual Trading SessionBollinger Band strategy for ES futures optimized for prop firm rules.
Choose long-only, short-only, or both directions.
Customizable BB length and multiplier.
Enter trades during one or two configurable sessions specified in New York time.
Fixed TP/SL in ticks with forced close by 4:59 PM NY time.

3 Session ORB (Opening Range Breakout) [TickDaddy]The ORB, or Opening Range Breakout indicator. will show all 3 sessions and you can adjust the times.

Prop ES EMA Cross during Single/Dual Trading SessionEMA crossover strategy for ES futures optimized for prop firm rules.
Choose long-only, short-only, or both directions.
Customizable short and long EMA lengths.
Enter trades during one or two configurable sessions specified in New York time.
Fixed TP/SL in ticks with forced close by 4:59 PM NY time.

EMA + Sessions + RSI Strategy v1.0A professional trading strategy that combines multiple technical indicators for high-probability entries. This system uses EMA crossovers, RSI zone filtering, and trend confirmation to identify optimal trading opportunities while managing risk with advanced position management tools.
Key Features:
✅ Dual Entry Signals (EMA21 + EMA100 crossover conditions)
✅ Trend Filter EMA750 (trade only with the major trend)
✅ Complete Risk Management (SL 1%, TP 3% default)
✅ Trailing Stop & Breakeven (maximize profits, protect capital)
✅ Compact Statistics Table (real-time performance metrics)
✅ RSI & Session Filters (avoid low-probability setups)
✅ Optional Pyramiding (scale into winning positions)
Perfect for swing trading and trend-following on any timeframe. Fully customizable to match your trading style.

an_dy_time_marker+killzone+sessionAn indicator where you can configure 5 different trading times. You can also view the kill zone and the entire session.
Have fun and catch the pips!

FX Sessions by m_cptForex Intraday Sessions Indicator, config time in UTC-4. Support 4 main sessions, smooth end-to-start candles mode, without gaps if your sessions has config like:
1) 19:00 - 03:00
2) 02:00 - 03:00
3) 03:00 -11:00
No excluded last candles issue on all TFs.
Working on LTF up to 1h TF since its intraday sessions indicator.


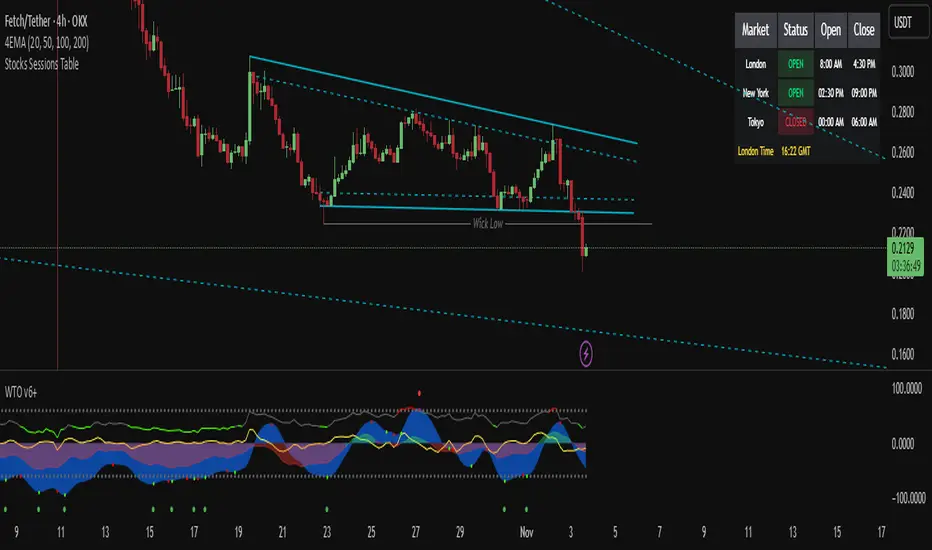
Stocks Sessions TableThe stock market open session table is a great way to keep an eye on the market's open and close. This is aimed at the UK traders working with the BST timezone
Trading Sessionsconst string TZ_TOOLTIP_TEXT = "The session's time zone, specified in either GMT notation (e.g., 'GMT-5') or as an IANA time zone database name (e.g., 'America/New_York')."

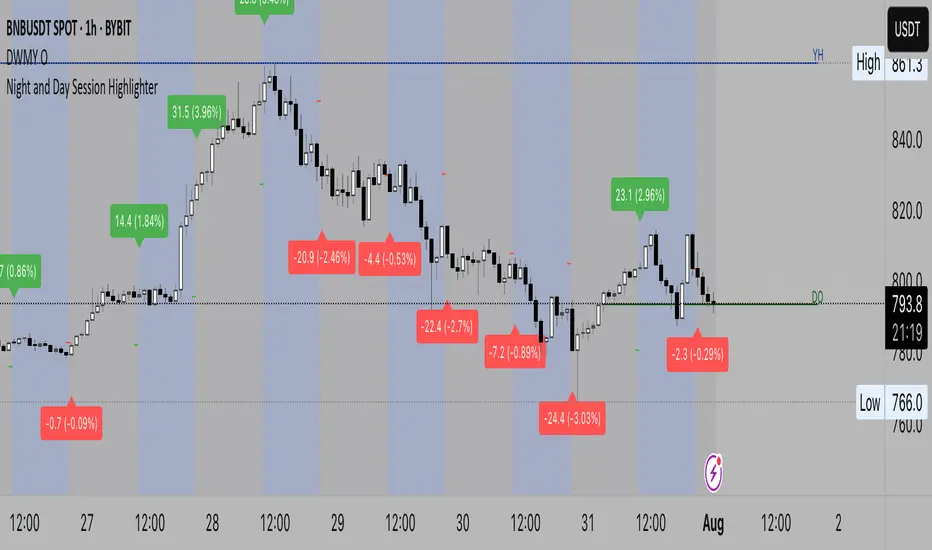
Night and Day Session Highlighter % (Valehson)- This script splits the day into night and day sessions and displays the price change in percentage.
- Этот скрипт разделяет день на вечерние и дневные сессии и показывает изменение цены в процентах.
Custom Time Session Background (Amsterdam Time, DST Safe)This indicator highlights two custom intraday time ranges with background colors on your chart. The times are set based on your local Amsterdam time and automatically adjust for Daylight Saving Time (DST).
📌 Features:
- Define two separate time ranges (Start & End) in local Amsterdam time
- Background color highlighting for each range
- Fully DST-aware using the "Europe/Amsterdam" timezone
- Works across all intraday timeframes
🎯 Use Cases:
- Highlight key market sessions (e.g., EU open, NY overlap)
- Visually segment your trading hours
- Eliminate manual DST adjustments
Developed with Pine Script v5.
Made for traders who want clarity during specific time zones, without worrying about time shifts across the year.

ICT Killzones + Pivots [TFO]Designed with the help of TTrades and with inspiration from the ICT Everything indicator by coldbrewrosh, the purpose of this script is to identify ICT Killzones while also storing their highs and lows for future reference, until traded through.
There are 5 Killzones / sessions whose times and labels can all be changed to one's liking. Some prefer slight alterations to traditional ICT Killzones, or use different time windows altogether. Either way, the sessions are fully customizable. The sessions will auto fit to keep track of the highs and lows made during their respective times, and these pivots will be extended until they are invalidated.
There are also 4 optional Open Price lines and 4 vertical Timestamps, where the user can change the time and style of each one as well.
To help maintain a clean chart, we can implement a Cutoff Time where all drawings will stop extending past a certain point. The indicator will apply this logic by default, as it can get messy with multiple drawings starting and stopping throughout the day at different times.
Given the amount of interest I've received about this indicator, I intend to leave it open to suggestions for further improvements. Let me know what you think & what you want to see added!

SetSessionTimesIndiaLibrary "SetSessionTimesIndia"
This library might be useful to code an indicator or strategy that requires to call Indian trading sessions at NSE and MCX.
SetSessionTimes()
