Smart Adaptive Signal SystemSmart Adaptive Signal System
Description: The Smart Adaptive Signal System is a sophisticated indicator that generates intelligent buy/sell signals by dynamically adapting to market conditions. It predicts target prices based on momentum and volatility, providing more accurate and reliable trading opportunities.
How It Works:
Dynamic Signal Generation: The system predicts target prices by considering factors such as volatility and momentum. This allows it to react instantly to trend changes and market fluctuations.
Adaptive Thresholds: Buy and sell signals are triggered with adaptive thresholds, adjusting according to market volatility. This ensures flexibility in the face of sudden market changes.
Trend-Based Reset: Users can choose to reset threshold values based on a time interval or trend change. This feature helps the system re-adapt to current market conditions for greater accuracy.
Target Price Prediction: Target prices are calculated using momentum and volatility, helping the system predict future price movements.
How to Use:
Buy/Sell Signals: The indicator generates buy and sell signals based on market conditions. Look for a "down arrow" for a buy signal and an "up arrow" for a sell signal on the chart.
Target Price Lines: Along with buy and sell signals, the system draws target price lines. This helps you visualize potential future price levels.
Flexible Settings: Users can customize analysis periods, minimum change percentages, and other parameters to fit their needs.
Features:
Dynamic buy and sell signals
Target price predictions
Volatility and momentum-based analysis
User-friendly and flexible settings
Trend-based adaptive resetting
Alerts: The Smart Adaptive Signal System responds quickly to sudden market changes, but always use it in conjunction with other indicators like support and resistance levels. Signal accuracy may vary depending on market conditions.
在脚本中搜索"signal"
[COG]StochRSI Zenith📊 StochRSI Zenith
This indicator combines the traditional Stochastic RSI with enhanced visualization features and multi-timeframe analysis capabilities. It's designed to provide traders with a comprehensive view of market conditions through various technical components.
🔑 Key Features:
• Advanced StochRSI Implementation
- Customizable RSI and Stochastic calculation periods
- Multiple moving average type options (SMA, EMA, SMMA, LWMA)
- Adjustable signal line parameters
• Visual Enhancement System
- Dynamic wave effect visualization
- Energy field display for momentum visualization
- Customizable color schemes for bullish and bearish signals
- Adaptive transparency settings
• Multi-Timeframe Analysis
- Higher timeframe confirmation
- Synchronized market structure analysis
- Cross-timeframe signal validation
• Divergence Detection
- Automated bullish and bearish divergence identification
- Customizable lookback period
- Clear visual signals for confirmed divergences
• Signal Generation Framework
- Price action confirmation
- SMA-based trend filtering
- Multiple confirmation levels for reduced noise
- Clear entry signals with customizable display options
📈 Technical Components:
1. Core Oscillator
- Base calculation: 13-period RSI (adjustable)
- Stochastic calculation: 8-period (adjustable)
- Signal lines: 5,3 smoothing (adjustable)
2. Visual Systems
- Wave effect with three layers of visualization
- Energy field display with dynamic intensity
- Reference bands at 20/30/50/70/80 levels
3. Confirmation Mechanisms
- SMA trend filter
- Higher timeframe alignment
- Price action validation
- Divergence confirmation
⚙️ Customization Options:
• Visual Parameters
- Wave effect intensity and speed
- Energy field sensitivity
- Color schemes for bullish/bearish signals
- Signal display preferences
• Technical Parameters
- All core calculation periods
- Moving average types
- Divergence detection settings
- Signal confirmation criteria
• Display Settings
- Chart and indicator signal placement
- SMA line visualization
- Background highlighting options
- Label positioning and size
🔍 Technical Implementation:
The indicator combines several advanced techniques to generate signals. Here are key components with code examples:
1. Core StochRSI Calculation:
// Base RSI calculation
rsi = ta.rsi(close, rsi_length)
// StochRSI transformation
stochRSI = ((ta.highest(rsi, stoch_length) - ta.lowest(rsi, stoch_length)) != 0) ?
(100 * (rsi - ta.lowest(rsi, stoch_length))) /
(ta.highest(rsi, stoch_length) - ta.lowest(rsi, stoch_length)) : 0
2. Signal Generation System:
// Core signal conditions
crossover_buy = crossOver(sk, sd, cross_threshold)
valid_buy_zone = sk < 30 and sd < 30
price_within_sma_bands = close <= sma_high and close >= sma_low
// Enhanced signal generation
if crossover_buy and valid_buy_zone and price_within_sma_bands and htf_allows_long
if is_bullish_candle
long_signal := true
else
awaiting_bull_confirmation := true
3. Multi-Timeframe Analysis:
= request.security(syminfo.tickerid, mtf_period,
)
The HTF filter looks at a higher timeframe (default: 4H) to confirm the trend
It only allows:
Long trades when the higher timeframe is bullish
Short trades when the higher timeframe is bearish
📈 Trading Application Guide:
1. Signal Identification
• Oversold Opportunities (< 30 level)
- Look for bullish crosses of K-line above D-line
- Confirm with higher timeframe alignment
- Wait for price action confirmation (bullish candle)
• Overbought Conditions (> 70 level)
- Watch for bearish crosses of K-line below D-line
- Verify higher timeframe condition
- Confirm with bearish price action
2. Divergence Trading
• Bullish Divergence
- Price makes lower lows while indicator makes higher lows
- Most effective when occurring in oversold territory
- Use with support levels for entry timing
• Bearish Divergence
- Price makes higher highs while indicator shows lower highs
- Most reliable in overbought conditions
- Combine with resistance levels
3. Wave Effect Analysis
• Strong Waves
- Multiple wave lines moving in same direction indicate momentum
- Wider wave spread suggests increased volatility
- Use for trend strength confirmation
• Energy Field
- Higher intensity in trading zones suggests stronger moves
- Use for momentum confirmation
- Watch for energy field convergence with price action
The energy field is like a heat map that shows momentum strength
It gets stronger (more visible) when:
Price is in oversold (<30) or overbought (>70) zones
The indicator lines are moving apart quickly
A strong signal is forming
Think of it as a "strength meter" - the more visible the energy field, the stronger the potential move
4. Risk Management Integration
• Entry Confirmation
- Wait for all signal components to align
- Use higher timeframe for trend direction
- Confirm with price action and SMA positions
• Stop Loss Placement
- Consider placing stops beyond recent swing points
- Use ATR for dynamic stop calculation
- Account for market volatility
5. Position Management
• Partial Profit Taking
- Consider scaling out at overbought/oversold levels
- Use wave effect intensity for exit timing
- Monitor energy field for momentum shifts
• Trade Duration
- Short-term: Use primary signals in trading zones
- Swing trades: Focus on divergence signals
- Position trades: Utilize higher timeframe signals
⚠️ Important Usage Notes:
• Avoid:
- Trading against strong trends
- Relying solely on single signals
- Ignoring higher timeframe context
- Over-leveraging based on signals
Remember: This tool is designed to assist in analysis but should never be used as the sole decision-maker for trades. Always maintain proper risk management and combine with other forms of analysis.

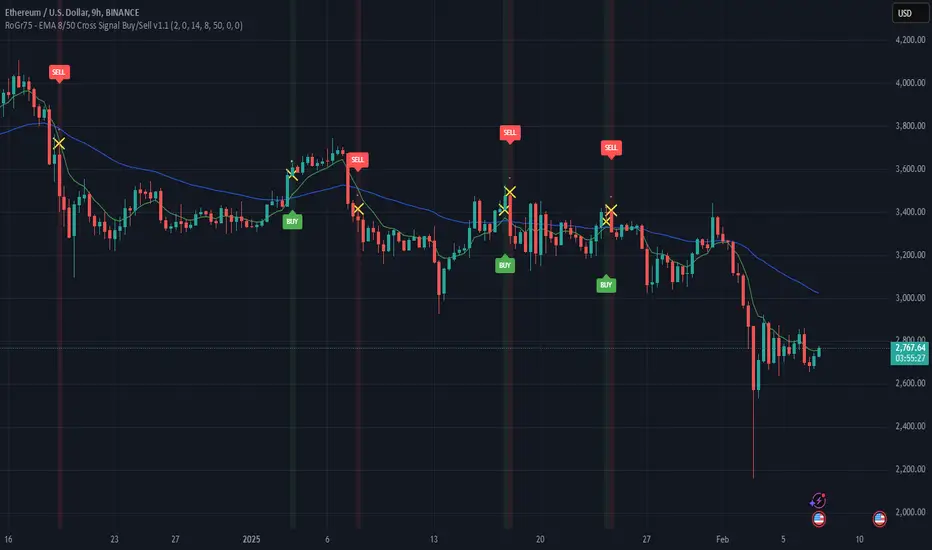
RoGr75 - EMA 50/8 Cross With Buy/Sell Signals RoGr75 - EMA 50/8 Cross With Buy/Sell Signals
---
**Overview:**
This script is designed to generate **Buy** and **Sell** signals based on the crossover and crossunder of two Exponential Moving Averages (EMAs): **EMA 8** (green line) and **EMA 50** (blue line). The signals are plotted at a user-defined distance from the candles, ensuring clear visibility and adaptability to market volatility.
---
**Key Features:**
1. **EMA Cross Signals**:
- A **Buy Signal** is generated when the **EMA 8** crosses above the **EMA 50**.
- A **Sell Signal** is generated when the **EMA 8** crosses below the **EMA 50**.
2. **Variable Signal Distance**:
- The distance of the Buy and Sell signals from the candles is controlled by a **user-defined input** (`signal_distance`).
- The distance is calculated using the **Average True Range (ATR)** to adapt to market volatility.
3. **Customizable Parameters**:
- `signal_distance`: Adjust the distance of the signals from the candles (default: 2.0).
- ATR period: Fixed at 14 but can be modified in the script.
4. **Visual Enhancements**:
- Buy signals are displayed as green labels below the candles.
- Sell signals are displayed as red labels above the candles.
- Optional background highlighting for Buy and Sell signals.
---
**How It Works:**
- The script calculates the **EMA 8** and **EMA 50** and plots them on the chart.
- When a crossover or crossunder occurs, a label is placed at a distance determined by the formula:
- **Buy Signal Position**: `low - (signal_distance * ATR(14))`
- **Sell Signal Position**: `high + (signal_distance * ATR(14))`
- The signals are clearly visible and adapt to the volatility of the asset.
---
**Input Parameters:**
- `signal_distance` (type: input float): Controls the distance of the Buy and Sell signals from the candles. Default value is `2.0`.
---
**Usage:**
1. Add the script to your chart in TradingView.
2. Adjust the `signal_distance` input to set the desired distance of the signals from the candles.
3. Monitor the Buy and Sell signals generated by the script for potential trading opportunities.
---
**Example:**
- If `signal_distance` is set to `2.0`, the Buy signal will appear **2x ATR** below the candle's low, and the Sell signal will appear **2x ATR** above the candle's high.
---
**Customization:**
- Modify the ATR period or replace it with a fixed value for static distance.
- Adjust the colors, styles, and sizes of the labels and EMAs to suit your preferences.
---
**Ideal For:**
- Traders looking for a simple and effective EMA crossover strategy.
- Users who want customizable signal placement for better visibility.
- Those who prefer volatility-adjusted signal distances.
---
**Note:**
This script is for educational and informational purposes only. Always backtest and validate strategies before using them in live trading.
Ultimate Stochastics Strategy by NHBprod Use to Day Trade BTCHey All!
Here's a new script I worked on that's super simple but at the same time useful. Check out the backtest results. The backtest results include slippage and fees/commission, and is still quite profitable. Obviously the profitability magnitude depends on how much capital you begin with, and how much the user utilizes per order, but in any event it seems to be profitable according to backtests.
This is different because it allows you full functionality over the stochastics calculations which is designed for random datasets. This script allows you to:
Designate ANY period of time to analyze and study
Choose between Long trading, short trading, and Long & Short trading
It allows you to enter trades based on the stochastics calculations
It allows you to EXIT trades using the stochastics calculations or take profit, or stop loss, Or any combination of those, which is nice because then the user can see how one variable effects the overall performance.
As for the actual stochastics formula, you get control, and get to SEE the plot lines for slow K, slow D, and fast K, which is usually not considered.
You also get the chance to modify the smoothing method, which has not been done with regular stochastics indicators. You get to choose the standard simple moving average (SMA) method, but I also allow you to choose other MA's such as the HMA and WMA.
Lastly, the user gets the option of using a custom trade extender, which essentially allows a buy or sell signal to exist for X amount of candles after the initial signal. For example, you can use "max bars since signal" to 1, and this will allow the indicator to produce an extra sequential buy signal when a buy signal is generated. This can be useful because it is possible that you use a small take profit (TP) and quickly exit a profitable trade. With the max bars since signal variable, you're able to reenter on the next candle and allow for another opportunity.
Let me know if you have any questions! Please take a look at the performance report and let me know your thoughts! :)

Matrix Series and Vix Fix with VWAP CCI and QQE SignalsMatrix Series and Vix Fix with VWAP CCI and QQE Signals
Short Title: Advanced Matrix
Purpose
This Pine Script combines multiple technical analysis tools to create a comprehensive trading indicator. It incorporates elements like support/resistance zones, overbought/oversold conditions, Williams Vix Fix, QQE (Quantitative Qualitative Estimation) signals, VWAP CCI signals, and a 200-period SMA for trend filtering. The goal is to provide actionable buy and sell signals with enhanced visualization.
Key Features and Components
1. Matrix Series
Smoothing Input: Allows customization of EMA smoothing for the indicator (default: 5).
Support/Resistance Zones: Based on CCI (Commodity Channel Index) values.
Dynamic zones calculated with customizable parameters (SupResPeriod, SupResPercentage, PricePeriod).
Candlestick Visualization: Custom candlestick plots with colors indicating trends.
Dynamic levels for overbought/oversold conditions.
2. Overbought/Oversold Signals
Overbought and oversold levels are adjustable (ob and os).
Plots circles on the chart to highlight extreme conditions.
3. Williams Vix Fix
Identifies potential reversal points by analyzing volatility.
Uses Bollinger Bands and percentile thresholds to detect high-probability entries.
Includes two alert levels (alert1 and alert2) with customizable criteria for signal filtering.
4. QQE Signals
Based on the smoothed RSI and QQE methodology.
Detects trend changes using adaptive ATR bands (FastAtrRsiTL).
Plots long and short signals when specific conditions are met.
5. VWAP CCI Signals
Combines VWAP and CCI for additional trade signals.
Detects crossovers and crossunders of CCI levels (-200 and 200) to generate long and short signals.
6. 200 SMA
A 200-period simple moving average is plotted to act as a trend filter.
The script rules recommend buying only when the price is above the SMA200.
Customizable Inputs
General:
Smoothing, support/resistance periods, overbought/oversold levels.
Williams Vix Fix:
Lookback periods, Bollinger Band settings, percentile thresholds.
QQE:
RSI length, smoothing factor, QQE factor, and threshold values.
VWAP CCI:
Length for calculating deviations.
Visual Elements
Dynamic candlestick colors to indicate trend direction.
Overbought/oversold circles for extreme price levels.
Resistance and support lines.
Labels and shapes for buy/sell signals from Vix Fix, QQE, and VWAP CCI.
Alerts
Alerts are configured for the Matrix Series (e.g., "BUY MATRIX") and other components, ensuring traders are notified when significant conditions are met.
Intended Use
This indicator is designed for traders seeking a multi-faceted tool to analyze market trends, identify potential reversal points, and generate actionable trading signals. It combines traditional indicators with advanced techniques for comprehensive market analysis.

BTC-SPX Momentum Gauge + EMA SignalHere's an explanation of the market dynamics and signal benefits of this script:
Momentum and Sentiment Indicator:
The script uses the momentum of the S&P 500 to change the chart's background color, providing a quick visual cue of market sentiment. Green indicates potential bullish momentum in the broader market, while red suggests bearish momentum. This can help traders gauge overall market direction at a glance.
Bitcoin Trend Analysis:
By plotting the scaled TEMA of Bitcoin (BTC), traders can see how Bitcoin's trend correlates or diverges from the current asset being analyzed. Since Bitcoin is often viewed as a hedge against traditional financial systems or inflation, its trend can signal broader economic shifts or investor sentiment towards alternative investments.
Dual Trend Confirmation:
The script offers two trend lines: one for Bitcoin and one for the current ticker. When these lines move in tandem, it might indicate a strong market trend across both traditional and crypto markets. Divergence between these lines can highlight potential market anomalies or opportunities for arbitrage or hedging.
Smoothness vs. Reactivity:
The use of TEMA for Bitcoin provides a smoother signal than a simple moving average, reducing lag while still reacting to price changes. This can be particularly useful for identifying longer-term trends in Bitcoin's volatile market. The 20-period EMA for the current ticker, on the other hand, gives a quicker response to price changes in the asset you're directly trading.
Cross-Asset Correlation:
By overlaying Bitcoin's trend on another asset's chart, traders can analyze how these markets might influence each other. For instance, if Bitcoin is in an uptrend while a traditional asset is declining, it might suggest capital rotation into cryptocurrencies.
Trading Signals:
Crossovers or divergences between the TEMA of Bitcoin and the EMA of the current ticker could be used as signals for entry or exit points. For example, if the BTC TEMA crosses above the current ticker's EMA, it might suggest a shift towards crypto assets.
Risk Management:
The visual cues from the background color and moving averages can aid in risk management. For example, trading in the direction of the momentum indicated by the background color might be seen as going with the market flow, potentially reducing risk.
Macro-Economic Insights:
The relationship between Bitcoin and traditional markets can offer insights into macroeconomic conditions, particularly related to inflation, monetary policy, and investor sentiment towards fiat currencies.
Headwind and tailwind:
Currently BTC correlated trade instruments experience headwind or tailwind from the broader market. This indicator lets the user see it to help their trade decision process.
Additional Statement:
As the market realizes the dangers of the fiat that its construct is built upon and evolves and migrates into stable money, incorruptible by inflation, this indicator will reveal the external influence of that corruptible and the internal influence of the incorruptible; having diminishing returns as the rise of stable money overtakes the treasuries of the fiat construct.

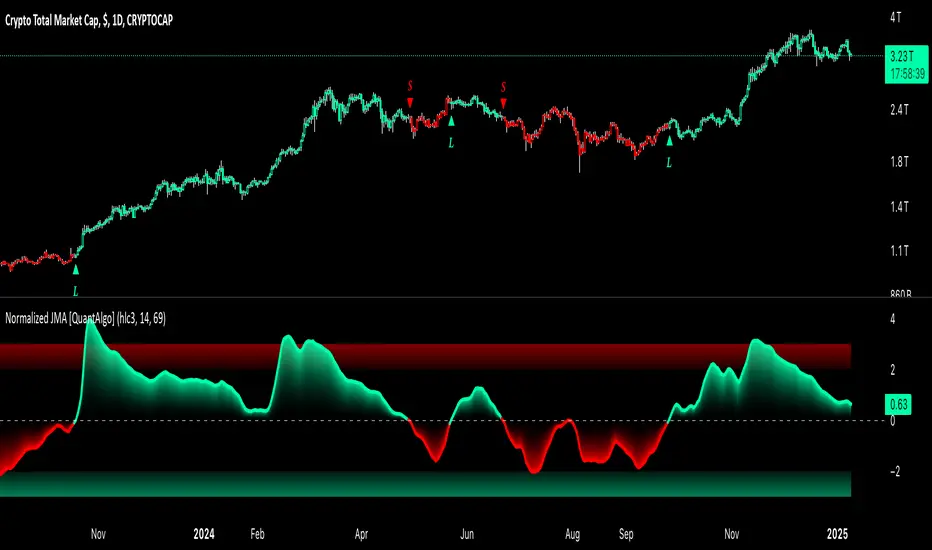
Normalized Jurik Moving Average [QuantAlgo]Upgrade your investing and trading strategy with the Normalized Jurik Moving Average (JMA) , a sophisticated oscillator that combines adaptive smoothing with statistical normalization to deliver high-quality signals! Whether you're a swing trader looking for momentum shifts or a medium- to long-term investor focusing on trend validation, this indicator's statistical approach offers valuable analytical advantages that can enhance your trading and investing decisions!
🟢 Core Architecture
The foundation of this indicator lies in its unique dual-layer calculation system. The first layer implements the Jurik Moving Average, known for its superior noise reduction and responsiveness, while the second layer applies statistical normalization (Z-Score) to create standardized readings. This sophisticated approach helps identify significant price movements while filtering out market noise across various timeframes and instruments.
🟢 Technical Foundation
Three key components power this indicator are:
Jurik Moving Average (JMA): An advanced moving average calculation that provides superior smoothing with minimal lag
Statistical Normalization: Z-Score based scaling that creates consistent, comparable readings across different market conditions
Dynamic Zone Detection: Automatically identifies overbought and oversold conditions based on statistical deviations
🟢 Key Features & Signals
The Normalized JMA delivers market insights through:
Color-adaptive oscillator line that reflects momentum strength and direction
Statistically significant overbought/oversold zones for trade validation
Smart gradient fills between signal line and zero level for enhanced visualization
Clear long (L) and short (S) markers for validated momentum shifts
Intelligent bar coloring that highlights the current market state
Customizable alert system for both bullish and bearish setups
🟢 Practical Usage Tips
Here's how to maximize your use of the Normalized JMA:
1/ Setup:
Add the indicator to your favorites, then apply it to your chart ⭐️
Begin with the default smoothing period for balanced analysis
Use the default normalization period for optimal signal generation
Start with standard visualization settings
Customize colors to match your chart preferences
Enable both bar coloring and signal markers for complete visual feedback
2/ Reading Signals:
Watch for L/S markers - they indicate validated momentum shifts
Monitor oscillator line color changes for direction confirmation
Use the built-in alert system to stay informed of potential trend changes
🟢 Pro Tips
Adjust Smoothing Period based on your trading style:
→ Lower values (8-12) for more responsive signals
→ Higher values (20-30) for more stable trend identification
Fine-tune Normalization Period based on market conditions:
→ Shorter periods (20-25) for more dynamic markets
→ Longer periods (40-50) for more stable markets
Optimize your analysis by:
→ Using +2/-2 zones for primary trade signals
→ Using +3/-3 zones for extreme market conditions
→ Combining with volume analysis for trade confirmation
→ Using multiple timeframe analysis for strategic context
Combine with:
→ Volume indicators for trade validation
→ Price action for entry timing
→ Support/resistance levels for profit targets
→ Trend-following indicators for directional bias
Dual Bayesian For Loop [QuantAlgo]Discover the power of probabilistic investing and trading with Dual Bayesian For Loop by QuantAlgo , a cutting-edge technical indicator that brings statistical rigor to trend analysis. By merging advanced Bayesian statistics with adaptive market scanning, this tool transforms complex probability calculations into clear, actionable signals—perfect for both data-driven traders seeking statistical edge and investors who value probability-based confirmation!
🟢 Core Architecture
At its heart, this indicator employs an adaptive dual-timeframe Bayesian framework with flexible scanning capabilities. It utilizes a configurable loop start parameter that lets you fine-tune how recent price action influences probability calculations. By combining adaptive scanning with short-term and long-term Bayesian probabilities, the indicator creates a sophisticated yet clear framework for trend identification that dynamically adjusts to market conditions.
🟢 Technical Foundation
The indicator builds on three innovative components:
Adaptive Loop Scanner: Dynamically evaluates price relationships with adjustable start points for precise control over historical analysis
Bayesian Probability Engine: Transforms market movements into probability scores through statistical modeling
Dual Timeframe Integration: Merges immediate market reactions with broader probability trends through custom smoothing
🟢 Key Features & Signals
The Adaptive Dual Bayesian For Loop transforms complex calculations into clear visual signals:
Binary probability signal displaying definitive trend direction
Dynamic color-coding system for instant trend recognition
Strategic L/S markers at key probability reversals
Customizable bar coloring based on probability trends
Comprehensive alert system for probability-based shifts
🟢 Practical Usage Tips
Here's how you can get the most out of the Dual Bayesian For Loop :
1/ Setup:
Add the indicator to your TradingView chart by clicking on the star icon to add it to your favorites ⭐️
Start with default source for balanced price representation
Use standard length for probability calculations
Begin with Loop Start at 1 for complete price analysis
Start with default Loop Lookback at 70 for reliable sampling size
2/ Signal Interpretation:
Monitor probability transitions across the 50% threshold (0 line)
Watch for convergence of short and long-term probabilities
Use L/S markers for potential trade signals
Monitor bar colors for additional trend confirmation
Configure alerts for significant trend crossovers and reversals, ensuring you can act on market movements promptly, even when you’re not actively monitoring the charts
🟢 Pro Tips
Fine-tune loop parameters for optimal sensitivity:
→ Lower Loop Start (1-5) for more reactive analysis
→ Higher Loop Start (5-10) to filter out noise
Adjust probability calculation period:
→ Shorter lengths (5-10) for aggressive signals
→ Longer lengths (15-30) for trend confirmation
Strategy Enhancement:
→ Compare signals across multiple timeframes
→ Combine with volume for trade validation
→ Use with support/resistance levels for entry timing
→ Integrate other technical tools for even more comprehensive analysis

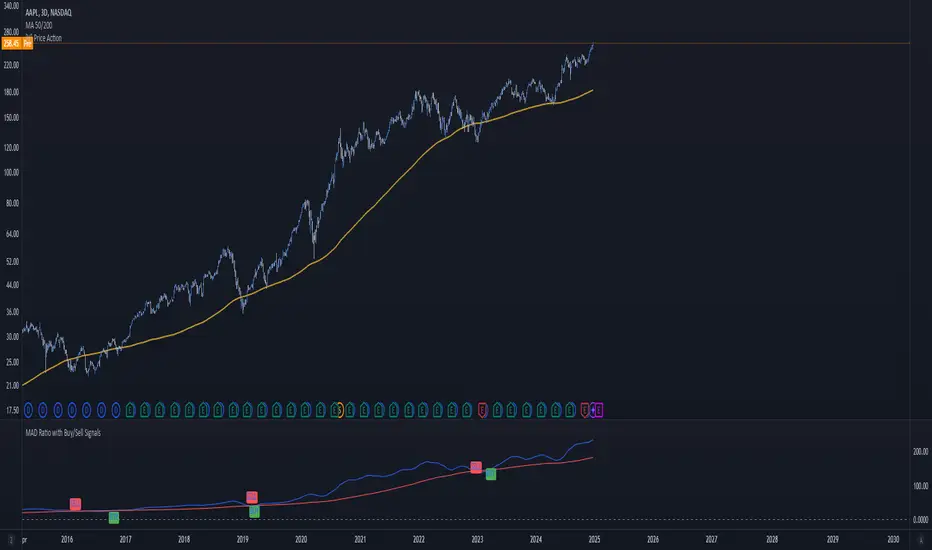
MAD Ratio with Buy/Sell SignalsThis code creates an indicator that generates Buy and Sell signals based on the Moving Average Distance (MAD) Ratio and the crossover/crossunder of two Simple Moving Averages (SMA). Here's a breakdown of what it does:
What the Indicator Shows:
Moving Averages:
21-day SMA (shortMA): Plotted in blue.
200-day SMA (longMA): Plotted in red.
These lines visually represent short-term and long-term trends in price.
Horizontal Reference Line:
A gray horizontal line at Ratio = 1 marks when the 21-day SMA and 200-day SMA are equal. This is the neutral point for the MAD ratio.
Buy and Sell Signals:
Buy Signal (Green Label):
Triggered when:
MAD Ratio > 1 (shortMA is greater than longMA, indicating upward momentum).
The 21-day SMA crosses above the 200-day SMA.
Displays a green "BUY" label below the price chart.
Sell Signal (Red Label):
Triggered when:
MAD Ratio < 1 (shortMA is less than longMA, indicating downward momentum).
The 21-day SMA crosses below the 200-day SMA.
Displays a red "SELL" label above the price chart.
Trend Trader-Remastered StrategyOfficial Strategy for Trend Trader - Remastered
Indicator: Trend Trader-Remastered (TTR)
Overview:
The Trend Trader-Remastered is a refined and highly sophisticated implementation of the Parabolic SAR designed to create strategic buy and sell entry signals, alongside precision take profit and re-entry signals based on marked Bill Williams (BW) fractals. Built with a deep emphasis on clarity and accuracy, this indicator ensures that only relevant and meaningful signals are generated, eliminating any unnecessary entries or exits.
Please check the indicator details and updates via the link above.
Important Disclosure:
My primary objective is to provide realistic strategies and a code base for the TradingView Community. Therefore, the default settings of the strategy version of the indicator have been set to reflect realistic world trading scenarios and best practices.
Key Features:
Strategy execution date&time range.
Take Profit Reduction Rate: The percentage of progressive reduction on active position size for take profit signals.
Example:
TP Reduce: 10%
Entry Position Size: 100
TP1: 100 - 10 = 90
TP2: 90 - 9 = 81
Re-Entry When Rate: The percentage of position size on initial entry of the signal to determine re-entry.
Example:
RE When: 50%
Entry Position Size: 100
Re-Entry Condition: Active Position Size < 50
Re-Entry Fill Rate: The percentage of position size on initial entry of the signal to be completed.
Example:
RE Fill: 75%
Entry Position Size: 100
Active Position Size: 50
Re-Entry Order Size: 25
Final Active Position Size:75
Important: Even RE When condition is met, the active position size required to drop below RE Fill rate to trigger re-entry order.
Key Points:
'Process Orders on Close' is enabled as Take Profit and Re-Entry signals must be executed on candle close.
'Calculate on Every Tick' is enabled as entry signals are required to be executed within candle time.
'Initial Capital' has been set to 10,000 USD.
'Default Quantity Type' has been set to 'Percent of Equity'.
'Default Quantity' has been set to 10% as the best practice of investing 10% of the assets.
'Currency' has been set to USD.
'Commission Type' has been set to 'Commission Percent'
'Commission Value' has been set to 0.05% to reflect the most realistic results with a common taker fee value.

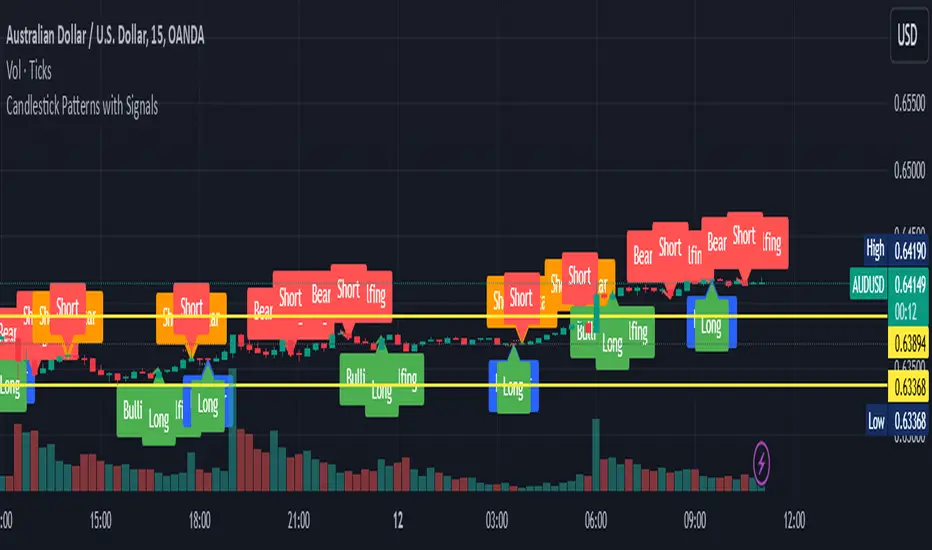
Candlestick Patterns with SignalsIdentified Patterns:
Bullish Engulfing: Indicates potential upward price movement, marked with green labels and lines.
Bearish Engulfing: Suggests potential downward price movement, marked with red labels and lines.
Hammer: A bullish reversal pattern, marked with blue labels.
Shooting Star: A bearish reversal pattern, marked with orange labels.
Signal Generation:
Long Signal: Triggered when a Bullish Engulfing or Hammer pattern is detected. A dotted green line marks the entry level.
Short Signal: Triggered when a Bearish Engulfing or Shooting Star pattern is detected. A dotted red line marks the entry level.
Visual Elements:
Labels indicating the candlestick pattern names appear at the relevant candles.
Lines connect the previous and current candles for engulfing patterns to highlight their range.
Dotted lines indicate potential entry levels for long or short trades.
Adaptive Price Zone Oscillator [QuantAlgo]Adaptive Price Zone Oscillator 🎯📊
The Adaptive Price Zone (APZ) Oscillator by QuantAlgo is an advanced technical indicator designed to identify market trends and reversals through adaptive price zones based on volatility-adjusted bands. This sophisticated system combines typical price analysis with dynamic volatility measurements to help traders and investors identify trend direction, potential reversals, and market volatility conditions. By evaluating both price action and volatility together, this tool enables users to make informed trading decisions while adapting to changing market conditions.
💫 Dynamic Zone Architecture
The APZ Oscillator provides a unique framework for assessing market trends through a blend of smoothed typical prices and volatility-based calculations. Unlike traditional oscillators that use fixed parameters, this system incorporates dynamic volatility measurements to adjust sensitivity automatically, helping users determine whether price movements are significant relative to current market conditions. By combining smoothed price trends with adaptive volatility zones, it evaluates both directional movement and market volatility, while the smoothing parameters ensure stable yet responsive signals. This adaptive approach allows users to identify trending conditions while remaining aware of volatility expansions and contractions, enhancing both trend-following and mean-reversion strategies.
📊 Indicator Components & Mechanics
The APZ Oscillator is composed of several technical components that create a dynamic trending system:
Typical Price: Utilizes HLC3 (High, Low, Close average) as a balanced price representation
Volatility Measurement: Computes exponential moving average of price changes to determine dynamic zones
Smoothed Calculations: Applies additional smoothing to reduce noise while maintaining responsiveness
Trend Detection: Evaluates price position relative to adaptive zones to determine market direction
📈 Key Indicators and Features
The APZ Oscillator utilizes typical price with customizable length and threshold parameters to adapt to different trading styles. Volatility calculations are applied to determine zone boundaries, providing context-aware levels for trend identification. The trend detection component evaluates price action relative to the adaptive zones, helping validate trends and identify potential reversals.
The indicator also incorporates multi-layered visualization with:
Color-coded trend representation (bullish/bearish)
Clear trend state indicators (+1/-1)
Mean reversion signals with distinct markers
Gradient fills for better visual clarity
Programmable alerts for trend changes
⚡️ Practical Applications and Examples
✅ Add the Indicator : Add the indicator to your TradingView chart by clicking on the star icon to add it to your favorites ⭐️
👀 Monitor Trend State : Watch the oscillator's position relative to the zero line to identify trend direction and potential reversals. The step-line visualization with diamonds makes trend changes clearly visible.
🎯 Track Signals : Pay attention to the mean reversion markers that appear above and below the price chart:
→ Upward triangles (⤻) signal potential bullish reversals
→ X crosses (↷) indicate potential bearish reversals
🔔 Set Alerts : Configure alerts for trend changes in both bullish and bearish directions, ensuring you can act on significant technical developments promptly.
🌟 Summary and Tips
The Adaptive Price Zone Oscillator by QuantAlgo is a versatile technical tool, designed to support both trend following and mean reversion strategies across different market environments. By combining smoothed typical price analysis with dynamic volatility-based zones, it helps traders and investors identify significant trend changes while measuring market volatility, providing reliable technical signals. The tool's adaptability through customizable length, threshold, and smoothing parameters makes it suitable for various trading timeframes and styles, allowing users to capture opportunities while maintaining awareness of changing market conditions.
Key parameters to optimize for your trading style:
APZ Length: Adjust for more or less sensitivity to price changes
Threshold: Fine-tune the volatility multiplier for wider or narrower zones
Smoothing: Balance noise reduction with signal responsiveness
EMA 50 + 200 Trend Signal TableEMA 50 + 200 Trend Signal Table (ETT)
This indicator provides a multi-timeframe trend signal table based on the 50-period and 200-period Exponential Moving Averages (EMAs). It visually plots the EMA 50 and EMA 200 on the chart, along with a customizable, compact table that indicates the trend direction across multiple timeframes. This tool is useful for traders looking to quickly identify market trends and momentum on various timeframes.
How It Works
- EMA Trend Analysis: The script compares the EMA 50 and EMA 200 values to determine the trend. When EMA 50 is above EMA 200, the trend is considered Bullish; if EMA 50 is below EMA 200, the trend is Bearish. If EMA 200 data is unavailable (e.g., on very short timeframes), the trend status will display as Neutral.
- Multi-Timeframe Trend Signals: The table displays the trend signals across five user-defined timeframes, updating in real time. Each timeframe row shows either Bullish, Bearish, or Neutral, with colors customizable to your preference.
Features
- EMA 50 and EMA 200 Visualization: Plots EMA 50 and EMA 200 lines directly on the chart. Users can customize the color and line thickness for each EMA to fit their charting style.
- Trend Signal Table: A table positioned on the chart (with options for positioning in the corners) shows the trend direction for the selected timeframes.
Bullish Trend: Highlighted in green (default) with 50% opacity.
Bearish Trend: Highlighted in red (default) with 50% opacity.
Neutral Trend: Highlighted in gray (default) with 50% opacity.
- Customizable Table Appearance: Allows users to select the position of the table (top-right, top-left, bottom-right, or bottom-left) and choose between compact sizes (Extra Small, Small, Normal).
- Adjustable Colors: Users can specify custom colors for each trend status (Bullish, Bearish, Neutral) as well as for the text and table border colors.
Inputs and Customizations
- Timeframes: Choose up to five different timeframes for trend analysis.
- EMA Colors and Line Widths: Customize the color and line width of EMA 50 and EMA 200 plotted on the chart.
- Table Settings: Control the position, size, and color options of the trend signal table for improved visibility and integration with your chart layout.
Use Case This indicator is ideal for traders who employ a multi-timeframe approach to confirm trends and filter entries. By monitoring the relative positions of EMA 50 and EMA 200 across various timeframes, traders can get a quick snapshot of trend strength and direction, aiding in informed trading decisions.

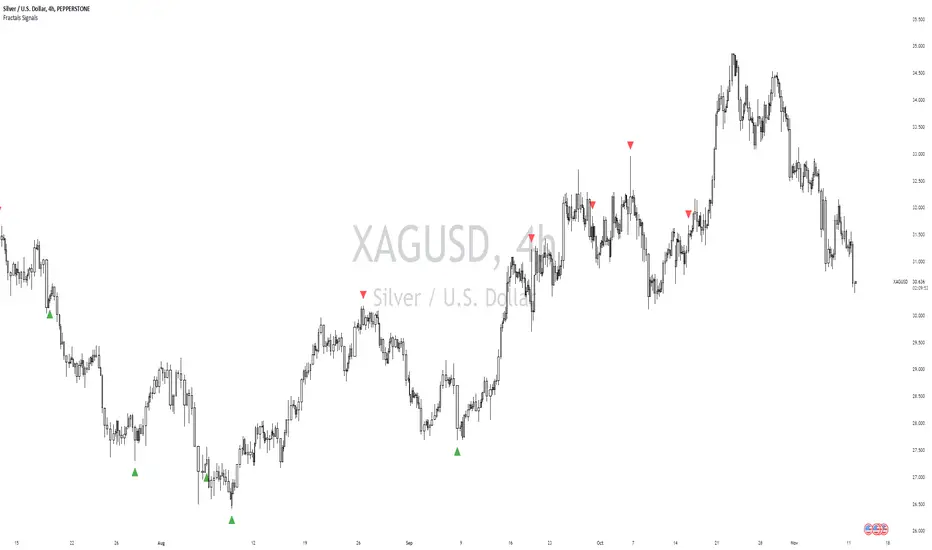
William Fractals + SignalsWilliams Fractals + Trading Signals
This indicator identifies Williams Fractals and generates trading signals based on price sweeps of these fractal levels.
Williams Fractals are specific candlestick patterns that identify potential market turning points. Each fractal requires a minimum of 5 bars (2 before, 1 center, 2 after), though this indicator allows you to customize the number of bars checked.
Up Fractal (High Point) forms when you have a center bar whose HIGH is higher than the highs of 'n' bars before and after it. For example, with n=2, you'd see a pattern where the center bar's high is higher than 2 bars before and 2 bars after it. The indicator also recognizes patterns where up to 4 bars after the center can have equal highs before requiring a lower high.
Down Fractal (Low Point) forms when you have a center bar whose LOW is lower than the lows of 'n' bars before and after it. For example, with n=2, you'd see a pattern where the center bar's low is lower than 2 bars before and 2 bars after it. The indicator also recognizes patterns where up to 4 bars after the center can have equal lows before requiring a higher low.
Trading Signals:
The indicator generates signals when price "sweeps" these fractal levels:
Buy Signal (Green Triangle) triggers when price sweeps a down fractal. This requires price to go BELOW the down fractal's low level and then CLOSE ABOVE it . This pattern often indicates a failed breakdown and potential reversal upward.
Sell Signal (Red Triangle) triggers when price sweeps an up fractal. This requires price to go ABOVE the up fractal's high level and then CLOSE BELOW it. This pattern often indicates a failed breakout and potential reversal downward.
Customizable Settings:
1. Periods (default: 10) - How many bars to check before and after the center bar (minimum value: 2)
2. Maximum Stored Fractals (default: 1) - How many fractal levels to keep in memory. Older levels are removed when this limit is reached to prevent excessive signals and maintain indicator performance.
Important Notes:
• The indicator checks the actual HIGH and LOW prices of each bar, not just closing prices
• Fractal levels are automatically removed after generating a signal to prevent repeated triggers
• Signals are only generated on bar close to avoid false triggers
• Alerts include the ticker symbol and the exact price level where the sweep occurred
Common Use Cases:
• Identifying potential reversal points
• Finding stop-hunt levels where price might reverse
• Setting stop-loss levels above up fractals or below down fractals
• Trading failed breakouts/breakdowns at fractal levels
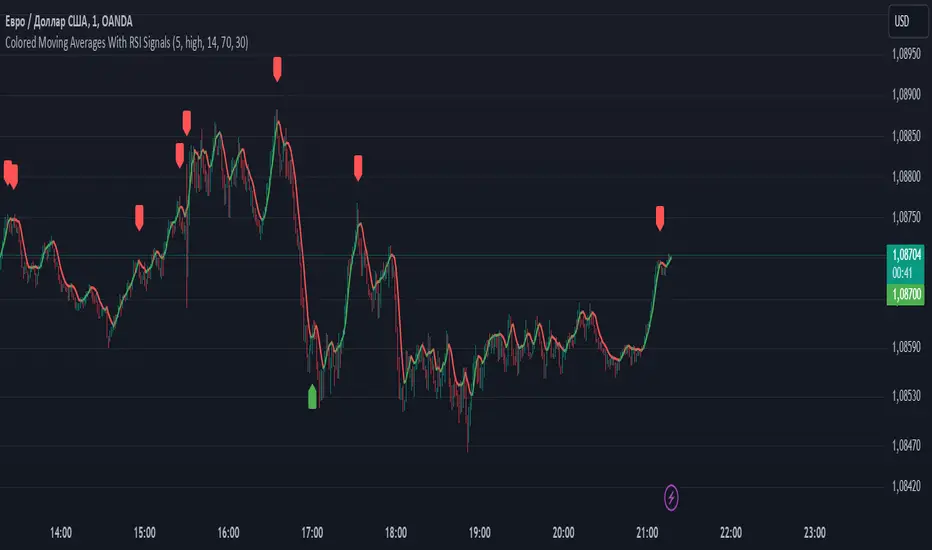
Colored Moving Averages With RSI SignalsMoving Average (MA):
Helps to determine the overall market trend. If the price is above the MA, it may indicate an uptrend, and if below, a downtrend.
In this case, a Simple Moving Average (SMA) is used, but other types can be applied as well.
Relative Strength Index (RSI):
This is an oscillator that measures the speed and changes of price movements.
Values above 70 indicate overbought conditions (possible sell signal), while values below 30 indicate oversold conditions (possible buy signal).
Purpose of This Indicator:
Trading Signals: The indicator generates "Buy" and "Sell" signals based on the intersection of the price line and the moving average, as well as RSI values. This helps traders make more informed decisions.
Signal Filtering: Using RSI in combination with MA allows for filtering false signals since it considers not only the current trend but also the state of overbought or oversold conditions.
How to Use:
For Short-Term Trading: Traders can use buy and sell signals to enter trades based on short-term market fluctuations.
In Combination with Other Indicators: It can be combined with other indicators for a more comprehensive analysis (e.g., adding support and resistance levels).
Overall, this indicator helps traders respond more quickly and accurately to changes in market conditions, enhancing the chances of successful trades.
Harmony Signal Flow By ArunThis Pine Script strategy, titled "Harmony Signal Flow By Arun," uses the Relative Strength Index (RSI) indicator to generate buy and sell signals based on custom thresholds. The script incorporates stop-loss and target management and restricts new trades until the previous position closes. Here's a detailed description:
Custom RSI Metric:
The strategy calculates a 5-period RSI based on the closing price, aiming for a more responsive measure of price momentum.
RSI thresholds are defined:
Lower threshold (30): Indicates oversold conditions, triggering a potential buy.
Upper threshold (70): Indicates overbought conditions, prompting a possible sell.
Entry Conditions:
Buy Signal: The strategy initiates a buy order when the RSI crosses above the lower threshold (30), indicating a shift from oversold conditions.
Sell Signal: A sell order is triggered when the RSI crosses below the upper threshold (70), suggesting an overbought reversal.
Only one order (buy or sell) can be active at a time, ensuring that a new trade begins only when there’s no existing position.
Stop-Loss and Target Management:
For each trade, stop-loss and target conditions are applied to manage risk and secure profits.
For Buy Positions:
Stop-loss is set 100 points below the entry price.
Target is set 150 points above the entry price.
For Sell Positions:
Stop-loss is set 100 points above the entry price.
Target is 150 points below the entry price.
The strategy closes the trade when either the stop-loss or target is met, marking the trade as "closed" and allowing a new trade entry.
Trade Sequencing:
A new trade (buy or sell) is only permitted after the previous position hits either its stop-loss or target, preventing overlapping trades and ensuring clear trade sequences.
This sequential approach enhances risk management by ensuring only one active position at any time.
End-of-Day Closure:
All open positions are closed automatically at 3:25 PM (Indian market time) to avoid overnight exposure, ensuring the strategy remains strictly intraday.
The flag for trade entry is reset at the end of each day, enabling fresh trades the next day.
Chart Indicators:
The script plots buy and sell signals directly on the chart with visible labels.
It also displays the custom RSI metric with horizontal lines for the lower and upper thresholds, providing visual cues for entry and exit points.
Summary
This strategy is a momentum-based intraday trading approach that uses the RSI for identifying potential reversals and manages trades through predefined stop-loss and target levels. By enforcing trade sequencing and closing positions at the end of the trading day, it prioritizes risk management and seeks to capitalize on short-term trends while avoiding overnight market risks.

RCYC Bullish Bearish Indicator
Summary: The RCYC Bullish Bearish Indicator is a custom trading tool designed to help traders identify potential bullish and bearish conditions in the market using a combination of KDJ and RSI indicators. This indicator uses color-coded candles to visually represent bullish and bearish signals, making it easy to identify trend changes on the chart. The script is particularly useful for traders who prefer visual signals and want to incorporate both trend momentum (KDJ) and relative strength (RSI) in their analysis.
Description:
The RCYC Bullish Bearish Indicator is a unique mashup of the KDJ and RSI indicators, optimized to provide a clear visual representation of market conditions through color-coded candles. This indicator not only identifies the potential trend shifts but also provides alerts for significant crossover points, enhancing a trader's ability to make informed decisions.
How It Works:
KDJ Calculation:
The KDJ is a variation of the Stochastic Oscillator that includes the %J line, which can go beyond the typical 0-100 range of %K and %D.
The KDJ component of this indicator calculates the highest high and lowest low over a specified period (KDJ Length), using these values to derive the %K line.
The %D line is a smoothed version of %K, and the %J line is derived from %K and %D using the formula: J = 3 * %K - 2 * %D.
This indicator focuses on the behavior of the %J line in relation to a mid-point level (50), identifying crossovers and crossunders that signal potential shifts in market sentiment.
RSI Calculation:
The Relative Strength Index (RSI) is a momentum oscillator that measures the speed and change of price movements. It is widely used to identify overbought or oversold conditions.
In this indicator, RSI values are adjusted and plotted to align visually with the KDJ values, providing a complementary momentum analysis.
Crossover Logic and Candle Coloring:
The indicator tracks two main events:
CrossOver50: When the %J line crosses above the 50 level, indicating potential bullish momentum.
CrossUnder50: When the %J line crosses below the 50 level, indicating potential bearish momentum.
Depending on the crossover events, the script changes the color of the candles on the chart:
Red candles on the initial crossover above 50, followed by dark blue candles to maintain bullish sentiment.
Yellow candles on the initial crossover below 50, followed by light blue candles to maintain bearish sentiment.
Alerts:
The indicator includes alert conditions for both bullish and bearish signals:
Red Candle Alert: Notifies the trader when the %J line crosses above 50.
Yellow Candle Alert: Notifies the trader when the %J line crosses below 50.
These alerts allow traders to react promptly to key market signals without continuously monitoring the chart.
Usage and Benefits:
This indicator is designed for traders looking to combine momentum and trend analysis into a single visual tool. It is particularly useful for those trading in trending markets or looking for entry/exit signals based on momentum shifts.
The color-coded candles provide an intuitive way to assess market conditions at a glance, reducing the complexity associated with analyzing multiple indicators separately.
By integrating both KDJ and RSI, the RCYC Bullish Bearish Indicator offers a balanced approach to trend detection and momentum confirmation, making it versatile for various trading styles, including scalping, swing trading, and position trading.
Originality and Usefulness:
While the indicator builds upon the familiar concepts of KDJ and RSI, it uniquely merges them into a cohesive visual tool with distinct crossover-based alerts and candle coloring.
This approach makes the indicator original, as it simplifies the interpretation of complex signals into straightforward visual cues, enhancing the decision-making process for traders who prefer chart-based analysis.

Unicorn ICT Signals [TradingFinder] Breaker Block + FVG Zones🔵 Introduction
The "ICT Unicorn Model" trading strategy in the "Inner Circle Trader" (ICT) style is one of the well-known strategies in the world of Forex and financial market trading.
The ICT methodology was developed by Michael Huddleston and is based on technical analysis and Price Action concepts.
This style focuses specifically on interpreting price movements and identifying optimal entry and exit points in the market.
In the Unicorn strategy, traders seek points where the probability of price reversal or trend continuation is high. This strategy is primarily based on recognizing and analyzing Price Action patterns and market structure.
By understanding"ICT Unicorn Model", traders can make more informed decisions about where to enter or exit trades, thereby increasing their chances of success in the market.
🟣 Understanding the Breaker Block
A Breaker Block is a specialized form of an Order Block that changes its role after a key market level is broken. Typically, an Order Block is an area on the chart where large institutional orders are likely to be placed, providing strong support or resistance.
However, when this area is breached, and the price moves in the opposite direction, it transforms into what is known as a Breaker Block. This shift indicates a reversal in market sentiment, turning the previous support into resistance or vice versa, thereby signaling a potential trend change to traders.
🟣 The Significance of the Fair Value Gap (FVG)
The Fair Value Gap (FVG) refers to an area on a price chart where the price rapidly moves through a level, leaving behind a gap. This gap represents an imbalance between supply and demand and is often seen as a potential area for price to return and fill the gap.
These zones are crucial for traders as they can indicate future price movements, providing opportunities to enter or exit trades.
🟣 Defining the ICT Unicorn Model
When an FVG overlaps with a Breaker Block, it forms a highly significant trading area known as a Unicorn. This overlap creates an ideal zone for traders to enter the market, as it combines two powerful technical signals.
The Unicorn Model is therefore considered an optimal strategy for identifying precise entry and exit points in the financial markets.
Demand ICT Unicorn Model :
Supply ICT Unicorn Model :
🔵 How to Use
🟣 Bullish ICT Unicorn
The Bullish ICT Unicorn model is applicable when the market is in an uptrend, and traders are seeking buying opportunities.
Follow these steps to identify Bullish ICT Unicorn :
Identify the Bullish Breaker Block : Locate an area where the price moved upward after breaking an Order Block. This area now acts as a Breaker Block.
Identify the Bullish FVG : Look for a Fair Value Gap near the Breaker Block.
Confirm the Unicorn : When the Bullish Breaker Block and Bullish FVG overlap, a Bullish Unicorn is confirmed. Traders can enter a buy position when the price returns to this zone.
🟣Bearish ICT Unicorn
The Bearish ICT Unicorn model is used when the market is in a downtrend, and traders are looking for selling opportunities.
To identify Bearish ICT Unicorn, follow these steps :
Identify the Bearish Breaker Block : Find an area where the price moved downward after breaking an Order Block. This area now acts as a Breaker Block.
Identify the Bearish FVG : Check if a Fair Value Gap has formed near the Breaker Block.
Confirm the Unicorn : When the Bearish Breaker Block and Bearish FVG overlap, a Bearish Unicorn is confirmed. Traders can enter a sell position when the price returns to this zone.
🔵 Setting
🟣 Global Setting
Pivot Period of Order Blocks Detector : Enter the desired pivot period to identify the Order Block.
Order Block Validity Period (Bar) : You can specify the maximum time the Order Block remains valid based on the number of candles from the origin.
Mitigation Level Breaker Block : Determining the basic level of a Breaker Block. When the price hits the basic level, the Breaker Block due to mitigation.
Mitigation Level FVG : Determining the basic level of a FVG. When the price hits the basic level, the FVG due to mitigation.
Mitigation Level Unicorn : Determining the basic level of a Unicorn Block. When the price hits the basic level, the Unicorn Block due to mitigation.
🟣 Unicorn Block Display
Show All Unicorn Block : If it is turned off, only the last Order Block will be displayed.
Demand Unicorn Block : Show or not show and specify color.
Supply Unicorn Block : Show or not show and specify color.
🟣 Breaker Block Display
Show All Breaker Block : If it is turned off, only the last Breaker Block will be displayed.
Demand Main Breaker Block : Show or not show and specify color.
Demand Sub (Propulsion & BoS Origin) Breaker Block : Show or not show and specify color.
Supply Main Breaker Block : Show or not show and specify color.
Supply Sub (Propulsion & BoS Origin) Breaker Block : Show or not show and specify color.
🟣 Fair Value Gap Display
Show Bullish FVG : Toggles the display of demand-related boxes.
Show Bearish FVG : Toggles the display of supply-related boxes.
🟣 Logic Settings
🟣 Order Block Refinement
Refine Order Blocks : Enable or disable the refinement feature. Mode selection.
🟣 FVG Filter
FVG Filter : This refines the number of identified FVG areas based on a specified algorithm to focus on higher quality signals and reduce noise.
Types of FVG filters :
Very Aggressive Filter: Adds a condition where, for an upward FVG, the last candle's highest price must exceed the middle candle's highest price, and for a downward FVG, the last candle's lowest price must be lower than the middle candle's lowest price. This minimally filters out FVGs.
Aggressive Filter: Builds on the Very Aggressive mode by ensuring the middle candle is not too small, filtering out more FVGs.
Defensive Filter: Adds criteria regarding the size and structure of the middle candle, requiring it to have a substantial body and specific polarity conditions, filtering out a significant number of FVGs.
Very Defensive Filter: Further refines filtering by ensuring the first and third candles are not small-bodied doji candles, retaining only the highest quality signals.
🟣 Alert
Alert Name : The name of the alert you receive.
Alert ICT Unicorn Model Block Mitigation :
On / Off
Message Frequency :
This string parameter defines the announcement frequency. Choices include: "All" (activates the alert every time the function is called), "Once Per Bar" (activates the alert only on the first call within the bar), and "Once Per Bar Close" (the alert is activated only by a call at the last script execution of the real-time bar upon closing). The default setting is "Once per Bar".
Show Alert Time by Time Zone :
The date, hour, and minute you receive in alert messages can be based on any time zone you choose. For example, if you want New York time, you should enter "UTC-4". This input is set to the time zone "UTC" by default.
🔵Conclusion
The Unicorn Model in ICT, utilizing the concepts of Breaker Blocks and Fair Value Gaps, provides an effective tool for identifying entry and exit points in financial markets. By offering more precise signals, this model helps traders make better decisions and minimize trading risks.
Success in applying this model requires practice and a deep understanding of market structure, but it can significantly improve trading performance.

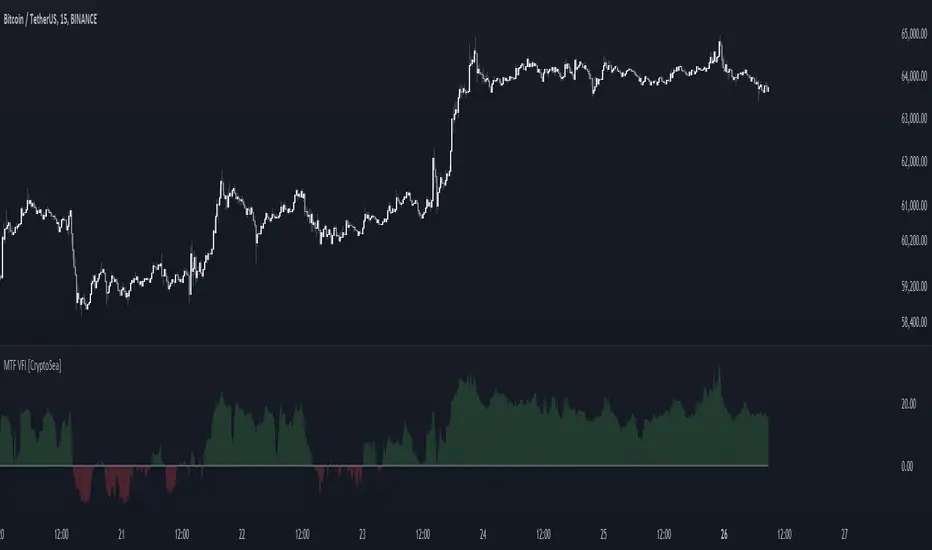
MTF Volume Flow IndicatorThe MTF Volume Flow Indicator (MTF VFI) is an advanced and versatile tool that enhances market analysis by tracking the flow of volume across multiple timeframes. By integrating volume flow with multi-timeframe analysis, this indicator provides traders with a comprehensive understanding of market trends, momentum, and potential reversals.
Key Features
Multi-Timeframe Volume Flow Analysis: The MTF VFI computes the Volume Flow Indicator across various timeframes, ranging from 1 minute to 1 month. This multi-timeframe analysis enables traders to observe and compare volume flow dynamics across different time horizons, offering deeper insights into market behavior.
Customizable VFI Settings: The indicator includes configurable VFI parameters such as length, coefficient, and volume cutoff, allowing users to tailor the analysis to different market conditions and trading strategies. This flexibility ensures that the indicator remains relevant across diverse market environments.
Signal Line and Delta Calculations: The script features a signal line derived from the VFI and calculates the delta values (the difference between VFI and the signal line). These delta values are essential for identifying potential buy or sell signals and are presented as histograms for easy visual interpretation.
Cumulative Delta with Dynamic Bands: The indicator introduces cumulative delta, a powerful tool that combines average and median VFI values to provide a clearer picture of market sentiment. Two standard deviation bands are plotted around the cumulative delta, offering a range within which price movements are likely to remain. These bands are smoothed using a 21-period EMA, providing a more refined view of market volatility.
Multi-Timeframe and Analysis Tables: The MTF VFI includes optional tables that display VFI, signal line, and delta values across all selected timeframes. Additionally, an analysis table presents key statistical metrics such as the highest, lowest, average, standard deviation, range, and median VFI values. These tables provide a concise summary of market conditions, aiding in strategic decision-making.
Dynamic Display Options: The indicator offers extensive customization options, allowing traders to display or hide elements such as delta histograms, delta bands, and tables. This ensures that users can focus on the most relevant information for their trading strategy.
Neutral Candle Coloring Option: Traders can enable neutral candle colors, where bearish candles are gray and bullish candles are white. This feature helps to reduce noise and maintain focus on the overall trend and volume flow analysis.
How It Works
Volume Flow Indicator Calculation: The VFI is calculated using a combination of typical price, volume, and the standard deviation of price changes. The indicator smooths the VFI based on user preferences, allowing traders to adjust the sensitivity of the analysis to better match their trading style.
Multi-Timeframe Integration: The script pulls VFI calculations from multiple timeframes, providing a holistic view of market trends. By analyzing VFI across different timeframes, traders can detect alignments or divergences in volume flow that might indicate trend strength or weakness.
Cumulative Delta and Dynamic Bands: The cumulative delta is computed by combining the average and median VFI values. Dynamic two-standard-deviation bands are plotted around this cumulative delta, providing upper and lower bounds for expected price movements. These bands are further smoothed with a 21-period EMA, enhancing their effectiveness in volatile markets.
Delta Analysis and Histogram Display: The difference between the VFI and its signal line (delta) is calculated and displayed as histograms. This visual representation helps traders quickly assess momentum and identify potential reversals or trend continuations. The cumulative delta is color-coded dynamically based on its direction, adding an extra layer of visual clarity.
Alerts
VFI Crossover Alerts: The indicator includes customizable alerts that notify traders when the VFI crosses above or below its signal line. These alerts are crucial for catching potential trend reversals or continuation signals, even when the trader is not actively monitoring the chart.
Customizable Alert Conditions: Traders can tailor alert conditions to their preferred timeframes and VFI settings, ensuring that the notifications they receive are relevant and timely for their specific trading strategies.
Application
Trend Identification and Confirmation: The MTF VFI aids in identifying and confirming trends by analyzing volume flow across multiple timeframes. This capability is particularly useful for detecting trends that may not be visible on a single timeframe.
Momentum and Divergence Analysis: By comparing VFI and delta values across timeframes, and analyzing cumulative delta with dynamic bands, traders can gain insights into market momentum and potential divergences, which are often precursors to reversals.
Strategic Decision-Making: With its comprehensive multi-timeframe analysis, cumulative delta, and statistical summaries, the MTF VFI equips traders with the information needed to make informed trading decisions, whether for short-term trades or long-term investments.
Visual Clarity and Customization: The indicator’s dynamic display options and neutral candle coloring help traders maintain a clear and focused view of the market, customizing the visualization to match their specific needs.
The MTF Volume Flow Indicator (MTF VFI) by CryptoSea is an essential tool for traders who seek to gain a deeper understanding of market trends and volume dynamics across multiple timeframes. Its advanced features and customization options make it a valuable addition to any trader’s toolkit.
Machine Learning Signal FilterIntroducing the "Machine Learning Signal Filter," an innovative trading indicator designed to leverage the power of machine learning to enhance trading strategies. This tool combines advanced data processing capabilities with user-friendly customization options, offering traders a sophisticated yet accessible means to optimize their market analysis and decision-making processes. Importantly, this indicator does not repaint, ensuring that signals remain consistent and reliable after they are generated.
Machine Learning Integration
The "Machine Learning Signal Filter" employs machine learning algorithms to analyze historical price data and identify patterns that may not be immediately apparent through traditional technical analysis. By utilizing techniques such as regression analysis and neural networks, the indicator continuously learns from new data, refining its predictive capabilities over time. This dynamic adaptability allows the indicator to adjust to changing market conditions, potentially improving the accuracy of trading signals.
Key Features and Benefits
Dynamic Signal Generation: The indicator uses machine learning to generate buy and sell signals based on complex data patterns. This approach enables it to adapt to evolving market trends, offering traders timely and relevant insights. Crucially, the indicator does not repaint, providing reliable signals that traders can trust.
Customizable Parameters: Users can fine-tune the indicator to suit their specific trading styles by adjusting settings such as the temporal synchronization and neural pulse rate. This flexibility ensures that the indicator can be tailored to different market environments.
Visual Clarity and Usability: The indicator provides clear visual cues on the chart, including color-coded signals and optional display of signal curves. Users can also customize the table's position and text size, enhancing readability and ease of use.
Comprehensive Performance Metrics: The indicator includes a detailed metrics table that displays key performance indicators such as return rates, trade counts, and win/loss ratios. This feature helps traders assess the effectiveness of their strategies and make data-driven decisions.
How It Works
The core of the "Machine Learning Signal Filter" is its ability to process and learn from large datasets. By applying machine learning models, the indicator identifies potential trading opportunities based on historical data patterns. It uses regression techniques to predict future price movements and neural networks to enhance pattern recognition. As new data is introduced, the indicator refines its algorithms, improving its accuracy and reliability over time.
Use Cases
Trend Following: Ideal for traders seeking to capitalize on market trends, the indicator helps identify the direction and strength of price movements.
Scalping: With its ability to provide quick signals, the indicator is suitable for scalpers aiming for rapid profits in volatile markets.
Risk Management: By offering insights into trade performance, the indicator aids in managing risk and optimizing trade setups.
In summary, the "Machine Learning Signal Filter" is a powerful tool that combines the analytical strength of machine learning with the practical needs of traders. Its ability to adapt and provide actionable insights makes it an invaluable asset for navigating the complexities of financial markets.
The "Machine Learning Signal Filter" is a tool designed to assist traders by providing insights based on historical data and machine learning techniques. It does not guarantee profitable trades and should be used as part of a comprehensive trading strategy. Users are encouraged to conduct their own research and consider their financial situation before making trading decisions. Trading involves significant risk, and it is possible to lose more than the initial investment. Always trade responsibly and be aware of the risks involved.

Fear/Greed Zone Reversals [UAlgo]The "Fear/Greed Zone Reversals " indicator is a custom technical analysis tool designed for TradingView, aimed at identifying potential reversal points in the market based on sentiment zones characterized by fear and greed. This indicator utilizes a combination of moving averages, standard deviations, and price action to detect when the market transitions from extreme fear to greed or vice versa. By identifying these critical turning points, traders can gain insights into potential buy or sell opportunities.
🔶 Key Features
Customizable Moving Averages: The indicator allows users to select from various types of moving averages (SMA, EMA, WMA, VWMA, HMA) for both fear and greed zone calculations, enabling flexible adaptation to different trading strategies.
Fear Zone Settings:
Fear Source: Select the price data point (e.g., close, high, low) used for Fear Zone calculations.
Fear Period: This defines the lookback window for calculating the Fear Zone deviation.
Fear Stdev Period: This sets the period used to calculate the standard deviation of the Fear Zone deviation.
Greed Zone Settings:
Greed Source: Select the price data point (e.g., close, high, low) used for Greed Zone calculations.
Greed Period: This defines the lookback window for calculating the Greed Zone deviation.
Greed Stdev Period: This sets the period used to calculate the standard deviation of the Greed Zone deviation.
Alert Conditions: Integrated alert conditions notify traders in real-time when a reversal in the fear or greed zone is detected, allowing for timely decision-making.
🔶 Interpreting Indicator
Greed Zone: A Greed Zone is highlighted when the price deviates significantly above the chosen moving average. This suggests market sentiment might be leaning towards greed, potentially indicating a selling opportunity.
Fear Zone Reversal: A Fear Zone is highlighted when the price deviates significantly below the chosen moving average of the selected price source. This suggests market sentiment might be leaning towards fear, potentially indicating a buying opportunity. When the indicator identifies a reversal from a fear zone, it suggests that the market is transitioning from a period of intense selling pressure to a more neutral or potentially bullish state. This is typically indicated by an upward arrow (▲) on the chart, signaling a potential buy opportunity. The fear zone is characterized by high price volatility and overselling, making it a crucial point for traders to consider entering the market.
Greed Zone Reversal: Conversely, a Greed Zone is highlighted when the price deviates significantly above the chosen moving average. This suggests market sentiment might be leaning towards greed, potentially indicating a selling opportunity. When the indicator detects a reversal from a greed zone, it indicates that the market may be moving from an overbought condition back to a more neutral or bearish state. This is marked by a downward arrow (▼) on the chart, suggesting a potential sell opportunity. The greed zone is often associated with overconfidence and high buying activity, which can precede a market correction.
🔶 Why offer multiple moving average types?
By providing various moving average types (SMA, EMA, WMA, VWMA, HMA) , the indicator offers greater flexibility for traders to tailor the indicator to their specific trading strategies and market preferences. Different moving averages react differently to price data and can produce varying signals.
SMA (Simple Moving Average): Provides an equal weighting to all data points within the specified period.
EMA (Exponential Moving Average): Gives more weight to recent data points, making it more responsive to price changes.
WMA (Weighted Moving Average): Allows for custom weighting of data points, providing more flexibility in the calculation.
VWMA (Volume Weighted Moving Average): Considers both price and volume data, giving more weight to periods with higher trading volume.
HMA (Hull Moving Average): A combination of weighted moving averages designed to reduce lag and provide a smoother curve.
Offering multiple options allows traders to:
Experiment: Traders can try different moving averages to see which one produces the most accurate signals for their specific market.
Adapt to different market conditions: Different market conditions may require different moving average types. For example, a fast-moving market might benefit from a faster moving average like an EMA, while a slower-moving market might be better suited to a slower moving average like an SMA.
Personalize: Traders can choose the moving average that best aligns with their personal trading style and risk tolerance.
In essence, providing a variety of moving average types empowers traders to create a more personalized and effective trading experience.
🔶 Disclaimer
Use with Caution: This indicator is provided for educational and informational purposes only and should not be considered as financial advice. Users should exercise caution and perform their own analysis before making trading decisions based on the indicator's signals.
Not Financial Advice: The information provided by this indicator does not constitute financial advice, and the creator (UAlgo) shall not be held responsible for any trading losses incurred as a result of using this indicator.
Backtesting Recommended: Traders are encouraged to backtest the indicator thoroughly on historical data before using it in live trading to assess its performance and suitability for their trading strategies.
Risk Management: Trading involves inherent risks, and users should implement proper risk management strategies, including but not limited to stop-loss orders and position sizing, to mitigate potential losses.
No Guarantees: The accuracy and reliability of the indicator's signals cannot be guaranteed, as they are based on historical price data and past performance may not be indicative of future results.

Smoothed Heiken Ashi Candles with Delayed SignalsThis is a trend-following approach that uses a modified version of Heiken Ashi candles with additional smoothing. Here are the key components and features:
1. Heiken Ashi Modification: The strategy starts by calculating Heiken Ashi candles, which are known for better trend visualization. However, it modifies the traditional Heiken Ashi by using Exponential Moving Averages (EMAs) of the open, high, low, and close prices.
2. Double Smoothing: The strategy applies two layers of smoothing. First, it uses EMAs to calculate the Heiken Ashi values. Then, it applies another EMA to the Heiken Ashi open and close prices. This double smoothing aims to reduce noise and provide clearer trend signals.
3. Long-Only Approach: As the name suggests, this strategy only takes long positions. It doesn't short the market during downtrends but instead exits existing long positions when the sell signal is triggered.
4. Entry and Exit Conditions:
- Entry (Buy): When the smoothed Heiken Ashi candle color changes from red to green (indicating a potential start of an uptrend).
- Exit (Sell): When the smoothed Heiken Ashi candle color changes from green to red (indicating a potential end of an uptrend).
5. Position Sizing: The strategy uses a percentage of equity for position sizing, defaulting to 100% of available equity per trade. This should be tailored to each persons unique approach. Responsible trading would use less than 5% for each trade. The starting capital used is a responsible and conservative $1000, reflecting the average trader.
This strategy aims to provide a smooth, trend-following approach that may be particularly useful in markets with clear, sustained trends. However, it may lag in choppy or ranging markets due to its heavy smoothing. As with any strategy, it's important to thoroughly back test and forward test before using it with real capital, and to consider using it in conjunction with other analysis tools and risk management techniques.
Other smoothed Heiken Ashi indicators do not provide buy and sell signals, and only show the change in color to dictate a change in trend. By adding buy and sell signals after the close of the changing candle, alerts can be programmed, which helps this be a more hands off protocol to experiment with. Other smoothed Heiken Ashi indicators do not allow for alarms to be set.
This is a unique HODL strategy which helps identify a change in trend, without the noise of day to day volatility. By switching to a line chart, it removes the candles altogether to avoid even more noise. The goal is to HODL a coin while the color is bullish in an uptrend, but once the indicator gives a sell signal, to sell the holdings back to a stable coin and let the chart ride down. Once the chart gives the next buy signal, use that same capital to buy back into the asset. In essence this removes potential losses, and helps buy back in cheaper, gaining more quantitity fo the asset, and therefore reducing your average initial buy in price.
Most HODL strategies ride the price up, miss selling at the top, then riding the price back down in anticipation that it will go back up to sell. This strategy will not hit the absolute tops, but it will greatly reduce potential losses.

Master Accumulation Weekly Buy SignalsMaster Accumulation Weekly Buy Signals
The Master Accumulation Weekly Buy Signals indicator is designed to help traders identify potential buy opportunities based on the accumulation and distribution of volume, with a primary focus on weekly timeframes. This indicator combines the On Balance Volume (OBV) and the Accumulation/Distribution (AD) indicators to generate buy signals when both metrics show a decline.
Key Features:
Percentage Change Calculation: Calculates the percentage change in OBV and AD over a specified length tailored to weekly timeframes.
Timeframe Adaptability: While optimized for weekly timeframes, the indicator can also adjust to daily and monthly charts.
Volume Validation: Ensures that volume data is available and valid for accurate calculations.
Buy Signals: Generates buy signals when both OBV and AD percentage changes are negative, indicating potential accumulation by informed traders.
Visual Alerts: Plots buy signal triangles below the price bars on the main chart for easy identification.
How It Works:
On Balance Volume (OBV): Tracks the cumulative volume, considering the direction of price changes, and calculates the percentage change over the specified period, primarily for weekly analysis.
Accumulation/Distribution (AD): Measures the flow of volume into or out of a security, considering the relationship between the closing price and the high-low range, and calculates the percentage change over the specified period, primarily for weekly analysis.
Buy Signal Generation: A buy signal is generated when both OBV and AD show a negative percentage change, suggesting a potential buying opportunity.
How to Use:
Apply the indicator to your chart and select the weekly timeframe for optimal performance.
Look for buy signal triangles that appear below the price bars on the main chart.
Use the buy signals as part of your broader trading strategy, confirming them with other technical analysis tools and indicators.
Important Note:
This indicator is a tool to assist in identifying potential buy signals based on volume accumulation patterns. It is primarily designed for weekly timeframes and should not be used as a standalone trading strategy. Always perform comprehensive analysis and consider risk management practices before making any trading decisions.
This description highlights the indicator's primary focus on weekly timeframes while providing comprehensive information about its features and usage.
THIS IS TEST ONLY*******
