ICT Liquidity Sweep MAX RETRI (ALERT)Strategy Description: SMC + ICT Reversal Sniper | 5-Min | R2 TP
This strategy applies Smart Money Concepts (SMC) and ICT methodology to identify high-probability reversal trades using a clean, rule-based system designed for the 5-minute timeframe.
⸻
Core Logic:
• Liquidity Sweep: Identifies stop hunts beyond recent swing highs/lows using a configurable lookback window.
• Break of Structure (BOS): Validates a directional shift after the sweep.
• Fixed R2 Risk-Reward: Entry is followed by a 2:1 take-profit target. Stop loss is set at the sweep candle’s high/low.
• No Entry Between 8 PM–12 AM NY Time: Avoids the manipulation-prone and illiquid zone.
• Discreet SL Handling: SL hits close trades silently — no labels or visuals.
⸻
Entry Precision & Timing Notes:
• The strategy may occasionally fire before a confirmed liquidity sweep — this is expected. If a sweep occurs later, you may still re-enter toward equilibrium, with take profit also targeted at equilibrium.
• Alerts or trades that trigger near 9:30 AM NY often align with real direction, but this time can be volatile.
• For more reliable and lower-risk entries, focus on the 1:30 PM to 2:00 PM silver bullet window, which tends to produce cleaner setups with more favorable flow. 🖤
在脚本中搜索"smc"

Math by Thomas Order Blocks🔥 Description:
🚀 Math by Thomas Order Blocks is a precision tool for Smart Money Concept (SMC) and price action traders, designed to automatically detect Bullish and Bearish Order Blocks (OBs). It highlights key institutional trading zones where large orders are placed, helping you identify potential reversal and continuation areas.
⚙️ Key Features:
✅ Automatic Order Block Detection:
Detects Bearish OBs when price sharply reverses after a significant bullish move.
Identifies Bullish OBs following a sharp reversal from a bearish push.
✅ Dynamic Sensitivity & Volume Filter:
Sensitivity Control: Customize OB detection precision.
Minimum Volume Filter: Ensures OBs form only on significant volume spikes.
✅ Flexible OB Mitigation:
Choose between "Close" or "Wick" mitigation for OB invalidation.
Mitigated OBs are automatically removed from the chart.
✅ Adaptive Swing & Price Change Detection:
Adjusts OB detection logic based on timeframe for flexibility.
Uses adaptive rate of change (ROC) calculations to spot momentum shifts.
✅ Visual Customization:
OBs are displayed as shaded boxes with configurable background and border colors.
Bullish OBs = Green (support zones).
Bearish OBs = Red (resistance zones).
✅ Alerts for OB Touch:
Get real-time alerts when price touches a Bullish or Bearish OB.
Helps you catch potential reversal points without constant chart monitoring.
📊 How It Works:
Bullish OB Logic:
Detected when price crosses over a positive momentum threshold (ROC) with high volume.
Plots a green OB box from the low of the swing candle.
Bearish OB Logic:
Identified when price crosses under a negative momentum threshold with high volume.
Plots a red OB box from the high of the swing candle.
Mitigation Rules:
OBs are removed once invalidated by price action based on your chosen mitigation type (Close or Wick).
📈 Usage Tips:
Use Bullish OBs as potential support areas for buy entries.
Treat Bearish OBs as resistance zones for sell setups.
Combine with Fair Value Gaps, volume profile, and RSI for confluence.
Adjust sensitivity and volume filters to fine-tune OB detection.
✅ Chart Example:
The script displays:
Bullish OBs in green, marking potential support zones.
Bearish OBs in red, indicating resistance zones.
Real-time alerts when price touches OBs.
🔥 Why Use This Indicator?
Designed for intraday and swing traders aiming to identify institutional trading zones.
Helps you spot reversal and continuation setups with precision.
Ideal for Smart Money Concept (SMC), price action, and order flow traders.

ICT FVG & Swing Detector Basic by Trader RiazICT FVG & Swing Detector Basic by Trader Riaz
Unlock Precision Trading with the Ultimate Fair Value Gap (FVG) and Swing Detection Tool!
Developed by Trader Riaz , the ICT FVG and Swing Detector Basic is a powerful Pine Script indicator designed to help traders identify key market structures with ease. Whether you're a day trader, swing trader, or scalper, this indicator provides actionable insights by detecting Bullish and Bearish Fair Value Gaps (FVGs) and Swing Highs/Lows on any timeframe. Perfect for trading forex, stocks, crypto, and more on TradingView!
Key Features:
1: Bullish and Bearish FVG Detection
- Automatically identifies Bullish FVGs (highlighted in green) and Bearish FVGs (highlighted in red) to spot potential reversal or continuation zones.
- Displays FVGs as shaded boxes with a dashed midline at 70% opacity, making it easy to see the midpoint of the gap for precise entries and exits.
- Labels are placed inside the FVG boxes at the extreme right for clear visibility.
2: Customizable FVG Display
- Control the number of Bullish and Bearish FVGs displayed on the chart with user-defined inputs (fvg_bull_count and fvg_bear_count).
- Toggle the visibility of Bullish and Bearish FVGs with simple checkboxes (show_bull_fvg and show_bear_fvg) to declutter your chart.
3: Swing High and Swing Low Detection
- Detects Swing Highs (blue lines) and Swing Lows (red lines) to identify key market turning points.
- Labels are positioned at the extreme right edge of the lines for better readability and alignment.
- Customize the number of Swing Highs and Lows displayed (swing_high_count and swing_low_count) to focus on the most recent market structures.
4: Fully Customizable Display
- Toggle visibility for Swing Highs and Lows (show_swing_high and show_swing_low) to suit your trading style.
- Adjust the colors of Swing High and Low lines (swing_high_color and swing_low_color) to match your chart preferences.
5: Clean and Efficient Design
- Built with Pine Script v6 for optimal performance on TradingView.
- Automatically removes older FVGs and Swing points when the user-defined count is exceeded, keeping your chart clean and focused.
- Labels are strategically placed to avoid clutter while providing clear information.
Why Use This Indicator?
Precision Trading: Identify high-probability setups with FVGs and Swing points, commonly used in Smart Money Concepts (SMC) and Institutional Trading strategies.
User-Friendly: Easy-to-use inputs allow traders of all levels to customize the indicator to their needs.
Versatile: Works on any market (Forex, Stocks, Crypto, Commodities) and timeframe (1M, 5M, 1H, 4H, Daily, etc.).
Developed by Trader Riaz: Backed by the expertise of Trader Riaz, a seasoned trader dedicated to creating tools that empower the TradingView community.
How to Use:
- Add the Custom FVG and Swing Detector to your chart on TradingView.
- Adjust the input settings to control the number of FVGs and Swing points displayed.
- Toggle visibility for Bullish/Bearish FVGs and Swing Highs/Lows as needed.
- Use the identified FVGs and Swing points to plan your trades, set stop-losses, and target key levels.
Ideal For:
- Traders using Smart Money Concepts (SMC), Price Action, or Market Structure strategies.
- Those looking to identify liquidity grabs, imbalances, and trend reversals.
- Beginners and advanced traders seeking a reliable tool to enhance their technical analysis.
Happy trading!

Supply & Demand Zones + Order Block (Pro Fusion) SuroLevel up your trading edge with this all-in-one Supply and Demand Zones + Order Block TradingView indicator, built for precision traders who focus on price action and smart money concepts.
🔍 Key Features:
Automatic detection of Supply & Demand Zones based on refined swing highs and lows
Dynamic Order Block recognition with customizable thresholds
Highlights Breakout signals with volume confirmation and trend filters
Built-in EMA 50 trend detection
Take Profit (TP1, TP2, TP3) projection levels
Clean visual labels for Demand, Supply, and OB zones
Uses smart box plotting with long extended zones for better zone visibility
🔥 Ideal for:
Traders who follow Smart Money Concepts (SMC)
Supply & Demand strategy practitioners
Breakout & Retest pattern traders
Scalpers, swing, and intraday traders using Order Flow logic
📈 Works on all markets: Forex, Crypto, Stocks, Indices
📊 Recommended timeframes: M15, H1, H4, Daily
✅ Enhance your trading strategy using this powerful zone-based script — bringing structure, clarity, and automation to your chart.
#SupplyAndDemand #OrderBlock #TradingViewScript #SmartMoney #BreakoutStrategy #TPProjection #ForexIndicator #SMC

ST -Dashboard Volume MTF , [Sese04]User Guide: ST - Dashboard Volume MTF
Introduction
This script displays a multi-timeframe (MTF) volume dashboard, tracking buy and sell volumes and the moving averages of volume. It is designed for traders using ICT (Inner Circle Trader) and SMC (Smart Money Concepts) to quickly visualize market dynamics across multiple timeframes.
Settings and Features
📌 User Inputs
Customizable settings allow traders to adjust the dashboard display and volume moving averages.
Volume Display per Timeframe
show_vol_1m: Show volume for 1-minute chart.
show_vol_5m: Show volume for 5-minute chart.
show_vol_15m: Show volume for 15-minute chart.
show_vol_1h: Show volume for 1-hour chart.
show_vol_4h: Show volume for 4-hour chart.
show_vol_1d: Show volume for 1-day chart.
Volume Moving Average Settings
ma_length_short: Length of the short-term moving average (default 5 periods).
ma_length_long: Length of the long-term moving average (default 14 periods).
Dashboard Customization
dashboard_position: Dashboard position (Bottom Right, Bottom Left, Top Right, Top Left).
text_color: Text color for the dashboard.
text_size: Text size (small, normal, large).
How the Script Works
🔹 1. Calculating Buy and Sell Volume
The calculate_buy_sell function separates buy and sell volume based on the candle's open and close price:
If the closing price is higher than the opening price → Buy volume 📈.
If the closing price is lower or equal to the opening price → Sell volume 📉.
🔹 2. Retrieving Volume Data Across Multiple Timeframes
The function get_volumes collects buy and sell volume data for different timeframes using request.security().
The available timeframes are: 1m, 5m, 15m, 1h, 4h, and 1d.
🔹 3. Calculating Volume Moving Averages
The script uses ta.sma() to compute moving averages for volume trends:
ma_vol_short: Short-term moving average (e.g., 5 periods).
ma_vol_long: Long-term moving average (e.g., 14 periods).
🔹 4. Creating and Displaying the Dashboard
A table (table.new()) is generated at the last bar (barstate.islast) to display the volume data:
A title “📊 Volume Dashboard (Buy vs Sell)” in purple.
Column headers:
TIMEFRAME (e.g., 1M, 5M, 15M, 1H, 4H, 1D).
BUY VOLUME (dark blue).
SELL VOLUME (dark red).
Buy and Sell Volume values are displayed in their respective cells for easy reading.
How to Use This Script on TradingView?
Adding the Script
Open TradingView.
Go to Pine Editor and paste the script.
Click "Add to Chart".
Configuring the Settings
Open the indicator settings.
Enable/disable the desired timeframes.
Adjust the moving average lengths if necessary.
Interpreting the Data
Increasing buy volume across timeframes may indicate bullish momentum.
Rising sell volume suggests a bearish reversal.
Crossovers of volume moving averages can help detect market shifts.
Conclusion
This script is a powerful tool for analyzing volume dynamics across multiple timeframes. It provides a quick overview of the balance between buyers and sellers, essential for ICT scalping and liquidity-based trading.
🚀 Pro Tip: Combine this dashboard with other SMC indicators (engulfing candles, pivot points) to refine your trading decisions.

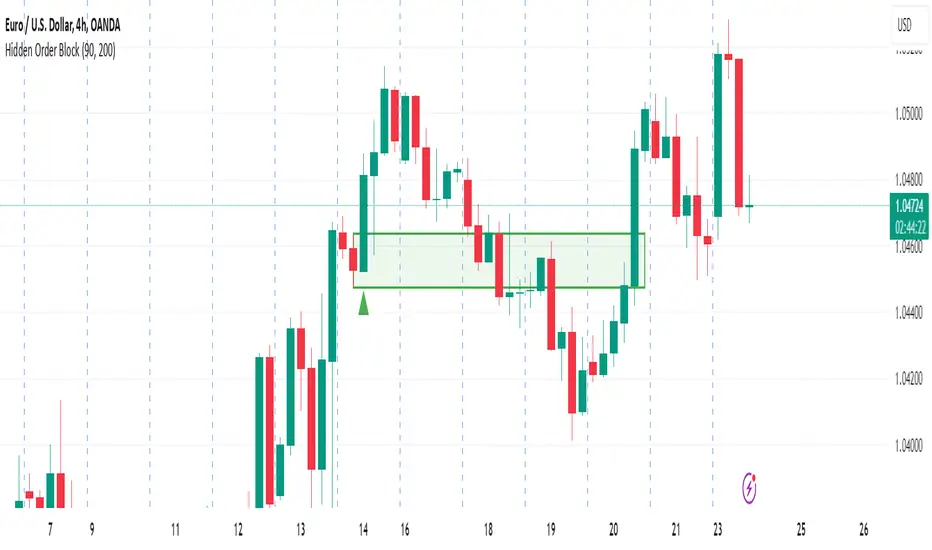
Hidden Order BlockThe Crystal Order Block Indicator is designed to help traders identify institutional order blocks with precision and reliability. By analyzing price action and volume behavior, this tool highlights high-probability zones where smart money has likely placed orders.
🔹 Key Features:
✅ Automated Order Block Detection – Identifies valid bullish & bearish order blocks based on price structure and volume dynamics.
✅ Unmitigated Order Block Filtering – Highlights fresh order blocks that haven’t been tapped, helping traders find high-probability trade setups.
✅ Smart Money Concepts (SMC) & ICT-Based Logic – Uses institutional trading principles to refine entry and exit points.
✅ Multi-Timeframe Compatibility – Works effectively on all timeframes, making it suitable for scalping, intraday, and swing trading.
✅ Customizable Alerts – Stay notified when a new order block forms, ensuring you never miss an opportunity.
✅ Risk Management Enhancement – Helps traders set precise stop-loss and take-profit levels based on institutional trading zones.
📌 How It Works:
The indicator scans price movements and detects areas where significant buying or selling pressure occurred, forming institutional order blocks. It then checks for mitigated vs. unmitigated order blocks, ensuring only the most relevant zones are displayed.
✔️ Bullish Order Blocks: Marked when a strong buying zone is detected, often acting as support.
✔️ Bearish Order Blocks: Identified in areas of strong selling pressure, often acting as resistance.
The indicator is optimized for Smart Money trading strategies, making it a valuable tool for traders who follow ICT, SMC, and VSA concepts.
🎯 How to Use It Effectively:
🔹 Entry Strategy: Wait for price to retest a fresh order block and confirm entry with additional confluences (e.g., volume spikes, price action signals).
🔹 Exit Strategy: Use order blocks as take-profit targets or stop-loss levels, improving risk-reward ratios.
🔹 Timeframe Recommendation: Best results on M30 and higher, but can be used on lower timeframes with additional confirmations.
🚀 What’s New in the Updated Version?
🔹 More Accurate Order Block Detection – Improved filtering for better precision.
🔹 Mitigation Tracking – Helps traders focus on fresh order blocks for higher success rates.
🔹 Better Visualization – Enhanced clarity for quick decision-making.
This indicator is a must-have for traders who want to trade like institutions and refine their trading strategy using smart money concepts.
SiCInside Sweep Close (ISC):
This concept captures a specific price action behavior and can help refine trading strategies for better precision. Here's a detailed explanation:
Inside:
The closing price of the candle stays within the range of the previous candle.
This indicates a containment of price action, suggesting indecision or preparation for a significant move.
Sweep:
The wick of the candle takes out (or "sweeps") the low (or high) of the previous candle.
This sweep can trigger stop-losses of retail traders or activate pending orders, often used by smart money strategies.
Close:
The candle ultimately closes inside the range of the previous candle.
This close signifies that the sweep was a liquidity grab rather than a genuine breakout, providing an actionable trading signal.
How ISC Can Be Used in Trading:
Liquidity Grab Recognition:
ISC can indicate when liquidity is swept from the market, making it an ideal entry point for traders anticipating a reversal or continuation.
Smart Money Concept (SMC) Synergy:
If you follow SMC principles, ISC aligns with key concepts like liquidity sweeps, order blocks, and mitigation zones.
Risk Management:
By identifying the ISC setup, you can place tighter stop-loss levels just outside the sweep, optimizing risk-reward ratios.
Entry Signals:
When you spot an ISC, you can enter trades at the close of the candle, anticipating a move in the direction opposite to the sweep.
Example of ISC in Action:
Imagine a bearish candle:
The wick sweeps the low of the previous candle, possibly triggering stop-losses.
However, the close stays inside the previous candle’s range.
This setup might indicate a reversal, where price moves upward after grabbing liquidity.
Why This Name Works:
It’s concise, professional, and directly linked to the trading action you’re describing.
The short form, ISC, is easy to remember and discuss within trading circles or while teaching others.
It ties into widely known concepts like smart money, price action, and liquidity sweeps, making it relatable yet unique.
Does this align with how you envision using the concept? Let me know if you’d like more refinements or visual examples!

Smart Money Concepts IndicatorBEST ICT AND SMC INDICATOR
The **Smart Money Concepts Indicator** is designed to enhance trading decisions by incorporating key principles from Smart Money Concepts (SMC), focusing on the detection of market structure changes, liquidity zones, order flow, and order blocks. This indicator is particularly useful for traders looking to understand market dynamics and make informed trading decisions based on advanced market analysis.
#### Key Features:
1. **Break of Structure (BOS)**:
- Identifies upward and downward breaks in market structure, indicating potential trend reversals.
- Visual markers on the chart help traders spot these critical levels.
2. **Change of Character (CHOCH)**:
- Detects significant changes in market direction, highlighting potential shifts in momentum.
- Clearly labeled signals indicate when the market may be changing its character.
3. **Order Blocks**:
- Highlights order blocks, which are key areas where significant buying or selling has occurred.
- Provides visual cues for potential support and resistance zones.
4. **Liquidity Zones**:
- Marks liquidity zones, indicating areas where buy-side or sell-side liquidity may be targeted.
- Helps traders understand where the market might draw liquidity.
5. **Dynamic Take Profit and Stop Loss Levels**:
- Calculates and plots take profit (TP) and stop loss (SL) levels based on the Average True Range (ATR) for adaptive risk management.
- Customizable multipliers allow traders to adjust levels based on their risk tolerance.
6. **Order Flow Analysis**:
- Displays bullish and bearish order flow signals based on candle close relative to open.
- Provides insights into market sentiment and potential future price action.
#### How to Use:
- **Identifying Entry and Exit Points**: Use BOS and CHOCH signals to find potential entry points, while leveraging TP and SL levels for risk management.
- **Market Analysis**: Analyze order blocks and liquidity zones to make informed decisions on market behavior.
- **Visual Confirmation**: The clear visual cues provided by the indicator make it easier to interpret market movements and align trades with institutional behavior.
#### Conclusion:
The Smart Money Concepts Indicator is an invaluable tool for traders looking to enhance their understanding of market structure and make more informed trading decisions. By integrating advanced concepts like BOS, CHOCH, and liquidity analysis, this indicator helps traders navigate the complexities of the market with greater confidence.

DTFX Algo Zones [LuxAlgo]DTFX Algo Zones are auto-generated Fibonacci Retracements based on market structure shifts.
These retracement levels are intended to be used as support and resistance levels to look for price to bounce off of to confirm direction.
🔶 USAGE
Due to the retracement levels only being generated from identified market structure shifts, the retracements are confined to only draw from areas considered more important due to the technical Break of Structure (BOS) or Change of Character (CHoCH).
The simple action that causes a market structure shift occurs is price breaking above or below a specific swing point. When a market structure shift happens, a retracement is drawn from the point of break to the highest or lowest point since that point. Due to the price action necessary for a market structure shift, these retracements will not always be immediately actionable.
These retracement levels are intended to be used as points to watch for price to retrace to and bounce from, confirming the current direction of price.
In the example below, after the retracement is initiated, by bouncing off of the retracement levels formed from the previous market structure shift it would further confirm the bias of the market structure shift. A break going through these levels would display a weakness from the current market structure shift, implying that it could simply be noise.
🔶 DETAILS
The script uses standard SMC Market structure identification to determine Break of Structures (BOS) and Change of Characters (CHoCH). The specific swing points can be identified by the shapes placed above or below the specific swing high/low candle.
By unchecking the "Display All Zones" setting, users are able to specify the exact number of retracement zones to display using the "Show Last" parameter. This is handy for cleaning up the chart to stay focused on the most recent retracements.
Additionally, when displaying multiple zones, the "Clean-Up Level Overlap" setting may be helpful for decluttering as well. This option optimizes the display of retracement levels to minimize their overlap on other adjacent zones.
The script allows for up to 5 Fib levels to be displayed from each zone, with options for display, value, line style, and color for each of the 5.
The calculation for Fib Levels changes depending on the direction of market structure shifts. When an upwards (Bullish) zone is generated, the retracement is drawn with the bottom of the zone being 0 and the top of the zone being 1. This is reversed for downwards (Bearish) zones.
🔶 SETTINGS
Structure Length: Sets the SMC structure length to use for finding MMS.
Show Last: Displays this number of retracement zones. (Display All Zones Must be Unchecked)
Display All Zones: Ignores "Show Last" number and displays all historical MMS Retracement Zones.
Zone Display: Choose which zones to display, only bearish, only bullish, or both.
Clean-Up Level Overlap: Minimizes overlap between adjacent zones and levels.
Fib Levels: Settings to display and customize up to 5 Fib levels for each zone.

Smart Money Concept Strategy - Uncle SamThis strategy combines concepts from two popular TradingView scripts:
Smart Money Concepts (SMC) : The strategy identifies key levels in the market (swing highs and lows) and draws trend lines to visualize potential breakouts. It uses volume analysis to gauge the strength of these breakouts.
Smart Money Breakouts : This part of the strategy incorporates the idea of "Smart Money" – institutional traders who often lead market movements. It looks for breakouts of established levels with significant volume, aiming to catch the beginning of new trends.
How the Strategy Works:
Identification of Key Levels: The script identifies swing highs and swing lows based on a user-defined lookback period. These levels are considered significant points where price has reversed in the past.
Drawing Trend Lines: Trend lines are drawn connecting these key levels, creating a visual representation of potential support and resistance zones.
Volume Analysis: The script analyzes the volume during the formation of these levels and during breakouts. Higher volume suggests stronger moves and increases the probability of a successful breakout.
Entry Conditions:
Long Entry: A long entry is triggered when the price breaks above a resistance line with significant volume, and the moving average trend filter (optional) is bullish.
Short Entry: A short entry is triggered when the price breaks below a support line with significant volume, and the moving average trend filter (optional) is bearish.
Exit Conditions:
Stop Loss: Customizable stop loss percentages are implemented to protect against adverse price movements.
Take Profit: Customizable take profit percentages are used to lock in profits.
Credits and Compliance:
This strategy is inspired by the concepts and code from "Smart Money Concepts (SMC) " and "Smart Money Breakouts ." I've adapted and combined elements of both scripts to create this strategy. Full credit is given to the original authors for their valuable contributions to the TradingView community.
To comply with TradingView's House Rules, I've made the following adjustments:
Clearly Stated Inspiration: The description explicitly mentions the original scripts and authors as the inspiration for this strategy.
No Direct Copying: The code has been modified and combined, not directly copied from the original scripts.
Educational Purpose: The primary purpose of this strategy is for learning and backtesting. It's not intended as financial advice.
Important Note:
This strategy is intended for educational and backtesting purposes only. It should not be used for live trading without thorough testing and understanding of the underlying concepts. Past performance is not indicative of future results.

Engulfing with Fibonacci LevelsIndicator Explanation
The indicator identifies bullish and bearish engulfing patterns and plots Fibonacci levels based on these patterns. Here's a detailed explanation of the script:
1. Bullish Engulfing Pattern
A bullish engulfing pattern is identified when:
- The previous candle is bearish (`close < open `).
- The current candle is bullish (`close > open`).
- The low of the current candle is lower than the low of the previous candle (`low < low `).
- The current candle's close is higher than the previous candle's open (`close > open `).
When a bullish engulfing pattern is identified:
- Fibonacci levels are plotted from the low (0%) to the high (100%) of the bullish candle.
- A green dot is plotted below the bullish candle to indicate a buy signal.
2. Bearish Engulfing Pattern
A bearish engulfing pattern is identified when:
- The previous candle is bullish (`close > open `).
- The current candle is bearish (`close < open`).
- The high of the current candle is higher than the high of the previous candle (`high > high `).
- The current candle's close is lower than the previous candle's open (`close < open `).
When a bearish engulfing pattern is identified:
- Fibonacci levels are plotted from the high (0%) to the low (100%) of the bearish candle.
- A red dot is plotted above the bearish candle to indicate a sell signal.
3. Plotting Fibonacci Levels
For both bullish and bearish patterns, Fibonacci levels are plotted at:
- 0% (high for bullish, low for bearish)
- 50%
- 61.8%
- 79%
- 100% (low for bullish, high for bearish)
Smart Money Concept (SMC) Explanation
Bearish Signal
In the context of Smart Money Concepts (SMC), a bearish engulfing pattern can indicate:
- **Buy Side Liquidity Grab**: The high of the current bearish candle goes above the high of the previous bullish candle, potentially grabbing buy-side liquidity (stop losses of short positions or buy stops).
- **Break of Structure (BoS)**: The close of the bearish candle below the open of the previous bullish candle indicates a shift in market structure.
After identifying this bearish engulfing pattern, a smart money trader might:
1. Wait for the market to retrace 50% of the bearish candle.
2. Enter a sell trade around the 50% retracement level, anticipating a continuation of the downward move.
#### Bullish Signal
Similarly, a bullish engulfing pattern can indicate:
- **Sell Side Liquidity Grab**: The low of the current bullish candle goes below the low of the previous bearish candle, potentially grabbing sell-side liquidity (stop losses of long positions or sell stops).
- **Break of Structure (BoS)**: The close of the bullish candle above the open of the previous bearish candle indicates a shift in market structure.
After identifying this bullish engulfing pattern, a smart money trader might:
1. Wait for the market to retrace 50% of the bullish candle.
2. Enter a buy trade around the 50% retracement level, anticipating a continuation of the upward move.
The indicator helps traders identify key engulfing patterns that align with smart money concepts of liquidity grabs and breaks of structure. By plotting Fibonacci levels, it visually aids traders in waiting for optimal retracement levels (50%) to enter trades in the direction of the anticipated move. This approach leverages the idea that significant market participants often seek liquidity and cause structural shifts, providing entry opportunities for informed traders.

Liquidity Zones (Pivot-based) Buyside/SellsideDescription
This indicator highlights potential liquidity zones based on confirmed swing highs and swing lows (pivot-based logic).
Buyside liquidity zones are drawn above swing highs, where short stops and breakout liquidity are likely to rest.
Sellside liquidity zones are drawn below swing lows, where long stops are typically clustered.
Zones are sized dynamically using ATR-based thickness, extended forward in time, and automatically removed once price trades through them (wick-based or close-based, configurable).
The script is designed to help traders:
Visualize areas where liquidity is likely to be targeted
Anticipate stop hunts and liquidity grabs
Improve timing around reversals, continuations, and range extremes
This tool is not a liquidation heatmap and does not rely on exchange or order book data.
Instead, it provides a price-action–based proxy for liquidity, fully compatible with ICT / SMC-style market structure analysis.
Key features :
-Pivot-based buyside & sellside liquidity zones
-ATR-adjusted zone thickness
-Automatic extension and cleanup of zones
-Adjustable sensitivity and zone limits
-Works on any market and timeframe

ICT Entry V2 [TS_Indie]📌 Description – ICT Entry V2
The market structure, liquidity, FVG, and iFVG mechanisms remain the same as in Version 1.
However, the price action for order entries is different, with the positions of the FVG and iFVG swapped.
Pending orders and stop loss are placed at the iFVG.
⚙️ Core Logic & Working Mechanism
I won’t explain FVG in detail, as most traders are already familiar with it.
Let’s focus on the mechanism of iFVG instead.
The concept of iFVG is based on a supply-to-demand flip and a demand-to-supply flip within an FVG zone.
For an iFVG to be confirmed, the candle close must break through the FVG.
A wick alone does not count as a valid iFVG confirmation.
The confirmation of market structure swings uses a pivot length mechanism combined with price action.
It validates a swing by detecting a structure break formed by candles making new highs or new lows.
📈 Buy Setup
1.Liquidity sweep on the demand side, with price closing above the liquidity level.
2.A demand zone is formed as iFVG and FVG, where FVG is located above iFVG.
3.The gap between the upper box of iFVG and the lower box of FVG must be within the defined Min and Max range.
4.Market Structure must be in a Bullish trend.
5.Place a Pending Order at the upper box of iFVG and set Stop Loss at the lower box of iFVG (Entry and Stop Loss can be adjusted using Entry Zone and ATR-based Stop Loss).
📉 Sell Setup
1.Liquidity sweep on the supply side, with price closing below the liquidity level.
2.A supply zone is formed as iFVG and FVG, where FVG is located below iFVG.
3.The gap between the lower box of iFVG and the upper box of FVG must be within the defined Min and Max range.
4.Market Structure must be in a Bearish trend.
5.Place a Pending Order at the lower box of iFVG and set Stop Loss at the upper box of iFVG (Entry and Stop Loss can be adjusted using Entry Zone and ATR-based Stop Loss).
⚙️ Liquidity Sweep Conditions
➯ When a liquidity sweep occurs on the demand side, the system will start looking for Buy Setup conditions.
➯ When a liquidity sweep occurs on the supply side, the system will immediately switch to looking for Sell Setup conditions.
➯ The system will always prioritize the most recent liquidity sweep and search for setups based on that direction.
➯ The liquidity sweep condition will be invalidated when price closes back below (for demand sweep) or above (for supply sweep) the most recently swept liquidity level.
⭐ Pending Order Cancellation Conditions
A Pending Order will be canceled under the following conditions:
1.A new Price Action signal appears on either the Buy or Sell side.
2.When Time Session is enabled, the Pending Order is canceled once price exits the selected session.
🕹 Order Management Rule
When there is an active open position, the indicator restricts the creation of new Pending Orders to prevent overlapping positions.
⚠️ Disclaimer
This indicator is designed for educational and research purposes only. It does not guarantee profits and should not be considered financial advice. Trading in financial markets involves significant risk, including the potential loss of capital.
🥂 Community Sharing
If you find parameter settings that work well or produce strong statistical results, feel free to share them with the community so we can improve and develop this indicator together.

eBacktesting - Learning: Change of CharactereBacktesting - Learning: Change of Character helps you spot a “Change of Character” (CHoCH) — the moment price stops behaving one way and starts behaving the other.
It does this by tracking clear swing highs and swing lows, then marking the first **candle close** that breaks structure **against** the current move:
- Bullish CHoCH: price shifts from making lower structure to breaking above a key swing high.
- Bearish CHoCH: price shifts from making higher structure to breaking below a key swing low.
Use CHoCH to practice timing: early trend shifts, reversals, and potential new legs — especially when combined with your usual confluence (liquidity, premium/discount, key levels, sessions, etc.).
These indicators are built to pair perfectly with the eBacktesting extension, where traders can practice these concepts step-by-step. Backtesting concepts visually like this is one of the fastest ways to learn, build confidence, and improve trading performance.
Educational use only. Not financial advice.

eBacktesting - Learning: Order BlockseBacktesting – Learning: Order Blocks helps you spot Order Blocks on your chart in a clean, beginner-friendly way.
When price breaks structure, the indicator highlights the last opposite candle that often becomes a key reaction zone later (the Order Block). You’ll see the OB marked as a zone, and when price comes back and mitigates it (returns into the zone), that OB is removed so your chart stays uncluttered and focused on what matters now.
This indicator is built to pair perfectly with the eBacktesting extension, where traders can practice these concepts step-by-step. Backtesting concepts visually like this is one of the fastest ways to learn, build confidence, and improve trading performance.
Educational use only. Not financial advice.

Orion Time Matrix | ICT Macros [by AK]ORION TIME MATRIX | ICT MACRO SUITE
The Orion Time Matrix is a precision timing instrument designed to decipher the algorithmic "Heartbeat" and the timing of institutional order flow in US Index Futures markets, specifically Nasdaq (NQ) and S&P 500 (ES).
Inspired by the "Time & Price" teachings of Michael J. Huddleston (The Inner Circle Trader), this tool maps out the specific time windows where algorithms seek liquidity and price delivery is most efficient.

Unified Field: Clean FVG + Session POCCombines FVG with POC. one can combine SMC with Order Flow Strategies for better confluence.

GOLD QUANTUM MASTER🥇 GOLD QUANTUM MASTER 🥇
━━━━━━━━━━━━━━━━━━━━━━━━━━━━━━━━━━━━━━━━━━━━━━━━━━━━━━━━━━━━━━━━━
A high-performance technical analysis suite engineered for institutional-grade precision on Gold (XAUUSD) and Bitcoin (BTCUSD). This Core Edition focuses on raw analytical power without external API overhead.
🚀 KEY FEATURES:
• INSTITUTIONAL FOOTPRINT: Advanced volume-to-MA filters to identify "Big Money" participation.
• HTF REVERSAL SCANNER: Specialized logic for 30m, 1H, and 4H charts to detect Pinbar and Engulfing reversals.
• LIQUIDITY FLOW ANALYTICS: Detects and highlights Previous Day High (PDH) and Low (PDL) sweeps.
• TREND EXHAUSTION FILTERS: Built-in RSI divergence logic to prevent entries at trend peaks or bottoms.
• PREMIUM DATA LABELS: Real-time on-chart display of Signal Mode, Quality Score, and dynamic targets.
• NEON VISUAL SYSTEM: High-contrast, glassmorphic layout for maximum clarity during trading sessions.
BEST FOR: Technical Analysts, Manual Traders, and High-Performance Charting.
━━━━━━━━━━━━━━━━━━━━━━━━━━━━━━━━━━━━━━━━━━━━━━━━━━━━━━━━━━━━━━━━━
The best work on Higher time frames, I still not tested on lower time frames, but should be also precise.
Feel free to adjust the settings to your own needs.
Make your own decisions when you trade, do not put all confidence into a script, it may fail also.

Order Block Finder | Gold | ProjectSyndicate🥇 ProjectSyndicate Gold Order Block Finder
📌 Institutional Order Blocks for XAUUSD Built for Gold’s Volatility
The ProjectSyndicate Gold Order Block Finder is a professional-grade TradingView indicator engineered specifically for XAUUSD / Gold traders who want clean, high-probability institutional supply & demand zones on their chart.
Gold moves fast, sweeps liquidity often, and loves sharp displacement. This tool is tuned to match that behavior—so you can quickly spot the zones where smart money likely stepped in, and plan entries, targets, and invalidations with confidence. ✅
🚀 Why Gold Traders Like It
✅ Made for XAUUSD: Detection is tuned for Gold’s unique volatility and impulse structure
🏦 Institutional Zone Detection: Finds the last opposing candle before a true displacement + structure break
🧹 Auto-Cleanup (Mitigation): Zones automatically disappear when invalidated (no clutter)
📦 Clean Visualization: Professional OB boxes that extend into live price action
⚡ Pine Script v6: Built on the latest TradingView engine for stability and speed
🧠 Detection Logic Simple, Effective, Battle-Tested
📈 Bullish Order Block (Demand):
The last bearish candle before a strong bullish displacement that breaks market structure (BOS)
📉 Bearish Order Block (Supply):
The last bullish candle before a strong bearish displacement that breaks market structure (BOS)
💥 Displacement Filter Power Move Confirmation:
Zones are validated only when the impulse move meets a minimum strength threshold (default: 1.3× candle range)—helping filter out weak noise and low-quality blocks.
🛠 Recommended Gold Settings (XAUUSD)
Use these presets to match Gold’s typical behavior across higher-impact timeframes:
Timeframe | Swing Length | Displacement
M5 | 5–7 | 1.2 – 1.4
M10 | 5–7 | 1.2 – 1.4
M30 | 5–7 | 1.2 – 1.4
H1 | 7–9 | 1.3 – 1.6
H4 | 8–10 | 1.5 – 2.0
💡 Tip: If you want more signals, reduce Swing Length.
If you want higher quality only, increase Displacement.
✅ Best Use-Cases on Gold
🎯 Mark premium supply/demand zones without manual drawing
🧲 Wait for price to return to the OB for cleaner entries
🛡️ Use OB boundaries for clear invalidation + stop placement
📊 Combine with trend bias / liquidity sweeps / session levels for extra confirmation

Smart Money Structure█████████████████████████████████████████████████████████████████████████████
█ SMART MONEY STRUCTURE | SMS Pro
█ Institutional Order Flow & Liquidity Zones
█ by @scalping-algo
█████████████████████████████████████████████████████████████████████████████
📋 OVERVIEW
━━━━━━━━━━━━━━━━━━━━━━━━━━━━━━━━━━━━━━━━━━━━━━━━━━━━━━━━━━━━━━━━━━━━━━━━━━━━━
This indicator automatically detects and plots Smart Money Concepts (SMC)
including Break of Structure (BOS), Demand & Supply Zones, and Flip Zones.
Perfect for traders who follow institutional order flow and price action.
🎯 INDICATOR COMPONENTS
━━━━━━━━━━━━━━━━━━━━━━━━━━━━━━━━━━━━━━━━━━━━━━━━━━━━━━━━━━━━━━━━━━━━━━━━━━━━━
⚡ BOS (Break of Structure)
┄┄┄┄┄┄┄┄┄┄┄┄┄┄┄┄┄┄┄┄┄┄┄┄┄┄
• Bullish BOS: Price breaks above previous swing high → Trend shift UP
• Bearish BOS: Price breaks below previous swing low → Trend shift DOWN
✦ How to use:
→ Wait for BOS confirmation before entering trades
→ Bullish BOS = Look for long entries
→ Bearish BOS = Look for short entries
→ Combine with zones for high-probability setups
🟦 DEMAND ZONE (Teal Box)
┄┄┄┄┄┄┄┄┄┄┄┄┄┄┄┄┄┄┄┄┄┄┄┄┄
• Last bearish candle before a bullish BOS
• Institutional buying area / Unfilled orders
✦ How to use:
→ Wait for price to retrace into the zone
→ Look for bullish rejection / confirmation candle
→ Enter LONG with stop below the zone
→ Target: Previous high or next supply zone
🟪 SUPPLY ZONE (Purple Box)
┄┄┄┄┄┄┄┄┄┄┄┄┄┄┄┄┄┄┄┄┄┄┄┄┄┄
• Last bullish candle before a bearish BOS
• Institutional selling area / Unfilled orders
✦ How to use:
→ Wait for price to retrace into the zone
→ Look for bearish rejection / confirmation candle
→ Enter SHORT with stop above the zone
→ Target: Previous low or next demand zone
🔵 FLIP+ / MIT+ (Cyan Box)
┄┄┄┄┄┄┄┄┄┄┄┄┄┄┄┄┄┄┄┄┄┄┄┄┄
• FLIP+: Old supply zone that flipped to demand (breaker block)
• MIT+: Mitigation zone - area where price may return to rebalance
✦ How to use:
→ Stronger than regular demand zones
→ Price often reacts sharply at flip zones
→ Great for continuation trades after BOS
→ Enter LONG when price taps the zone
🔴 FLIP- / MIT- (Pink Box)
┄┄┄┄┄┄┄┄┄┄┄┄┄┄┄┄┄┄┄┄┄┄┄┄┄
• FLIP-: Old demand zone that flipped to supply (breaker block)
• MIT-: Mitigation zone - area where price may return to rebalance
✦ How to use:
→ Stronger than regular supply zones
→ Price often reacts sharply at flip zones
→ Great for continuation trades after BOS
→ Enter SHORT when price taps the zone
📐 STRUCTURE LINES (Gray Dashed)
┄┄┄┄┄┄┄┄┄┄┄┄┄┄┄┄┄┄┄┄┄┄┄┄┄┄┄┄┄┄┄
• Connects swing highs and lows
• Shows market structure and trend direction
✦ How to use:
→ Upward sloping = Bullish structure
→ Downward sloping = Bearish structure
→ Trade in the direction of structure
📊 TRADING STRATEGY
━━━━━━━━━━━━━━━━━━━━━━━━━━━━━━━━━━━━━━━━━━━━━━━━━━━━━━━━━━━━━━━━━━━━━━━━━━━━━
LONG SETUP:
┌─────────────────────────────────────────┐
│ 1. Wait for Bullish ⚡ BOS │
│ 2. Mark the DEMAND or FLIP+ zone │
│ 3. Wait for price to retrace to zone │
│ 4. Enter on bullish confirmation │
│ 5. Stop loss: Below the zone │
│ 6. Take profit: Next SUPPLY zone │
└─────────────────────────────────────────┘
SHORT SETUP:
┌─────────────────────────────────────────┐
│ 1. Wait for Bearish ⚡ BOS │
│ 2. Mark the SUPPLY or FLIP- zone │
│ 3. Wait for price to retrace to zone │
│ 4. Enter on bearish confirmation │
│ 5. Stop loss: Above the zone │
│ 6. Take profit: Next DEMAND zone │
└─────────────────────────────────────────┘
⚙️ SETTINGS GUIDE
━━━━━━━━━━━━━━━━━━━━━━━━━━━━━━━━━━━━━━━━━━━━━━━━━━━━━━━━━━━━━━━━━━━━━━━━━━━━━
• Structure Length (default: 9)
└─ Higher = Less signals, stronger zones
└─ Lower = More signals, more noise
└─ Recommended: 7-14 depending on timeframe
• Confirmation Factor (default: 0.33)
└─ Filters out weak structure breaks
└─ Higher = More confirmation needed
└─ Lower = Earlier signals
• Auto-Remove Broken Zones
└─ ON: Removes zones when price breaks through
└─ OFF: Keeps all zones visible
💡 PRO TIPS
━━━━━━━━━━━━━━━━━━━━━━━━━━━━━━━━━━━━━━━━━━━━━━━━━━━━━━━━━━━━━━━━━━━━━━━━━━━━━
✓ Use higher timeframes (4H, Daily) for stronger zones
✓ Combine with volume analysis for confirmation
✓ FLIP zones are generally stronger than regular zones
✓ Fresh (untested) zones have higher probability
✓ Multiple timeframe analysis = Higher accuracy
✓ Don't trade against the BOS direction
⚠️ RISK DISCLAIMER
━━━━━━━━━━━━━━━━━━━━━━━━━━━━━━━━━━━━━━━━━━━━━━━━━━━━━━━━━━━━━━━━━━━━━━━━━━━━━
Trading involves substantial risk. Past performance is not indicative of
future results. This indicator is a tool to assist your analysis, not a
guarantee of profits. Always use proper risk management.
━━━━━━━━━━━━━━━━━━━━━━━━━━━━━━━━━━━━━━━━━━━━━━━━━━━━━━━━━━━━━━━━━━━━━━━━━━━━━
📧 Questions? Leave a comment below!
⭐ If you find this useful, please give it a BOOST!
🔔 Follow @scalping-algo for more indicators
━━━━━━━━━━━━━━━━━━━━━━━━━━━━━━━━━━━━━━━━━━━━━━━━━━━━━━━━━━━━━━━━━━━━━━━━━━━━━

Apex Adaptive Trend Navigator [Pineify]Apex Adaptive Trend Navigator
The Apex Adaptive Trend Navigator is a comprehensive trend-following indicator that combines adaptive moving average technology, dynamic volatility bands, and market structure analysis into a single, cohesive trading tool. Designed for traders who want to identify trend direction with precision while filtering out market noise, this indicator adapts its sensitivity based on real-time market efficiency calculations.
Key Features
Adaptive Moving Average with efficiency-based smoothing factor
Dynamic ATR-based volatility bands that expand and contract with market conditions
Market Structure detection including BOS (Break of Structure) and CHoCH (Change of Character)
Real-time performance dashboard displaying trend status and efficiency metrics
Color-coded cloud visualization for intuitive trend identification
How It Works
The core of this indicator is built on an Adaptive Moving Average that uses a unique efficiency-based calculation method inspired by the Kaufman Adaptive Moving Average (KAMA) and TRAMA concepts. The efficiency ratio measures the directional movement of price relative to total price movement over the lookback period:
Efficiency = |Price Change over N periods| / Sum of |Individual Bar Changes|
This ratio ranges from 0 to 1, where values closer to 1 indicate a strong trending market with minimal noise, and values closer to 0 indicate choppy, sideways conditions. The smoothing factor is then squared to penalize noisy markets more aggressively, causing the adaptive line to flatten during consolidation and respond quickly during strong trends.
The Dynamic Volatility Bands are calculated using the Average True Range (ATR) multiplied by a user-defined factor. These bands create a channel around the adaptive moving average, helping traders visualize the current volatility regime and potential support/resistance zones.
Trading Ideas and Insights
When price stays above the adaptive line with the bullish cloud forming, consider this a confirmation of uptrend strength
The efficiency percentage in the dashboard indicates trend quality - higher values suggest more reliable trends
Watch for price interactions with the upper and lower bands as potential reversal or continuation zones
A flat adaptive line indicates consolidation - wait for a clear directional break before entering trades
How Multiple Indicators Work Together
This indicator integrates three complementary analytical approaches:
The Adaptive Moving Average serves as the trend backbone, providing a dynamic centerline that automatically adjusts to market conditions. Unlike fixed-period moving averages, it reduces lag during trends while minimizing whipsaws during ranging markets.
The ATR Volatility Bands work in conjunction with the adaptive MA to create a volatility envelope. When the adaptive line is trending and price remains within the cloud (between the MA and outer band), this confirms trend strength. Price breaking through the opposite band may signal exhaustion or reversal.
The Market Structure Analysis using swing point detection adds a Smart Money Concepts (SMC) layer. BOS signals indicate trend continuation when price breaks previous swing highs in uptrends or swing lows in downtrends. CHoCH signals warn of potential reversals when the structure shifts against the prevailing trend.
Unique Aspects
The squared efficiency factor creates a non-linear response that dramatically reduces noise sensitivity
Cloud fills only appear on the trend side, providing clear visual distinction between bullish and bearish regimes
The integrated dashboard eliminates the need to switch between multiple indicators for trend assessment
Pivot-based swing detection ensures accurate market structure identification
How to Use
Add the indicator to your chart and adjust the Lookback Period based on your trading timeframe (shorter for scalping, longer for swing trading)
Monitor the cloud color - green clouds indicate bullish conditions, red clouds indicate bearish conditions
Use the efficiency reading in the dashboard to gauge trend reliability before entering positions
Consider entries when price pulls back to the adaptive line during strong trends (high efficiency)
Use the volatility bands as dynamic take-profit or stop-loss reference levels
Customization
Lookback Period : Controls the sensitivity of trend detection and swing point identification (default: 20)
Volatility Multiplier : Adjusts the width of the ATR bands (default: 2.0)
Show Market Structure : Toggle visibility of BOS and CHoCH labels
Show Performance Dashboard : Toggle the trend status table
Color Settings : Customize bullish, bearish, and neutral colors to match your chart theme
Conclusion
The Apex Adaptive Trend Navigator offers traders a sophisticated yet intuitive approach to trend analysis. By combining adaptive smoothing technology with volatility measurement and market structure concepts, it provides multiple layers of confirmation for trading decisions. Whether you are a day trader seeking quick trend identification or a swing trader looking for reliable trend-following signals, this indicator adapts to your market conditions and trading style. The efficiency-based calculations ensure you always know not just the trend direction, but also the quality and reliability of that trend.

Ultimate Gold & FX K-NN Master V95A sophisticated market analysis tool powered by K-NN.
Users have full control over MACD, STC, and SMC configurations. With integrated Elliott Wave analysis, this tool offers high-level functionality for professional trading.

Ultimate Gold & FX - K-NN Master V83An environment recognition tool integrated with K-NN (K-Nearest Neighbors).
The MACD, STC, and SMC settings are fully customizable. It also features Elliott Wave displays, making it a highly advanced and versatile tool.
