Liquidations Levels [RunRox]📈 Liquidation Levels is an indicator designed to visualize key price levels on the chart, highlighting potential reversal points where liquidity may trigger significant price movements.
Liquidity is essential in trading - price action consistently moves from one liquidity area to another. We’ve created this free indicator to help traders easily identify and visualize these liquidity zones on their charts.
📌 HOW IT WORKS
The indicator works by marking visible highs and lows, points widely recognized by traders. Because many traders commonly place their stop-loss orders beyond these visible extremes, significant liquidity accumulates behind these points. By analyzing trading volume and visible extremes, the indicator estimates areas where clusters of stop-loss orders (liquidity pools) are likely positioned, giving traders valuable insights into potential market moves.
As shown in the screenshot above, the price aggressively moved toward Sell-Side liquidity. After sweeping this liquidity level for the second time, it reversed and began targeting Buy-Side liquidity. This clearly demonstrates how price moves from one liquidity pool to another, continually seeking out liquidity to fuel its next directional move.
As shown in the screenshot, price levels with fewer anticipated trader stop-losses are indicated by less vibrant, faded colors. When the lines become more saturated and vivid, it signals that sufficient liquidity - in the form of clustered stop-losses has accumulated, potentially attracting price movement toward these areas.
⚙️ SETTINGS
🔹 Period – Increasing this setting makes the marked highs and lows more significant, filtering out minor price swings.
🔹 Low Volume – Select the color displayed for low-liquidity levels.
🔹 High Volume – Select the color displayed for high-liquidity levels.
🔹 Levels to Display – Choose between 1 and 15 nearest liquidity levels to be shown on the chart.
🔹 Volume Sensitivity – Adjust the sensitivity of the indicator to volume data on the chart.
🔹 Show Volume – Enable or disable the display of volume values next to each liquidity level.
🔹 Max Age – Limits displayed liquidity levels to those not older than the specified number of bars.
✅ HOW TO USE
One method of using this indicator is demonstrated in the screenshot above.
Price reached a high-liquidity level and showed an initial reaction. We then waited for a second confirmation - a liquidity sweep followed by a clear market structure break - to enter the trade.
Our target is set at the liquidity accumulated below, with the stop-loss placed behind the manipulation high responsible for the liquidity sweep.
By following this approach, you can effectively identify trading opportunities using this indicator.
🔶 We’ve made every effort to create an indicator that’s as simple and user-friendly as possible. We’ll continue to improve and enhance it based on your feedback and suggestions in the future.
在脚本中搜索"stop loss"

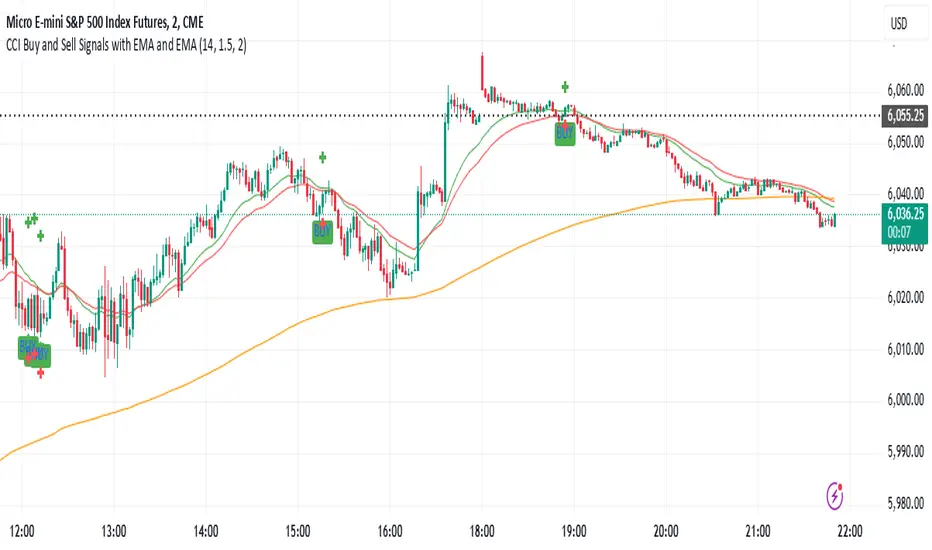
CCI Buy and Sell Signals with 20/30 EMACCI Buy and Sell Signals with EMA and ATR Stop Loss/Take Profit
This indicator is designed to identify buy and sell signals based on a combination of the Commodity Channel Index (CCI) and Exponential Moving Averages (EMA). It also includes an optional ATR-based stop loss and take profit system, which is useful for traders who want to manage their trades with dynamic risk levels.
Features:
CCI Buy and Sell Signals:
Buy Signal: A buy signal is triggered when the CCI crosses up through -100 (from an oversold condition), the 20-period EMA is above the 30-period EMA, and the price is above the 200-period EMA. This suggests that the market is entering an upward trend.
Sell Signal: A sell signal is triggered when the CCI crosses down through +100 (from an overbought condition), the 20-period EMA is below the 30-period EMA, and the price is below the 200-period EMA. This suggests that the market is entering a downward trend.
Exponential Moving Averages (EMA):
The script plots three EMAs:
20-period EMA (Green): Used to identify short-term trends.
30-period EMA (Red): Used to capture medium-term trends.
200-period EMA (Orange): A long-term trend filter, with the price above it generally indicating bullish conditions and below it indicating bearish conditions.
ATR-Based Stop Loss and Take Profit:
Optional Feature: The ATR (Average True Range) indicator can be used to set stop loss and take profit levels based on market volatility.
Stop Loss: Set at a multiple of the ATR below the entry price for long positions and above the entry price for short positions.
Take Profit: Set at a multiple of the ATR above the entry price for long positions and below the entry price for short positions.
Customizable: You can adjust the ATR length, Stop Loss Multiplier, and Take Profit Multiplier through the settings.
Dots: The stop loss and take profit levels are plotted as dots on the chart when the ATR feature is enabled.
Alert Conditions:
Buy Signal Alert: Triggered when a buy signal occurs based on CCI crossing up -100 and other conditions being met.
Sell Signal Alert: Triggered when a sell signal occurs based on CCI crossing down +100 and other conditions being met.
Any Signal Alert: This is a combined alert that triggers for either a buy or sell signal. It helps you stay updated on both types of signals simultaneously.
How to Use:
The indicator will plot buy and sell arrows on the chart, giving clear entry points for trades based on CCI and EMA conditions.
The ATR stop loss and take profit dots (when enabled) provide automatic risk management levels, adjusting dynamically with market volatility.
Traders can customize the ATR settings to fine-tune their stop loss and take profit levels, making this strategy adaptable to different trading styles and market conditions.
P/L CalculatorDescription of the P/L Calculator Indicator
The P/L Calculator is a dynamic TradingView indicator designed to provide traders with real-time insights into profit and loss metrics for their trades. It visualizes key levels such as entry price, profit target, and stop-loss, while also calculating percentage differences and net profit or loss, factoring in fees.
Features:
Customizable Input Parameters:
Entry Price: Define the starting price of the trade.
Profit and Stop-Loss Levels (%): Set percentage thresholds for targets and risk levels.
USDT Amount: Specify the trade size for precise calculations.
Trade Type: Choose between "Long" or "Short" positions.
Visual Representation:
Entry Price, Profit Target, and Stop-Loss levels are plotted as horizontal lines on the chart.
Line styles, colors, and thicknesses are fully customizable for better visibility.
Real-Time Metrics:
Percentage difference between the live price and the entry price is calculated dynamically.
Profit/Loss (P/L) and fees are computed in real time to display net profit or loss.
Alerts:
Alerts are triggered when:
The live price hits the profit target.
The live price crosses the stop-loss level.
The price reaches the specified entry level.
A user-defined percentage difference is reached.
Labels and Annotations:
Displays percentage difference, P/L, and fee information in a clear label near the live price.
Custom Fee Integration:
Allows input of trading fees (%), enabling accurate net profit or loss calculations.
Price Scale Visualization:
Displays the percentage difference on the price scale for enhanced context.
Use Case:
The P/L Calculator is ideal for traders who want to monitor their trades' performance and make informed decisions without manually calculating metrics. Its visual cues and alerts ensure you stay updated on critical levels and price movements.
This indicator supports a wide range of trading styles, including swing trading, scalping, and position trading, making it a versatile tool for anyone in the market.

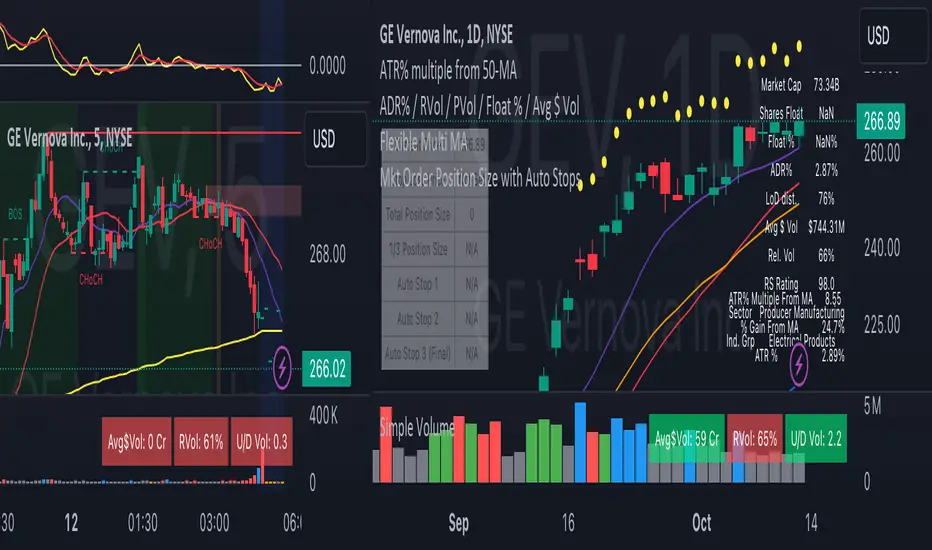
Smart Money Breakouts [iskess 01-02 11:05]This is an big update to the excellent Smart Money Breakout Script published in Oct 2023 by ChartPrime who, to my knowledge, was the original author.
FULL CREDIT GOES TO CHARTPRIME FOR THIS ORIGINAL WORK.
Per the moderator's rules, you will find below a meaningful, detailed self-contained description that does not rely on delegation to the open source code or links to other content. You will find in the description details on what the script does, how it does that, how to use it, and how it is original.
The "Smart Money Breakouts" indicator is designed to identify breakouts based on changes in character (CHOCH) or breaks of structure (BOS) patterns, facilitating automated trading with user-defined Take Profit (TP) level.
The indicator incorporates essential elements such as volume analysis and a data table to assist traders in optimizing their strategies.
🔸Breakout Detection:
The indicator scans price movements for "Change in Character" (CHOCH) and "Break of Structure" (BOS) patterns, signaling potential breakout opportunities in the market.
🔸User-Defined TP/SL :
Traders can customize the Take Profit (TP) and Stop Loss (SL) through the indicator settings, with these levels dynamically calculated based on the Average True Range (ATR). This allows for precise risk management and profit targets that adapt to market volatility. Traders can also select the lookback period for the TP/SL calculations.
🔸Volume Analysis and Trade Direction Specific Analysis:
The indicator includes a volume checker that provides valuable insights into the strength of the breakout, taking into account trade direction.
🔸If the volume label is red and the trade is long, it suggests a higher likelihood of hitting the Stop Loss (SL).
🔸If the volume label is green and the trade is long, it indicates a higher probability of hitting the Take Profit (TP).
🔸For short trades, a red volume label suggests a higher likelihood of hitting TP, while a green label suggests a higher likelihood of hitting SL.
🔸A yellow volume label suggests that the volume is inconclusive, neither favoring bullish nor bearish movements.
🔸Data Table:
The indicator features a data table that keeps track of the number of winning and losing trades for specific timeframes or configurations. It also shows the percentage of profits vs losses, and the overall profit/loss for the selected lookback period.
This table serves as a valuable tool for traders to analyze performance and discover optimal settings and timeframes.
The "Smart Money Breakouts" indicator provides traders with a comprehensive solution for breakout trading, combining technical analysis of changes in character and breaks of structure, volume insights, and performance tracking while dynamically adjusting TP and SL levels based on market volatility through the ATR.
This version of the script is a "significant improvement" from Chart Prime's original work in the following ways:
- A selectable range of candles for the profit/loss calculations to look back on.
- An updated table that includes the percentage of wins/losses, and and overall P&L during the selected lookback range.
- The user can now select only Long trades, Short trades, or both.
- The percentage gain/loss is now indicated for every trade on the chart.
- The user can now select a different multiplier for Stop Loss or Take Profit thresholds.

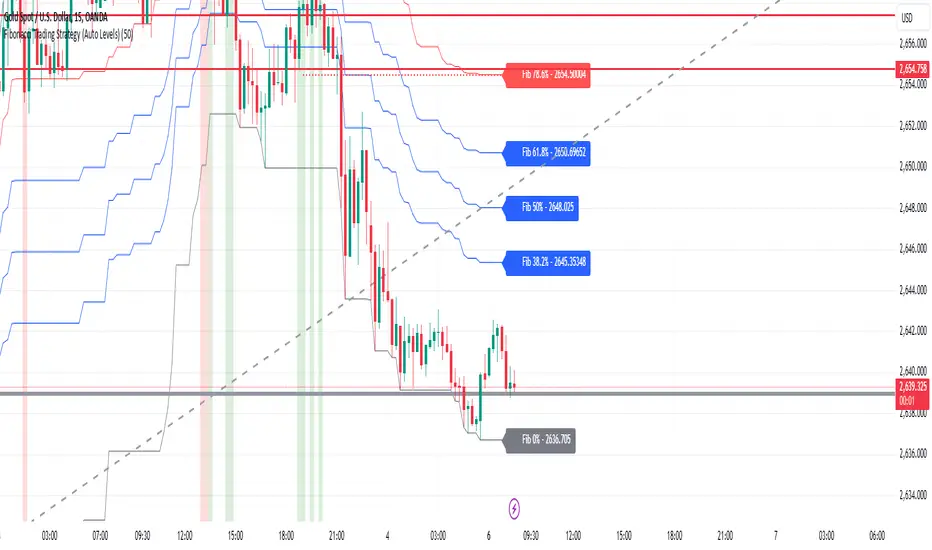
Fibonacci Trading Strategy (Auto Levels)How It Works
Swing Highs and Lows Detection:
The script identifies the highest high and lowest low over a specified lookback period (default: 50 candles). These points are used as the basis for Fibonacci calculations.
Fibonacci Levels:
Fibonacci retracement levels: 0%, 38.2%, 50%, 61.8%, 78.6%, and 100%.
Fibonacci extension levels: 127.2%, 161.8%, 200%, 261.8%, and 361.8%.
Each level is plotted on the chart with a specific color and labeled with the corresponding price.
Entry Zones:
Pullback Area: Between the 50% and 61.8% retracement levels. This area is highlighted in green, indicating a potential entry for conservative traders.
Full Margin Area: Between the 61.8% and 78.6% retracement levels. This area is highlighted in red, suggesting a higher-risk entry for aggressive traders.
Stop Loss (SL):
The Stop Loss is placed at the 78.6% Fibonacci retracement level. A dotted red line is drawn at this level to provide a visual reference for risk management.
Entry labels include the Stop Loss price for clarity.
Take Profit (TP) Levels:
Multiple take-profit targets are identified using Fibonacci extension levels (127.2%, 161.8%, 200%, 261.8%, and 361.8%).
Each level is labeled with the price and target percentage.
Visual Aids:
The script dynamically labels each Fibonacci level with its corresponding price.
Entry points (Pullback and Full Margin) are marked with clear labels, including the recommended Stop Loss.
Background highlights help distinguish the Pullback and Full Margin areas.
Strategy Highlights
Risk Management:
Incorporates a well-defined Stop Loss at the 78.6% level to limit downside risk.
Multiple take-profit levels help traders scale out of positions gradually.
Automation:
Automatically recalculates levels when new swing highs or lows are detected, ensuring accuracy in dynamic markets.
Customizability:
Users can adjust the lookback period to suit different timeframes or trading styles.
Clarity:
Clean visuals and detailed labels ensure the strategy is easy to interpret and apply.
When to Use
The strategy is suitable for trend-following traders looking to enter during pullbacks in an established trend.
It works best in trending markets where Fibonacci levels often act as strong support or resistance.
Example Scenario
Bullish Setup:
Price retraces to the 50%-61.8% area (Pullback Area) after a swing high.
A buy order is placed in this zone, with the Stop Loss at the 78.6% level.
Profit targets are set at the 127.2%, 161.8%, and higher Fibonacci extensions.
Bearish Setup:
In a downtrend, price retraces upward to the 50%-61.8% zone.
A sell order is placed, with the Stop Loss at the 78.6% level and take-profit levels below.
Dynamic Display for Max/Min MA Types with Fake-Out FilterDynamic Moving Average Max/Min Indicator with Step Line Break
**** select the setting to STEP LINE BREAK****
This indicator provides a powerful way to identify dynamic entry and stop-loss levels for both long and short trades. It calculates the maximum and minimum values of a selected moving average (MA) over a specified lookback period, adapting dynamically to market conditions. It features options for various MA types, including SMA, EMA, HMA, RMA, and DEMA, to suit different trading strategies and styles.
How It Works
1. Moving Average Selection: Choose the type of moving average (SMA, EMA, HMA, RMA, or DEMA) and its period (e.g., HMA 13).
2. Max/Min Calculation: The indicator calculates the highest and lowest values of the selected moving average over a specified lookback period (e.g., 5 candles).
3. Dynamic Plotting:
• Bullish Market: When the price breaks the Max MA level, the Min level is plotted, trailing upward as a potential stop-loss for long trades.
• Bearish Market: When the price breaks the Min MA level, the Max level is plotted, trailing downward as a potential stop-loss for short trades.
4. Fake-Out Filter: If a candle breaks the Max/Min level but closes within the range (indicating a fake-out), the plots do not switch. This can cause repainting during volatile conditions, so use caution in high-wick markets.
Features
• Customizable Inputs: Adjust MA type, period, lookback, and timeframe to suit your trading strategy.
• Multi-Timeframe Flexibility: Works on all timeframes, from micro-scalping on the 1-minute chart to swing trading on higher timeframes.
• Trend Confirmation: Provides clear indications of when to enter or exit based on dynamic levels.
• Risk Management: Highlights stop-loss levels that trail the trend, helping to lock in profits or limit losses.
Advantages
1. Clear Entry/Exit Points: Provides actionable signals for both long and short trades, with defined stop-loss locations.
2. Customizable for Any Style: Tailor the indicator to your product, timeframe, and trading approach (scalping or swing trading).
3. Trend-Focused Guidance: Helps avoid counter-trend trades by showing the dominant trend direction.
4. Adaptive to Market Conditions: The dynamic nature of the indicator allows it to respond to both trending and consolidating markets.
Limitations
1. Repainting During Fake-Outs: The indicator can repaint during volatile periods with long wicks, as it filters for fake-out candles. This may create noise in certain market conditions.
2. Optimization Required: The ideal settings for MA type, period, and lookback are dependent on the market profile and need to be fine-tuned by the trader.
3. Less Effective in Consolidation: In sideways or choppy markets, the indicator may produce less reliable signals unless adjusted for lower sensitivity.
Trading Tips
• Use this indicator to focus on trending markets, avoiding trades against the prevailing trend. For example, during an uptrend, only take long trades and avoid shorts.
• Consider having two configurations: one for trending markets and one for consolidating markets, switching between them as needed.
• Pair this indicator with volume analysis, price action, or other complementary tools to increase accuracy and reduce noise.
This indicator is designed to be both an entry and risk management tool, enabling traders to make informed decisions while keeping risks in check.

PreannFXExplanation of the PreannFX indicator:
Candle Body Size:
The body of the current candle is larger than the previous candle.
Bullish Engulfing:
The current candle closes higher than the previous candle's high.
The body size is larger than the previous candle.
Bearish Engulfing:
The current candle closes lower than the previous candle's low.
The body size is larger than the previous candle.
Entry and Exit:
Bullish: Enter at the previous candle's open or high, stop loss at the previous low, and take profit is 1:1 with the stop loss.
Bearish: Enter at the previous candle's open or low, stop loss at the previous high, and take profit is 1:1 with the stop loss.
Visualization:
Green upward arrows for bullish engulfing patterns.
Red downward arrows for bearish engulfing patterns.

RISK MANAGEMENT TABLEThis updated Risk Management Indicator is a powerful and customizable tool designed to help traders effectively manage risk on every trade. By dynamically calculating position size, stop-loss, and take-profit levels, it enables traders to stay disciplined and follow predefined risk parameters directly on their charts.
Features:
Dynamic Stop-Loss and Take-Profit Levels:
Stop-loss is based on the Average True Range (ATR), offering a flexible way to account for
market volatility.
Take-profit levels can be customized as a percentage of the entry price, providing a clear
target for trade exits.
Position Sizing Calculation:
The indicator computes the maximum position size by considering:
Trade amount (montant_ligne).
Risk percentage per trade.
Transaction fees.
Visual Representation:
Displays stop-loss and take-profit levels on the chart as customizable lines.
Optional visibility of these lines through checkboxes in the settings panel.
Comprehensive Risk Table:
A table on the chart summarizes essential risk metrics:
Stop-loss value.
Distance from entry in percentage.
Position size (maximum suggested).
Take-profit price.
Customizable:
Adjust parameters like ATR length, smoothing type, risk percentage, transaction fees,
and take-profit percentage.
Modify the visual length of lines representing stop-loss and take-profit levels.
How It Works:
Stop-Loss Calculation:
The stop-loss level is calculated using ATR and a volatility factor (default: 2).
This ensures your stop-loss adapts to market conditions.
Take-Profit Calculation:
Take-profit is derived as a percentage increase from the entry price.
Position Size:
The optimal position size is computed as:
Position Size = Risk per Trade /ATR-based Stop Distance
The risk per trade deducts transaction fees to provide a more accurate calculation.
Visual Lines:
Risk Table:
The table displays updated stop-loss, position size, and take-profit metrics at a glance.
Settings Panel:
Length: ATR length for calculating market volatility.
Smoothing: Choose RMA, SMA, EMA, or WMA for ATR smoothing.
Trade Amount: The capital allocated to a single trade.
Risk by Trade (%): Define how much of your trade capital is at risk per trade.
Transaction Fees: Input fees to ensure realistic calculations.
Take Profit (%): Specify your desired take-profit percentage.
Show Entry Stop Loss: Toggle visibility of the stop-loss line.
Show Entry Take Profit: Toggle visibility of the take-profit line.

Filtered ATR with EMA OverlayFiltered ATR with EMA Overlay is an advanced volatility indicator designed to provide a more accurate representation of market conditions by smoothing the standard Average True Range (ATR). This is achieved by filtering out extreme price movements and abnormal bars that can distort traditional ATR calculations.
The indicator applies an Exponential Moving Average (EMA) to the filtered ATR, creating a dual-layered system that highlights periods of increased or decreased volatility.
Key Features:
Filtered ATR: Filters out extreme bars, reducing noise and making the ATR line more reliable.
EMA Overlay: An EMA (default period of 10) is applied to the filtered ATR, allowing traders to track average volatility trends.
Volatility Signals:
Filtered ATR > EMA(10): Indicates higher-than-average volatility. This often correlates with trend breakouts or strong price movements.
Filtered ATR < EMA(10): Suggests reduced volatility, signaling potential consolidation or sideways price action.
Parameters:
atrLength (Default: 5):
The number of bars used to calculate the ATR. A shorter period (e.g., 3-5) responds faster to price changes, while a longer period (e.g., 10-14) provides smoother results.
multiplier (Default: 1.8):
Controls the sensitivity of the filter. A lower multiplier (e.g., 1.5) filters out more bars, resulting in smoother ATR. Higher values (e.g., 2.0) allow more bars to pass through, retaining more price volatility.
maxIterations (Default: 20):
The maximum number of bars processed to detect abnormal values. Increasing this may improve accuracy at the cost of performance.
ema10Period (Default: 10):
The period for the Exponential Moving Average applied to the filtered ATR. Shorter periods provide faster signals, while longer periods give smoother, lagging signals.
Trading Strategies:
1. Breakout Strategy:
When filtered ATR crosses above EMA(10):
Enter long positions when price breaks above a key resistance level.
Higher volatility suggests strong price action and momentum.
When filtered ATR drops below EMA(10):
Exit positions or tighten stop-loss orders as volatility decreases.
Lower volatility may indicate consolidation or trend exhaustion.
2. Trend Following Strategy:
Use the filtered ATR line to track overall volatility.
If filtered ATR consistently stays above EMA: Hold positions or add to trades.
If filtered ATR remains below EMA: Reduce position size or stay out of trades.
3. Mean Reversion Strategy:
When filtered ATR spikes significantly above EMA, it may indicate market overreaction.
Look for price to revert to the mean once ATR returns below the EMA.
4. Stop-Loss Adjustment:
As volatility increases (ATR above EMA), widen stop-loss levels to avoid being stopped out by random fluctuations.
In low volatility (ATR below EMA), tighten stop-losses to minimize losses during low activity periods.
Benefits:
Reduced Noise: By filtering abnormal bars, the indicator provides cleaner signals.
Better Trend Detection: EMA smoothing highlights volatility trends.
Adaptable: The indicator can be customized for scalping, day trading, or swing trading.
Intuitive Visualization: Traders can visually see volatility shifts and adjust strategies in real-time.
Best Practices:
Timeframes: Works effectively on all timeframes, but higher timeframes (e.g., 1H, 4H, Daily) yield more reliable signals.
Markets: Suitable for forex, crypto, stocks, and commodities.
Combining Indicators: Use in combination with RSI, Moving Averages, Bollinger Bands, or price action analysis for stronger signals.
How It Works (Under the Hood):
The script calculates the Daily Range (High - Low) for each bar.
The largest and smallest bars are filtered out if their difference exceeds the multiplier (default 1.8).
The remaining bars are averaged to generate the filtered ATR.
An EMA(10) is then applied to the filtered ATR for smoother visualization.

Bewakoof stock indicator**Title**: "Bewakoof Stock Indicator: Multi-Timeframe RSI and SuperTrend Entry-Exit System"
---
### Description
The **Bewakoof Stock Indicator** is an original trading tool that combines multi-timeframe RSI analysis with the SuperTrend indicator to create reliable entry and exit signals for trending markets. This indicator is designed for traders looking to follow strong trends with built-in risk management. By filtering entries through short- and long-term momentum and utilizing dynamic trailing exits, this indicator provides a structured approach to trading.
#### Indicator Components
1. **Multi-Timeframe RSI Analysis**:
- The Relative Strength Index (RSI) is calculated across three timeframes: Daily, Weekly, and Monthly.
- By examining multiple timeframes, the indicator confirms that trends align over short, medium, and long-term intervals, making buy signals more reliable.
- **Buy Condition**: All three RSI values must meet these thresholds:
- **Daily RSI > 50** – indicates short-term upward momentum,
- **Weekly RSI > 60** – signals medium-term strength,
- **Monthly RSI > 60** – confirms long-term trend alignment.
- This filtering process ensures that buy signals are generated only in stable, upward-trending markets.
2. **SuperTrend Confirmation**:
- The SuperTrend (20-period ATR with a multiplier of 2) acts as a trend filter and trailing stop mechanism.
- For a buy condition to be valid, the closing price must be above the SuperTrend level, verifying that the market is trending up.
- The combination of RSI and SuperTrend helps to avoid false signals, focusing only on well-established trends.
#### Trade Signals
- **Buy Signal**: When both the multi-timeframe RSI and SuperTrend conditions are met, a buy signal is triggered, indicated by a “BUY” label on the chart with details:
- **Entry Price**,
- **Initial Stop-Loss** (set at the SuperTrend level for risk control),
- **Target 1** – calculated with a 1:1 risk-reward ratio based on the initial stop-loss,
- **Target 2** – calculated with a 1:2 risk-reward ratio based on the initial stop-loss.
- **Exit Signals**: This indicator provides two exit strategies to protect profits:
1. **Fixed Stop-Loss**: Automatically set at the SuperTrend level at the time of entry to limit risk.
2. **Trailing Exit**: Exits are triggered if the price crosses below the SuperTrend level, adapting to potential trend reversals.
#### Labeling & Alerts
The **Bewakoof Stock Indicator** offers intuitive labeling and alert options:
- **Labels**: Buy and exit points are clearly marked, showing entry, stop-loss, and targets directly on the chart.
- **Alerts**: Custom alerts can be set for:
- **Buy signals** when both conditions are met, and
- **Exit signals** triggered by the stop-loss or trailing exit.
#### Use Case and Benefits
This indicator is ideal for trend-following traders who value risk control and trend confirmation:
- **Stronger Trend Signals**: By requiring RSI alignment across multiple timeframes, this indicator focuses only on trades with strong trend momentum.
- **Dynamic Risk Management**: Using both fixed and trailing exits enables flexible trade management, balancing risk and potential reward.
- **Simple Trade Execution**: The chart labels and alerts simplify trade decisions, making it easy to enter, manage, and exit trades.
#### How to Use
1. **Add** the Bewakoof Stock Indicator to your chart.
2. **Watch** for the "BUY" label as your entry point.
3. **Manage the trade** using the labeled stop-loss and target levels.
4. **Exit** on either a stop-loss hit or when the price crosses below the SuperTrend for a trailing exit.
The **Bewakoof Stock Indicator** is a complete solution for trend-following traders, combining the strength of multi-timeframe RSI with the SuperTrend’s trend-following capabilities. This systematic approach aims to provide high-confidence entries and effective risk management, empowering traders to follow trends with precision and control.

Target Trend [BigBeluga]The Target Trend indicator is a trend-following tool designed to assist traders in capturing directional moves while managing entry, stop loss, and profit targets visually on the chart. Using adaptive SMA bands as the core trend detection method, this indicator dynamically identifies shifts in trend direction and provides structured exit points through customizable target levels.
SP500:
🔵 IDEA
The Target Trend indicator’s concept is to simplify trade management by providing automated visual cues for entries, stops, and targets directly on the chart. When a trend change is detected, the indicator prints an up or down triangle to signal entry direction, plots three customizable target levels for potential exits, and calculates a stop-loss level below or above the entry point. The indicator continuously adapts as price moves, making it easier for traders to follow and manage trades in real time.
When price crosses a target level, the label changes to a check mark, confirming that the target has been achieved. Similarly, if the stop-loss level is hit, the label changes to an "X," and the line becomes dashed, indicating that the stop loss has been activated. This feature provides traders with a clear visual trail of whether their targets or stop loss have been hit, allowing for easier trade tracking and exit strategy management.
🔵 KEY FEATURES & USAGE
SMA Bands for Trend Detection: The indicator uses adaptive SMA bands to identify the trend direction. When price crosses above or below these bands, a new trend is detected, triggering entry signals. The entry point is marked on the chart with a triangle symbol, which updates with each new trend change.
Automated Targets and Stop Loss Management: Upon a new trend signal, the indicator automatically plots three price targets and a stop loss level. These levels provide traders with structured exit points for potential gains and a clear risk limit. The stop loss is placed below or above the entry point, depending on the trend direction, to manage downside risk effectively.
Visual Target and Stop Loss Validation: As price hits each target, the label beside the level updates to a check mark, indicating that the target has been reached. Similarly, if the stop loss is activated, the stop loss label changes to an "X," and the line becomes dashed. This feature visually confirms whether targets or stop losses are hit, simplifying trade management.
The indicator also marks the entry price at each trend change with a label on the chart, allowing traders to quickly see their initial entry point relative to current price and target levels.
🔵 CUSTOMIZATION
Trend Length: Set the lookback period for the trend-detection SMA bands to adjust the sensitivity to trend changes.
Targets Setting: Customize the number and spacing of the targets to fit your trading style and market conditions.
Visual Styles: Adjust the appearance of labels, lines, and symbols on the chart for a clearer view and personalized layout.
🔵 CONCLUSION
The Target Trend indicator offers a streamlined approach to trend trading by integrating entry, target, and stop loss management into a single visual tool. With automatic tracking of target levels and stop loss hits, it helps traders stay focused on the current trend while keeping track of risk and reward with minimal effort.

Multi Fibonacci Supertrend with Signals【FIbonacciFlux】Multi Fibonacci Supertrend with Signals (MFSS)
Overview
The Multi Fibonacci Supertrend with Signals (MFSS) is an advanced technical analysis tool that combines multiple Supertrend indicators using Fibonacci ratios to identify trend directions and potential trading opportunities.
Key Features
1. Fibonacci-Based Supertrend Levels
* Factor 1 (Weak) : 0.618 - The golden ratio
* Factor 2 (Medium) : 1.618 - The Fibonacci ratio
* Factor 3 (Strong) : 2.618 - The extension ratio
2. Visual Components
* Multi-layered Trend Lines
* Different line weights for easy identification
* Progressive transparency from Factor 1 to Factor 3
* Color-coded trend directions (Green for bullish, Red for bearish)
* Dynamic Fill Areas
* Gradient fills between price and trend lines
* Visual representation of trend strength
* Automatic color adjustment based on trend direction
* Signal Indicators
* Clear BUY/SELL labels on chart
* Position-adaptive signal placement
* High-visibility color scheme
3. Signal Generation Logic
The system generates signals based on two key conditions:
* Primary Condition :
* BUY : Price crossunder Supertrend2 (Factor 1.618)
* SELL : Price crossover Supertrend2 (Factor 1.618)
* Confirmation Filter :
* Signals only trigger when Supertrend3 confirms the trend direction
* Reduces false signals in volatile markets
Technical Details
Input Parameters
* ATR Period : 10 (default)
* Customizable for different market conditions
* Affects sensitivity of all Supertrend levels
* Factor Settings :
* All factors are customizable
* Default values based on Fibonacci sequence
* Minimum value: 0.01
* Step size: 0.01
Alert System
* Built-in alert conditions
* Customizable alert messages
* Real-time notification support
Use Cases
* Trend Trading
* Identify strong trend directions
* Filter out weak signals
* Confirm trend continuations
* Risk Management
* Multiple trend levels for stop-loss placement
* Clear entry and exit signals
* Trend strength visualization
* Market Analysis
* Multi-timeframe analysis capability
* Trend strength assessment
* Market structure identification
Benefits
* Reliability
* Based on proven Supertrend algorithm
* Enhanced with Fibonacci mathematics
* Multiple confirmation levels
* Clarity
* Clear visual signals
* Easy-to-interpret interface
* Reduced noise in signal generation
* Flexibility
* Customizable parameters
* Adaptable to different markets
* Suitable for various trading styles
Performance Considerations
* Optimized code structure
* Efficient calculation methods
* Minimal resource usage
Installation and Usage
Setup
* Add indicator to chart
* Adjust parameters if needed
* Enable alerts as required
Best Practices
* Use with other confirmation tools
* Adjust factors based on market volatility
* Consider timeframe appropriateness
Backtesting Results and Strategy Performance
This indicator is specifically designed for pullback trading with optimized risk-reward ratios in trend-following strategies. Below are the detailed backtesting results from our proprietary strategy implementation:
BTCUSDT Performance (Binance)
* Test Period: Approximately 7 years
* Risk-Reward Ratio: 2:1
* Take Profit: 8%
* Stop Loss: 4%
Key Metrics (BTCUSDT):
* Net Profit: +2,579%
* Total Trades: 551
* Win Rate: 44.8%
* Profit Factor: 1.278
* Maximum Drawdown: 42.86%
ETHUSD Performance (Binance)
* Risk-Reward Ratio: 4.33:1
* Take Profit: 13%
* Stop Loss: 3%
Key Metrics (ETHUSD):
* Net Profit: +8,563%
* Total Trades: 581
* Win Rate: 32%
* Profit Factor: 1.32
* Maximum Drawdown: 55%
Strategy Highlights:
* Optimized for pullback trading in strong trends
* Focus on high risk-reward ratios
* Proven effectiveness in major cryptocurrency pairs
* Consistent performance across different market conditions
* Robust profit factor despite moderate win rates
Note: These results are from our proprietary strategy implementation and should be used as reference only. Individual results may vary based on market conditions and implementation.
Important Considerations:
* The strategy demonstrates strong profitability despite lower win rates, emphasizing the importance of proper risk-reward ratios
* Higher drawdowns are compensated by significant overall returns
* The system shows adaptability across different cryptocurrencies with consistent profit factors
* Results suggest optimal performance in volatile crypto markets
Real Trading Examples
BTCUSDT 4-Hour Chart Analysis
Example of pullback strategy implementation on Bitcoin, showing clear trend definition and entry points
ETHUSDT 4-Hour Chart Analysis
Ethereum chart demonstrating effective signal generation during strong trends
BTCUSDT Detailed Signal Example (15-Minute Scalping)
Close-up view of signal generation and trend confirmation process on 15-minute timeframe, demonstrating the indicator's effectiveness for scalping operations
Chart Analysis Notes:
* Green and red zones clearly indicate trend direction
* Multiple timeframe confirmation visible through different Supertrend levels
* Clear entry signals during pullbacks in established trends
* Precise stop-loss placement opportunities below support levels
Implementation Guidelines:
* Wait for main trend confirmation from Factor 3 (2.618)
* Enter trades on pullbacks to Factor 2 (1.618)
* Use Factor 1 (0.618) for fine-tuning entry points
* Place stops below the relevant Supertrend level
Footnotes:
* Charts provided are from Binance exchange, using both 4-hour and 15-minute timeframes
* Trading view screenshots captured during actual market conditions
* Indicators shown: Multi Fibonacci Supertrend with all three factors
* Time period: Recent market activity showing various market conditions
Important Notice:
These charts are for educational purposes only. Past performance does not guarantee future results. Always conduct your own analysis and risk management.
Disclaimer
This indicator is for informational purposes only. Past performance is not indicative of future results. Always conduct proper risk management and due diligence.
License
Open source under MIT License
Author's Note
Contributions and suggestions for improvement are welcome. Please feel free to fork and enhance.

Risk Manage Position SizerThis is a risk management tool for traders. It calculates position sizes based on account balance and risk tolerance, and provides automated stop-loss suggestions. The script displays key information in a small table on the chart and plots important price levels.
How to use it:
Input Parameters:
Account Size: Enter your total trading account balance.
Risk Percentage: Set the percentage of your account you're willing to risk per trade.
Use Custom Stop Loss: Toggle this to use a manually entered stop loss price.
Custom Stop Loss Price: If enabled, enter your desired stop loss price.
Reading the Table:
The table displays:
Current Price
Stop Loss Price
Total Position Size (number of shares/contracts to trade)
1/3 Position Size (for scaling in/out)
Auto Stop 1, 2, and 3 (suggested stop loss levels)
Chart Indicators:
Red Line: Your stop loss level
Green Line: Auto Stop 1 (33% of range from entry to stop)
Yellow Line: Auto Stop 2 (67% of range)
Red Line: Auto Stop 3 (final stop, same as initial stop loss)
Trading Application:
Use the Total Position Size to determine how many shares/contracts to trade.
Consider using the 1/3 Position Size for scaling in or out of trades.
Use the Auto Stops to manage your risk as the trade progresses.
Customization:
Adjust the input parameters to fit your trading style and risk tolerance.
The script can be modified to add more features or change the calculation methods if needed.
This tool helps traders make more informed decisions about position sizing and stop placement, potentially improving risk management in their trading strategy. Remember, while this script provides suggestions, all trading decisions should be made based on your own analysis and risk tolerance.
Volume-Supported Linear Regression Trend TableThe "Volume-Supported Linear Regression Trend Table" (VSLRT Table) script helps traders identify buy and sell opportunities by analyzing price trends and volume dynamics across multiple timeframes. It uses linear regression to calculate the trend direction and volume strength, visually representing this data with color-coded signals on the chart and in a table. Green signals indicate buying opportunities, while red signals suggest selling, with volume acting as confirmation of trend strength. Traders can use these signals for both short and long positions, with additional risk management and multi-timeframe validation to enhance the strategy.
------------------------------------------------------------------------------
To use the "Volume-Supported Linear Regression Trend Table" (VSLRT Table) script in a trading strategy, you would incorporate it into your decision-making process to identify potential buy and sell opportunities based on the trend and volume dynamics. Here’s how you could apply it for trading:
1. Understanding the Key Elements:
Trend Direction (Slope of Price): The script uses linear regression to assess the trend direction of the price. If the price slope is positive, the asset is likely in an uptrend; if it's negative, the asset is in a downtrend.
Volume-Backed Signals: The buy or sell signal is not only based on the price trend but also on volume. Volume is crucial in validating the strength of a trend; large volume often indicates strong interest in a direction.
2. Interpreting the Table and Signals:
The table displayed at the bottom-right of your TradingView chart gives you a clear overview of the trends across different timeframes:
Trend Colors:
Green hues (e.g., ccol11, ccol12, etc.): Indicate a buying trend supported by volume.
Red hues (e.g., ccol21, ccol22, etc.): Indicate a selling trend supported by volume.
Gray: Indicates weak or unclear trends where no decisive direction is present.
Buy/Sell Signals:
The script plots triangles on the chart:
Upward triangle below the bar signals a potential buy.
Downward triangle above the bar signals a potential sell.
3. Building a Trading Strategy:
Here’s how you can incorporate the script’s information into a trading strategy:
Buy Signal (Long Entry):
Look for green triangles (indicating a buy signal) below a bar.
Confirm that the trend color in the table for the relevant timeframe is green, which shows that the buy signal is supported by strong volume.
Ensure that the price is in an uptrend (positive slope) and that volume is increasing on upward moves, as this indicates buying interest.
Execute a long position when these conditions align.
Sell Signal (Short Entry):
Look for red triangles (indicating a sell signal) above a bar.
Confirm that the trend color in the table for the relevant timeframe is red, which shows that the sell signal is supported by strong volume.
Ensure that the price is in a downtrend (negative slope) and that volume is increasing on downward moves, indicating selling pressure.
Execute a short position when these conditions align.
Exiting the Trade:
Exit a long position when a sell signal (red triangle) appears, or when the trend color in the table shifts to red.
Exit a short position when a buy signal (green triangle) appears, or when the trend color in the table shifts to green.
4. Multi-Timeframe Confirmation:
The script provides trends across multiple timeframes (tf1, tf2, tf3), which can help in validating your trade:
Short-Term Trading: Use shorter timeframes (e.g., 3, 5 minutes) for intraday trades. If both short and medium timeframes align in trend direction (e.g., both showing green), it strengthens the signal.
Longer-Term Trading: If you are trading on a higher timeframe (e.g., daily or weekly), confirm that the lower timeframes align with your intended trade direction.
5. Adding Risk Management:
Stop-Loss: Place stop-losses below recent lows (for long trades) or above recent highs (for short trades) to minimize risk.
Take Profit: Consider taking profit at key support/resistance levels or based on a fixed risk-to-reward ratio (e.g., 2:1).
Example Strategy Flow:
For Long (Buy) Trade:
Signal: A green triangle appears below a candle (Buy signal).
Trend Confirmation: Check that the color in the table for your selected timeframe is green, confirming the trend is supported by volume.
Execute Long: Enter a long trade if the price is trending upward (positive price slope).
Exit Long: Exit when a red triangle appears above a candle (Sell signal) or if the trend color shifts to red in the table.
For Short (Sell) Trade:
Signal: A red triangle appears above a candle (Sell signal).
Trend Confirmation: Check that the color in the table for your selected timeframe is red, confirming the trend is supported by volume.
Execute Short: Enter a short trade if the price is trending downward (negative price slope).
Exit Short: Exit when a green triangle appears below a candle (Buy signal) or if the trend color shifts to green in the table.
6. Fine-Tuning:
Backtesting: Before trading live, use TradingView’s backtesting features to test the strategy on historical data and optimize the settings (e.g., length of linear regression, timeframe).
Combine with Other Indicators: Use this strategy alongside other technical indicators (e.g., RSI, MACD) for better confirmation.
In summary, the script helps identify trends with volume support, giving more confidence in buy/sell decisions. Combining these signals with risk management and multi-timeframe analysis can create a solid trading strategy.

Cypher Harmonic Pattern [TradingFinder] Cypher Pattern Detector🔵 Introduction
The Cypher Pattern is one of the most accurate and advanced harmonic patterns, introduced by Darren Oglesbee. The Cypher pattern, utilizing Fibonacci ratios and geometric price analysis, helps traders identify price reversal points with high precision. This pattern consists of five key points (X, A, B, C, and D), each playing an important role in determining entry and exit points in the financial markets.
The reversal point typically occurs in the XD region, with the Fibonacci ratio ranging between 0.768 and 0.886. This zone is referred to as the Potential Reversal Zone (PRZ), where traders anticipate price changes to occur.
The Cypher harmonic pattern is popular among professional traders due to its high accuracy in identifying market trends and reversal points. The pattern appears in two forms: bullish Cypher pattern and bearish Cypher pattern.
In the bullish Cypher pattern, after a price correction, the price moves upward, while in the bearish Cypher pattern, the price moves downward after a temporary increase. These patterns help traders use technical analysis to identify strong reversal points in the PRZ and execute more optimal trades.
Bullish Cypher Pattern :
Bearish Cypher Pattern :
🔵 How to Use
The Cypher pattern is one of the most complex and precise harmonic patterns, leveraging Fibonacci ratios to help traders identify price reversals. This pattern is comprised of five key points, each playing a critical role in determining entry and exit points.
The Cypher pattern appears in two main types :
Bullish Cypher pattern : This pattern appears as an M shape on the chart and indicates a trend reversal to the upside after a price correction. Traders can prepare for buying after identifying this pattern in technical analysis.
Bearish Cypher pattern : This pattern appears as a W shape and signals the start of a downtrend after a temporary price increase. Traders can use this pattern to enter short positions.
🟣 How to Identify the Cypher Pattern on a Chart
Identifying the Cypher pattern requires precision and the use of advanced technical analysis tools. The pattern consists of four main legs, each identified using Fibonacci ratios and geometric analysis.
To spot the Cypher pattern on a chart, first, identify the five key points : X, A, B, C, and D.
XA leg : The initial move from point X to A.
AB leg : The first correction after the XA move, where the price moves to point B.
BC leg : After the correction, the price moves upwards to point C.
CD leg : The final price move that reaches point D, where a price reversal is expected.
In a bullish Cypher pattern, point D indicates the start of a new uptrend, while in a bearish Cypher pattern, point D signals the beginning of a downtrend. Correctly identifying these points helps traders determine the best time to enter a trade.
🟣 How to Trade Using the Cypher Pattern
Once the Cypher pattern is identified on the chart, traders can use it to set entry and exit points. Point D is the key point for trade entry. In the bullish Cypher pattern, the trader can enter a long position after point D forms, while in the bearish Cypher pattern, point D serves as the ideal point for entering a short position.
🟣 Entering a Buy Trade with the Bullish Cypher Pattern
In a bullish Cypher pattern, traders wait for the price to reach point D, after which they can enter a buy position. At this point, the price is expected to start rising.
🟣 Entering a Sell Trade with the Bearish Cypher Pattern
In a bearish Cypher pattern, the trader enters a sell position at point D, expecting the price to move downward after reaching this point. For additional confirmation, traders can use technical indicators such as RSI or MACD.
🟣 Risk Management in Cypher Pattern Trades
Risk management is one of the most critical aspects of any trade, and this holds true for trading the Cypher pattern. Traders should always use stop-loss orders to prevent larger losses in case the pattern fails.
In the bullish Cypher pattern, the stop-loss is usually placed slightly below point D to exit the trade if the price continues to drop.
In the bearish Cypher pattern, the stop-loss is placed above point D to limit losses if the price rises unexpectedly.
🟣 Combining the Cypher Pattern with Other Technical Tools
The Cypher pattern is a powerful tool in technical analysis, but combining it with other methods such as price action and technical indicators can improve trading accuracy.
🟣 Combining with Price Action
Traders can use price action to confirm the Cypher pattern. Candlestick patterns like reversal candlesticks can provide additional confirmation for price reversals at point D.
🟣 Using Technical Indicators
Incorporating technical indicators such as RSI and MACD can also help traders receive stronger signals for entering trades based on the Cypher pattern. These indicators help identify overbought or oversold conditions, allowing traders to make more informed decisions.
🟣 Advantages and Disadvantages of the Cypher Pattern in Technical Analysis
Advantages :
High accuracy : The Cypher pattern, using Fibonacci ratios and geometric analysis, provides high precision in identifying reversal points.
Applicable in various markets : This pattern can be used in a wide range of financial markets, including forex, stocks, and cryptocurrencies.
Disadvantages :
Rarit y: The Cypher pattern appears less frequently on charts compared to other harmonic patterns.
Complexity : Accurately identifying this pattern requires significant experience, which may be challenging for novice traders.
🔵 Setting
🟣 Logical Setting
ZigZag Pivot Period : You can adjust the period so that the harmonic patterns are adjusted according to the pivot period you want. This factor is the most important parameter in pattern recognition.
Show Valid Forma t: If this parameter is on "On" mode, only patterns will be displayed that they have exact format and no noise can be seen in them. If "Off" is, the patterns displayed that maybe are noisy and do not exactly correspond to the original pattern.
Show Formation Last Pivot Confirm : if Turned on, you can see this ability of patterns when their last pivot is formed. If this feature is off, it will see the patterns as soon as they are formed. The advantage of this option being clear is less formation of fielded patterns, and it is accompanied by the latest pattern seeing and a sharp reduction in reward to risk.
Period of Formation Last Pivot : Using this parameter you can determine that the last pivot is based on Pivot period.
🟣 Genaral Setting
Show : Enter "On" to display the template and "Off" to not display the template.
Color : Enter the desired color to draw the pattern in this parameter.
LineWidth : You can enter the number 1 or numbers higher than one to adjust the thickness of the drawing lines. This number must be an integer and increases with increasing thickness.
LabelSize : You can adjust the size of the labels by using the "size.auto", "size.tiny", "size.smal", "size.normal", "size.large" or "size.huge" entries.
🟣 Alert Setting
Alert : On / Off
Message Frequency : This string parameter defines the announcement frequency. Choices include: "All" (activates the alert every time the function is called), "Once Per Bar" (activates the alert only on the first call within the bar), and "Once Per Bar Close" (the alert is activated only by a call at the last script execution of the real-time bar upon closing). The default setting is "Once per Bar".
Show Alert Time by Time Zone : The date, hour, and minute you receive in alert messages can be based on any time zone you choose. For example, if you want New York time, you should enter "UTC-4". This input is set to the time zone "UTC" by default.
🔵 Conclusion
The Cypher harmonic pattern is one of the most powerful and accurate patterns used in technical analysis. Its high precision in identifying price reversal points, particularly within the Potential Reversal Zone (PRZ), has made it a popular tool among professional traders. The PRZ, located between the Fibonacci ratios of 0.768 and 0.886 in the XD region, offers traders a clear indication of where price reversals are likely to occur.
However, to use this pattern successfully, traders must employ proper risk management and combine it with supplementary tools like technical indicators and price action. By understanding how to utilize the PRZ, traders can enhance the accuracy of their trade entries and exits.
Ultimately, the Cypher pattern, when used in conjunction with the PRZ, helps traders make more precise decisions in the financial markets, leading to more successful and well-informed trades.

Support Resistance DynamicsThe Support Resistance Dynamics indicator is an advanced technical analysis tool designed to identify and visualize key support and resistance levels in real-time. This innovative indicator stands out from traditional support and resistance tools by employing a dynamic approach that adapts to market conditions.
Key Features:
Dynamic Level Calculation: Unlike static support and resistance indicators, this tool continuously updates levels based on recent price action, providing traders with the most relevant and up-to-date information.
Logarithmic Scale Option: The indicator offers a unique logarithmic scale feature, essential for analyzing long-term trends or assets with significant price changes. This allows for more accurate level plotting across various timeframes and price ranges.
Customizable Display: Users can adjust the number of support and resistance lines displayed, allowing for a clean and uncluttered chart view while focusing on the most significant levels.
Adaptive Slope Calculation: The indicator uses an innovative approach to calculate the slope of support and resistance lines, offering options from dynamic adaptation to fixed long-term periods. This ensures the lines remain relevant in both trending and ranging markets.
Enhanced Visualization: With customizable line colors, styles, and transparency, traders can easily distinguish between support and resistance levels, improving chart readability and analysis.
Flexible Period Settings: From dynamic calculations based on recent pivots to fixed long-term periods, the indicator adapts to various trading styles and timeframes.
The Support Resistance Dynamics indicator is particularly useful for:
Identifying potential reversal points in trends
Setting more accurate entry and exit points for trades
Placing stop-loss orders with greater precision
Recognizing breakout levels for potential new trends
By combining dynamic calculation methods with customizable visual elements, this indicator provides traders with a powerful tool for market analysis. Whether you're a day trader looking for short-term opportunities or a long-term investor analyzing macro trends, the Support Resistance Dynamics indicator offers valuable insights to enhance your trading strategy.
This indicator is provided for informational and educational purposes only. It should not be considered as financial advice or a recommendation to buy or sell any financial instrument. Past performance is not indicative of future results. Trading involves significant risk of loss. Users should conduct their own research and due diligence before making any investment decisions. The creator of this indicator is not responsible for any losses incurred from its use. Always test thoroughly on demo accounts before applying to live trading.

Trailing Stop ProTrailing Stop Pro is a sophisticated TradingView indicator designed to enhance your trading strategy by dynamically managing trailing stops based on market volatility. This tool leverages the Average True Range (ATR) to adjust stop levels, providing traders with a robust mechanism to protect profits and minimize losses.
Key Features:
Dynamic Trailing Stops: Automatically adjusts stop levels using ATR, allowing for responsive and adaptive risk management.
Customizable Inputs: Tailor the indicator to your trading style with adjustable parameters such as ATR Length, ATR Multiplier, and Source Vector.
Visual Clarity: Distinct color settings for long and short stops, with adjustable line thickness and transparency, ensuring clear visualization on your charts.
Professional Grade: The "Pro" designation signifies advanced features suitable for both novice and experienced traders seeking reliable and efficient stop management.
How It Works:
To set up the indicator, begin by defining the Chrono Point, which specifies the exact time you want the trailing stop mechanism to activate. This allows for precise control over when your stops begin to trail. Next, set the Credit Unit as the initial entry price for your trade, serving as the baseline from which the trailing stops will adjust.
The indicator uses ATR-based adjustments to determine stop levels. Customize the sensitivity of the trailing stop by adjusting the ATR Length (default is 14) and ATR Multiplier (default is 0.5). A longer ATR length smooths out volatility, while a higher multiplier increases the distance of the stop from the price.
Select your Source Vector from "High/Low," "Close," or "Open" prices as the basis for stop calculation. This flexibility allows you to align the indicator with your preferred trading strategy. The indicator plots trailing stops directly on the chart, with color-coded lines indicating long (teal) and short (red) positions. You can adjust the line thickness and transparency for optimal visibility.
The Mission Status feature automatically detects whether the trade is long or short and adjusts the trailing stop accordingly. If the price hits the trailing stop, the trade is considered exited, and the indicator calculates the profit or loss percentage.
Benefits:
Risk Management: Protect your trades from adverse market movements while locking in profits as prices move favorably.
Automation: Reduce manual intervention with automatic stop adjustments, allowing you to focus on strategic decision-making.
User-Friendly Interface: Intuitive settings and clear visual cues make it easy to integrate into your existing trading workflow.
Conclusion:
Trailing Stop Pro is an essential tool for traders looking to enhance their risk management strategies with precision and ease. By automating the trailing stop process and providing clear visual feedback, this indicator empowers you to navigate the markets with confidence. Whether you're a seasoned trader or just starting, Trailing Stop Pro offers the functionality and flexibility needed to optimize your trading performance.
The Trailing Stop Pro indicator is a tool designed to assist traders in managing risk and optimizing their trading strategies. However, it should not be considered as financial advice or a guarantee of profitability. Trading involves significant risk, and it is possible to lose more than your initial investment. Users are encouraged to thoroughly test the indicator in a demo environment and consider their own financial situation and risk tolerance before using it in live trading. Past performance is not indicative of future results, and users should seek advice from a qualified financial advisor if needed.

Price & Volume Breakout Fibonacci Probability [TradeDots]📝 OVERVIEW
The "Price & Volume Breakout Fibonacci Probability" indicator is designed to detect the probability of the maximum run-up and drawdown of each breakout trade on an asset, assisting traders in optimizing their take profit and stop loss strategies.
🧮 CALCULATIONS
The algorithm detects price and volume breakouts to activate the Fibonacci levels displayed on the chart. It calculates these levels using the period pivot high and low, with the close price of the breakout bar as the reference price.
The indicator then forward-tests within an user-selected number of bars, detecting the maximum run-up and drawdown during that period. Consequently, it calculates the probability of the price hitting either side of the Fibonacci levels, showing the likelihood of reaching take profit and stop loss targets for each breakout trade.
📊 EXAMPLE
The above example shows two breakout trades, circled within the yellow rectangle zone.
The first trade has a maximum run-up above the +0.382 Fibonacci level zone and a maximum drawdown below the -0.618 Fibonacci level zone.
When the price reaches the maximum run-up, it only has a ~45% probability of moving further upward into the last two zones (25% + 19.44%). This indicates that setting a take profit at a higher level may have less than a 50% chance of success.
Conversely, when the price reaches its maximum drawdown, there is only an ~8% probability of moving further downward into the last drawdown zone. This could indicate a potential reversal.
⚙️ SETTINGS
Breakout Condition: Determines the type of breakout condition to track: "Price", "Volume", "Price & Volume".
Backtest Period: The maximum run-up and drawdown are detected within this bar period.
Price Breakout Period: Specifies the number of bars the price needs to break out from.
Volume Breakout Period: Specifies the number of bars the volume needs to break out from.
Trendline Confirmation: Confirms that the close price needs to be above the trendline.
📈 HOW TO USE
By understanding the probabilities of price movements to both the upside and downside, traders can set take profit and stop loss targets with greater accuracy.
For instance, placing a stop loss order below the zone with the highest probability minimizes the chances of being stopped out of a profitable trade. Conversely, setting a take profit target at the zone with the highest probability increases the win rate.
Additionally, if the price breaches multiple Fibonacci levels during the breakout period, it may indicate an abnormal state, signaling a potential reversal or pullback. This can help traders exit trades in a timely manner.
Traders can adjust their take profit and stop loss levels based on their individual risk tolerance.
RISK DISCLAIMER
Trading entails substantial risk, and most day traders incur losses. All content, tools, scripts, articles, and education provided by TradeDots serve purely informational and educational purposes. Past performances are not definitive predictors of future results.

MTF - Quantum Fibonacci ATR/ADR Levels & Targets**Indicator Overview:**
The *Quantum Fibonacci Wave Mechanics* indicator is a powerful tool designed to help traders identify dynamic support, resistance, and target levels based on the Average True Range (ATR) and Average Daily Range (ADR). This indicator leverages Fibonacci ratios to calculate precise entry and target levels, providing a comprehensive approach to market analysis.
**Key Features:**
- **Dynamic ATR/ADR Levels:** Automatically calculate and plot ATR and ADR-based support and resistance levels, offering insight into market volatility and potential reversal zones.
- **Fibonacci-Based Entry Levels:** Calculate Fibonacci entry levels using the 0.618 ratio, helping traders find optimal points to enter trades.
- **Customizable Target Levels:** Set up to three target levels based on Fibonacci ratios (1.618, 2.618, 3.618), allowing for precise trade management.
- **Stop Loss Lines:** Plot stop loss lines derived from ATR and ADR calculations, ensuring risk is managed effectively.
- **EMA Integration:** Optionally plot an Exponential Moving Average (EMA) line for additional trend confirmation.
- **Customizable Color Settings:** Adjust the colors of all levels and signals to fit your charting preferences.
- **Bar Coloring Based on Signals:** Automatically color bars based on the latest buy or sell signal for easier visual identification.
- **Label Display for Key Levels:** Display labels on the chart for important levels such as entry points, target levels, and stop loss lines.
**How Users Can Benefit:**
This indicator is ideal for traders who want to blend the precision of Fibonacci analysis with the robustness of ATR/ADR calculations. Whether you're a day trader looking for short-term entry points or a swing trader seeking reliable support and resistance levels, this indicator offers a versatile toolset for enhancing your trading decisions.
**Customization Instructions:**
The *Quantum Fibonacci Wave Mechanics* indicator is highly customizable to suit different trading styles and preferences. Below is a guide on how to adjust the settings:
1. **General Settings:**
- **ADR Length:** Define the lookback period for calculating the ADR.
- **EMA Length:** Set the period for the Exponential Moving Average (EMA).
- **Timeframe:** Select the timeframe for which the levels will be calculated (e.g., daily, weekly).
2. **Display Settings:**
- **Show ATR Levels:** Toggle the display of ATR-based support and resistance levels.
- **Show ADR Levels:** Toggle the display of ADR-based support and resistance levels.
- **Show EMA Line:** Toggle the display of the EMA line.
- **Show Stop Loss Lines:** Display stop loss levels derived from ATR and ADR.
- **Show Middle Level Line:** Show the middle level between buy and sell stop loss lines.
- **Show Fibonacci Entry Levels:** Enable the display of Fibonacci-based entry levels.
- **Show Entry Signals:** Plot buy and sell signals based on the crossover of the entry levels.
- **Show Target Levels:** Display up to three target levels for both buy and sell signals.
- **Color Bars Based on Last Signal:** Automatically color bars according to the last signal (buy or sell).
3. **Fibonacci Settings:**
- **Entry Ratio (Fibonacci):** Adjust the Fibonacci ratio used for calculating entry levels (default is 0.618).
- **Target Ratios (Fibonacci):** Set the Fibonacci ratios for up to three target levels (default ratios are 1.618, 2.618, and 3.618).
4. **Color Settings:**
- **Support Levels:** Customize the color of the support lines.
- **Resistance Levels:** Customize the color of the resistance lines.
- **Stop Loss Levels:** Set the color for stop loss lines (default is red).
- **Buy Target Levels:** Set the color for buy target levels (default is white).
- **Sell Target Levels:** Set the color for sell target levels (default is yellow).
5. **Label Display Settings:**
- **Show Labels for The Levels:** Toggle the display of labels for the various levels on the chart.
**Usage Tips:**
- **Combining with Other Indicators:** Use this indicator in conjunction with other technical indicators such as RSI, MACD, or Bollinger Bands to confirm signals.
- **Adjusting to Different Timeframes:** Customize the `timeframeInput` to analyze different market conditions, from intraday to long-term trading.
- **Risk Management:** Utilize the stop loss levels to manage risk effectively, ensuring your trades are protected against adverse market movements.
**Disclaimer:**
*This indicator is provided for educational purposes only and should not be considered financial advice. Trading in financial markets involves risk, and past performance does not guarantee future results. Always conduct your own research and consult with a licensed financial advisor before making any trading decisions. The creator of this indicator is not responsible for any financial losses that may occur from using this tool.*

Custom ATR Trailing StopThis Script creates a custom ATR (Average True Range) trailing stop. It allows traders to set up automated stop-loss levels based on the ATR, which adjusts dynamically to market volatility. The script is designed to support both long and short trades, offering flexibility and precision in trade management.
When loading the indicator to your chart, simply click to set the trade begining time, confirm various settings and you are set.
Check tooltips for more details in the input settigns menu.
User Inputs
Trade Setup: Allows users to set the trade direction (Long or Short), the signal source for entries, and the specific bar time for the trade setup.
ATR Settings: Configurable ATR lookback period, ATR smoothing period, initial ATR multiplier for setting the stop-loss, breakeven ATR multiplier, and a manual breakeven level.
ATR Calculations
Computes the ATR and its moving average.
Determines initial and breakeven stop levels based on the ATR.
Signal Validation
Validates long or short trade signals based on the specified bar time and trade direction.
Triggers alerts when a valid trade signal is detected.
Trailing Stop Logic
For long trades, adjusts the stop-loss level dynamically based on the ATR.
For short trades, performs similar adjustments in the opposite direction.
Updates the trailing stop level to ensure it follows the price, moving closer as the price moves favorably.
Resets the trade state when the stop-loss is hit, triggering an alert.
Plotting
Plots the trailing stop levels on the chart.
Uses green for stop levels indicating profit and red for stop levels indicating a loss.

[INVX] Trailing StopDescription:
The Adjustable Trailing Stop Indicator is a practical tool designed to enhance your trading strategy by allowing for automatic modifications of stop-loss orders according to your specified parameters. This indicator provides a dynamic alternative to the traditional static stop-loss orders, assisting in managing your potential profits and curbing possible losses.
Features and Functionality:
The Trailing Stop Indicator provides three main inputs for customization:
"Trailing Stop Start Date" : This input enables you to set the start date for the trailing stop. From this date forward, the indicator begins tracking price changes and adjusts the stop-loss order in response.
"Trigger Delta (%)" : This represents the percentage for the trailing stop. It denotes the set percentage at which the stop order adjusts.
"Order" : This input determines whether the trailing stop applies to a Buy or Sell order. Depending on the selection, the indicator adjusts the stop price as the price escalates (for Sell order) or declines (for Buy order).
How Does the Trailing Stop Indicator Work?
The Trailing Stop Indicator functions by dynamically adjusting the stop price in line with market fluctuations. If the market price rises (for Sell order), the stop price automatically ascends, securing potential profits. In a declining market (for Buy order), the stop price descends according to the market.
This indicator eliminates the need for constant manual adjustments, reducing the impact of emotional trading and helping traders maintain their risk management strategy. By using this tool, traders can implement a more disciplined and systematic approach to trading.

QTY@RISK VWAP based calculationVWAP Volatility-Based Risk Management Calculator for Intraday Trading
Overview
This script is an innovative tool designed to help traders manage risk effectively by calculating position sizes and stop-loss levels using the Volume Weighted Average Price (VWAP) and its standard deviation (StdDev). Unlike traditional methods that rely on time-based calculations, this approach is time-independent within the intraday timeframe, making it particularly useful for traders seeking precision and efficiency.
Key Concepts
VWAP (Volume Weighted Average Price): VWAP is a trading benchmark that represents the average price a security has traded at throughout the day, based on both volume and price. It provides insight into the average price level over a specific period, helping traders understand the market trend.
StdDev (Standard Deviation): In the context of VWAP, the standard deviation measures the volatility around the VWAP. It provides a quantifiable range that traders can use to set stop-loss levels, ensuring they are neither too tight nor too loose.
How the Script Works
1. VWAP Calculation: The script calculates the VWAP continuously as the market trades, integrating both price and volume data.
2. Volatility Measurement: It then computes the standard deviation of the VWAP, giving a measure of market volatility.
3. Stop-Loss Calculation: Using user-defined StdDev factors, the script calculates two stop-loss levels. These levels adjust dynamically based on market conditions, ensuring they remain relevant throughout the trading session.
4. Position Sizing: By incorporating your risk tolerance, the script determines the appropriate position size. This ensures that your maximum loss per trade does not exceed your predefined risk value.
How to Use the Calculator
1. Select Two VWAP StdDev Factors: Choose two standard deviation factors for calculating stop-loss levels. For example, you might choose 0.5 and 0.75 to set conservative and aggressive stop-losses respectively.
2. Set Your Trading Account Size: Enter your total trading capital. For example, $50,000.
3. Maximum Lot Size: Define the maximum number of shares you are willing to trade in a single position. For instance, 200 shares.
4. Risk Value per Trade: Input the maximum amount of money you are willing to risk on a single trade. For instance, $50.
5. Plotting Options: If you wish to visualize the stop-loss levels, enable the plot option and choose the price base for the plot, such as the closing price or the average of the high and low prices (hl2).
Example of Use
1. Initial Setup: After the market opens, wait for at least 15 minutes to ensure the VWAP has stabilized with sufficient volume data.
2. Parameter Configuration: Input your desired parameters into the calculator. For instance:
- VWAP StdDev Factors: 0.5 and 0.75
- Trading Account Size: $50,000
- Maximum Lot Size: 200 shares
- Risk Value per Trade: $50
- Plot Option: On, using "hl2" or "close" as the price base
3. Execution: Based on the inputs, the script calculates the position size and stop-loss levels. If the calculated stop-loss falls within the selected VWAP StdDev range, it will provide you with precise stop-loss prices.
4. Trading: Use the calculated position size and stop-loss levels to execute your trades confidently, knowing that your risk is managed effectively.
Advantages for Traders
- Time Independence: By relying on VWAP and its StdDev, the calculations are not dependent on specific time intervals, making them more adaptable to real-time trading conditions.
- Focus on Strategy: Novice traders can focus more on their trading strategies rather than getting bogged down with complex calculations.
- Dynamic Adjustments: The script adjusts stop-loss levels dynamically based on evolving market conditions, providing more accurate and relevant risk management.
- Flexibility: Traders can tailor the calculator to their risk preferences and trading style by adjusting the StdDev factors and risk parameters.
By incorporating these concepts and using this risk management calculator, traders can enhance their trading efficiency, improve their risk management, and ultimately make more informed trading decisions.
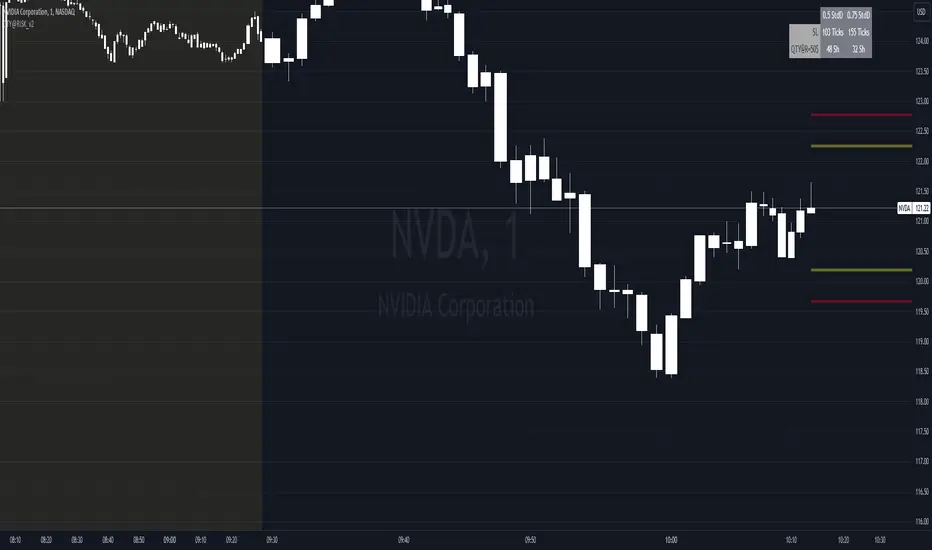
Micho 150 SMA indicatorAMEX:SPY NASDAQ:MSFT This Pine Script indicator is designed to assist traders by displaying a 150-day Simple Moving Average (SMA) and a stop loss level based on a user-defined percentage below the 150-day SMA. It also marks significant crossover events with labels and highlights potential trend changes using Golden Cross and Death Cross indicators.
Features:
150-Day Simple Moving Average (SMA):
The script calculates and plots the 150-day SMA of the closing prices. This is a common technical indicator used to determine the overall trend of a security. The 150-day SMA is plotted in gray on the chart.
Stop Loss Price:
Users can define a stop loss percentage through an input field. This percentage is used to calculate a stop loss price that is plotted 1% (or user-defined percentage) below the 150-day SMA. The stop loss line is plotted in red on the chart. This helps traders manage risk by indicating a price level where they might consider exiting a trade to prevent further losses.
Buy and Sell Signals:
The script identifies potential buy and sell signals based on crossovers of the closing price with the 150-day SMA:
Buy Signal: When the closing price crosses above the 150-day SMA.
Sell Signal: When the closing price crosses below the 150-day SMA.
Labels are plotted at the crossover points to indicate "start follow" for buy signals (in green) and "check stoploss" for sell signals (in red).
Golden Cross and Death Cross:
The script also identifies Golden Cross and Death Cross events:
Golden Cross: Occurs when the 50-day SMA crosses above the 200-day SMA. This is generally considered a bullish signal indicating a potential upward trend.
Death Cross: Occurs when the 50-day SMA crosses below the 200-day SMA. This is generally considered a bearish signal indicating a potential downward trend.
These crossover events are marked with labels on the chart: "Golden Cross" (in yellow) and "Death Cross" (in yellow)
