Probability of ATR Index [racer8]Deriving the indicator:
PAI is an indicator I created that tells you the probability of current price moving a specified ATR distance over a specified number of periods into the future. It takes into account 4 variables: the ATR & the standard deviation of price, and the 2 parameters: ATR distance and # bars (time).
The formula is very complex so I will not be able to explain it without confusion arising.
What I can say is that I used integral calculus & the Taylor series to derive a formula that calculates the area under half of the normal distribution function. Thus, the formula was repeated twice in the code to derive the full probability (half + half = whole). If you can read the code, you might be wondering why the formula is so long...
The reason for this is because in Pine Script, the erf function doesn't exist. You see, the formula for normal distribution is: f(x) = (1/sqrt(2pi))*e^(-xx/2), assuming of course that the standard deviation = 1 and mu (mean) = 1. The next step is to take the integral of this formula in order to find the area under f(x). The problem is that I found the integral, F(x), of the normal distribution formula to be equal to F(x) = erf(x/sqrt(2))/2...and the erf function cannot be directly computed into Pinescript.
So I developed a solution...why not estimate the integral function? So that's exactly what I did using a technique involving the Taylor series. The Taylor series is an algebraic function that allows you to create a new function that can estimate the existing function. On a graph, the new function has the same values as the existing one, the only difference is that it uses a differnt formula, in this case, a formula that makes it possible to compute the integral. The disadvantage of using this new formula is that it is super long and if you want it to better represent the original integral over a wider range of x-values, you have to make it longer.
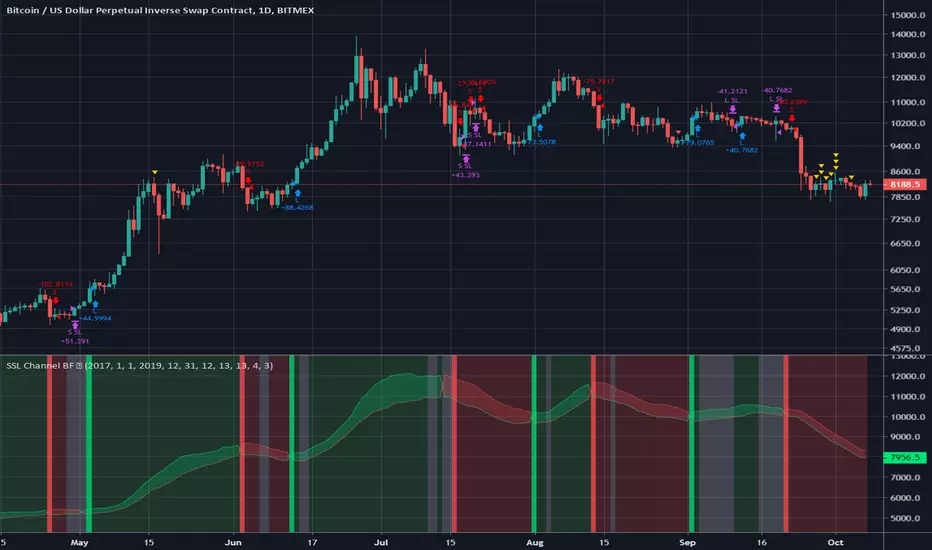
Signal Interpretion:
The hotter the colour, the more likely price will reach your specified distance.
The 2 values of PAI in the bottom window represent probability & average probability of your specifed distance geting hit.
Applications:
Stop loss placement---
This indicator is useful because it gives you an idea of the likelihood that a stop loss at a particular distance away from price (in ATRs) will be hit over a period of time specified. This is helpful in placing stop losses.
Options trading---
PAI can also be used in options trading. For example, you are using a strangle options strategy, and you want to make sure that price stays within the Strangle's profit range. So you only trade when PAI presents a low probability value of moving at a particular distance in ATRs over n periods.
Anyhow, I hope you guys like it. Enjoy! and hit that like button for me :)
在脚本中搜索"stop loss"
mForex - Bollinger Bands - Pinbar scalping systemTransaction setup parameters
Time frame: M5, M15
Currency pair: Any except XAU/USD
Trading strategies
=== BUY ===
Price break out of the lower Bollinger Bands
The Pinbar reversal candlestick appears and closes the candle on the lower Bollinger Bands
Stop loss: Nearest bottom + 3-5 pips
Profit target: 10-20 pips
=== SELL ===
Price break out of the upper Bollinger Bands
The Pinbar reversal candle appeared and closed below the upper
Stop loss: Nearest peak + 3-5 pips
Profit target: 10-20 pips
* If you have any questions or suggestions for this strategy, feel free to ask us.
Pine Script®指标
Noro's RiskChannel StrategyIndicator
The Donchian price channel is used. There are 2 methods available to close the position. The user can choose a method.
Wikipedia: en.wikipedia.org
Strategy #1 (stop-loss type = channel)
Old classic trading strategy, using breakouts of the Donchan price channel.
If the price is above the price channel top line, open the long position (and close the short position)
If the price is below the lower line of the price channel, open the short position (and close the long position)
It is recommended that you all use market stop orders.
Strategy #2 (stop-loss type = center)
This metod is better. This method is recommended.
The central line (red) is the middle of the Donchian price channel. Used to close any positions.
If the price is higher than the price channel top line, open the long position.
If the price is lower than the lower line of the price channel, open the short position.
If the price has crossed the central line of the channel, close any position.
It is recommended that you all use market stop orders.
Risk
There are 2 options. Risk for long positions and risk for short positions. This is the size of the possible loss. Order size depends on the possible loss and is calculated for each position.
For
BTC/USD, BTC/USDT, XBT/USD, ETH/USD, ETH/USD (need USD!)
Timeframes: 1h and length of price channel = 50 bars or 4h and length of price channel = 12
Pine Script®策略
Hancock - Pump Catcher [BitMEX] [Alerts]This is a study to the version of the strategy found here .
It generates 3 alerts:
CLOSE - Triggers to close all open positions
LONG - Triggers to open a long position
SHORT - Triggers to open a short position
Commands for alerts (without stop-loss) to get you started:
CLOSE - a=bitmex e=bitmextestnet c=position t=market
LONG - a=bitmex e=bitmextestnet b=long s=xbtusd l=5 q=99% t=market
SHORT - a=bitmex e=bitmextestnet b=short s=xbtusd l=5 q=99% t=market
I would advise including a stop-loss with your commands. These commands are for autoview and don't include a stop loss, use autoview command documentation to add stop-loss.
Happy trading
Hancock
Pine Script®指标
Customizable MACD (how to detect a strong convergence)Helloooo traders
I wondered once if a MACD was based on an EMA/EMA/SMA or SMA/SMA/EMA (or WHATEVA/WHATEVA/WHATEVA).
Seems they're so many alternatives out there.
I decided to empower my audience more by choosing the type of moving averages you want for your MACD.
More options doesn't always mean better performance - but who knows - some might find a config that they like with it for their favorite asset/timeframe.
I added also a multi-timeframe component because I'm a nice guy ^^
Convergence is my BEST friend
An oscillator (like MACD) is to measure how strong a momentum is - generally, traders use those indicators to confirm a trend.
So understand that a MACD (or any other indicator not based on convergence ) won't likely be sufficient for doing great on the market.
Combined with your favorite indicator, however, you may get great results.
My indicators fav cocktail is mixing :
1) an oscillator (momentum confirmation)
2) a trendline/key level break (momentum confirmation)
3) adding-up on a different trading method but still converging with the first entry.
The reason I'm deep with convergence detection is because I'm obsessed with removing those fakeout signals. You know which ones I'm talking about :)
Those trades when the market goes sideways but our capital goes South (pun 100% intended) - 2 days later, the price hasn't changed much but some lost some capital due to fees, being overexposed, buying the top/selling the bottom of a range they didn't identify.
It's publicly known that ranges are the worst traders' enemy. It's boring, not fun, and .... end up moving in the direction we expected when we go to sleep or outside.
NO ONE/BROKER/EX-GF is tracking your computer - I checked also for mine as it happened for me way too often in the past.
I surely preferred blaming a few external unknown conditions than improving my TA back in the days #bad #dave
But my backtest sir...
Our backtests show what they're being told to show . A backtest without a stop-loss/hard exit logic will show incredible results.
Then trying that backtest with live trading is like in the Matrix movie - discovering the real world is tough and we must choose between the blue pill (learning how to evaluate properly risk/opportunity caught) and the red pill (increasing the position sizing, not setting a stop loss, holding the positions hoping for the best)
Last few words
Convergences aren't invented because it's cool to mix indicators with others. (it is actually and even fun)
They're created to remove most of the fakeouts . For those that can't be removed - a strong risk management would cut most of the remaining potential big losses.
No system works 100% of the time - so a convergence system needs a back-up plan in case the converged signal is wrong (could be stop-loss, hard exit, reducing position sizing, ...)
Wishing you the BEST and happy beginning of your week
Daveatt
Pine Script®指标
SSL Channel BFSSL Channel Close is a great all-rounder based on 2 Simple Moving Averages, one of recent Highs, one of recent Lows.
The calculation prints a channel on the chart consisting of 2 lines.
This strategy gives a Long signal when price closes above the top of these 2 lines and a Short signal when it closes below the bottom.
Trading in choppy sideways markets can compound losses so we avoid that here by using recent ATR to determine relative volatility and refrain from trading when the background is White.
We use a basic 3% stop loss.
Charted on XBT/USD Bitmex Daily chart.
INSTRUCTIONS
Green = long
Red = short
White Background= No trade
The way I have set this strategy up is that if we get stopped out but we are still in a green or red background, we re-enter. Closing the trade only occurs on an opposing signal or if we get stopped out.
Pine Script®策略
Forex Master (EUR/USD)ATTENTION:
This is a symmetrical algorithm designed only for trading EUR/USD on the 1h time frame. For other currency pairs and time frames, you need to re-calibrate the RSI-EMAs as well as the profit targets and stop losses.
BACKTEST CONDITIONS:
Initial equity = $100,000 (no leverage)
Order size = 100% of equity
Pyramiding = disabled
TRADING RULES:
Long entry = EMA20(RSI10) cross> 50
Profit limit = 50 pips
Stop loss = 50 pips
Short entry = EMA30(RSI30) cross< 50
Profit limit = 50 pips
Stop loss = 50 pips
Long entry = Short exit
Short entry = long exit
DISCLAIMER: None of my ideas and posts are investment advice. Past performance is not an indication of future results. This strategy was constructed with the benefit of hindsight and its future performance cannot be guaranteed.
Pine Script®策略
Regression Slope Oscillator Strategy (Modified from BigBeluga)Regression Slope Oscillator Strategy (Modified from BigBeluga)
This strategy is based on the Regression Slope Oscillator – BigBeluga oscillator, enhanced with multi-timeframe confirmation, dual signal labeling, ATR/fixed-risk management, and visual reversal markers.
Core Concept
The oscillator calculates the averaged logarithmic regression slope across a configurable range of lookback lengths.
It identifies momentum shifts when the oscillator crosses the zero line, producing trade signals with optional multi-timeframe confirmation.
Multi-Timeframe Confirmation
Adaptive MTF filtering ensures trades are executed only when the trend aligns across neighboring timeframes:
Current TF Lower TF Higher TF
1 min 5 min 15 min
5 min 1 min 15 min
15 min 5 min 1 hour
1 hour 15 min 4 hour
A trade executes only if:
Current TF crosses the zero line.
Both lower and higher TF oscillators are on the same side of zero.
The bar is confirmed (no repainting).
Dual Signal System
MTF-Filtered Signals
“Long MTF” / “Short MTF”
Trigger only when the dynamic MTF filter is satisfied.
Used for actual strategy entries and exits.
Simple Zero-Cross Signals
“LONG” / “SHORT”
Trigger on the current timeframe only.
Useful for visual comparison of raw oscillator behavior versus filtered signals.
Reversal Dots
Added oscillator-pane dots and price-chart dots to highlight reversals against the signal line:
Red dot = bearish reversal
Lime dot = bullish reversal
Positioned either on the oscillator pane or directly above/below candles for clarity.
This visually emphasizes momentum reversals, independent of trade execution.
Risk Management
Fixed Tick Mode: User-defined take profit and stop loss in ticks.
ATR-Based Mode: Take profit and stop loss scaled by volatility with separate multipliers.
This flexibility supports scalping, day trading, or systematic momentum approaches.
Live Trend Table
Displays direction relative to zero for all major timeframes: 1 min → Daily.
Customizable text size and table visibility.
Provides a quick visual check of trend alignment across TFs.
Performance Table
Tracks total trades, wins, losses, win rate %, and average win/loss in ticks.
Helps quickly evaluate adjustments or parameter changes.
Visual Enhancements
Gradient-colored candles based on oscillator strength.
Oscillator and signal line overlay with filled background.
Reversal dots on oscillator and price chart.
Entry labels and real-time alerts for MTF trades.
Recommended Use
Traders looking for trend-aligned momentum trades.
Scenarios requiring multi-timeframe confirmation.
Lower timeframe scalping where false zero-crosses are filtered.
Visual monitoring of oscillator reversals and trade outcomes.
Pine Script®策略
Golden Pocket ZonesGolden Pocket Zones: High-Probability Reaction Zones
⚙️ Identify High-Probability Reaction Zones: The script automatically scans daily price action to plot powerful support and resistance zones based on the Golden Pocket Fibonacci retracement (50%-61.8%). These are areas where price is statistically likely to react, providing traders with a map of key market levels.
✅ Native support for Gold, Forex, Crypto, Stocks, Crude oil.
📦 Dynamic & Self-Merging Zones: The indicator identifies Golden Pockets from significant daily candles and automatically merges overlapping zones. This process consolidates multiple levels into a single, stronger, and more reliable area of interest, reducing chart noise and highlighting the most critical price boundaries.
🎯 Volatility-Adaptive Zone Height: Zone height is calculated as a percentage of the 10-day Average Daily Range (ADR10). This ensures that the zones dynamically adapt to the current market volatility. In volatile conditions, zones are wider; in calm markets, they are tighter, always remaining relevant to the instrument being traded.
💪 Strength & Age Analysis: Each zone is automatically rated for strength (4-10) based on the size of the daily candle that created it relative to the ADR10. Larger candles produce stronger zones. The age of the zone (in days) is also displayed, allowing traders to assess its relevance over time.
🔥 Proximity Heatmap: Zones are color-coded with a dynamic heatmap. The closer the current price is to a zone, the "hotter" (more orange) the color becomes. This provides an immediate visual cue to pay attention as price approaches a key reaction area.
🌍 Universal Asset Compatibility: While the logic is exceptionally powerful for Gold (XAUUSD), the indicator is designed for universal application across Futures (NQ/ES), Forex, Cryptocurrencies (BTC), and US Stocks. The ADR-based calculations ensure its principles adapt seamlessly to any market.
📌Recommended Timeframes
📦While the zones are calculated from the Daily chart, they are most effectively used for executing trades on intraday timeframes. The recommended timeframes for monitoring price action and looking for confirmation signals are:
•M30 (30-Minute)•H1 (1-Hour)•H2 (2-Hour)•H4 (4-Hour)
How to Use the Golden Pocket Zones
🕒This indicator is designed to identify high-probability areas for price reactions, not to provide direct entry signals. The core strategy is to use these zones as a map and wait for price to confirm a reaction before making a trading decision.
Identifying High-Probability Reaction Zones
✅1.Load the Indicator: Apply the "Golden Pocket Zones" indicator to your chart. With default settings, it will analyze the last 20 daily candles to generate the zones.
🎯 2.Identify Key Levels: The plotted boxes are your key areas of interest. These represent significant historical support and resistance. A zone’s strength is indicated by its rating (e.g., "S: 8"), with higher numbers indicating a more significant level.
🥇3.Watch for Price Approach: As price action on your trading timeframe (e.g., M15, H1, H4) approaches one of these daily zones, it is entering a high-probability reaction area. The zone’s color will shift from yellow to orange, signaling proximity.
⚙️4.Look for Confirmation: This is the most critical step. Do not blindly trade just because price touches a zone. Instead, wait for a clear confirmation signal on a lower timeframe. This could be:
•Candlestick Patterns: A bullish engulfing pattern, a hammer, or a doji at a support zone.
•Chart Patterns: A double bottom forming within a zone or a breakout and retest of a smaller pattern.
•Divergence: Bullish or bearish divergence on an oscillator like RSI or MACD as price interacts with the zone.
Trading Strategy & Logic
📌 Entry Logic
1.Patience is Key: Allow price to travel to a pre-identified Golden Pocket Zone. Do not chase the market.
2.Wait for Confirmation: Once price enters the zone, switch to a lower timeframe (e.g., from H4 to M15) and wait for a clear entry signal (like a bullish candlestick pattern for a long trade at a support zone).
3.Enter on Confirmation: Execute your trade once your entry criteria are met. The zone itself provides the context for the trade.
🛑 Stop Loss (SL) Placement
•For a Long Trade (at a support zone): Place your stop loss a reasonable distance below the lower boundary of the zone. The zone itself acts as a buffer.
•For a Short Trade (at a resistance zone): Place your stop loss a reasonable distance above the upper boundary of the zone.
🎯 Take Profit (TP) Strategy
•Target the Next Zone: The most logical target is the next Golden Pocket Zone in the opposite direction of your trade. If you enter a long trade from a support zone, your primary target would be the next resistance zone above.
•Partial Profits: For larger moves, you can use Fibonacci extension levels or other support/resistance structures as intermediate targets to take partial profits.
Using Default Settings
The indicator is optimized to work well out of the box for most assets.
•Lookback Days = 20: This analyzes approximately one month of daily price action, providing a relevant and recent map of the market structure.
•Zone Height (% of ADR10) = 3.0: This provides a reasonably sized zone that is large enough to absorb noise but tight enough to be precise. It is an excellent starting point for all assets.
•Min Candle Size (% of ADR10) = 60.0: This is a crucial filter. It ensures that only days with significant price movement (at least 60% of the average daily range) are used to create zones. This filters out insignificant, low-volatility days and focuses only on levels created by decisive market action.
By combining the powerful, automatically generated Golden Pocket Zones with patient observation and confirmation on lower timeframes, traders can significantly increase the probability of their trades across all major financial markets.
⚠️ IMPORTANT NOTICE
This indicator and the accompanying strategy are provided for educational purposes only. Trading financial markets involves substantial risk, and past performance is not indicative of future results. The logic described is based on a specific set of rules and does not guarantee profit. Always conduct your own analysis and risk management before entering any trade. The creators are not responsible for any financial losses incurred.
Pine Script®指标
Microstructure Mean Reversion Microstructure Mean Reversion · Execution Levels (MNQ)OverviewThe Microstructure Mean Reversion (MMR) is a tactical execution tool designed specifically for the Nasdaq Micro E-mini (MNQ). Unlike traditional indicators that chase extremes (Highs/Lows), this script identifies Accepted Price Levels within micro-structures to provide high-probability Mean Reversion entries using Limit Orders.It is built for disciplined scalpers who prioritize clean charts and systematic execution over emotional trading.Core Logic: The "Accepted Price" ConceptMost traders focus on candle wicks. This indicator ignores them. It calculates the L0 (Lowest Close) and H0 (Highest Close) over a specific lookback period ($N$) to identify where the market is actually transacting and "accepting" value.Touch Count Validation: A setup only becomes valid if the microstructure has touched the level exactly 2-3 times (user-defined), preventing entries into "over-tested" or "insistent" levels that are likely to break.EMA Filter: Entries are only triggered during a pullback to the EMA 9, provided the price is still protected by the EMA 21 trend.Key FeaturesExecution Modes: Toggle between BUY-only, SELL-only, or BOTH to align the script with your daily bias.Timeframe-Specific Presets: Automatically adjusts parameters (Lookback, Tolerance, Entry Offset, and EMA Distance) for 30s, 1m, 2m, 3m, and 5m charts.Real-Time Performance Monitor: An on-chart dashboard tracks Win Rate, Total Trades, and Max Loss Streak during your session or Bar Replay.Tactical Visuals: Clean, professional interface showing only the active Buy/Sell Limit (BL/SL), Take Profit (TP), and Stop Loss (SL) levels.Execution Parameters (Optimized for MNQ)Contracts: 35 (Scalp model)Take Profit: +3.25 pts ($220)Stop Loss: -9.50 pts ($650)Entry: Limit Orders only (No Market/Stop chasing).How to UseSelect Bias: Set the Execution Mode based on your higher timeframe analysis.Wait for Setup: The script will draw the Limit Level (Green for Buy, Red for Sell) when micro-structure acceptance and weakness are confirmed.Execute: Place your Limit Order at the BL/SL line.Manage: The script automatically hides the setup once the TP or SL is hit to keep your workspace clutter-free.Disclaimer: This is an execution aid for manual trading. It does not execute trades automatically. Always trade within your risk management rules.
Pine Script®指标
Crypto Institutional Liquidity Sweep StrategyStrategy Overview: Institutional Liquidity Sweep & Trend Convergence
This strategy is a high-conviction systematic trading framework designed to exploit "stop-runs" and liquidity grabs within a dominant market trend. It combines institutional price action concepts with mathematical filters to ensure entries occur only when trend direction, volatility, and liquidity align.
1. The Trend Framework (EMA 200 Filter)
The foundation of the strategy is the 200-period Exponential Moving Average (EMA). This acts as a "Directional North Star."
Long Bias: Trades are only considered when price is above the EMA 200.
Short Bias: Trades are only considered when price is below the EMA 200.
Buffer Logic: An optional percentage buffer can be applied to avoid "choppy" entries when price is hugging the moving average.
2. The Entry Trigger (Liquidity Sweeps)
The strategy identifies Institutional Liquidity Pools using Swing Highs and Swing Lows (Pivots).
The Sweep: The system waits for price to pierce below a recent structural low (Bullish Sweep) or above a recent structural high (Bearish Sweep).
The Trap: It then monitors for a "reclaim" where price quickly rejects the level. This suggests that the breach was not a breakout, but a hunt for stop-losses to fuel a move in the opposite direction.
3. Secondary Confirmation Filters
To maximize the win rate, the strategy requires a Secondary Filter to confirm market health (User selectable):
V olatility Oscillator: Ensures the market is in an Expansion Phase. It requires the oscillator to be rising, indicating that momentum is behind the reversal.
Smart Trendlines (Structure): Uses Linear Regression Slope to ensure the immediate micro-structure is aligned with the macro-trend.
4. Entry Confirmation (The Reversal Candle)
A trade is not triggered simply because a level was swept. The strategy requires a Reversal Confirmation:
Price Location: The candle must close in the upper 40% (for longs) or lower 40% (for shorts) of its total range.
Directional Body: The candle must close bullish for longs and bearish for shorts, confirming that buyers or sellers have seized control of the bar.
5. Risk Management (Fixed 1:2 RR)
The strategy prioritizes capital preservation through an ATR-based (Average True Range) risk model:
Static Exits: Upon entry, the Stop Loss and Take Profit levels are calculated and locked. They do not move, ensuring a mathematically pure 1:2 Reward-to-Risk ratio.
Volatility Adjusted: The distance of the stop loss is determined by the ATR, meaning the strategy automatically widens stops during high volatility and tightens them during calm periods.
Pine Script®策略
Combined Advanced Blueprint + Hybrid Stop + GravityCombined Advanced Blueprint + Hybrid Stop + Gravity
Overview
This indicator is a comprehensive "Swiss Army Knife" trading system that combines the classic Traders Reality Blueprint (Moving Averages & Vector Zones) with advanced institutional volume detection (Gravity Squeeze & Sharks) and a Hybrid Trailing Stop for trade management.
It is designed to identify institutional footprints, trend direction, supply/demand zones, and volatility contractions in a single, all-in-one overlay.
🚀 Key Features
1. Gravity Squeeze & Shark Detection (Institutional Volume)
This module detects anomalies in volume and price action to identify where "Smart Money" is stepping in.
Shark Icons (🦈): Appear when the Negative Volume Index (NVI) detects significant accumulation during low volatility periods. This often signals a "defense" of a price level by institutions.
Shark Support (Blood) Zones: When a Shark is detected, a red box is drawn from the low of the candle. This represents an institutional "line in the sand." If price closes below this box, the zone is invalidated (broken).
Gravity Squeeze (⚡): Indicates a contraction in volatility (ATR compression), suggesting an explosive move is imminent.
Coils (🌀) & Hammers (🔨): Identifies specific price action patterns occurring on high relative volume.
2. The Blueprint Moving Averages
Includes the standard Traders Reality moving average sequence to identify trend state and dynamic support/resistance.
Red (8 EMA): Immediate trend.
White (21 EMA): Short-term trend (The "Baseline").
Blue (34 EMA): Trend confirmation.
Indigo (55 EMA) & Purple (89 EMA): Mid-term trend.
Orange (50 SMA) & Dark Orange (200 SMA): Major institutional levels (Golden/Death Cross).
Visual Crossovers: Arrows and shapes appear for 8/21 crosses, 8/34 crosses, and the 50/200 cross.
3. PVSRA (Price Volume Support Resistance Analysis)
Colors trade bars based on volume relative to the average, highlighting hidden liquidity.
Green/Red Bars: Volume is ≥ 200% of the average. (Climax action).
Blue/Violet Bars: Volume is ≥ 150% of the average.
Grey Bars: Average/Low volume.
Vector Zones: Automatically plots zones based on these high-volume candles to show where significant business was transacted.
4. Hybrid Trailing Stop
A volatility-based stop-loss system designed to keep you in the trend longer.
Calculation: Uses a combination of ATR (Average True Range) and manually input Implied Volatility (IV) to calculate a safe distance from price.
Visual: A Fuchsia line that trails behind price. When price closes across this line, the trend structure is considered broken.
5. Inflection Zones (Supply & Demand)
Auto-Drawing: Identifies Swing Highs and Swing Lows to draw Supply (Blue) and Demand (Red) boxes.
BOS (Break of Structure): When price breaks through a zone, the box is removed or converted, helping keep the chart clean.
6. Pivot Points & VWAP
Pivots: Displays multitimeframe pivots (Daily, Weekly, Monthly, etc.) including Traditional, Fibonacci, and Camarilla calculations.
VWAP: Includes Standard Deviation bands (1, 2, and 3 SD) anchored to Session, Week, Month, or even Earnings/Splits.
7. Keltner Channels & RSI Triggers
Entry Signals: Plots circles on the chart when RSI enters extreme zones (Overbought/Oversold) while price is interacting with the Keltner Channel bands.
🛠 Settings & Configuration
Gravity Squeeze & Sharks
Enable: Toggle the overlay on/off.
Min Volume: Set the threshold for volume analysis (Default: 300k).
Max ADX: Filters out signals if the trend is already too exhausted.
Inflection Zones
Swing Length: Sensitivity of the swing high/low detection.
History to Keep: How many historic zones to display before deleting old ones.
Pivot Levels
Timeframe: Auto-selects based on your chart, or force specific timeframes (e.g., Daily Pivots on a 15m chart).
Type: Choose between Traditional, Fibonacci, Woodie, etc.
Trailing Stop
Multiplier: Adjust how "loose" or "tight" the stop is (Default: 1.5 ATR).
IV %: Manually input the annual Implied Volatility for the asset for higher precision.
🎯 How to Trade (Strategy Ideas)
1. The Shark Defense:
Look for a Shark Icon (🦈).
Watch the red "Blood" box form.
Long Entry: If price retests the box and holds (does not close below it), this is a high-probability buy zone.
Stop Loss: A candle close below the red box.
2. The 8/21 & 8/34 Cross:
Use the Arrows generated by the moving averages.
Combine with Vector Candles: If you get a Bullish Cross (Up Arrow) immediately following a Green/Blue vector candle, the move is supported by volume.
3. The Squeeze Breakout:
Look for the Squeeze Icon (⚡) indicating low volatility.
Wait for the Hybrid Trailing Stop line to flip (e.g., price crosses above the Fuchsia line) to confirm the breakout direction.
Alerts
The script includes built-in alert conditions for automation:
8/21 Bullish/Bearish Cross
8/34 Bullish/Bearish Cross
Credits:
Core logic based on Traders Reality (Blueprint/PVSRA).
Gravity logic adapted from standard institutional volume analysis.
Compiled & Enhanced by Gemini.
Pine Script®指标
ZERO LEVEL ENTRY BY SIDDAM RAJUOverview The Intraday Low Tracker is a specialized price-action strategy designed to catch potential reversals or pullbacks from new intraday lows. Unlike standard indicators that repaint or give premature signals, this tool uses a strict "Wait & Break" logic. It identifies a new low, waits for a confirmation candle, and only triggers an entry if the market proves strength by breaking above that confirmation level.
How It Works (The Logic)
Identifies the Low: The indicator continuously tracks the market to find the lowest low of the current day.
The "After Candle" Setup: Once a new low is established, the indicator waits for the immediate next candle (the "After Candle") to close.
The Setup Zone:
Green Line (Entry): Drawn at the High of the "After Candle."
Red Line (Stop Loss): Drawn at the Day Low.
The Trigger (Strict Entry):
A signal is NOT counted just because lines are drawn.
The system enters "WAITING FOR BREAKOUT" mode.
An entry is valid ONLY if price actively breaks ABOVE the Green Entry Line.
Trade Management: Once triggered, the trade remains active until it hits the user-defined Target (Blue Line) or the Stop Loss (Red Line).
Key Features
Strict Breakout Logic: Prevents false entries by requiring price to actually move above the setup candle.
Live Dashboard: A clean table on the chart displays:
Status: "Scanning", "Waiting for Breakout", or "Trade Active".
Levels: Exact prices for Entry, Target, and Stop Loss.
Statistics: Tracks "Total Entries", "Targets Hit", and "SL Hit" for the current session.
Visual Clarity:
Green Entry Label: Appears ABOVE the confirmation candle.
Red SL Label: Appears BELOW the confirmation candle.
Dynamic Lines: Lines automatically update or vanish if a setup is invalidated (e.g., if a new lower low is made before entry).
Settings
Target Profit %: Set your desired percentage gain (default is 10%).
Visual Customization: Change line colors, styles, and widths to fit your chart theme.
Table Size: Adjust the dashboard size (Tiny, Small, Normal, Large).
How to Use
Apply the indicator to your intraday timeframe (e.g., 1-minute, 5-minute).
Wait for the Green/Red lines and the "ENTRY" label to appear.
Do not enter immediately. Watch the status table.
Enter the trade only when price crosses the Green Line.
Exit at the Blue Target Line or if price falls back to the Red SL Line.
Disclaimer This tool is for educational and informational purposes only. Past performance does not guarantee future results. Always manage your risk properly.
Pine Script®指标
Smart SafeZone Stops [MarkitTick]💡 This script represents a sophisticated evolution of volatility-based trailing stop methodologies. It is designed to assist traders in managing trend-following positions by dynamically adjusting stop-loss levels based on market noise, directional momentum, and volume flows. Unlike static trailing stops that move by a fixed percentage or simple ATR multiples, this tool calculates the "safe zone" by analyzing how far price has penetrated against the trend over a specific lookback period, offering a granular approach to risk management that adapts to changing market conditions.
✨ Originality and Utility
The primary utility of this indicator lies in its ability to filter out market noise while remaining tight enough to protect profits during strong trends. While the classic SafeZone concept (popularized by Dr. Alexander Elder) is effective, this script introduces several modern enhancements that increase its robustness:
● Dynamic ADX Integration Standard SafeZone stops use a fixed multiplier. This script integrates the Average Directional Index (ADX) to gauge trend strength. When the trend is strong, the stop tightens (Aggressive Multiplier) to lock in profits rapidly. When the trend is weak or choppy, the stop widens (Conservative Multiplier) to prevent premature shakeouts. ● Volume-Weighted Noise Price movement on low volume is often considered "noise," while high-volume movement signifies conviction. This script optionally weights the noise calculation by Relative Volume. A downward spike on low volume will affect the stop level less than a downward spike on high volume.
● 3-Day Smoothing Mechanism To prevent the stop line from becoming too jagged or reacting to single-bar anomalies, the script applies a 3-day smoothing algorithm. It utilizes the "worst-case" scenario of the last three calculated stop levels, ensuring the stop only moves when the trend structure genuinely shifts.
🔬 Methodology and Concepts
The underlying logic operates on a "Ratchet" mechanism, meaning the stop line can only move in the direction of the trade (up for longs, down for shorts) and never retraces until a trend reversal occurs.
● Directional Noise Calculation The script separates market noise into two components: Downside Penetration (for Longs): The distance the price dips below the previous bar's low. Upside Penetration (for Shorts): The distance the price spikes above the previous bar's high. The average of these penetrations is calculated over the Noise Lookback Period .
● The SafeZone Formula The raw stop level is derived as follows: Long Stop = Previous Low - (Average Downside Noise × Multiplier) Short Stop = Previous High + (Average Upside Noise × Multiplier)
● Adaptive Multiplier Logic If Dynamic ADX is enabled: If ADX > Strong Threshold: Use Aggressive Multiplier (e.g., 1.5x). If ADX < Weak Threshold: Use Conservative Multiplier (e.g., 3.5x). Otherwise: Use the Base Safety Coefficient.
● Exhaustion Detection The script calculates the distance between the current Close price and the Active Stop. If this distance exceeds a specific multiple of the ATR (Average True Range), it flags a "Mean Reversion" or "Exhaustion" warning, suggesting price has extended too far from equilibrium.
🎨 Visual Guide
The indicator plots distinct visual elements to guide decision-making without cluttering the chart excessively.
● Trailing Stop Lines Green Line (Solid): Represents the SafeZone Long Stop. This line appears below price during an uptrend. As long as price closes above this line, the bullish bias is intact. Red Line (Solid): Represents the SafeZone Short Stop. This line appears above price during a downtrend. A close above this line signals a potential short exit or reversal.
● Trend Signals Green Triangle (Below Bar): Marks the "Bull Start." This occurs when the price crosses above the Trend Filter EMA and the trend logic flips to bullish. Red Triangle (Above Bar): Marks the "Bear Start." Indicates the start of a downtrend sequence.
● Exhaustion Warnings Yellow Labels (⚠️): These appear when price has extended significantly away from the stop line (based on the ATR Exhaustion Multiplier). This is not an immediate sell signal but a warning that the trend may be overextended and a pullback is probable.
● MTF Consensus Cloud Background Color: If enabled, the chart background changes color to reflect the Higher Timeframe (HTF) trend. Green Background: Current trend matches HTF Uptrend. Red Background: Current trend matches HTF Downtrend. Gray Background: Trends are mismatched (Consolidation/Conflict).
● Quantitative Dashboard A table located in the top-right corner displays real-time statistics: Trend: Current state (BULLISH/BEARISH). Age: Number of bars since the trend began. Stop Price: Exact price level of the trailing stop. Risk %: The percentage distance from the current Close to the Stop. If this exceeds 3%, the text turns red to highlight elevated risk. Active Mult: The current multiplier being used (Dynamic or Fixed). ADX State: Shows if the trend is Strong, Weak, or Normal.
📖 How to Use
1. Entry Timing Wait for a Trend Switch signal (Triangle). For a long entry (Green Triangle), ensure the price is above the Trend Baseline (EMA). Ideally, look for confluence with the MTF Cloud (Green Background).
2. Position Management Once in a trade, use the Trailing Stop Line as your hard exit or invalidation point. Do not manually move the stop away from price; the script automatically "ratchets" the stop tighter as the trend progresses.
3. Taking Profits Use the "Exhaustion Warnings" (⚠️) as opportunities to scale out of positions. When price moves parabolically away from the stop line, the probability of a snap-back increases.
4. Managing Chop If the dashboard shows "ADX State: WEAK," expect the stop line to remain wider. This allows the asset "room to breathe" without stopping you out on random volatility.
⚙️ Inputs and Settings
The script is highly customizable to fit different asset classes (Crypto, Forex, Stocks).
● Trend Definitions Trend Filter (EMA Length): Determines the baseline trend bias (Default: 22). Price must be above this EMA to initiate a long calculation.
● Noise Calculation Noise Lookback Period: The number of bars used to calculate average penetration (Default: 10). Base Safety Coefficient: The standard multiplier applied to the noise average (Default: 2.5). Higher values = wider stops. Use Volume Weighting: Enables the volume-adjustment logic. Use 3-Day Smoothing: Recommended keeping this TRUE to avoid stop-hunts.
● Dynamic Multiplier (ADX) Enable Dynamic ADX: Toggles the adaptive multiplier. Strong/Weak Thresholds: The ADX levels that trigger aggressive or conservative multipliers.
● Multi-Timeframe Consensus Higher Timeframe: Select the TF for the cloud background (e.g., Daily or Weekly).
● Exhaustion Warning ATR Multiplier: Defines how far price must be from the stop to trigger a warning (Default: 3.0).
🔍 Deconstruction of the Underlying Scientific and Academic Framework
The "Smart SafeZone" indicator is grounded in the statistical analysis of market noise versus signal.
● Theory of Noise Penetration Conventional stops often use Standard Deviation (Bollinger Bands) or Average True Range (Keltner Channels/Chandelier Stops). While effective, these measures assume volatility is symmetrical. This script adopts the view that directional volatility matters more. In an uptrend, upside volatility is "good" signal, while downside volatility is "noise." By explicitly calculating the average downside penetration (Low - Low), the script isolates the specific counter-trend force acting on the asset. ● Volume-Weighted Price Analysis (VWPA) The inclusion of volume weighting draws upon Dow Theory principles, which state that volume must confirm the trend. Math: Penetration × (Volume / AverageVolume) This formula asserts that a price drop on low volume is statistically less significant than a drop on high volume. By dampening the impact of low-volume moves, the stop becomes more resistant to liquidity vacuums and algorithmic stop-hunts.
● Trend Efficiency (ADX) The integration of J. Welles Wilder’s ADX (Average Directional Index) adds a dimension of Trend Efficiency. High ADX values indicate a highly efficient trend with little retracement. Mathematically, this justifies a lower standard deviation (or noise multiplier) for the stop, as the probability of a deep retracement without a trend change is lower in high-momentum environments.
⚠️ Disclaimer
All provided scripts and indicators are strictly for educational exploration and must not be interpreted as financial advice or a recommendation to execute trades. I expressly disclaim all liability for any financial losses or damages that may result, directly or indirectly, from the reliance on or application of these tools. Market participation carries inherent risk where past performance never guarantees future returns, leaving all investment decisions and due diligence solely at your own discretion.
Pine Script®指标
[TehThomas] - Order Blocks█ OVERVIEW
This Order Blocks indicator identifies institutional-level support and resistance zones using fractal pattern recognition combined with Fair Value Gap (FVG) filtering. Order blocks represent areas where large institutional orders have been placed, creating significant price reactions when retested. This indicator uses a 5-bar fractal pattern to detect market structure breaks and highlights the last bearish or bullish candle before a strong impulse move.
█ KEY FEATURES
- Fractal-Based Detection: Uses 5-candle fractal patterns to identify key market structure highs and lows
- FVG Filtering: Optional Fair Value Gap confirmation ensures order blocks are followed by true market imbalances
- Automatic Mitigation: Order blocks are automatically removed when price breaks through them
- Overlap Prevention: Prevents cluttered charts by avoiding overlapping order block zones
- Customizable Display: Full control over colors, labels, line heights (body/wick), and maximum blocks shown
- Dual Polarity: Detects both bullish (OB+) and bearish (OB-) order blocks independently
█ HOW IT WORKS
The indicator scans price action for fractal patterns where the middle candle forms a local extreme (highest high or lowest low among 5 bars). When price breaks above a fractal high or below a fractal low, the script identifies the last opposing candle in the impulse move as the order block.
For bearish order blocks, it finds the highest bullish candle before a fractal low is broken, marking institutional selling pressure. For bullish order blocks, it locates the lowest bearish candle before a fractal high is breached, indicating institutional buying.
When FVG filtering is enabled, the indicator confirms that a Fair Value Gap (a 3-candle imbalance where price leaves an unfilled gap) occurred within the specified distance from the order block. This combination increases the probability that institutional traders are present in these zones.
█ SETTINGS
Bullish Order Block Settings
- Show/hide bullish order blocks
- Customize fill color and border color
- Toggle OB+ label display
Bearish Order Block Settings
- Show/hide bearish order blocks
- Customize fill color and border color
- Toggle OB- label display
Label Settings
- Label size: Tiny, Small, Normal, or Large
- Label text color customization
General Settings
- Bars Back to Check (10-200): Lookback period for order block detection
- Filter by FVG: Requires Fair Value Gap confirmation
- Max Bars Between OB and FVG (1-6): Distance tolerance for FVG filtering
- Line Height: Choose between Body or Wick for order block boundaries
- Prevent Overlapping OBs: Avoids drawing overlapping zones
- Max Order Blocks to Display (1-50): Limits active blocks on chart
- Length of Boxes (10-100): Horizontal projection length
█ HOW TO USE
1. Add the indicator to your TradingView chart
2. Configure settings based on your trading timeframe and style
3. Watch for OB+ labels (bullish order blocks) as potential support zones where price may bounce
4. Watch for OB- labels (bearish order blocks) as potential resistance zones where price may reverse
5. Wait for price retracement to the order block zone before taking entries
6. Use confirmation signals like volume spikes or reversal patterns at the order block
7. Place stop loss just outside the order block boundary to manage risk
8. Monitor mitigation: Order blocks disappear when price breaks through them completely
█ TRADING STRATEGY EXAMPLES
Bullish Order Block Strategy
Wait for a market structure shift from bearish to bullish. When price creates a bullish impulse breaking a fractal high, identify the OB+ zone. Enter long positions when price retraces to test the bullish order block, placing stop loss 10-20 pips below the zone's low. Target previous highs or resistance levels.
Bearish Order Block Strategy
Monitor for market structure shift from bullish to bearish. After price creates a bearish impulse breaking a fractal low, locate the OB- zone. Enter short positions when price retraces to test the bearish order block, placing stop loss 10-20 pips above the zone's high. Target previous lows or support levels.
FVG-Confirmed Entries
Enable FVG filtering to only display order blocks validated by Fair Value Gaps. These aligned setups increase probability as they combine institutional order placement with market inefficiencies. Trade retracements to these high-confluence zones for better risk-reward ratios.
█ IDEAL FOR
- ICT Traders: Follows Inner Circle Trader methodology for institutional order flow
- Smart Money Concepts: Tracks where large players place orders
- Swing Traders: Identifies key support/resistance for multi-day holds
- Price Action Traders: Pure chart-based approach without lagging indicators
- Breakout Traders: Confirms structure breaks with fractal patterns
- Forex, Crypto, and Stock Markets: Works on all liquid markets and timeframes
█ TECHNICAL SPECIFICATIONS
- Max Boxes: 500
- Max Labels: 500
- Detection Method: 5-bar fractal pattern recognition
- Mitigation Logic: Automatic removal when price breaks order block boundaries
- Time Projection: Uses time offset calculations for box extension
- Array Management: Dynamic array cleanup to prevent memory issues
█ NOTES & DISCLAIMERS
- Order blocks work best when combined with overall market context and trend analysis
- Not all order blocks result in price reversals; use proper risk management
- FVG filtering may reduce the number of signals but increases quality
- Fractal patterns require 5 bars to form, causing a 2-bar delay in detection
- Works optimally on higher timeframes (4H, Daily) for institutional footprints
- This indicator does not guarantee profitable trades; always use stop losses
- Past performance of order blocks does not predict future results
- Compatible with other ICT concepts like liquidity sweeps and market structure
Pine Script®指标
Profit Punch: Risk & Target Planner (ATR + Fixed R)Profit Punch: Risk & Target Planner (ATR + Fixed R)
This indicator is a complete trade planning tool designed to visualize your Risk (R) and Reward levels instantly. Whether you use a volatility-based strategy (ATR) or precise manual levels, this tool draws your roadmap directly on the chart.
It solves the problem of calculating "R-Multiples" manually and ensures every trade plan is consistent.
Key Features
1. Smart Risk Calculation
Auto Mode (ATR): Uses the stock's daily volatility (ATR) to automatically suggest a logical Stop Loss.
Manual Mode: Lets you type in your exact Stop Loss price (e.g., below a recent low), and the tool automatically adjusts your Profit Targets to match that specific risk.
2. Hybrid Targeting (The "Nuance")
You can set a tight manual stop but keep your profit targets based on daily volatility (ATR). This allows for "Hybrid" setups where you risk a small amount (tight stop) but aim for a standard volatility move (ATR targets).
3. Backtesting Friendly
Use the "Target Date" feature to apply the tool to any past candle. It will calculate the targets based on what the volatility was on that specific day , allowing you to accurately review past trades.
4. Clean & Customizable
Editable Labels: Rename "1R" to "Goal 1" or "Take Profit".
Clean Look: Toggle any line on/off to keep your chart simple.
Timeframe Independent: Calculations are always anchored to Daily data for consistency, even if you are viewing a 5-minute chart.
How to Use
Step 1: Add to Chart. The lines will appear on the latest bar by default.
Step 2: Set Entry. In Settings, check "Use Manual Entry" to type your exact buy price, or leave unchecked to use the closing price.
Step 3: Set Stop. Choose "Auto (ATR)" for a volatility-based stop, or "Manual Price" to type in your specific stop level.
Step 4: Visualize. The tool draws your 1R, 3R, 5R, and 7R targets instantly.
Settings Guide
Risk Factor: Multiplier for the ATR calculation (Default is 1.5).
Target Base: Choose whether profit targets are multiples of your Stop Distance (Classic) or Fixed ATR (Volatility).
Custom Labels: Change the text displayed on the chart (e.g., "Safe Exit" instead of "1R").
Who is this for?
This tool is built for swing traders, educators, and anyone who uses "R-Multiples" (Risk Units) to manage their portfolio. It is especially useful for creating consistent trade plan screenshots.
Pine Script®指标
ATR Value Number Display Only (No line chart)OVERVIEW:
The ATR (Average True Range) Value Display provides a clean, always-visible ATR reading on your chart. This essential volatility indicator helps traders set appropriate stop losses, position sizes, and profit targets based on current market volatility.
KEY FEATURES:
• Real-Time ATR Display: Shows current ATR value in a clean table format
• Customizable Appearance: Fully customizable text and background colors
• Adjustable Period: Standard 14-period default with full customization
• Bottom-Right Positioning: Non-intrusive placement that doesn't obstruct price action
• Tick Precision: Displays ATR value with accurate tick formatting
• Lightweight: Minimal resource usage with maximum clarity
HOW TO USE:
1. Add the indicator to any timeframe chart
2. Adjust ATR Length based on your trading style (14 is standard)
3. Customize colors to match your chart theme
4. Use ATR value to:
- Set stop loss distances (e.g., 1.5x ATR)
- Calculate position sizes based on risk tolerance
- Identify increasing/decreasing volatility trends
- Set realistic profit targets
SETTINGS:
• ATR Length: Calculation period (default: 14)
• Text Color: Customize the ATR text color (default: white)
• Box Color: Customize the background box color (default: semi-transparent blue)
PERFECT FOR:
✓ Position sizing based on volatility
✓ Setting dynamic stop losses that adapt to market conditions
✓ Identifying high/low volatility periods
✓ Comparing volatility across different instruments
✓ Risk management and trade planning
WHAT IS ATR?
Average True Range (ATR) measures market volatility by calculating the average range between high and low prices over a specified period. Higher ATR values indicate higher volatility, while lower values suggest calmer markets.
TIP: Use ATR on multiple timeframes to understand volatility across different trading horizons.
Pine Script®指标
VIX Crossing# VIX Crossing Strategy
## Overview
VIX Crossing is a quantitative trading strategy that combines volatility signals from the VIX index with trend confirmation from the Nasdaq-100 (NDX) to generate long entry signals. The strategy employs multiple exit conditions to manage risk and lock in profits systematically.
## Strategy Logic
### Entry Condition
The strategy initiates a long position when:
- **VIX Crossunder**: The VIX closing price crosses below its 5-bar simple moving average (SMA), signaling a decrease in implied volatility
- **AND NDX Confirmation**: The Nasdaq-100 closes above its 21-bar exponential moving average (EMA), confirming uptrend strength
This dual-signal approach reduces false entries by requiring both volatility normalization and positive market momentum.
### Exit Conditions
The strategy automatically closes positions when any of the following conditions are met:
1. **VIX Crossover (Volatility Exit)**: VIX closes above its SMA, indicating rising volatility
2. **Time-Based Exit**: Position is force-closed after 10 bars from entry, preventing prolonged drawdowns
3. **Take-Profit Exit**: Position closes when unrealized profit exceeds $3,000 per contract
4. **Stop-Loss Exit**: Position closes when unrealized loss exceeds $1,500 per contract
Exit conditions are evaluated each bar while the position is open, with explicit logging of the exit reason for trade analysis.
## Configuration Parameters
| Parameter | Default | Purpose |
|-----------|---------|---------|
| VIX SMA Length | 5 | Smoothing period for VIX volatility baseline |
| NDX EMA Length | 21 | Smoothing period for Nasdaq-100 trend confirmation |
| Force Close After X Bars | 10 | Maximum holding period in bars |
| TP Amount per Contract | $3,000 | Profit target per contract |
| SL Amount per Contract | $1,500 | Loss limit per contract |
## Risk Management Features
- **Position Sizing**: Capital allocation based on profit/loss per contract rather than fixed units, allowing for scalable risk
- **Dual Risk Controls**: Combined time-based and price-based exits prevent extended exposure
- **Profit Asymmetry**: 2:1 profit-to-loss ratio encourages risk/reward discipline
- **Contract-Based Accounting**: Profit targets and stop losses scale with position size
## Capital Requirements
- **Initial Capital**: $50,000
- **Commission**: $3 per contract (cash-based)
- **Instrument**: Designed for index-based derivatives or equities with liquid options markets
## Technical Indicators Used
- Simple Moving Average (SMA) for VIX smoothing
- Exponential Moving Average (EMA) for NDX trend detection
- Crossover/Crossunder detection for signal generation
## Underlying Assumptions
1. VIX crossunder events represent mean-reversion opportunities in Nasdaq-heavy portfolios
2. NDX EMA confirmation filters out uncorrelated volatility spikes
3. 10-bar holding period aligns with typical mean-reversion timeframes
4. Contract-based profit targets accommodate varying leverage levels
Pine Script®策略
Key Zone$ - Support and Resistance0DTE Bounce Zones (6M) — Support & Resistance with VWAP, Volume, and Risk Management
This indicator is built for intraday and 0DTE options trading, focused on high-quality bounce and rejection setups at historically proven support and resistance zones.
It automatically identifies key zones from six months of historical price action and waits for real-time confirmation before signaling CALL or PUT opportunities. The goal is to reduce noise, avoid weak bounces, and provide clear, rules-based trade structure.
====================================================================
CORE FEATURES
====================================================================
Historical Support & Resistance Zones (6 Months)
Zones are built using 15-minute pivot highs and lows.
A zone must be tested at least 3 times to be considered valid.
Nearby zones are merged automatically to reduce clutter.
Zones extend forward in time and update dynamically.
Support zones are shown in green, resistance zones in red.
These are higher-quality structural levels, not same-day levels.
====================================================================
0DTE-Focused Entry Logic
Signals only trigger when price interacts with a confirmed zone and shows a strong rejection candle.
Signals are limited to high-probability trading windows only.
Market Open: 9:30–10:45 ET
Market Close: 3:00–4:00 ET
This avoids midday chop and focuses on periods with real momentum.
====================================================================
VWAP Confirmation (Strict)
CALL setups require a VWAP reclaim.
PUT setups require a VWAP loss.
This aligns trades with institutional order flow instead of counter-trend noise.
====================================================================
MACD Momentum Filter
MACD histogram behavior is used to confirm momentum direction and avoid taking bounces against the prevailing move.
====================================================================
ATR Candle Strength Filter
The signal candle must be large enough relative to ATR.
This filters out weak or indecisive candles that often fail with 0DTE.
====================================================================
Advanced Volume Confirmation (Relative Volume)
Relative Volume (RVOL) is used instead of raw volume.
Different RVOL thresholds are applied for CALLS versus PUTS.
Higher RVOL is required for PUTS due to downside urgency.
Lower RVOL is allowed for CALLS due to grind-up behavior.
Separate RVOL thresholds are used for the market open and market close.
This ensures signals only occur when real participation is present.
====================================================================
Built-In Risk Management (2:1 Reward/Risk)
Every signal automatically calculates an entry, stop loss, and target.
Stop loss is based on the zone edge with an ATR buffer.
Targets default to a 2:1 reward-to-risk ratio.
Entry, stop, and target levels are drawn directly on the chart and included in alerts.
====================================================================
Smart Alerts (CALLS & PUTS)
Alerts trigger only when all conditions are met.
Alerts include trade direction, entry price, stop price, target price, and RVOL information.
Alerts are designed for 5-minute confirmation trading.
To use alerts, select “Any alert() function call” when creating the alert.
====================================================================
INTENDED USE
====================================================================
0DTE options trading.
5-minute chart confirmation.
Index ETFs and liquid equities such as SPY, QQQ, IWM, and SPX.
Traders who want aggressive entries with confirmation.
Traders who value structure, volume, and risk control.
====================================================================
NOTES
====================================================================
This is not a prediction tool.
Signals require discipline and confirmation.
Best results come from trading only the highest-quality setups.
Pine Script®指标
Volatility Breakout System [Fixed Risk]
This is a trend-following breakout strategy designed to capture volatility expansion while filtering out low-momentum "chop." It is built on the philosophy that significant price moves are often preceded by a breakout of volatility bands (Keltner Channels) accompanied by Volume and Trend Strength (ADX).
Strategy Logic:
Volatility Breakout: The primary trigger is a candle closing outside the Keltner Channels. This indicates price is moving faster than the average range.
Trend Filter: Trades are only taken in the direction of the 200 EMA.
Momentum Filter (ADX): The ADX filter ensures we only enter when the trend strength is above a specific threshold (Default: 20). This prevents the strategy from buying tops or selling bottoms in ranging markets.
Volume Confirmation: A breakout without volume is often a fake-out. This script requires volume to be higher than the moving average.
Risk Management (Automated):
Stop Loss: Based on ATR (Average True Range) to adapt to current market volatility.
Trailing Stop: Once the trade moves in favor, a trailing stop is activated to lock in profits.
Breakeven: If price moves X% in favor, the Stop Loss is automatically moved to the entry price to protect capital.
Cooldown: Includes a safety mechanism to prevent over-trading immediately after a signal.
Backtesting Notes:
This script is set up with use_bar_magnifier=true. For accurate results, use this on higher timeframes (1H, 4H) or ensure you have a Premium account for intrabar inspection.
Inputs:
You can toggle the "Compounding" feature to test fixed cash vs. % equity growth.
Webhooks are fully configurable for alert automation.
Pine Script®策略
Risk & Reward Position PlannerDescription
This script is a trade architecture tool designed to help traders calculate position sizes and visualize risk-reward ratios dynamically on the chart. It focuses on functional precision and clean aesthetics, offering two distinct visual styles: "Cyber" for modern high-tech charts and "Classic" for a traditional look.
Key Features
Interactive Setup: Upon adding the script or resetting, it prompts you to click directly on the chart to set your Entry and Stop Loss levels.
Dynamic Position Sizing: Calculates the total risk in currency (USD) based on your custom unit size.
Multi-Target Planning: Visualizes four customizable Take Profit targets based on specific RR ratios.
Cyber UI Aesthetics: Full control over colors, neon glow effects, and horizontal alignment to fit any chart layout.
Comprehensive Data: Displays price, percentage distance, currency risk, and RR ratios at a single glance.
User Guide (How to use)
To ensure the most efficient workflow, here are the essential steps for operating the tool:
Setting a New Trade (Resetting)
If you change your symbol or want to plan a completely new trade, you can clear the current setup and trigger the interactive selection again:
Right-click on the indicator in the chart OR click the three dots (...) next to the indicator name in the legend.
Select "Reset Points".
The indicator will prompt you to click two new points on the chart: first for the Entry, then for the Stop Loss.
Moving Entry and Stop Loss
Move the mouse over the line of the Entry or the StopLoss and grab the grip of the line to move it up or down. Drop it to the price you want to set.
Pine Script®指标
UT Bot Alerts with R-Targets & Results< DONE BY RM ALOWAIS >
Indicator Overview
This indicator provides rule-based BUY and SELL signals with automatic risk management levels.
Each trade setup includes a predefined Stop Loss and up to three Take Profit targets (TP1, TP2, TP3), allowing traders to manage risk and scale exits systematically.
How It Works
BUY and SELL signals are generated based on internal market conditions.
Each signal plots:
Entry point
Stop Loss (SL)
Take Profit levels (TP1, TP2, TP3)
After price action completes, the indicator displays the actual result of the trade:
Result: TP1 / TP2 / TP3 / SL
Exit labels may appear when a trade is closed early due to invalidation or opposite conditions.
Key Features
Non-repainting signals
Built-in risk-to-reward structure
Visual trade tracking with clear outcomes
Suitable for intraday and swing trading
Works on multiple markets and timeframes
Usage Notes
This indicator is a decision-support tool, not financial advice.
Best results are achieved when used with proper risk management and higher-timeframe confirmation.
Performance may vary depending on market conditions (trend vs range).
Disclaimer
This script is provided for educational and informational purposes only.
The author is not responsible for any financial losses. Always test and validate before using in live trading.
Pine Script®指标
HMA Trend Scalper V1[wjdtks255]
Overview
This indicator is a high-performance trend-following system optimized for crypto futures trading. It provides clear entry signals and dynamic, real-time risk management tools to help traders stay on the right side of the market.
Key Features
Dynamic Trend Tracking: Uses a specialized HMA (Hull Moving Average) to filter market noise and identify the core trend.
Real-time TP/SL Extension: Unlike static indicators, the Take Profit (TP) and Stop Loss (SL) lines extend candle-by-candle along with the price action.
Clean Chart UI: Lines only exist from the entry point to the current candle, preventing chart clutter.
Automatic Completion: Once the price hits a target, the line stops extending and marks the result (Target Hit or Stop Out).
Trading Strategy (How to Trade)
1. Long Entry (🚀 LONG)
Condition: The price must be above the trend line, and a breakout of the recent 5-candle high must occur with significant volume.
Action: Enter a Long position when the "🚀 LONG" label appears.
Exit: Hold until the price reaches the Cyan (Aqua) TP line or hits the Yellow SL line.
2. Short Entry (💀 SHORT)
Condition: The price must be below the trend line, and a breakdown of the recent 5-candle low must occur with significant volume.
Action: Enter a Short position when the "💀 SHORT" label appears.
Exit: Hold until the price reaches the Cyan (Aqua) TP line or hits the Yellow SL line.
3. Risk Management
Stop Loss: The indicator automatically calculates the optimal SL based on recent volatility (ATR) and swing points.
Take Profit: The TP is set at a calculated ratio to ensure a positive risk-to-reward setup.
Settings
Trend Sensitivity: Adjust the HMA length to match your preferred timeframe (Scalping vs. Swing).
Volume Multiplier: Filter out weak moves by increasing the volume breakout requirement.
Custom Styles: Fully customize line colors, widths, and styles (Solid, Dashed, Dotted) in the settings menu.
Pine Script®指标


