FX OSINT - Institutional Midnight Intelligence For ForexFX OSINT — Institutional Midnight Intelligence For Forex
See Your FX Charts Like an Intelligence Briefing, Not a Guess
If you’ve ever stared at EURUSD or GBPJPY and thought:
Where is the real liquidity?
Is this move sponsored by smart money or just noise?
Am I buying into premium or discount?
…then FX OSINT is designed for you.
FX OSINT (Forex Open Source Intelligence) treats the FX market the way an analyst treats an investigation:
Collect open‑source signals from price, time, and volatility.
Map out liquidity, structure, and sessions in a repeatable way.
Present them in a clean, non‑cluttered dashboard so you can read context quickly.
No rainbow spaghetti. No 12 indicators stacked on top of each other. Just structured information, midnight visuals, and a clear read on what the market is doing right now.
Why FX OSINT Exists
Many FX traders run into the same problems:
Overloaded charts – multiple indicators fighting for space, none talking to each other.
Signals with no context – arrows that ignore structure, sessions, and liquidity.
Tools not tuned for FX – generic indicators that don’t care what pair you are on.
FX OSINT brings this together into one FX‑focused framework that:
Understands structure : BOS/CHOCH, swings, and trend across multiple timeframes.
Respects liquidity : sweeps, order blocks, and FVGs with controlled visibility.
Reads volatility & ADR : how far today’s range has developed.
Knows the clock : London, New York, and key killzones.
Scores confluence : a 0–100 engine that summarizes how much is lining up.
FX OSINT is built for traders who want structured, institutional‑style logic with a disciplined, midnight‑themed UI —not flashing buy/sell buttons.
1. Midnight Dashboard — Top‑Right Intelligence Panel
This panel acts as your compact “situation room”:
CONFLUENCE — 0–100 score blending trend alignment, volatility regime, sessions, liquidity events, order blocks, FVGs, and ADR context.
REGIME — Low / Building / Normal / Expansion / Extreme, driven by ATR relationships, so you know if you’re in chop, trend, or expansion.
HTF / MTF / LTF TREND — Higher‑, medium‑, and current‑timeframe bias in one place, so you see if you are trading with or against the larger flow.
ADR USED — How much of today’s typical range has already been consumed in percentage terms.
PIP VALUE — Approximate pip size per pair, including JPY‑style pairs.
Everything is bold, legible, and color‑coded, but the layout stays minimal so you can:
Look once → understand the context.
2. Structure, BOS, CHOCH — Smart‑Money‑Style Skeleton
FX OSINT tracks swing highs and lows, then shows how structure evolves:
Trend logic based on evolving swings, not just a moving average cross.
BOS (Break of Structure) when price expands in the direction of trend.
CHOCH (Change of Character) when behavior flips and the market structure changes.
Labels are selective, not spammy . You don’t get a tag on every minor wiggle—only when structure meaningfully shifts, so it’s easier to answer:
"Are we continuing the current leg, or did something actually change here?"
3. Liquidity Sweeps, Order Blocks & FVGs — The OSINT Layer
FX OSINT treats liquidity as a key information layer:
Liquidity sweeps — Detects when price spikes through recent highs/lows and then snaps back, flagging potential stop runs.
Order blocks — The last opposite candle before a displacement move, drawn as controlled boxes with limited lifespan to avoid clutter.
Fair Value Gaps (FVGs) — Three‑candle imbalances rendered as precise zones with a cap on how many can exist at once.
Under the hood, boxes are managed so your chart does not become a wall of old zones:
// Draw Order Blocks with overlap prevention
if isBullishOB and showOrderBlocks
if array.size(obBoxes) >= maxBoxes
oldBox = array.shift(obBoxes)
box.delete(oldBox)
newBox = box.new(bar_index , low , bar_index + obvLength, high ,
border_color = bullColor, bgcolor = bullColorTransp,
border_width = 2, extend = extend.none)
array.push(obBoxes, newBox)
Box limits keep the number of zones under control.
Borders and transparency are tuned so you still see price clearly.
You end up with a curated liquidity map , rather than a chart buried under every level price has ever touched.
4. Volatility, ADR & Sessions — Time and Range Intelligence
FX OSINT runs a Volatility Regime Analyzer and an ADR engine in the background:
Volatility regime — Five states (Low → Extreme) derived from fast vs. slow ATR.
ADR bands — Daily high/mid/low projected from the current daily open.
ADR used % — How far today’s move has traveled relative to its typical range.
On the time side:
Asia, London, New York sessions are softly highlighted with a single active background to avoid overlapping colors.
Killzones (e.g., London and New York opens) can be emphasized when you want to focus on where significant moves often begin.
Together, this helps you answer:
"What time is it in the trading day?"
"How stretched are we?"
"Is expansion just starting, or are we late to the move?"
5. ICT‑Style Add‑Ons — BOS/CHOCH, Premium/Discount, and Confluence
For modern FX / ICT‑inspired workflows, FX OSINT includes:
BOS / CHOCH labels — Clear structural shifts based on swings.
Premium / Discount zones — 25%, 50%, 75% levels of the daily range, so you know if you are buying discount in an uptrend or selling premium in a downtrend.
Confluence score — A single number summarizing how many conditions line up in the current context.
Instead of replacing your plan, FX OSINT compresses your checklist into the chart:
Structure
Liquidity
Session / Time
Volatility / ADR
Higher‑timeframe alignment
When these agree, the dashboard reflects it. When they don’t, it stays neutral and lets you see the conflict.
How To Use FX OSINT
FX OSINT is not a signal bot. It is an information engine that organizes context so you can apply your own plan.
A typical workflow might look like:
Start on higher timeframes (e.g., H4/D1) to form directional bias from structure, volatility regime, and ADR context.
Move to intraday timeframes (e.g., M15/H1) around your chosen sessions (London and/or New York).
Look for confluence :
HTF / MTF / LTF trends aligned.
Price in discount for longs or premium for shorts.
Recent liquidity sweep into a meaningful OB or FVG.
Confluence score at or above a level you consider significant.
Then refine entries using BOS/CHOCH on lower timeframes according to your own risk and execution rules.
FX OSINT aims to make sure you do not enter a trade without seeing:
Where you are in the day (ADR and sessions).
Where you are in the volatility cycle (regime).
Who currently appears in control (structure and trend).
Which liquidity was just targeted (sweeps and zones).
Design Choices and Scope
FX OSINT was designed around a few clear constraints:
FX‑focused — Logic and filters tuned for FX majors, minors, exotics, and metals. It is intended for FX markets, not for every possible asset class.
Open‑source — The full Pine Script code is available so you can read it, learn from it, and adapt it to your own workflow if needed.
Clear themes — Two main visual styles (e.g., dark institutional “midnight” and a lighter accent variant) with a focus on readability, not visual noise.
Chart‑friendly — Panels use fixed areas, session highlights avoid overlapping, and boxes are capped/pruned so the chart remains usable.
FX OSINT is for only Forex pairs, not anything else!
Hope you enjoyed and remember your Open Source Intelligence Matters 😉!
-officialjackofalltrades
在脚本中搜索"sweep"

Stratégie SMC V18.2 (BTC/EUR FINAL R3 - Tendance)This strategy is an automated implementation of Smart Money Concepts (SMC), designed to operate on the Bitcoin/Euro (BTC/EUR) chart using the 15-minute Timeframe (M15).It focuses on identifying high-probability zones (Order Blocks) after a confirmed Break of Structure (BOS) and a Liquidity Sweep, utilizing an H1/EMA 200 trend filter to only execute trades in the direction of the dominant market flow.Risk management is strict: every trade uses a fixed Risk-to-Reward Ratio (R:R) of 1:3.🧱 Core Logic Components
1. Trend Filter (H1/EMA 200)Objective: To avoid counter-trend entries, which has allowed the success rate to increase to nearly $65\%$ in backtests.Mechanism: A $200$-period EMA is plotted on a higher timeframe (Default: H1/60 minutes).Long (Buy): Entry is only permitted if the current price (M15) is above the trend EMA.Short (Sell): Entry is only permitted if the current price (M15) is below the trend EMA.
2. Order Block (OB) DetectionA potential Order Block is identified on the previous candle if it is
accompanied by an inefficiency (FVG - Fair Value Gap).
3. Advanced SMC ValidationBOS (Break of Structure): A recent BOS must be confirmed by breaking the swing high/low defined by the swing length (Default: 4 M15 candles).Liquidity (Liquidity Sweep): The Order Block zone must have swept recent liquidity (defined by the Liquidity Search Length) within a certain tolerance (Default: $0.1\%$).Point of Interest: The OB must form in a premium zone (for shorts) or a discount zone (for longs) relative to the current swing range (above or below the $50\%$ level of the range).
4. Execution and Risk ManagementEntry: The trade is triggered when the price touches the active Order Block (mitigation).Stop Loss (SL): The SL is fixed at the low of the OB (for longs) or the high of the OB (for shorts).Take Profit (TP): The TP is strictly set at a level corresponding to 3 times the SL distance (R:R 1:3).Lot Sizing: The trade quantity is calculated to risk a fixed amount (Default: 2.00 Euros) per transaction, capped by a Lot Max and Lot Min defined by the user.
Input Parameters (Optimized for BTC/EUR M15)Users can adjust these parameters to modify sensitivity and risk profile. The default values are those optimized for the high-performing backtest (Profit Factor $> 3$).ParameterDescriptionDefault Value (M15)Long. Swing (BOS)Candle length used to define the swing (and thus the BOS).4Long. Recherche Liq.Number of candles to scan to confirm a liquidity sweep.7Tolérance Liq. (%)Price tolerance to validate the liquidity sweep (as a percentage of price).0.1Timeframe TendanceChart timeframe used for the EMA filter (e.g., 60 = H1).60 (H1)Longueur EMA TendancePeriods used for the trend EMA.200Lot Max (Quantité Max BTC)Maximum quantity of BTC the strategy is allowed to trade.0.01Lot Min Réel (Exigence Broker)Minimum quantity required by the broker/exchange.0.00001

Screener: Multi-Timeframe CRT / ORB [Yosiet]Are you tired of manually scanning dozens of charts across different timeframes, searching for that perfect reversal setup? What if you could have a system that does the heavy lifting for you, pinpointing high-probability reversal patterns across the entire market in real-time?
Several names for the same candlestick pattern: CRT, ORB, Morning Star, Evening Star, and others, but I'm not going to talk about it.
What is a Candle Retracement (CRT) Pattern?
For those who may be unfamiliar, the Candle Retracement pattern is a robust 3-candle setup that signals the potential exhaustion of a trend and the start of a reversal.
Bullish CRT:
Candle 1 (Signal): A significant bearish candle.
Candle 2 (Retracement): A candle that sweeps the lows of Candle 1 but closes within its body. This shows the sellers are overextended and losing momentum.
Candle 3 (Confirmation): A bullish candle that closes above Candle 2's close, confirming the reversal.
Bearish CRT:
Candle 1 (Signal): A significant bullish candle.
Candle 2 (Retracement): A candle that sweeps the highs of Candle 1 but closes within its body.
Candle 3 (Confirmation): A bearish candle that closes below Candle 2's close.
How This Screener Supercharges Your Trading
Manually finding these setups is time-consuming. This indicator automates the entire process, scanning up to four symbols across nine different timeframes—from the fast-paced 5-minute chart to the strategic weekly view.
Key Features:
Multi-Symbol, Multi-Timeframe Matrix: Get an instant, bird's-eye view of all CRT signals in a clean, easy-to-read table.
Customizable Logic: Fine-tune the pattern detection to your liking:
Lookback Period: How many bars back to search for patterns.
Min Candle %: The minimum body size of Candle 1, ensuring you only get significant signals.
Sweep %: The minimum required wick sweep of Candle 2, filtering for meaningful false breaks.
Visual & Alert System:
Clear Visuals: Green circles (🟢) for Bullish CRT and red circles (🔴) for Bearish CRT.
Proactive Alerts: Receive real-time pop-up and push notifications the moment a new pattern is confirmed on any timeframe.
Final Thoughts & Risk Management
The Multi-Timeframe CRT Screener is designed to be a cornerstone of your trading strategy, helping you find high-quality setups with efficiency. However, no indicator is infallible.
Always use confluence: Use the signals from this screener in conjunction with other factors like key support/resistance levels, volume, or momentum indicators.
Manage your risk: Always use a stop-loss. A good initial stop for a CRT pattern can be placed just beyond the extreme of Candle 1 (the low for bullish, high for bearish).
I hope you find this tool as invaluable in your trading as I have. I'm constantly working on improvements, so please feel free to leave your suggestions, comments, and questions below. If you find it useful, give it a like and share it with your trading community!
Happy Trading,
Yosiet

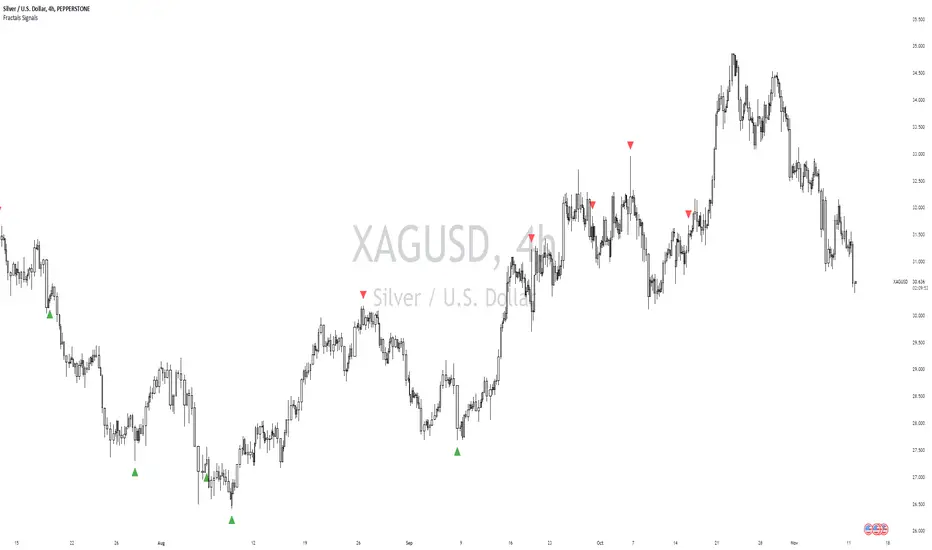
William Fractals + SignalsWilliams Fractals + Trading Signals
This indicator identifies Williams Fractals and generates trading signals based on price sweeps of these fractal levels.
Williams Fractals are specific candlestick patterns that identify potential market turning points. Each fractal requires a minimum of 5 bars (2 before, 1 center, 2 after), though this indicator allows you to customize the number of bars checked.
Up Fractal (High Point) forms when you have a center bar whose HIGH is higher than the highs of 'n' bars before and after it. For example, with n=2, you'd see a pattern where the center bar's high is higher than 2 bars before and 2 bars after it. The indicator also recognizes patterns where up to 4 bars after the center can have equal highs before requiring a lower high.
Down Fractal (Low Point) forms when you have a center bar whose LOW is lower than the lows of 'n' bars before and after it. For example, with n=2, you'd see a pattern where the center bar's low is lower than 2 bars before and 2 bars after it. The indicator also recognizes patterns where up to 4 bars after the center can have equal lows before requiring a higher low.
Trading Signals:
The indicator generates signals when price "sweeps" these fractal levels:
Buy Signal (Green Triangle) triggers when price sweeps a down fractal. This requires price to go BELOW the down fractal's low level and then CLOSE ABOVE it . This pattern often indicates a failed breakdown and potential reversal upward.
Sell Signal (Red Triangle) triggers when price sweeps an up fractal. This requires price to go ABOVE the up fractal's high level and then CLOSE BELOW it. This pattern often indicates a failed breakout and potential reversal downward.
Customizable Settings:
1. Periods (default: 10) - How many bars to check before and after the center bar (minimum value: 2)
2. Maximum Stored Fractals (default: 1) - How many fractal levels to keep in memory. Older levels are removed when this limit is reached to prevent excessive signals and maintain indicator performance.
Important Notes:
• The indicator checks the actual HIGH and LOW prices of each bar, not just closing prices
• Fractal levels are automatically removed after generating a signal to prevent repeated triggers
• Signals are only generated on bar close to avoid false triggers
• Alerts include the ticker symbol and the exact price level where the sweep occurred
Common Use Cases:
• Identifying potential reversal points
• Finding stop-hunt levels where price might reverse
• Setting stop-loss levels above up fractals or below down fractals
• Trading failed breakouts/breakdowns at fractal levels
SMC Alpha Engine [PhenLabs]📊 SMC Alpha Engine
Version: PineScript™ v6
📌 Description
The SMC Alpha Engine is a comprehensive Smart Money Concepts indicator that automates institutional trading pattern recognition. Built for traders who understand that confluence is king, this indicator stacks multiple SMC elements together and scores them in real-time, allowing you to focus exclusively on high-probability setups.
Rather than manually tracking HTF bias, market structure, liquidity levels, order blocks, and fair value gaps separately, the SMC Alpha Engine consolidates everything into a unified scoring system. When enough factors align, you get a signal. When they don’t, you wait. This systematic approach removes emotion and subjectivity from SMC trading.
The indicator is designed around one core principle: only trade when the probabilities are stacked in your favor. By requiring multiple confluence factors before generating signals, it filters out the noise and keeps you focused on setups that institutional traders actually care about.
🚀 Points of Innovation
Automated confluence scoring system that evaluates 6 distinct SMC factors in real-time
HTF-to-LTF bias alignment ensuring trades flow with institutional direction
Intelligent liquidity sweep detection using wick-ratio analysis for confirmation
ATR-based FVG quality filtering that eliminates noise and shows only significant imbalances
Anti-spam signal logic preventing overtrading during volatile market conditions
Session-aware killzone integration timing entries with institutional activity windows
🔧 Core Components
HTF Bias Engine: Analyzes higher timeframe swing structure to establish directional bias using pivot high/low comparisons
Market Structure Module: Detects BOS (Break of Structure) and CHoCH (Change of Character) with real-time confirmation
Premium/Discount Calculator: Dynamically maps price zones relative to recent swing range equilibrium
Liquidity Tracker: Monitors swing points as liquidity targets and identifies sweep events with rejection confirmation
POI Detector: Identifies valid Order Blocks with displacement requirements and Fair Value Gaps with ATR filtering
Confluence Scorer: Aggregates all factors into bull/bear scores displayed on real-time dashboard
🔥 Key Features
Multi-timeframe analysis combining HTF directional bias with LTF precision entries
Customizable confluence threshold from 1 (low filter) to 5 (sniper mode)
Three killzone sessions: London (02:00-05:00), NY AM (08:30-11:00), NY PM (13:30-16:00)
Flexible mitigation options for OBs and FVGs: Wick, Close, 50%, or None
Visual structure labeling for BOS and CHoCH events on chart
Real-time info dashboard showing all current market conditions and scores
Built-in alert conditions for BOS, liquidity sweeps, and high-confluence signals
🎨 Visualization
Premium Zone: Red-tinted box above equilibrium indicating sell-side interest areas
Discount Zone: Green-tinted box below equilibrium indicating buy-side interest areas
Equilibrium Line: Dotted gray line marking the 50% level of current range
Order Blocks: Color-coded boxes (green for bullish, red for bearish) showing institutional candles
Fair Value Gaps: Teal boxes for bullish FVGs, maroon boxes for bearish FVGs
Killzone Backgrounds: Blue (London), Orange (NY AM), Purple (NY PM) session highlighting
Info Table: Top-right dashboard displaying HTF bias, LTF trend, zone, killzone status, and scores
📖 Usage Guidelines
HTF Settings
HTF Timeframe - Default: 60 - Controls higher timeframe for directional bias
HTF Swing Length - Default: 10, Range: 3+ - Determines pivot sensitivity for HTF trend
Market Structure Settings
LTF Swing Length - Default: 3, Range: 1-10 - Controls swing detection sensitivity
Show BOS/CHoCH - Default: Off - Toggles structure labels on chart
Show Strong/Weak Points - Default: Off - Displays swing point classifications
POI Settings
Show Valid Order Blocks - Default: Off - Displays OBs that caused displacement
Show Unmitigated FVGs - Default: On - Shows active fair value gaps
Filter FVG by ATR - Default: On - Only shows FVGs larger than 0.5x ATR
OB Mitigation Type - Options: Wick, Close, None - Determines when OBs are invalidated
FVG Mitigation Type - Options: Wick, Close, 50%, None - Determines when FVGs are filled
Confluence Settings
Minimum Score for Signal - Default: 4, Range: 1-5 - Required confluence level for entries
Show Entry Signals - Default: On - Toggles LONG/SHORT labels on chart
✅ Best Use Cases
Trend continuation trades during active killzone sessions with HTF alignment
Discount zone entries on bullish HTF bias with recent liquidity sweep below
Premium zone shorts on bearish HTF bias after liquidity grab above recent highs
Reversal identification following CHoCH with POI confluence in optimal zone
Filtering existing strategy signals by requiring minimum confluence score
⚠️ Limitations
HTF bias detection requires sufficient price history for accurate pivot identification
Liquidity sweep detection depends on wick-ratio settings and may miss some events
Order blocks require displacement confirmation which may exclude some valid zones
Confluence scoring is probabilistic and does not guarantee profitable outcomes
Killzone times are based on EST/EDT and require timezone adjustment for other regions
Signal spam prevention may delay valid signals by up to 10 bars after previous signal
💡 What Makes This Unique
Unified SMC Framework: Combines all major SMC concepts into one cohesive indicator rather than requiring multiple tools
Objective Scoring System: Removes subjectivity by quantifying confluence into measurable scores
Institutional Timing Integration: Built-in killzone awareness ensures signals align with high-volume sessions
Quality Filtering: ATR-based FVG filtering and displacement-required OBs eliminate low-quality setups
Anti-Overtrading Logic: Smart signal spacing prevents emotional trading during choppy conditions
🔬 How It Works
Step 1: HTF Bias Determination
Analyzes higher timeframe pivot highs and lows
Compares consecutive pivots to identify HH/HL (bullish) or LH/LL (bearish) sequences
Establishes directional filter that all signals must respect
Step 2: LTF Structure Mapping
Detects swing points on execution timeframe
Identifies BOS when price closes beyond confirmed swing level
Recognizes CHoCH when structure break occurs against current trend
Step 3: Confluence Calculation
Awards +1 for HTF bias alignment
Awards +1 for active killzone timing
Awards +1 for optimal zone positioning (discount for longs, premium for shorts)
Awards +1 for price at unmitigated POI
Awards +1 for recent liquidity sweep in trade direction
Awards +1 for recent supportive structure break
Step 4: Signal Generation
Compares total score against user-defined minimum threshold
Requires candle confirmation (bullish close for longs, bearish close for shorts)
Applies 10-bar spacing filter to prevent signal clustering
💡 Note:
This indicator is designed for traders already familiar with Smart Money Concepts. While it automates detection and scoring, understanding why each factor matters will significantly improve your ability to filter signals and manage trades effectively. Use the minimum confluence setting to match your risk tolerance, higher values mean fewer but higher-quality signals.

Change in State of Delivery CISD [AlgoAlpha]🟠 OVERVIEW
This script tracks how price “changes delivery” after failed attempts to push in one direction. It builds swing levels from pivots, watches for those levels to be wicked, and then checks if price delivers cleanly in the opposite direction. When the pattern meets the script’s tolerance rules, it marks a Change in State of Delivery (CISD). These CISD levels are drawn as origin lines and are used to spot shifts in intent, failed pushes, and continuation attempts. A CISD becomes stronger when it forms after opposing liquidity is swept within a defined lookback.
🟠 CONCEPTS
The script first defines structure using swing highs/lows. These levels act as potential liquidity points. When price wicks through a swing, the script registers a mitigation event. After this, it looks for a reversal-style candle sequence: a failed push, followed by a counter-move strong enough to pass a tolerance ratio. This ratio compares how far price expanded away from the failed attempt versus the counter-move that followed. If the ratio is high enough, this becomes a CISD. The idea is simple: liquidity interaction sets context , and the tolerance logic identifies actual intent . CISD levels and sweep markers combine these two ideas into a clean map of where delivery flipped.
🟠 FEATURES
Liquidity tracking: marks swing highs/lows and updates them until expiry
Liquidity sweep confirmation when CISD aligns with recent mitigations
Alert conditions for all key events: mitigations, CISDs, and strong CISDs
🟠 USAGE
Setup : Add the script to your chart. Use it on any timeframe where swing behavior matters. Set the Swing Period for how wide a pivot must be. Set Noise Filter to control how strict the CISD detection is. Liquidity Lookback defines how recent a wick must be to confirm a sweep.
Read the chart : Origin lines mark where the CISD began. A green line signals bullish intent; a red line signals bearish intent. ▲ and ▼ shapes show CISDs that form after liquidity is swept, these mark strong signals for potential entry. Swing dots show recent swing highs/lows. Candle colors follow the latest CISD trend.
Settings that matter : Increasing Swing Period produces fewer but stronger swings. Raising Noise Filter requires cleaner counter-moves and reduces false CISDs. Liquidity Lookback controls how strict the sweep confirmation is. Expiry Bars decides how long swing levels remain active.

FVG_Liquidity_SignalFVGs: classic 3-bar gaps (bullish when low > high , bearish when high < low ). Zones are drawn and auto-pruned.
Liquidity sweep: price takes out the last swing low/high (pivot) and then reclaims it on the close.
Signals:
BUY when we get a bull sweep and the bar taps a recent bull FVG and closes back above its upper edge.
SELL is the mirror image.
SL/TP guides: SL at swept swing; TP = RR × risk (visual only).

Dynamic Order Blocks [LuxAlgo]The Dynamic Order Blocks indicator displays the most recent unmitigated bullish and bearish order blocks on the chart, providing dynamic support/resistance areas.
When price sweeps an order block, this is highlighted by the script indicating a potential reversal.
The average between the displayed order blocks is also displayed.
🔶 USAGE
Order blocks are a popular method of price action analysis, representing price areas where more significant market participants accumulate their orders.
Displaying order blocks dynamically allows obtaining relevant areas of support/resistance. Users can obtain longer-term order blocks using a higher "Swing Lookback" setting.
Users can also use mitigation events to assess the current trend direction, with price mitigating a bearish order block (breaking above the upper extremity) indicating an uptrend, and price mitigating a bullish order block (breaking below the lower extremity) indicating a downtrend.
🔹 Average Level
An average level obtained from the displayed bullish and bearish order blocks is included in the indicator and offers an additional polyvalent dynamic support/resistance level.
The change of direction of the average line can also be indicative of the current trend direction.
🔹 Dynamic Sweeps
Price sweeping the mitigation level of an order block is highlighted on the chart using bordered rectangles. These highlight a breakout failure and can be indicative of a potential reversal.
🔶 SETTINGS
Swing Lookback: Period of the swing detection used to construct order blocks. Higher values will return longer-term order blocks.
Use Candle Body: Use the candle body as the order block area instead of the candle full range.

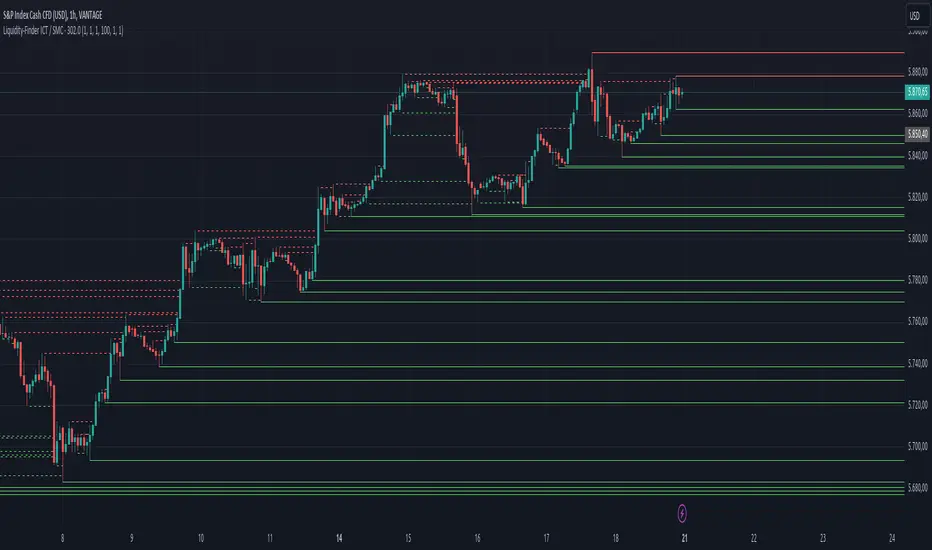
Liquidity-Finder ICT / SMCIn the context of ICT and the Smart Money Concept, liquidity is likely viewed as a crucial factor for determining the strength and sustainability of a market move. Smart Money is often associated with large institutional traders who have the ability to influence liquidity.
Liquidity Sweep:
A liquidity sweep in this context might involve Smart Money intentionally executing trades across various price levels to assess market depth and liquidity. This information can be used to identify potential areas of interest for Smart Money to initiate or exit positions without causing significant price disruptions.
Stop Hunt:
Stop hunting is a concept that Smart Money traders may employ to deliberately trigger stop orders in the market. By doing so, they can create temporary price movements that allow them to accumulate or liquidate positions at more favorable prices before the market reacts.
Smart Money Concept (SMC):
The Smart Money Concept revolves around the idea that large institutional traders (Smart Money) have superior information and resources compared to retail traders. Understanding the behavior of Smart Money, as taught in ICT and SMC, involves analyzing market dynamics, order flow, and liquidity to make more informed trading decisions.
Liquidating:
Liquidating refers to the process of selling or closing out existing positions. In the context of Smart Money, the term could imply that institutional traders are actively managing their positions, either taking profits or cutting losses strategically based on their analysis of market conditions.
The Indicator
The Indicator show open liquidity as solid lines and liquidates liquidity as dashed lines
Is able to send alerts for liquidity level was liquidated, liquidity level was dipped or the next close is on the other side
SMC N-Gram Probability Matrix [PhenLabs]📊 SMC N-Gram Probability Matrix
Version: PineScript™ v6
📌 Description
The SMC N-Gram Probability Matrix applies computational linguistics methodology to Smart Money Concepts trading. By treating SMC patterns as a discrete “alphabet” and analyzing their sequential relationships through N-gram modeling, this indicator calculates the statistical probability of which pattern will appear next based on historical transitions.
Traditional SMC analysis is reactive—traders identify patterns after they form and then anticipate the next move. This indicator inverts that approach by building a transition probability matrix from up to 5,000 bars of pattern history, enabling traders to see which SMC formations most frequently follow their current market sequence.
The indicator detects and classifies 11 distinct SMC patterns including Fair Value Gaps, Order Blocks, Liquidity Sweeps, Break of Structure, and Change of Character in both bullish and bearish variants, then tracks how these patterns transition from one to another over time.
🚀 Points of Innovation
First indicator to apply N-gram sequence modeling from computational linguistics to SMC pattern analysis
Dynamic transition matrix rebuilds every 50 bars for adaptive probability calculations
Supports bigram (2), trigram (3), and quadgram (4) sequence lengths for varying analysis depth
Priority-based pattern classification ensures higher-significance patterns (CHoCH, BOS) take precedence
Configurable minimum occurrence threshold filters out statistically insignificant predictions
Real-time probability visualization with graphical confidence bars
🔧 Core Components
Pattern Alphabet System: 11 discrete SMC patterns encoded as integers for efficient matrix indexing and transition tracking
Swing Point Detection: Uses ta.pivothigh/pivotlow with configurable sensitivity for non-repainting structure identification
Transition Count Matrix: Flattened array storing occurrence counts for all possible pattern sequence transitions
Context Encoder: Converts N-gram pattern sequences into unique integer IDs for matrix lookup
Probability Calculator: Transforms raw transition counts into percentage probabilities for each possible next pattern
🔥 Key Features
Multi-Pattern SMC Detection: Simultaneously identifies FVGs, Order Blocks, Liquidity Sweeps, BOS, and CHoCH formations
Adjustable N-Gram Length: Choose between 2-4 pattern sequences to balance specificity against sample size
Flexible Lookback Range: Analyze anywhere from 100 to 5,000 historical bars for matrix construction
Pattern Toggle Controls: Enable or disable individual SMC pattern types to customize analysis focus
Probability Threshold Filtering: Set minimum occurrence requirements to ensure prediction reliability
Alert Integration: Built-in alert conditions trigger when high-probability predictions emerge
🎨 Visualization
Probability Table: Displays current pattern, recent sequence, sample count, and top N predicted patterns with percentage probabilities
Graphical Probability Bars: Visual bar representation (█░) showing relative probability strength at a glance
Chart Pattern Markers: Color-coded labels placed directly on price bars identifying detected SMC formations
Pattern Short Codes: Compact notation (F+, F-, O+, O-, L↑, L↓, B+, B-, C+, C-) for quick pattern identification
Customizable Table Position: Place probability display in any corner of your chart
📖 Usage Guidelines
N-Gram Configuration
N-Gram Length: Default 2, Range 2-4. Lower values provide more samples but less specificity. Higher values capture complex sequences but require more historical data.
Matrix Lookback Bars: Default 500, Range 100-5000. More bars increase statistical significance but may include outdated market behavior.
Min Occurrences for Prediction: Default 2, Range 1-10. Higher values filter noise but may reduce prediction availability.
SMC Detection Settings
Swing Detection Length: Default 5, Range 2-20. Controls pivot sensitivity for structure analysis.
FVG Minimum Size: Default 0.1%, Range 0.01-2.0%. Filters insignificant gaps.
Order Block Lookback: Default 10, Range 3-30. Bars to search for OB formations.
Liquidity Sweep Threshold: Default 0.3%, Range 0.05-1.0%. Minimum wick extension beyond swing points.
Display Settings
Show Probability Table: Toggle the probability matrix display on/off.
Show Top N Probabilities: Default 5, Range 3-10. Number of predicted patterns to display.
Show SMC Markers: Toggle on-chart pattern labels.
✅ Best Use Cases
Anticipating continuation or reversal patterns after liquidity sweeps
Identifying high-probability BOS/CHoCH sequences for trend trading
Filtering FVG and Order Block signals based on historical follow-through rates
Building confluence by comparing predicted patterns with other technical analysis
Studying how SMC patterns typically sequence on specific instruments or timeframes
⚠️ Limitations
Predictions are based solely on historical pattern frequency and do not account for fundamental factors
Low sample counts produce unreliable probabilities—always check the Samples display
Market regime changes can invalidate historical transition patterns
The indicator requires sufficient historical data to build meaningful probability matrices
Pattern detection uses standardized parameters that may not capture all institutional activity
💡 What Makes This Unique
Linguistic Modeling Applied to Markets: Treats SMC patterns like words in a language, analyzing how they “flow” together
Quantified Pattern Relationships: Transforms subjective SMC analysis into objective probability percentages
Adaptive Learning: Matrix rebuilds periodically to incorporate recent pattern behavior
Comprehensive SMC Coverage: Tracks all major Smart Money Concepts in a unified probability framework
🔬 How It Works
1. Pattern Detection Phase
Each bar is analyzed for SMC formations using configurable detection parameters
A priority hierarchy assigns the most significant pattern when multiple detections occur
2. Sequence Encoding Phase
Detected patterns are stored in a rolling history buffer of recent classifications
The current N-gram context is encoded into a unique integer identifier
3. Matrix Construction Phase
Historical pattern sequences are iterated to count transition occurrences
Each context-to-next-pattern transition increments the appropriate matrix cell
4. Probability Calculation Phase
Current context ID retrieves corresponding transition counts from the matrix
Raw counts are converted to percentages based on total context occurrences
5. Visualization Phase
Probabilities are sorted and the top N predictions are displayed in the table
Chart markers identify the current detected pattern for visual reference
💡 Note:
This indicator performs best when used as a confluence tool alongside traditional SMC analysis. The probability predictions highlight statistically common pattern sequences but should not be used as standalone trading signals. Always verify predictions against price action context, higher timeframe structure, and your overall trading plan. Monitor the sample count to ensure predictions are based on adequate historical data.

🟡 GOLD 4H HUD v12 — Time-Safe Nuclear Edition🟡 GOLD 4H HUD v12 — Time-Safe Nuclear Edition
A full–scale Smart Money Concepts (SMC) analytics engine designed exclusively for XAUUSD on the 4-Hour timeframe.
This script combines market structure, liquidity, displacement, order blocks, imbalance, volume profile, SMT divergence, and institutional behavior modeling into a single unified HUD.
Built with a time-safe architecture, all structural elements (OB/FVG/Sweep) are stored by timestamp to minimize repainting and preserve event integrity.
📌 Core Features (12 Modules + Full HUD)
1 — Market Structure Engine
Automatically detects:
HH / HL / LH / LL
BOS (Break of Structure)
MSS (Market Structure Shift)
CHOCH (Change of Character)
Real swing pivots & trend state
2 — Sweep Engine (Liquidity Grab Detection)
Identifies institutional liquidity grabs:
Break + reclaim of highs/lows
ATR-filtered invalidation
Displacement-backed sweeps
3 — Time-Safe FVG Engine
Detects Bullish/Bearish Fair Value Gaps
ATR-tolerant FVG logic
Automatic right-extension
Auto-delete when filled or invalid
4 — Time-Safe Order Block Engine
Demand & Supply OB detection
Strength classification (Weak vs Strong)
FVG-overlap confirmation
Timestamp-locked (non-repainting)
5 — Volume Profile Engine (HVN / LVN / POC)
Real-time micro-profile:
High Volume Node (HVN)
Low Volume Node (LVN)
Point of Control (POC)
6 — SMT Engine (Gold vs DXY Divergence)
Smart Money Divergence built-in:
Bullish SMT
Bearish SMT
Directional confirmation with zero lag
7 — Displacement Engine
Measures institutional impulse:
Body-based impulse detection
Multi-leg continuation signals
FVG continuation moves
Generates displacement score
8 — Premium / Discount Model
Auto-classifies price into:
Discount (Buy zone)
Premium (Sell zone)
9 — SMC Trend Engine (Score-Based)
Combines 10+ factors:
Structure
FVG
OB power
Displacement
POC positioning
SMT conditions
Outputs:
BULL / BEAR / RANGE
Full scoring system
10 — Institutional Imbalance Model (IMB Engine)
Combines:
PD zones
Sweep direction
Displacement
SMT
OB strength
CHOCH/MSS
A complete institutional bias filter.
11 — Entry Engine (Signal Fusion Model)
Entry conditions fuse:
Sweep
CHOCH
Displacement
OB strength
FVG alignment
SMT confirmation
Also outputs:
Suggested SL/TP
Entry score
12 — Trendline Engine
Auto-draws:
HL → HL bullish trendlines
LH → LH bearish trendlines
+ Full Nuclear HUD
Displays:
Market structure
Trend direction
SMT / CHOCH / MSS
FVG / OB zones
HVN / LVN / POC
Liquidity strength
Entry model
Liquidity Magnet direction
SL/TP map
A complete institutional dashboard in one place.
⚠ Usage Requirement
This script is designed ONLY for the 4H timeframe.
✨ Summary
GOLD 4H HUD v12 — Time-Safe Nuclear Edition
is not just an indicator.
It is a full institutional-grade SMC analysis system, built specifically for Gold.
If you trade XAUUSD on the 4H timeframe —
this is your complete market intelligence HUD

darshakssc SMC Infinity Enginedarshakssc SMC Infinity Engine is an advanced Smart Money Concepts–based tool designed to help traders visually understand institutional price behavior such as liquidity sweeps, displacement moves, and structure breaks — all without repainting.
This script does not predict the future or guarantee outcomes.
Instead, it provides a structured price-action framework to help traders study how markets move during key intraday phases.
🔍 Core Concepts Used
This indicator highlights:
Liquidity Sweeps (equal highs/lows taken out)
Displacement Candles (strong institutional momentum bars)
Break of Structure (BOS) confirmations
Kill Zone Sessions (optional smart-money timing filter)
Higher Time Frame Trend Alignment
Dynamic Entry, Stop Loss, and Target Levels
Internal trade outcome tagging (TP1/TP2/TP3/SL)
These components are widely used in institutional price-action models and can help users understand how liquidity and structure interact throughout the trading day.
📊 What the Indicator Displays
LONG / SHORT signals after confirmed BOS
Entry, SL, TP1, TP2, TP3 mapped directly on the chart
Background highlighting for liquidity sweep zones
A clean dashboard showing:
Current symbol
Current price
Number of setups recognized
TP1/TP2/TP3 stats
SL count
Live win-rate calculation
Last outcome recorded
All visuals are provided for study purposes to help users review how price reacts during key structure shifts.
🧠 How to Use It (Educational Purpose)
This tool is designed as a market research & educational study aid.
You can use it to:
Observe how liquidity sweeps often precede directional moves
Study how displacement confirms institutional intent
Analyze BOS-based structure shifts
Compare HTF trend alignment with LTF execution
Review trade outcomes historically for self-improvement
It can assist in building discipline and consistency when learning SMC-style concepts — without any automation or strategy execution.
⚠️ Important Notes
This script does not repaint.
This is not a trading system, signal generator, or financial advice.
All information is for educational and informational purposes only.
Past performance does not guarantee future results.
Users should always perform their own analysis and risk management.
🛡️ Compliance Disclaimer
This script is provided for educational purposes only.
It does not constitute investment advice, does not guarantee results, and should not be used as the sole basis for any trading decision.

CRT / ORB Signals [Yosiet]What is the CRT Pattern?
The Counter-Retracement Pattern is a classic three-candle setup that reveals moments of market structure weakness and potential reversal. It occurs when a strong move is temporarily rejected, signaling a possible continuation.
Several names for the same candlestick pattern: CRT, ORB, Morning Star, Evening Star, and others, but I'm not going to talk about it.
Here’s the anatomy of a Bullish CRT:
Candle 1 (C1: The Signal Candle): A significant momentum candle in a downtrend.
Candle 2 (C2: The Retracement/Sweep Candle): This is the critical candle. It must sweep the low of C1 (liquidity grab / sweep) but then close with its body inside the range of C1 .
Candle 3 (C3: The Confirmation/Entry Candle): A bullish candle that closes above C2's close, confirming the pattern.
Here’s the anatomy of a Bearish CRT:
The bearish pattern is the exact inverse, sweeping the high of Candle 1.
Why This Indicator?
Clarity and Precision. This script is built for accuracy and minimalism.
No Repainting: The logic is calculated on the closed historical bars. The signal is only plotted on the entry candle (Candle 3) after it has closed.
Clean Visuals: Instead of cluttering every candle, it shows you only what you need:
Green Up Arrow: Signals a confirmed Bullish CRT, suggesting a Long entry.
Red Down Arrow: Signals a confirmed Bearish CRT, suggesting a Short entry.
Faint Circles: Subtle white circles mark the high/low of Candle 1 and Candle 2, helping you visually trace the pattern structure without obstruction.

HTF Candles Pro by MurshidFx# HTF Candles Pro by MurshidFx
## Professional Trading Indicator for Multi-Timeframe Market Structure Analysis
**HTF Candles Pro** is an advanced, open-source trading indicator that synthesizes Higher Timeframe (HTF) candle visualization with CISD (Change in State of Delivery) detection, providing comprehensive market structure analysis across multiple timeframes. Designed for traders at all experience levels—from scalpers to swing traders—this tool enables precise alignment of trades with higher timeframe momentum while identifying critical market structure transitions.
---
## Core Functionality
This indicator integrates three essential analytical frameworks:
- **HTF Candle Visualization** – Inspired by the innovative work of Fadi x MMT's MTF Candles indicator
- **CISD Detection System** – Algorithmic identification of significant market structure reversals
- **Intelligent Session Level Management** – Automated consolidation of overlapping session markers for enhanced chart clarity
The result is a sophisticated yet streamlined analytical tool that delivers actionable market insights with minimal visual complexity.
---
## Feature Set
### Higher Timeframe Candle Analysis
Monitor higher timeframe price action seamlessly without chart switching. The indicator employs automatic HTF selection based on current timeframe, with manual override capability.
**Components:**
- **Primary HTF Display**: Automatically positioned adjacent to current price action
- **Secondary HTF Display**: Optional dual-timeframe analysis capability
- **Adaptive Time Labeling**: Context-aware formatting (intraday times, day names, week numbers)
- **Real-Time Countdown**: Optional timer displaying remaining time until HTF candle close
- **Customizable Color Schemes**: Full color customization for bullish and bearish candles
### CISD Detection (Change in State of Delivery)
The CISD system identifies critical inflection points where market structure undergoes directional change, signaling potential trend reversals or continuations.
**Mechanism:**
- **Market Structure Monitoring**: Continuous tracking of swing highs and lows
- **Liquidity Sweep Detection**: Identification of stop-hunt patterns preceding reversals
- **Reversal Confirmation**: Validation-based CISD level plotting upon structure break confirmation
- **Clear Visual Signals**: Bullish CISD (blue) and bearish CISD (red) demarcation
- **Optimized Display**: Default 5-bar line length (adjustable) minimizes chart clutter
**Technical Definition:**
CISD occurs when price breaches structure in one direction—typically sweeping liquidity and triggering stops—then reverses to break structure in the opposite direction, indicating a fundamental shift in market delivery bias.
### Intelligent Session Level Management
Eliminates visual clutter caused by overlapping session opens at identical price levels through automated consolidation.
**Functionality:**
- **Automatic Consolidation**: Merges multiple concurrent session opens into single reference lines
- **Combined Labeling**: Creates unified labels (e.g., "Week-Day Open," "4H-Day-Week Open")
- **Enhanced Clarity**: Maintains professional chart aesthetics while preserving all relevant information
**Supported Session Intervals:**
- 30-Minute Opens
- 4-Hour Opens
- Daily Opens
- Weekly Opens
- Monthly Opens
### Advanced Market Structure Tools
**Liquidity Sweep Identification:**
Highlights price wicks extending beyond previous HTF extremes that close within range—characteristic liquidity grab patterns.
**HTF Midpoint Reference:**
Displays the 50% retracement level of the most recent completed HTF candle, serving as a key reference for entries and profit targets.
**HTF Opening Price:**
Tracks current HTF candle open price, frequently functioning as dynamic support or resistance.
**Interval Demarcation:**
Visual separators defining HTF period boundaries for enhanced temporal clarity.
### Information Dashboard
Compact, customizable dashboard displaying:
- Current symbol and active timeframe
- HTF candle countdown timer
- Active trading session (Asia/London/New York)
- Current date and time
Flexible positioning: configurable for any chart corner.
---
## Default Configuration
Optimized settings for immediate professional-grade chart presentation:
- **Secondary HTF**: Disabled (enable for multi-timeframe comparative analysis)
- **CISD Bullish Color**: Blue (#0080ff) – optimal visibility with reduced eye strain
- **CISD Line Width**: 1 pixel – subtle yet discernible
- **CISD Line Length**: 5 bars – balanced visibility without excessive clutter
- **Session Opens**: Smart consolidation enabled – eliminates overlapping labels
---
## Application Strategies
### Trend Following
1. Monitor CISD confirmations aligned with HTF trend direction
2. Utilize HTF candle color for directional bias confirmation
3. Execute entries on pullbacks to HTF midpoint or open price levels
### Reversal Trading
1. Identify counter-trend CISD formations
2. Await HTF candle close confirming new directional bias
3. Use session opens as secondary confirmation levels
### Scalping
1. Trade exclusively in HTF candle direction
2. Employ lower timeframe CISD signals for precise entry timing
3. Target HTF midpoint or subsequent session open levels
### Structure-Based Trading
1. Mark liquidity sweep levels as potential reversal zones
2. Monitor CISD formations at key session opens
3. Confirm trend changes via HTF candle closes
---
## Customization Parameters
Comprehensive customization options:
- **Color Schemes**: Independent control of bull/bear candles, borders, CISD signals, session levels
- **Dimensional Settings**: Candle width, line thickness, label sizing
- **Display Quantities**: HTF candle count (1-10 range)
- **Positioning**: Candle offset, dashboard placement, label positioning
- **Line Styles**: Solid, dashed, or dotted rendering
- **Timeframe Selection**: Manual secondary HTF specification
---
## Attribution
**HTF Candle Visualization:**
The HTF candle rendering methodology draws inspiration from Fadi x MMT's "MTF Candles" indicator. Their elegant implementation of multi-timeframe candle visualization provided valuable reference for this development. Recognition and appreciation to their contribution to the TradingView community.
**CISD Detection:**
Proprietary CISD detection algorithm engineered to identify market structure transitions with high signal clarity and reduced false positive rate.
**Session Level Consolidation:**
Custom-developed intelligent grouping system addressing the common challenge of overlapping session labels at coincident price levels.
---
## Open Source License
This indicator is released as open source for the TradingView community. Permitted uses include:
- Implementation in live trading
- Educational study for Pine Script learning
- Personal modification and customization
- Distribution among trading communities
Community contributions, improvements, and derivative works are welcomed and encouraged.
---
## Implementation Guide
1. **Installation**: Click "Add to Chart"
2. **Configuration Access**: Open indicator settings panel
3. **Initial Use**: Default settings provide optimal starting configuration
4. **Optional Features**: Enable secondary HTF for multi-timeframe analysis
5. **Theme Integration**: Adjust color schemes to match chart aesthetics
---
## Best Practices
**Timeframe Optimization:**
- 1-5 minute charts: Optimal with 15m or 1H HTF
- 15-30 minute charts: Effective with 4H HTF
- 1-4 hour charts: Suitable for Daily HTF
- Daily charts: Best utilized with Weekly/Monthly HTF
**CISD Trading Guidelines:**
- Require CISD confirmation before position entry
- Prioritize CISD signals at significant levels (session opens, HTF midpoints)
- Confirm CISD direction aligns with HTF candle bias
- Apply contextual filtering—not all CISD signals warrant trades
**Session Open Strategy:**
- Weekly opens typically provide robust support/resistance
- Daily opens offer reliable intraday reference points
- 4-Hour opens effective for short-term scalping
- Consolidated labels (e.g., "Week-Day Open") indicate confluence zones with elevated significance
---
## Technical Specifications
**Performance Optimization:**
- Intelligent object management prevents TradingView rendering limits
- Efficient array processing for session consolidation
- Proper memory management through systematic object deletion
- Consistent performance across all timeframe ranges
**Compatibility:**
- Universal timeframe support
- Optimized for all market types (forex, stocks, crypto, futures)
- Minimal computational overhead
---
## Support & Development
**Feedback Channels:**
- Comment section for user feedback and suggestions
- Bug reports and feature requests welcomed
- Community-driven enhancement consideration
**Documentation:**
- Well-commented source code for learning purposes
- Clear section organization for easy navigation
- Comprehensive type definitions for structural clarity
- Educational value for market structure concept understanding
---
## Version Information
**Version:** 1.0 (Initial Release)
**License:** Open Source
**Category:** Multi-Timeframe Analysis | Market Structure
**Compatibility:** All Timeframes
**Language:** Pine Script v5
---
**For optimal results:**
- Provide feedback through comments
- Share with trading communities
- Submit enhancement suggestions
- Report technical issues for resolution
**Professional Support:**
Available through comment section for technical inquiries, implementation questions, and feature requests.
---
*Developed for the TradingView trading community | Professional-grade market structure analysis | Open source contribution*

Liquidity & inducementsHi all!
This indicator will show liquidity and inducements.
I will continue to try to add different types of liquidity and inducements, at this moment it contains 6 kinds of liquidity/inducement, they are:
• Grabs
• Big grabs
• Sweeps
• Turtle soups
• Equal highs/lows (liquidity and inducement)
• BSL & SSL
And 1 type of inducement:
• Retracement
This description will contain indicator examples of each individual liquidity and inducement. They will all be with the default settings.
Settings
First you will find settings for the market structure (BOS/CHoCH/CHoCH+). Select left and right pivot lengths and if the pivots should have a label or not.
This is the base foundation of this indicator and is possible with my library 'PriceAction' ().
You will see solid lines for break of structures (BOS), change of characters (CHoCH) and change of character plus (CHoCH+).
The pivots found will be the core of this indicator and will show you when the closing price breaks it. When that happens a break of structure (BOS) or a change of character (CHoCH or CHoCH+) will be created. The latest 5 pivots found within the current trend will be kept to take action on.
A break of structure is removed if an earlier pivot within the same trend is broken and the pivot's high price for a bullish trend or low price for a bearish trend is more extreme than the BOS pivot's price.
You are able to show the pivots that are used. "HH" (higher high), "HL" (higher low), "LH" (lower high), "LL" (lower low) and "H"/"L" (for pivots (high/low) when the trend has changed) are the labels used.
In the next section ('Liquidity ($$$)') you can select which types of liquidity you want to see. Note that 'Equal highs/lows' can also show inducement (more on that later).
In the section afterwards ('Inducement (IDM)') you can select if you want retracement inducements to be visible or not. More information on what they are later on.
The section for each individual liquidity and/or inducement can first contain a line named 'Pivot', where you can set the pivot lengths (first left, then right). Then you can set the 'Lookback', which means that the 'Lookback' number of past pivots is to take action on. After that you set the 'Timeframe' for the pivots used. That means that all available liquidity/inducements will be from your desired timeframe. Lastly you set the color of the liquidity/inducement (either a single color or bullish followed by bearish colors).
Lastly in the settings you can select the font sizes for the market structure and liquidity/inducements and what style liquidity/inducements lines will have. The sizes defaults to 7 and has a dotted line look.
Grabs
Liquidity grabs and liquidity sweeps are very similar. It all depends on if the current bar closed above/below the liquidity pivot and on if its a continuation or reversal. In a liquidity grab the bar that's above or below the liquidity pivot was not closed above or below it. Like this:
Or
The visual feedback will be a dotted line between the liquidity pivot and liquidity grab bar and a linefill between the high of the liquidity grab bar and the liquidity pivot.
Indicator example:
Big grabs
This is another 'grabs' option. You can show an additional grab if you want to. I suggest having this grab from a higher timeframe or with larger pivot lengths than the other grab.
The default is with the chart timeframe and 10/10 as pivot lengths.
Indicator example:
Sweeps
A liquidity sweep is like a liquidity grab but with the difference that price closes above/below and has a continuation instead of a reversal. If the liquidity pivot was at the same bar as a BOS/CHoCH/CHoCH+ it will not be a liquidity grab but a structural break instead.
They can look like this:
Indicator example;
Turtle soups
If only one candle is beyond the pivot it could be a liquidity grab. It's a grab if price didn't close beyond the liquidity pivot, if so it's invaliditet. Turtle soups are basically false breakouts that takes liquidity (is a false breakout from a pivot with the lengths and timeframe from the settings).
The turtle soup can have a confirmation in the terms of a change of character (CHoCH). You can enable this in the settings section for 'Turtle soups' through the 'Confirmation' checkbox (enabled by default). The turtle soup strategy usually comes with some sort of confirmation, in this case a CHoCH, but it can also be a market structure shift (MSS) or a change in state of delivery (CISD).
The addition of turtle soups is possible through my script 'Turtle soup' ().
The drawing will be a dotted line between the liquidity pivot and the last bar of the false breakout and a box from the start of the false breakout to the end of it.
Indicator example:
Equal highs/lows
Equal highs/lows will always show liquidity, but might also show inducement. Inducement will be shown on equal lows if the trend is bullish and on equal highs if it's bearish, like this:
Or
Equal highs can only be created if the second pivot is lower than the first one. Equal lows can only be created if the second pivot is higher than the first one. If that is not the case it could be a liquidity grab.
When equal highs or equal lows are find that produces inducement (equal lows in a bullish trend and equal highs in a bearish trend), the indicator will first display inducement and will show liquidity once traders are induced to enter the security. Stop loss placement, for liquidity, is 0.1 * the average true range (ATR, of length 14). They will look like this:
Only inducement:
Inducement and liquidity:
Indicator example:
Equal highs/lows inducements can not be triggered after a BOS/CHoCH/CHoCH+. They are cleared upon a structural break.
BSL & SSL
Buyside liquidity (BSL) and sellside liquidity (SSL) will be shown. A pivot that's been mitigated (touched by price) can never be BSL or SSL. The BSL/SSL available will be dynamic while price moves (work in Replay and lower timeframes that moves fast) and pick the latest pivot/s (with left and right lengths from the 'Market structure' section). You can define how many BSL/SSL you want to see with a default value of 1, meaning only 1 BSL and 1 SSL can be shown. If there is no unmitigated high (BSL) or low (SSL), no BSL/SSL will be available to show. If there are BSL/SSL available they're very useful to use as targets for entering a trade.
The will look like this when available;
And without BSL available:
Or
And without SSL available:
Note that the examples without BSL/SSL available could have liquidity available from previous price legs.
This can be an example of a BSL/SSL sequence:
First both buyside and sellside liquidity is available:
Then a new low appears and new sellside liquidity is available:
Then buyside liquidity is mitigated, so only sellside liquidity is available:
A new high pivot appears and buyside liquidity is available again:
Lastly a bearish CHoCH happens and sellside liquidity is mitigated, only buyside liquidity is available:
Retracement
The first retracement after a BOS/CHoCH/CHoCH+ is considered an inducement with the mission to get traders into a trade prematurely to get stopped out. This level is shown and look like this:
Or
A retracement inducement is removed when a new BOS/CHoCH/CHoCH+ appears and it's not triggered.
---------------------------
As of now there aren't any alerts available. You cannot use the Pine Screener from Tradingview either to see new liquidity/inducement events. I have this planned for future updates though.
I hope that this long description makes sense, let me know otherwise! Also let me know if you experience any bugs or have a feature request or just want to share good settings to use.
Best of trading luck!

MJBFX-Strategy (Futures Optimized)The MJBFX-Strategy is a complete market mapping tool designed to give traders a clear view of liquidity, session dynamics, and premium/discount levels. It loads automatically on any chart, fully optimized for futures and forex trading.
🔑 Key Features
Asian Session Range
Highlights the previous Asian session with a shaded box
Fixed until London open for precise reference
VWAP from Asian Session
Plots the VWAP of the previous Asian session
Dynamic fair value benchmark for intraday trading
Liquidity Sweeps (Optimized)
Detects sweeps of the Asian session high/low
Shown only on 30m, 1h, and 4h charts to reduce noise
Clean, minimal labels for clarity
Automatic Fibonacci Zone
Draws a shaded retracement zone (38.2%–61.8%) of the Asian range
Transparent fill makes it easy to read price action
Killzones
Highlights London (07:00–10:00) and New York (13:00–16:00) killzones
Semi-opaque shading to keep charts clean
Auto Trade Box (Risk/Reward)
On sweep confirmation, plots a 2R target box
Auto stop loss and take profit levels based on futures tick size
🎯 Why Use It?
The MJBFX-Strategy removes the need for manual drawing.It automatically maps:
Session highs and lows
Liquidity sweeps
VWAP and fib retracement zones
Key killzones
Perfect for session-based intraday trading in both futures and forex.
⚡ No manual settings required.Just load it onto your chart for an instant institutional view of the market.

CLS Patterns + Price Action Levels📌 Key Features:
✅ CLS Candle Patterns Detection:
CLS Type 1 (Sweeps & Closes Opposite) – Confirms liquidity sweeps with opposite direction close.
CLS Type 2 (Sweeps but No Opposite Close) – Identifies liquidity traps without full reversal.
CLS Type 3 (Engulfing Candles) – Strong momentum shifts with engulfing price action.
CLS Type 4 (Order Block Reversals) – Institutional order flow recognition.
✅ Institutional & Price Action Levels:
250 Pip Institutional Levels – Major S&R zones for Forex & Indices.
Minor Quarter Points (25 Pips) – Intraday precision for refined entries.
✅ Liquidity Imbalance & Order Flow Gaps:
Detects early impulse moves & liquidity voids
Highlights areas of market inefficiency & potential reversals
✅ Higher Timeframe EMA for Trend Confirmation:
Customizable Weekly 3 EMA Overlay
Dynamic color change based on price action
✅ Built-in Alerts for CLS Patterns:
Real-time alerts for CLS buy/sell signals
Configurable notifications for trade execution
🎯 How to Use:
1️⃣ Enable CLS Pattern Signals to spot liquidity sweep candles with directional confirmation.
2️⃣ Use Institutional & QP Levels to identify key areas where price is likely to react.
3️⃣ Monitor Liquidity Imbalances to detect inefficient price moves that may fill.
4️⃣ Confirm Trend with HTF EMA to trade with momentum.
5️⃣ Set Alerts for CLS patterns and key price levels to stay ahead of the market.
This indicator is ideal for Forex, Indices, and Crypto traders looking to refine their entries with precise price action confirmations.

Liquidity Maxing [JOAT]Liquidity Maxing - Institutional Liquidity Matrix
Introduction
Liquidity Maxing is an open-source strategy for TradingView built around institutional market structure concepts. It identifies structural shifts, evaluates trades through multi-factor confluence, and implements layered risk controls.
The strategy is designed for swing trading on 4-hour timeframes, focusing on how institutional order flow manifests in price action through structure breaks, inducements, and liquidity sweeps.
Core Functionality
Liquidity Maxing performs three primary functions:
Tracks market structure to identify when control shifts between buyers and sellers
Scores potential trades using an eight-factor confluence system
Manages position sizing and risk exposure dynamically based on volatility and user-defined limits
The goal is selective trading when multiple conditions align, rather than frequent entries.
Market Structure Engine
The structure engine tracks three key events:
Break of Structure (BOS): Price pushes beyond a prior pivot in the direction of trend
Change of Character (CHoCH): Control flips from bullish to bearish or vice versa
Inducement Sweeps (IDM): Market briefly runs stops against trend before moving in the real direction
The structure module continuously updates strong highs and lows, labeling structural shifts visually. IDM markers are optional and disabled by default to maintain chart clarity.
The trade engine requires valid structure alignment before considering entries. No structure, no trade.
Eight-Factor Confluence System
Instead of relying on a single indicator, Liquidity Maxing uses an eight-factor scoring system:
Structure alignment with current trend
RSI within healthy bands (different ranges for up and down trends)
MACD momentum agreement with direction
Volume above adaptive baseline
Price relative to main trend EMA
Session and weekend filter (configurable)
Volatility expansion/contraction via ATR shifts
Higher-timeframe EMA confirmation
Each factor contributes one point to the confluence score. The default minimum confluence threshold is 6 out of 8, but you can adjust this from 1-8 based on your preference for trade frequency versus selectivity.
Only when structure and confluence agree does the strategy proceed to risk evaluation.
Dynamic Risk Management
Risk controls are implemented in multiple layers:
ATR-based stops and targets with configurable risk-to-reward ratio (default 2:1)
Volatility-adjusted position sizing to maintain consistent risk per trade as ranges expand or compress
Daily and weekly risk budgets that halt new entries once thresholds are reached
Correlation cooldown to prevent clustered trades in the same direction
Global circuit breaker with maximum drawdown limit and emergency kill switch
If any guardrail is breached, the strategy will not open new positions. The dashboard clearly displays risk state for transparency.
Market Presets
The strategy includes configuration presets optimized for different market types:
Crypto (BTC/ETH): RSI bands 70/30, volume multiplier 1.2, enhanced ATR scaling
Forex Majors: RSI bands 75/25, volume multiplier 1.5
Indices (SPY/QQQ): RSI bands 70/30, volume multiplier 1.3
Custom: Default values for user customization
For crypto assets, the strategy automatically applies ATR volatility scaling to account for higher volatility characteristics.
Monitoring and Dashboards
The strategy includes optional monitoring layers:
Risk Operations Dashboard (top-right):
Trend state
Confluence score
ATR value
Current position size percentage
Global drawdown
Daily and weekly risk consumption
Correlation guard state
Alert mode status
Performance Console (top-left):
Net profit
Current equity
Win rate percentage
Average trade value
Sharpe-style ratio (rolling 50-bar window)
Profit factor
Open trade count
Optional risk tint on chart background provides visual indication of "safe to trade" versus "halted" state.
All visualization elements can be toggled on/off from the inputs for clean chart viewing or full telemetry during parameter tuning.
Alerts and Automation
The strategy supports alert integration with two formats:
Standard alerts: Human-readable messages for long, short, and risk-halt conditions
Webhook format: JSON-formatted payloads ready for external execution systems (optional)
Alert messages are predictable and unambiguous, suitable for manual review or automated forwarding to execution engines.
Built-in Validation Suite
The strategy includes an optional validation layer that can be enabled from inputs. It checks:
Internal consistency of structure and confluence metrics
Sanity and ordering of risk parameters
Position sizing compliance with user-defined floors and caps
This validation is optional and not required for trading, but provides transparency into system operation during development or troubleshooting.
Strategy Parameters
Market Presets:
Configuration Preset: Choose between Crypto (BTC/ETH), Forex Majors, Indices (SPY/QQQ), or Custom
Market Structure Architecture:
Pivot Length: Default 5 bars
Filter by Inducement (IDM): Default enabled
Visualize Structure: Default enabled
Structure Lookback: Default 50 bars
Risk & Capital Preservation:
Risk:Reward Ratio: Default 2.0
ATR Period: Default 14
ATR Multiplier (Stop): Default 2.0
Max Drawdown Circuit Breaker: Default 10%
Risk per Trade (% Equity): Default 1.5%
Daily Risk Limit: Default 6%
Weekly Risk Limit: Default 12%
Min Position Size (% Equity): Default 0.25%
Max Position Size (% Equity): Default 5%
Correlation Cooldown (bars): Default 3
Emergency Kill Switch: Default disabled
Signal Confluence:
RSI Length: Default 14
Trend EMA: Default 200
HTF Confirmation TF: Default Daily
Allow Weekend Trading: Default enabled
Minimum Confluence Score (0-8): Default 6
Backtesting Considerations
When backtesting this strategy, consider the following:
Commission: Default 0.05% (adjustable in strategy settings)
Initial Capital: Default $100,000 (adjustable)
Position Sizing: Uses percentage of equity (default 2% per trade)
Timeframe: Optimized for 4-hour charts, though can be tested on other timeframes
Results will vary significantly based on:
Market conditions and volatility regimes
Parameter settings, especially confluence threshold
Risk limit configuration
Symbol characteristics (crypto vs forex vs equities)
Past performance does not guarantee future results. Win rate, profit factor, and other metrics should be evaluated in context of drawdown periods, trade frequency, and market conditions.
How to Use This Strategy
This is a framework that requires understanding and parameter tuning, not a one-size-fits-all solution.
Recommended workflow:
Start on 4-hour timeframe with default parameters and appropriate market preset
Run backtests and study performance console metrics: focus on drawdown behavior, win rate, profit factor, and trade frequency
Adjust confluence threshold to match your risk appetite—higher thresholds mean fewer but more selective trades
Set realistic daily and weekly risk budgets appropriate for your account size and risk tolerance
Consider ATR multiplier adjustments based on market volatility characteristics
Only connect alerts or automation after thorough testing and parameter validation
Treat this as a risk framework with an integrated entry engine, not merely an entry signal generator. The risk controls are as important as the trade signals.
Strategy Limitations
Designed for swing trading timeframes; may not perform optimally on very short timeframes
Requires sufficient market structure to identify pivots; may struggle in choppy or low-volatility environments
Crypto markets require different parameter tuning than traditional markets
Risk limits may prevent entries during favorable setups if daily/weekly budgets are exhausted
Correlation cooldown may delay entries that would otherwise be valid
Backtesting results depend on data quality and may not reflect live trading with slippage
Design Philosophy
Many indicators tell you when price crossed a moving average or RSI left oversold. This strategy addresses questions institutional traders ask:
Who is in control of the market right now?
Is this move structurally significant or just noise?
Do I want to add more risk given what I've already done today/week?
If I'm wrong, exactly how painful can this be?
The strategy provides disciplined, repeatable answers to these questions through systematic structure analysis, confluence filtering, and multi-layer risk management.
Technical Implementation
The strategy uses Pine Script v6 with:
Custom types for structure, confluence, and risk state management
Functional programming approach for reusable calculations
State management through persistent variables
Optional visual elements that can be toggled independently
The code is open-source and can be modified to suit individual needs. All important logic is visible in the source code.
Disclaimer
This script is provided for educational and informational purposes only. It is not intended as financial, investment, trading, or any other type of advice or recommendation. Trading involves substantial risk of loss and is not suitable for all investors. Past performance, whether real or indicated by historical tests of strategies, is not indicative of future results.
No representation is being made that any account will or is likely to achieve profits or losses similar to those shown. In fact, there are frequently sharp differences between backtested results and actual results subsequently achieved by any particular trading strategy.
The user should be aware of the risks involved in trading and should trade only with risk capital. The authors and publishers of this script are not responsible for any losses or damages, including without limitation, any loss of profit, which may arise directly or indirectly from use of or reliance on this script.
This strategy uses technical analysis methods and indicators that are not guaranteed to be accurate or profitable. Market conditions change, and strategies that worked in the past may not work in the future. Users should thoroughly test any strategy in a paper trading environment before risking real capital.
Commission and slippage settings in backtests may not accurately reflect live trading conditions. Real trading results will vary based on execution quality, market liquidity, and other factors not captured in backtesting.
The user assumes full responsibility for all trading decisions made using this script. Always consult with a qualified financial advisor before making investment decisions.
Enjoy - officialjackofalltrades

Obsidian Flux Matrix# Obsidian Flux Matrix | JackOfAllTrades
Made with my Senior Level AI Pine Script v6 coding bot for the community!
Narrative Overview
Obsidian Flux Matrix (OFM) is an open-source Pine Script v6 study that fuses social sentiment, higher timeframe trend bias, fair-value-gap detection, liquidity raids, VWAP gravitation, session profiling, and a diagnostic HUD. The layout keeps the obsidian palette so critical overlays stay readable without overwhelming a price chart.
Purpose & Scope
OFM focuses on actionable structure rather than marketing claims. It documents every driver that powers its confluence engine so reviewers understand what triggers each visual.
Core Analytical Pillars
1. Social Pulse Engine
Sentiment Webhook Feed: Accepts normalized scores (-1 to +1). Signals only arm when the EMA-smoothed value exceeds the `sentimentMin` input (0.35 by default).
Volume Confirmation: Requires local volume > 30-bar average × `volSpikeMult` (default 2.0) before sentiment flags.
EMA Cross Validation: Fast EMA 8 crossing above/below slow EMA 21 keeps momentum aligned with flow.
Momentum Alignment: Multi-timeframe momentum composite must agree (positive for longs, negative for shorts).
2. Peer Momentum Heatmap
Multi-Timeframe Blend: RSI + Stoch RSI fetched via request.security() on 1H/4H/1D by default.
Composite Scoring: Each timeframe votes +1/-1/0; totals are clamped between -3 and +3.
Intraday Readability: Configurable band thickness (1-5) so scalpers see context without losing space.
Dynamic Opacity: Stronger agreement boosts column opacity for quick bias checks.
3. Trend & Displacement Framework
Dual EMA Ribbon: Cyan/magenta ribbon highlights immediate posture.
HTF Bias: A higher-timeframe EMA (default 55 on 4H) sets macro direction.
Displacement Score: Body-to-ATR ratio (>1.4 default) detects impulses that seed FVGs or VWAP raids.
ATR Normalization: All thresholds float with volatility so the study adapts to assets and regimes.
4. Intelligent Fair Value Gap (FVG) System
Gap Detection: Three-candle logic (bullish: low > high ; bearish: high < low ) with ATR-sized minimums (0.15 × ATR default).
Overlap Prevention: Price-range checks stop redundant boxes.
Spacing Control: `fvgMinSpacing` (default 5) avoids stacking from the same impulse.
Storage Caps: Max three FVGs per side unless the user widens the limit.
Session Awareness: Kill zone filters keep taps focused on London/NY if desired.
Auto Cleanup: Boxes delete when price closes beyond their invalidation level.
5. VWAP Magnet + Liquidity Raid Engine
Session or Rolling VWAP: Toggle resets to match intraday or rolling preferences.
Equal High/Low Scanner: Looks back 20 bars by default for liquidity pools.
Displacement Filter: ATR multiplier ensures raids represent genuine liquidity sweeps.
Mean Reversion Focus: Signals fire when price displaces back toward VWAP following a raid.
6. Session Range Breakout System
Initial Balance Tracking: First N bars (15 default) define the session box.
Breakout Logic: Requires simultaneous liquidity spikes, nearby FVG activity, and supportive momentum.
Z-Score Volume Filter: >1.5σ by default to filter noisy moves.
7. Lifestyle Liquidity Scanner
Volume Z-Scores: 50-bar baseline highlights statistically significant spikes.
Smart Money Footprints: Bottom-of-chart squares color-code buy vs sell participation.
Panel Memory: HUD logs the last five raid timestamps, direction, and normalized size.
8. Risk Matrix & Diagnostic HUD
HUD Structure: Table in the top-right summarizes HTF bias, sentiment, momentum, range state, liquidity memory, and current risk references.
Signal Tags: Aggregates SPS, FVG, VWAP, Range, and Liquidity states into a compact string.
Risk Metrics: Swing-based stops (5-bar lookback) + ATR targets (1.5× default) keep risk transparent.
Signal Families & Alerts
Social Pulse (SPS): Volume-confirmed sentiment alignment; triangle markers with “SPS”.
Kill-Zone FVG: Session + HTF alignment + FVG tap; arrow markers plus SL/TP labels.
Local FVG: Captures local reversals when HTF bias has not flipped yet.
VWAP Raid: Equal-high/low raids that snap toward VWAP; “VWAP” label markers.
Range Breakout: Initial balance violations with liquidity and imbalance confirmation; circle markers.
Liquidity Spike: Z-score spikes ≥ threshold; square markers along the baseline.
Visual Design & Customization
Theme Palette: Primary background RGB (12,6,24). Accent shading RGB (26,10,48). Long accents RGB (88,174,255). Short accents RGB (219,109,255).
Stylized Candles: Optional overlay using theme colors.
Signal Toggles: Independently enable markers, heatmap, and diagnostics.
Label Spacing: Auto-spacing enforces ≥4-bar gaps to prevent text overlap.
Customization & Workflow Notes
Adjust ATR/FVG thresholds when volatility shifts.
Re-anchor sentiment to your webhook cadence; EMA smoothing (default 5) dampens noise.
Reposition the HUD by editing the `table.new` coordinates.
Use multiples of the chart timeframe for HTF requests to minimize load.
Session inputs accept exchange-local time; align them to your market.
Performance & Compliance
Pure Pine v6: Single-line statements, no `lookahead_on`.
Resource Safe: Arrays trimmed, boxes limited, `request.security` cached.
Repaint Awareness: Signals confirm on close; alerts mirror on-chart logic.
Runtime Safety: Arrays/loops guard against `na`.
Use Cases
Measure when social sentiment aligns with structure.
Plan ICT-style intraday rebalances around session-specific FVG taps.
Fade VWAP raids when displacement shows exhaustion.
Watch initial balance breaks backed by statistical volume.
Keep risk/target references anchored in ATR logic.
Signal Logic Snapshot
Social Pulse Long/Short: `sentimentEMA` gated by `sentimentMin`, `volSpike`, EMA 8/21 cross, and `momoComposite` sign agreement. Keeps hype tied to structural follow-through.
Kill-Zone FVG Long/Short: Requires session filter, HTF EMA bias alignment, and an active FVG tap (`bullFvgTap` / `bearFvgTap`). Labels include swing stops + ATR targets pulled from `swingLookback` and `liqTargetMultiple`.
Local FVG Long/Short: Uses `localBullish` / `localBearish` heuristics (EMA slope, displacement, sequential closes) to surface intraday reversals even when HTF bias has not flipped.
VWAP Raids: Detect equal-high/equal-low sweeps (`raidHigh`, `raidLow`) that revert toward `sessionVwap` or rolling VWAP when displacement exceeds `vwapAlertDisplace`.
Range Breakouts: Combine `rangeComplete`, breakout confirmation, liquidity spikes, and nearby FVG activity for statistically backed initial balance breaks.
Liquidity Spikes: Volume Z-score > `zScoreThreshold` logs direction, size, and timestamp for the HUD and optional review workflows.
Session Logic & VWAP Handling
Kill zone + NY session inputs use TradingView’s session strings; `f_inSession()` drives both visual shading and whether FVG taps are tradeable when `killZoneOnly` is true.
Session VWAP resets using cumulative price × volume sums that restart when the daily timestamp changes; rolling VWAP falls back to `ta.vwap(hlc3)` for instruments where daily resets are less relevant.
Initial balance box (`rangeBars` input) locks once complete, extends forward, and stays on chart to contextualize later liquidity raids or breakouts.
Parameter Reference
Trend: `emaFastLen`, `emaSlowLen`, `htfResolution`, `htfEmaLen`, `showEmaRibbon`, `showHtfBiasLine`.
Momentum: `tf1`, `tf2`, `tf3`, `rsiLen`, `stochLen`, `stochSmooth`, `heatmapHeight`.
Volume/Liquidity: `volLookback`, `volSpikeMult`, `zScoreLen`, `zScoreThreshold`, `equalLookback`.
VWAP & Sessions: `vwapMode`, `showVwapLine`, `vwapAlertDisplace`, `killSession`, `nySession`, `showSessionShade`, `rangeBars`.
FVG/Risk: `fvgMinTicks`, `fvgLookback`, `fvgMinSpacing`, `killZoneOnly`, `liqTargetMultiple`, `swingLookback`.
Visualization Toggles: `showSignalMarkers`, `showHeatmapBand`, `showInfoPanel`, `showStylizedCandles`.
Workflow Recipes
Kill-Zone Continuation: During the defined kill session, look for `killFvgLong` or `killFvgShort` arrows that line up with `sentimentValid` and positive `momoComposite`. Use the HUD’s risk readout to confirm SL/TP distances before entering.
VWAP Raid Fade: Outside kill zone, track `raidToVwapLong/Short`. Confirm the candle body exceeds the displacement multiplier, and price crosses back toward VWAP before considering reversions.
Range Break Monitor: After the initial balance locks, mark `rangeBreakLong/Short` circles only when the momentum band is >0 or <0 respectively and a fresh FVG box sits near price.
Liquidity Spike Review: When the HUD shows “Liquidity” timestamps, hover the plotted squares at chart bottom to see whether spikes were buy/sell oriented and if local FVGs formed immediately after.
Metadata
Author: officialjackofalltrades
Platform: TradingView (Pine Script v6)
Category: Sentiment + Liquidity Intelligence
Hope you Enjoy!

Previous Day & Week High/Low LevelsPrevious Day & Week High/Low Levels is a precision tool designed to help traders easily identify the most relevant price levels that often act as strong support or resistance areas in the market. It automatically plots the previous day’s and week’s highs and lows, as well as the current day’s developing internal high and low. These levels are crucial reference points for intraday, swing, and even position traders who rely on price action and liquidity behavior.
Key Features
Previous Day High/Low:
The indicator automatically draws horizontal lines marking the highest and lowest prices from the previous trading day.
These levels are widely recognized as potential zones where the market may react again — either rejecting or breaking through them.
Previous Week High/Low:
The script also tracks and displays the high and low from the last completed trading week.
Weekly levels tend to represent stronger liquidity pools and broader institutional zones, which makes them especially important when aligning higher timeframe context with lower timeframe entries.
Internal Daily High/Low (Real-Time Tracking):
While the day progresses, the indicator dynamically updates the current day’s internal high and low.
This allows traders to visualize developing market structure, identify intraday ranges, and anticipate potential breakouts or liquidity sweeps.
Multi-Timeframe Consistency:
All levels — daily and weekly — remain visible across any chart timeframe, from 1 minute to 1 day or higher.
This ensures traders can maintain perspective and avoid losing track of key zones when switching views.
Customizable Visuals:
The colors, line thickness, and label visibility can be easily adjusted to match personal charting preferences.
This makes the indicator adaptable to any trading style or layout, whether minimalistic or detailed.
How to Use
Identify Key Reaction Zones:
Observe how price interacts with the previous day and week levels. Rejections, consolidations, or clean breakouts around these lines often signal strong liquidity areas or potential directional moves.
Combine with Market Structure or Liquidity Concepts:
The indicator works perfectly with supply and demand analysis, liquidity sweeps, order block strategies, or simply classic support/resistance techniques.
Scalping and Intraday Trading:
On lower timeframes (1m–15m), the daily levels help identify intraday turning points.
On higher timeframes (1h–4h or daily), the weekly levels provide broader context and directional bias.
Risk Management and Planning:
Using these levels as reference points allows for more precise stop placement, target setting, and overall trade management.
Why This Indicator Helps
Markets often react strongly around previous highs and lows because these zones contain trapped liquidity, pending orders, or institutional decision points.
By having these areas automatically mapped out, traders gain a clear and objective view of where price is likely to respond — without needing to manually draw lines every day or week.
Whether you’re a beginner still learning about price structure, or an advanced trader refining entries within liquidity zones, this tool simplifies the process and keeps your charts clean, consistent, and data-driven.

Advanced Range Analyzer ProAdvanced Range Analyzer Pro – Adaptive Range Detection & Breakout Forecasting
Overview
Advanced Range Analyzer Pro is a comprehensive trading tool designed to help traders identify consolidations, evaluate their strength, and forecast potential breakout direction. By combining volatility-adjusted thresholds, volume distribution analysis, and historical breakout behavior, the indicator builds an adaptive framework for navigating sideways price action. Instead of treating ranges as noise, this system transforms them into opportunities for mean reversion or breakout trading.
How It Works
The indicator continuously scans price action to identify active range environments. Ranges are defined by volatility compression, repeated boundary interactions, and clustering of volume near equilibrium. Once detected, the indicator assigns a strength score (0–100), which quantifies how well-defined and compressed the consolidation is.
Breakout probabilities are then calculated by factoring in:
Relative time spent near the upper vs. lower range boundaries
Historical breakout tendencies for similar structures
Volume distribution inside the range
Momentum alignment using auxiliary filters (RSI/MACD)
This creates a live probability forecast that updates as price evolves. The tool also supports range memory, allowing traders to analyze the last completed range after a breakout has occurred. A dynamic strength meter is displayed directly above each consolidation range, providing real-time insight into range compression and breakout potential.
Signals and Breakouts
Advanced Range Analyzer Pro includes a structured set of visual tools to highlight actionable conditions:
Range Zones – Gradient-filled boxes highlight active consolidations.
Strength Meter – A live score displayed in the dashboard quantifies compression.
Breakout Labels – Probability percentages show bias toward bullish or bearish continuation.
Breakout Highlights – When a breakout occurs, the range is marked with directional confirmation.
Dashboard Table – Displays current status, strength, live/last range mode, and probabilities.
These elements update in real time, ensuring that traders always see the current state of consolidation and breakout risk.
Interpretation
Range Strength : High scores (70–100) indicate strong consolidations likely to resolve explosively, while low scores suggest weak or choppy ranges prone to false signals.
Breakout Probability : Directional bias greater than 60% suggests meaningful breakout pressure. Equal probabilities indicate balanced compression, favoring mean-reversion strategies.
Market Context : Ranges aligned with higher timeframe trends often resolve in the dominant direction, while counter-trend ranges may lead to reversals or liquidity sweeps.
Volatility Insight : Tight ranges with low ATR imply imminent expansion; wide ranges signal extended consolidation or distribution phases.
Strategy Integration
Advanced Range Analyzer Pro can be applied across multiple trading styles:
Breakout Trading : Enter on probability shifts above 60% with confirmation of volume or momentum.
Mean Reversion : Trade inside ranges with high strength scores by fading boundaries and targeting equilibrium.
Trend Continuation : Focus on ranges that form mid-trend, anticipating continuation after consolidation.
Liquidity Sweeps : Use failed breakouts at boundaries to capture reversals.
Multi-Timeframe : Apply on higher timeframes to frame market context, then execute on lower timeframes.
Advanced Techniques
Combine with volume profiles to identify areas of institutional positioning within ranges.
Track sequences of strong consolidations for trend development or exhaustion signals.
Use breakout probability shifts in conjunction with order flow or momentum indicators to refine entries.
Monitor expanding/contracting range widths to anticipate volatility cycles.
Custom parameters allow fine-tuning sensitivity for different assets (crypto, forex, equities) and trading styles (scalping, intraday, swing).
Inputs and Customization
Range Detection Sensitivity : Controls how strictly ranges are defined.
Strength Score Settings : Adjust weighting of compression, volume, and breakout memory.
Probability Forecasting : Enable/disable directional bias and thresholds.
Gradient & Fill Options : Customize range visualization colors and opacity.
Dashboard Display : Toggle live vs last range, info table size, and position.
Breakout Highlighting : Choose border/zone emphasis on breakout events.
Why Use Advanced Range Analyzer Pro
This indicator provides a data-driven approach to trading consolidation phases, one of the most common yet underutilized market states. By quantifying range strength, mapping probability forecasts, and visually presenting risk zones, it transforms uncertainty into clarity.
Whether you’re trading breakouts, fading ranges, or mapping higher timeframe context, Advanced Range Analyzer Pro delivers a structured, adaptive framework that integrates seamlessly into multiple strategies.

UNITY[ALGO] PO3 V3Of course. Here is a complete and professional description in English for the indicator we have built, detailing all of its features and functionalities.
Indicator: UNITY PO3 V7.2
Overview
The UNITY PO3 is an advanced, multi-faceted technical analysis tool designed to identify high-probability reversal setups based on the Swing Failure Pattern (SFP). It combines real-time SFP detection on the current timeframe with a sophisticated analysis of key institutional liquidity zones from the H4 timeframe, presenting all information in a clear, dynamic, and interactive visual interface.
This indicator is built for traders who use liquidity concepts, providing a complete dashboard of entries, targets, and invalidation levels directly on the chart.
Core Features & Functionality
1. Swing Failure Pattern (SFP) Detection (Current Timeframe)
The indicator's primary engine identifies SFPs on the chart's active timeframe with two layers of logic:
Standard SFP: Detects a classic liquidity sweep where the current candle's wick takes out the high or low of the previous candle and the body closes back within the previous candle's range.
Outside Bar SFP Logic: Intelligently analyzes engulfing candles that sweep both the high and low of the previous candle. A valid signal is only generated if the candle has a clear directional close:
Bullish Signal: If the outside bar closes higher than its open.
Bearish Signal: If the outside bar closes lower than its open.
Neutral (doji-like) outside bars are ignored to filter for indecision.
2. Comprehensive On-Chart SFP Markings
When a valid SFP is detected, a full suite of dynamic drawings appears on the chart:
Failure Line: A dashed line (red for bearish, green for bullish) marking the precise price level of the liquidity sweep.
PREMIUM ZONE (SFP Candle Wick): A transparent, colored rectangle highlighting the rejection wick of the signal candle (the upper wick for bearish SFPs, the lower wick for bullish SFPs). This zone automatically extends to the right, following the current price, until the DOL is hit.
CRT BOX (Reference Candle): A transparent box with a colored border drawn around the entire range of the candle that was swept (Candle 1). This highlights the full liquidity zone and also extends dynamically until the DOL is hit.
Dynamic Target Line: A blue dashed line marking the primary objective (the low of the signal candle for shorts, the high for longs).
The line begins with a "⏳ Target" label and extends with the current price.
Upon being touched by price, the line freezes, and its label permanently changes to "✅ Target".
Dynamic DOL (Draw on Liquidity) Line: An orange dashed line marking the invalidation level, defined as the opposite extremity of the swept candle (Candle 1).
It begins with a "⏳ dol" label and extends with the price.
Upon being touched, it freezes, and its label changes to "✅ dol".
3. Multi-Session Killzone Liquidity Levels (H4 Analysis)
The indicator automatically analyzes the H4 timeframe in the background to identify and plot key liquidity levels from three major trading sessions, based on their UTC opening times.
1am Killzone (London Lunch): Tracks the high/low of the 05:00 UTC H4 candle.
5am Killzone (London Open): Tracks the high/low of the 09:00 UTC H4 candle.
9am Killzone (NY Open): Tracks the high/low of the 13:00 UTC H4 candle.
For each of these Killzones, the indicator provides two types of analysis:
Last KZ Lines: Plots the high and low of the most recent qualifying Killzone candle. These lines are dynamic, extending with price and showing a ⏳/✅ status when touched.
Fresh Zones: A powerful feature that scans the entire available history of Killzones to find and display the closest untouched high (above the current price) and the closest untouched low (below the current price). These "Fresh" lines are also fully dynamic and provide a real-time view of the most relevant nearby liquidity targets.
4. Advanced User Settings & Chart Management
The indicator is designed for a clean and user-centric experience with powerful customization:
Show Only Last SFP: Keeps the chart clean by automatically deleting the previous SFP setup when a new one appears.
Hide SFP on DOL Reset: When checked, automatically removes all drawings related to an SFP setup the moment its invalidation level (DOL line) is touched. This leaves only active, valid setups on the chart.
Hide Consumed KZ: When checked, automatically removes any Killzone or Fresh Zone line from the chart as soon as it is touched by the price.
Independent Toggles: Every visual element—SFP signals, each of the three Killzones, and their respective "Fresh" zone counterparts—can be turned on or off independently from the settings menu for complete control over the visual display.
Z-Order Priority: All indicator drawings are rendered in front of the chart candles, ensuring they are always clearly visible and never hidden from view.
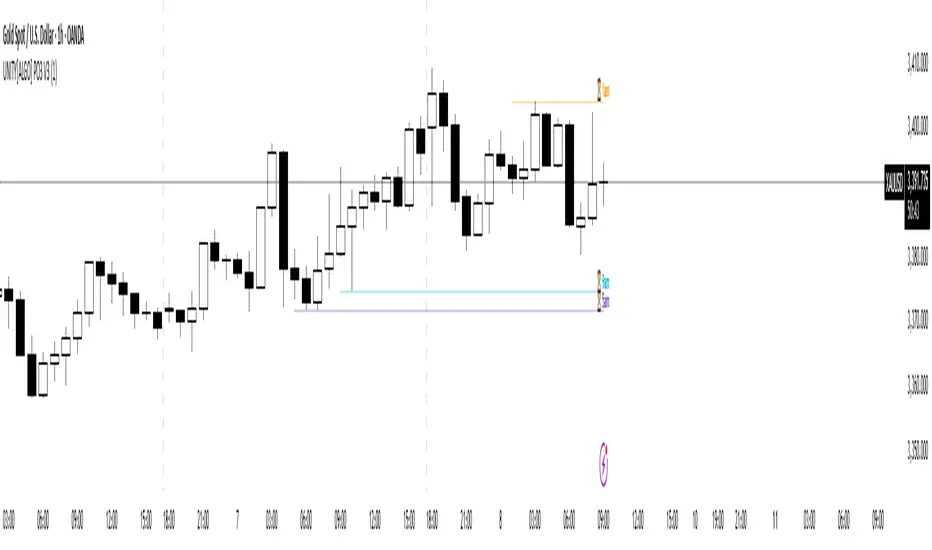
Liqudation HeatMap [BigBeluga]🔵 OVERVIEW
An advanced liquidity visualization tool that plots horizontal heat zones to highlight where potential liquidations and volume clusters are most likely hiding beneath price action.
Liqudation HeatMap scans historical price movements for local highs and lows with elevated volume or candle range. It then draws dynamic heatmap boxes—shaded from lime (low interest) to yellow (high interest)—revealing potential zones of trapped positions or stop clusters. A vertical scale on the right shows you the relative strength of volume behind each level, from 0 to the highest detected.
🔵 CONCEPTS
Maps areas of potential liquidity using volume or candle range (if volume is unavailable).
Identifies swing highs/lows (pivots) and extends heatmap boxes outward from these levels. Colors each zone based on the relative strength of volume concentration.
Fades or removes zones once price crosses their midpoints, simulating the idea of liquidity being “consumed.”
Displays a live vertical scale that shows the volume range for quick reference.
🔵 FEATURES
Dynamic Heatmap Zones:
Draws few boxes above and after pivot highs and below pivot lows, each shaded based on volume concentration.
Smart Coloring System:
Uses a gradient from lime (low) to yellow (high) to visually distinguish between weak and strong liquidity zones.
Adaptive ATR Widths:
Automatically adjusts zone thickness based on volatility (ATR), scaling intelligently across timeframes.
Liquidity Consumption Logic:
Zones are stope extending once price interacts with them—mimicking the behavior of real liquidation sweeps.
Volume Scale Legend:
A real-time scale is plotted on the right side, showing the min-max range of volume used for heat calculations.
🔵 HOW TO USE
Look for thick yellow zones to identify areas of concentrated stop losses or liquidation triggers.
Use these levels to anticipate mean reversion points or high-volatility zones.
Combine with your trend or structure tools to trade into or fade these liquidity pools.
On lower timeframes, use this tool to confirm entries around sweeps or deviations.
Use the right-side scale to compare relative zone strength instantly.
🔵 CONCLUSION
Liqudation HeatMap is a powerful visualization tool that uncovers where liquidity likely resides on the chart. By highlighting hidden traps and reactive levels in real-time, it gives traders a significant edge when it comes to spotting stop hunts, mean reversions, and areas of institutional interest. Whether you’re scalping or swing trading, this heatmap provides unmatched context on the market’s hidden intent.
