cd_SMT_Sweep_CISD_CxGeneral
This indicator is designed to show trading opportunities after sweeps of higher timeframe (HTF) highs/lows and, if available, Smart Money Technique (SMT) divergence with a correlated asset, followed by confirmation from a lower timeframe change in state delivery (CISD).
Users can track SMT, Sweep, and CISD levels across nine different timeframes.
________________________________________
Usage and Details
Commonly correlated timeframes are available in the menu by default. Users can also enter other compatible timeframes manually if necessary.
The indicator output is presented as:
• A summary table
• Display on HTF candles
• CISD levels shown as lines
Users can disable any of these from the menu.
Presentations of selected timeframes are displayed only if they are greater than or equal to the active chart timeframe.
From the Show/Hide section, you can control the display of:
• SMT table
• Sweep table
• HTF candles
• CISD levels
• HTF boxes aligned with the active timeframe
________________________________________
SMT Analysis
To receive analysis, users must enter correlated assets in the menu (or adjust them as needed).
If asset X is paired with correlated asset Y, then a separate entry for Y correlated with X is not required.
Four correlation pairs are included by default. Users should check them according to their broker/exchange or define new ones.
Checkboxes at the beginning of each row allow activation/deactivation of pairs.
SMT analysis is performed on the last three candles of each selected HTF.
If one asset makes a new high while the correlated one does not (or one makes a new low while the other does not), this is considered SMT and will be displayed both in the table and on the chart.
Charts without defined correlated assets will not display an SMT table.
________________________________________
Sweep Analysis
For the selected timeframes, the current candle is compared with the previous one.
If price violates the previous level and then pulls back behind it, this is considered a sweep. It is displayed in both the table and on the chart.
Within correlated pairs, the analysis is done separately and shown only in the table.
Example with correlated and non-correlated pairs:
• In the table, X = false, ✓ = true.
• The Sweep Table has two columns for Bullish and Bearish results.
• For correlated pairs, both values appear side by side.
• For undefined pairs, only the active asset is shown.
Example 1: EURUSD and GBPUSD pair
• If both sweep → ✓ ✓
• If one sweeps, the other does not → ✓ X
• If neither sweeps → X X
Example 2: AUDUSD with no correlated pair defined
• If sweep → ✓
• If no sweep → X
________________________________________
HTF Candles
For every HTF enabled by the user, the last three candles (including the current one) are shown on the chart.
SMT and sweep signals are marked where applicable.
________________________________________
CISD Levels
For the selected timeframes, bullish and bearish CISD levels are plotted on the chart.
________________________________________
HTF Boxes
HTF boxes aligned with the active timeframe are displayed on the chart.
Box border colors change according to whether the active HTF candle is bullish or bearish.
________________________________________
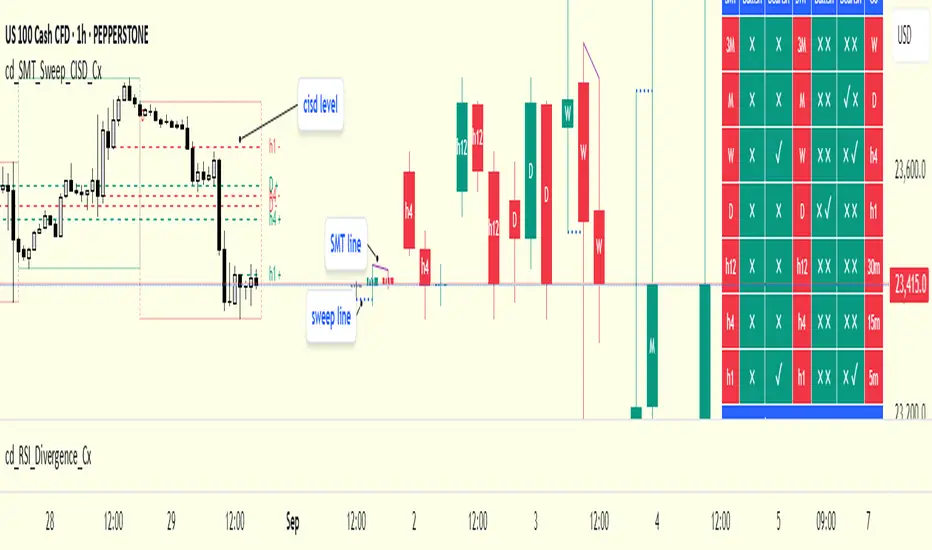
How to Read the Chart?
Let’s break down the example below:
• Active asset: Nasdaq
• Correlated asset: US500 (defined in the menu, confirmed in the table bottom row)
• Active timeframe: H1 → therefore, the HTF box is shown for Daily
• Since a correlated pair is defined, the indicator runs both SMT and Sweep analysis for the selected timeframes. Without correlation, only Sweep analysis would be shown.
Table is prepared for H1 and higher timeframes (as per user selection and active TF).
Observations:
• SMT side → H1 timeframe shows a bearish warning
• Sweep side → Bearish column shows X and ✓
o X → no sweep on Nasdaq
o ✓ → sweep on US500
Meaning: US500 made a new high (+ sweep) while Nasdaq did not → SMT formed.
The last column of the table shows the compatible LTF for confirmation.
For H1, it suggests checking the 5m timeframe.
On the chart:
• CISD levels for selected timeframes are drawn
• SMT line is marked on H1 candles
• Next step: move to 5m chart for CISD confirmation before trading (with other confluences).
Similarly, the Daily row in the table shows a Bullish Sweep on US500.
________________________________________
Alerts
Two alert options are available:
1. Activate Alert (SMT + Sweep):
Triggers if both SMT and Sweep occur in the selected timeframes. (Classic option)
2. Activate Alert (Sweep + Sweep):
Triggers if sweeps occur in both assets of a correlated pair at the same timeframe.
Interpretation:
If SMT + Sweep are already present on higher timeframes, and simultaneous sweeps appear on lower timeframes, this may indicate a strong directional move.
Of course, this must be validated with CISD and other confluences.
________________________________________
HTF CISD Levels
Although CISD levels act as confirmation levels in their own timeframe, observing how price reacts to HTF CISD levels can provide valuable insights for intraday analysis.
POIs overlapping with these levels may be higher priority.
________________________________________
What’s Next in Future Versions?
• Completed CISD confirmations
• Additional alert options
• Plus your feedback and suggestions
________________________________________
Final Note
I’ll be happy to hear your opinions and feedback.
Happy trading!
在脚本中搜索"sweep"
Clean Pivot Lines with AlertsTechnical Overview
This Script is designed for detecting untouched pivot highs and lows. It draws horizontal levels only when those pivots remain unviolated within a configurable lookback window and removes them automatically upon price breaches or sweeps.
Key components include:
Pivot detection logic : Utilizes ta.pivothigh()/ta.pivotlow() (or equivalent via request.security for HTF) with parameterized pivotLength to ensure flexibility and adaptability to different timeframes.
Cleanliness filtering : Checks lookbackBars prior to line creation to skip levels already violated, ensuring only uncontaminated pivots are used.
Dynamic level tracking : Stores active levels in arrays (highLines, lowLines) for continuous real-time monitoring.
Violation logic : Detects both close-based breaks (breakAbove/breakBelow) and wick-based sweeps (sweepAbove/sweepBelow), triggering alerts and automatic teardown.
Periodic housekeeping : Every N (10) confirmed bars, re-verifies “clean” status and removes silently invalidated levels—maintaining chart hygiene and avoiding stale overlays.
Customization options : Supports pivot timeframe override, colors, line width/style, lookback length, and alert toggling.
Utility
This overlay script provides a disciplined workflow for drawing meaningful support/resistance levels, filtering out contaminated pivot points, and signaling validations (breaks/sweeps) with alerts. Its modular design and HTF support facilitate integration into systematic workflows, offering far more utility than mere static pivot plots.
Usage Instructions
1. Adjust `pivot_timeframe`, `pivot_length`, and `lookback_bars` to suit your strategy timeframe and volatility structure.
2. Customize visual parameters as required.
3. Enable alerts to receive in-platform messages upon pivot violations.
4. Use HTF override only if analyzing multi-timeframe pivot behavior; otherwise, leave empty to default to chart timeframe.
Performance & Limitations
- Pivot lines confirmation lags by `pivot_length` bars; real-time signals may be delayed.
- Excessive active lines may impact performance on low-TF charts.
- The “clean” logic is contingent on the `lookback_bars` parameter; choose sufficiently high values to avoid false cleanliness.
- Alerts distinguish between closes beyond and wick-only breaches to aid strategic nuance.

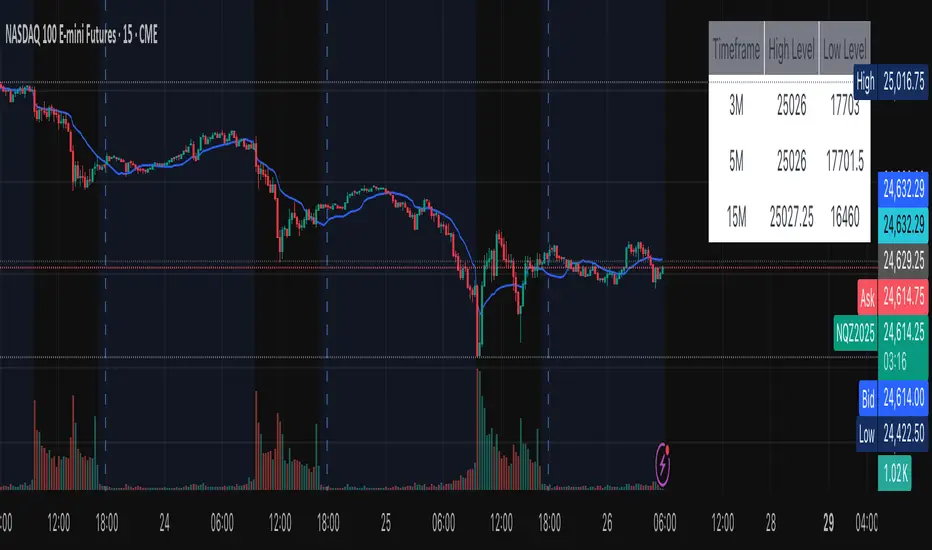
15M Swing Sweep Lines + SMT (ES vs NQ)15M Swing Sweep Lines (NY Killzones)Visualize liquidity sweeps of 15-minute swing highs/lows exclusively during high-impact London & New York killzones.This ICT-inspired indicator detects when price sweeps (wicks beyond) the most recent confirmed 15-minute swing high or low — classic signs of liquidity raids or stop hunts — but only if the sweep happens during key "killzone" sessions where institutional activity is typically highest.Key Features15M Swing Detection: Uses confirmed pivot highs/lows (length 2) on the 15-minute timeframe for reliable structure points.
Killzone Filters (New York time):London Killzone: 3:00 AM – 4:59 AM
New York Killzone: 9:30 AM – 10:59 AM (captures the high-volatility NY open overlap)
Sweep Visualization:Bearish Sweep (high > last 15M swing high): Thick red horizontal line from the swing point to the sweep bar.
Bullish Sweep (low < last 15M swing low): Thick green horizontal line from the swing point to the sweep bar.
Lines use xloc.bar_time for precise placement and extend only to the bar where the sweep occurs.
No duplicates: Prevents multiple lines for the same swing sweep.
Non-repainting logic with lookahead_off for clean, trustworthy signals.
Why Killzones MatterMany ICT/SMC traders focus on these windows because they often feature aggressive manipulation, equal highs/lows sweeps, and the setup for strong directional moves. This tool helps you instantly spot when buy-side or sell-side liquidity has been raided on the 15M structure during these prime times.Ideal ForConfirming potential reversals or inducements after liquidity grabs.
Adding confluence to entries during London or NY sessions.
Futures traders (ES, NQ, etc.) looking for clean visual cues of smart money engineering.
Lightweight, overlay-friendly, and focused — add it to your chart for clearer insight into 15M liquidity sweeps when it matters most. Perfect companion for killzone-based strategies!

PDH/PDL Sweep & Rejection - sudoPDH/PDL Sweep + Rejection
This indicator identifies classic liquidity sweeps of the previous day's high or low, then confirms whether price rejected that level with force. It is built to highlight moments when the market takes liquidity and immediately snaps back in the opposite direction, a behavior often linked to failed breakouts, engineered stops, or clean reversals. The tool marks these events directly on the chart so you can see them without manually watching the daily levels.
What it detects
The indicator focuses on two events:
PDH sweep and rejection
Price breaks above the previous day's high, overshoots the level by a meaningful amount, and then closes back below the high.
PDL sweep and rejection
Price breaks below the previous day's low, overshoots, and then closes back above the low.
These are structural liquidity events, not random wicks. The script checks for enough overshoot and strong bar range to confirm it was a genuine stop grab rather than noise.
How it works
The indicator evaluates each bar using the following logic:
1. Previous day levels
It pulls yesterday's high and low directly from the daily timeframe. These act as the PDH and PDL reference points for intraday trading.
2. Overshoot measurement
After breaking the level, price must push far enough beyond it to qualify as a sweep. Instead of using arbitrary pips, the required overshoot is scaled relative to ATR. This keeps the logic stable across different assets and volatility conditions.
3. Range confirmation
The bar must be larger than normal compared to ATR. This ensures the sweep happened with momentum and not because of small, choppy price movement.
4. Rejection close
A valid signal only prints if price closes back inside the previous day's range.
For a PDH sweep, the bar must close below PDH.
For a PDL sweep, the bar must close above PDL.
This confirms a failed breakout and a rejection.
What gets placed on the chart
Red downward triangle above the bar: Previous Day High sweep and rejection
Lime upward triangle below the bar: Previous Day Low sweep and rejection
The markers appear exactly on the bar where the sweep and rejection occurred.
How traders can use this
Identify potential reversals
Sweeps often occur when algorithms target liquidity pools. When followed by a strong rejection, the market may be preparing for a reversal or rotation.
Avoid chasing breakouts
A clear sweep warns that a breakout attempt failed. This can prevent traders from entering at the worst possible location.
Time entries at extremes
The markers help you see where the market grabbed stops and immediately turned. These areas can become high quality entry zones in both trend continuation and countertrend setups.
Support liquidity based models
The indicator aligns naturally with trading frameworks that consider liquidity, displacement, failed breaks, and microstructure shifts.
Add confidence to confluence-based setups
Combine sweeps with displacement, FVGs, or higher timeframe levels to refine entry timing.
Why this indicator is helpful
It automates a pattern that traders often identify manually. Sweeps are easy to miss in fast markets, and this tool eliminates the need to constantly monitor daily levels. By marking only the events that show overshoot plus rejection plus significant range, it filters out the weak or false signals and leaves only meaningful liquidity events.

Williams %R Liquidity Sweeps [UAlgo]🔶Description:
The "Williams %R Liquidity Sweeps " designed to identify potential liquidity sweeps based on the Williams %R oscillator. The indicator helps traders spot areas where liquidity may be accumulating or dispersing rapidly, which can signal potential buying or selling opportunities or confluence/confirmation your decisions.
🔶Key Features:
Williams %R Oscillator: The indicator utilizes the Williams %R oscillator, a momentum indicator that measures overbought and oversold levels.
Liquidity Sweep Detection: It identifies liquidity sweeps by detecting pivot highs and lows within the Williams %R oscillator ( Sweeps only occur in Overbought/Oversold zones ).
Customizable Parameters: Traders can adjust various parameters such as oscillator length, overbought/oversold levels, pivot length, and maximum lines to suit their trading preferences.
Visual Representation: Liquidity sweeps are visually represented on the chart with labels and points that waiting for sweep (green and red lines default) are can be used as support and resistance zones. The indicator dynamically manages the display of support and resistance lines. Removing outdated lines to maintain relevance.
Example for Oscillator Liquidity Sweep:
Disclaimer:
This indicator is provided for informational and educational purposes only and should not be considered financial advice. Trading involves risks, and past performance is not indicative of future results. Users are encouraged to conduct their own research and consult with a qualified financial advisor before making any investment decisions based on this indicator.
The effectiveness of the indicator may vary depending on market conditions, trading strategies, and other factors. Traders should exercise caution and practice proper risk management techniques when using this or any other trading tool.

H1 Liquidity Sweep Tracker🇬🇧 English: H1 Liquidity Sweep Tracker
Overview
The H1 Liquidity Sweep Tracker is a technical analysis tool designed for TradingView (Pine Script v5). It identifies "Liquidity Sweeps"—market movements where the price briefly breaches a significant level to trigger stop-loss orders before reversing.
Core Functions
H1 Level Detection: Regardless of your current timeframe (e.g., 1m, 5m, or 15m), the script automatically fetches the High and Low of the previous 1-hour candle.
Real-Time Monitoring: It tracks price action relative to these levels to identify failed breakouts.
Visual Indicators:
Horizontal Lines: Displays the H1 High (Red) and H1 Low (Green) from the previous hour.
Sweep Shapes: A triangle appears above/below the candle when a sweep is detected.
How it Works (The Logic)
A "Sweep" is triggered when the current price moves beyond the H1 boundary but fails to maintain that position:
Bullish Sweep: The price drops below the previous H1 Low (collecting sell-side liquidity) but closes back above it. This suggests a potential upward reversal.
Bearish Sweep: The price rises above the previous H1 High (collecting buy-side liquidity) but closes back below it. This suggests a potential downward reversal.

MTF Fractals [RunRox]🔽 MTF Fractals is a powerful indicator designed to visualize fractals from multiple timeframes directly on your chart, highlight liquidity sweeps at these fractal levels, and provide several additional features we’ll cover in detail below.
We created this indicator because we couldn’t find a suitable tool that met our specific needs on TradingView. Therefore, we decided to develop a valuable indicator for the entire TradingView community, combining simplicity and versatility.
⁉️ WHAT IS A FRACTALS?
In trading, a fractal is a technical analysis pattern composed of five consecutive candles, typically highlighting local market turning points. Specifically, a fractal high is formed when a candle’s high is higher than the highs of the two candles on either side, whereas a fractal low occurs when a candle’s low is lower than the lows of the two adjacent candles on both sides.
Traders use fractals as reference points for identifying significant support and resistance levels, potential reversal areas, and liquidity zones within price action analysis. Below is a screenshot illustrating clearly formed fractals on the chart.
📙 FRACTAL FORMATION
Here’s how fractals form depending on your chosen setting (3, 5, 7, or 9):
▶️ 3-bar fractal – forms when the central candle is higher (for highs) or lower (for lows) than one candle on each side.
▶️ 5-bar fractal – forms when the central candle is higher or lower than two candles on both sides.
▶️ 7-bar fractal – forms when the central candle is higher or lower compared to the three candles on each side.
▶️ 9-bar fractal – forms similarly but requires four candles on each side, making the fractal significantly more reliable and robust.
A higher number of bars ensures stronger fractal levels, highlighting more significant potential reversal points on the chart.
Now that we’ve covered the theory behind fractal formation, let’s explore the indicator’s functionality in more detail.
Below, I’ll explain each feature clearly and illustrate how you can effectively utilize this indicator in your trading.
🕐 MULTI-TIMEFRAME FRACTALS
We realized that displaying fractals only from the current timeframe isn’t always convenient, so we’ve introduced Multi-Timeframe Fractals into this indicator.
Now you can easily display fractals from higher timeframes directly on your current chart, providing you with broader market context and clearer trading signals.
Fractals from Current Timeframe – Fractals identified directly on the chart’s current timeframe.
Fractals from Higher Timeframes – Fractals sourced from higher timeframes and displayed clearly on your current chart for enhanced market perspective.
📈 FRACTAL LINES
Since fractals represent areas of high liquidity, we’ve added an option to extend fractal levels horizontally as Fractal Lines across your chart.
This feature allows you to clearly visualize critical liquidity areas from higher timeframes, directly on your current timeframe chart, as demonstrated in the screenshot below.
With this approach, you can clearly visualize significant fractal levels from higher timeframes directly on your current chart - for example, projecting fractals from the 1-hour (1H) timeframe onto a 3-minute (3m) chart. ✅ This helps you easily identify critical liquidity areas and potential reversal zones without the need to switch between multiple timeframes.
💰 LIQUDITY SWEEP (LIQUDITY GRAB)
To enhance your trading experience, we’ve introduced a feature that clearly identifies liquidity sweeps of fractal levels.
A Liquidity Sweep occurs when a candle closes beyond a fractal line, leaving a wick that pierces through it, signaling that liquidity has been collected at this level.
Below, you’ll find two examples illustrating this functionality:
▶️ Fractal lines from the current timeframe
▶️ Fractal lines projected from higher timeframes
The first example illustrates liquidity being swept from fractals on the current timeframe .
Here, the candle clearly closes beyond the fractal line, leaving a wick through it. This indicates a liquidity sweep at the fractal level, visually highlighting a potential reversal or continuation opportunity directly on your chart.
In the second example, fractals from the higher timeframe are projected onto your current chart.
When a candle on your current timeframe closes beyond an HTF fractal line - leaving a wick through this level - the indicator highlights it clearly. This signals to traders a potential reversal zone, indicating that liquidity has been swept, and price may reverse or significantly react from this area.
You can also enable the display of additional labels on the chart. These labels clearly mark liquidity sweeps at fractal levels, making it easier to visually identify potential reversal points directly on your chart.
⚙️ SETTINGS
Below are the indicator settings with detailed explanations for each parameter.
🔷 Bars in Fractal – Number of candles to the right and left required to form a fractal.
🔷 Fractal Timeframe – Select the timeframe from which you want to display fractals on the current chart.
🔷 Max Age, bars – Number of bars during which the fractal will remain active.
🔷 Show Fractal Line – Display or hide fractal lines.
🔷 Line Style – Choose the style of the line displayed on the chart.
🔷 Line Width – Thickness of the fractal line.
🔷 High Fractal – Style and color of bearish fractals.
🔷 Low Fractal – Style and color of bullish fractals.
🔷 Fractal Label Size – Select the size of fractal labels.
🔷 Show Sweep Labels – Option to display labels when a liquidity sweep occurs.
🔷 Label Color – Color and transparency of the area marked on the chart during a sweep.
🔷 Shade Sweep Area – Show or hide the sweep area shading.
🔷 Area Color – Color and transparency settings for the sweep area.
🔶 We’d love to hear your feedback and any suggestions for additional features you’d like to see in this indicator. We’ll be happy to consider your ideas and continue improving the indicator!

Liquidity Sweep & Reversal — Body Anchored + Risk (v6)Overview
The Liquidity Sweep & Reversal — Locked to Price (v6) indicator identifies liquidity sweeps around major swing highs and lows, confirming reversals when price closes back inside the swept level.
All signals are locked to price (bottom of green candle for BUY, top of red candle for SELL), so they remain perfectly aligned when zooming or scaling.
This indicator is ideal for swing traders and scalpers who trade reversals, liquidity events, and reclaim structures.
How It Works
Detects confirmed swing highs and lows using a pivot-based structure.
Waits for a liquidity sweep — when price wicks beyond a recent swing.
Confirms a reclaim when price closes back inside the previous swing level.
Triggers a BUY or SELL signal anchored to the candle body.
Automatically calculates stop loss and risk using ATR and your inputs.
Input Settings
Swing Detection
Swing Detection Strength: How many bars confirm a swing pivot. Higher = stronger swings.
Bars to Confirm Reclaim: Number of bars after a sweep for price to close back within the swing zone.
Swing Proximity %: How close price must come to a swing to count as a liquidity sweep.
Trend Filter (optional)
Use EMA Trend Filter: When enabled, only BUY in uptrend and SELL in downtrend.
Fast EMA Length / Slow EMA Length: Define EMAs used to detect trend direction.
Risk & Stop Management
ATR Length: Period for ATR calculation (volatility measurement).
Base ATR Stop Buffer (x ATR): Distance of stop loss from entry based on ATR multiplier.
Position Size (quote units): Your total position size in quote currency (e.g., USDT).
Risk % of (Position / 20): Defines how much of your position to risk per trade.
Example: (Position / 20) × Risk % = per-trade risk.
Chart Elements
BUY Arrow (green): Appears after a liquidity sweep and reclaim near a swing low.
SELL Arrow (red): Appears after a sweep and reclaim near a swing high.
Labels: Display entry price, stop loss (SL), and calculated risk dollar value.
EMAs: Optional fast/slow moving averages for directional bias.
Dynamic Stops: Adjust automatically using ATR × risk settings.
Trading Tips
Use BUY signals near liquidity sweeps under swing lows.
Use SELL signals near liquidity sweeps above swing highs.
Adjust swing length for different timeframes:
Lower values for scalping (3–5)
Higher values for swing trading (7–10)
Respect stop loss levels and use risk control settings for consistent sizing.
Combine with volume, OBV, or structure for confirmation.
Alerts
BUY — Locked to Price: "BUY: swing low reclaimed with dynamic stop."
SELL — Locked to Price: "SELL: swing high reclaimed with dynamic stop."
Best Use Cases
Liquidity-based reversals
Swing entry confirmation
Stop hunt reclaims
Structure-based entries
Author
Created by @roccodallas
For traders who value clean structure, risk control, and chart precision.

Swing High/Low with Liquidity Sweeps🧠 Overview
This indicator identifies swing highs and swing lows based on user-defined candle lengths and checks for liquidity sweeps—situations where the price breaks a previous swing level but then closes back inside, indicating a potential false breakout or stop hunt. It also supports visual labeling and alerts for these events.
⚙️ Inputs
Swing Length (must be odd number ≥ 3):
Determines how many candles are used to identify swing highs/lows. The central candle must be higher or lower than all neighbors within the range.
Example: If swingLength = 5, the central candle must be higher/lower than the 2 candles on both sides.
Sweep Lookback (bars):
Defines how many bars to look back for possible liquidity sweeps.
Show Swing Labels (checkbox):
Optionally display labels on the chart when a swing high or low is detected.
Show Sweep Labels (checkbox):
Optionally display labels on the chart when a liquidity sweep occurs.
🕯️ Swing Detection Logic
A Swing High is detected when the high of the central candle is greater than the highs of all candles around it (as per the defined length).
A Swing Low is detected when the low of the central candle is lower than the lows of surrounding candles.
Swing labels are placed slightly above (for highs) or below (for lows) the candle.
💧 Liquidity Sweep Logic
A Sweep High is triggered if:
The current high breaks above a previously detected swing high,
And then the candle closes below that swing high,
Within the configured lookback window.
A Sweep Low is triggered if:
The current low breaks below a previous swing low,
And then closes above it,
Within the lookback window.
These are often seen as stop hunts or fake breakouts.
🔔 Alerts
Sweep High Alert: Triggered when a sweep above a swing high occurs.
Sweep Low Alert: Triggered when a sweep below a swing low occurs.
You can use these to set up TradingView alerts to notify you of potential liquidity grabs.
📊 Use Cases
Identifying market structure shifts.
Spotting fake breakouts and potential reversals.
Assisting in smart money concepts and liquidity-based trading.
Supporting entry timing in trend continuation or reversal strategies.

Change in State of Delivery (CISD) [LuxAlgo]The Change In State Of Delivery (CISD) indicator detects and displays Change in State Of Delivery, a concept related to market structures.
Users can choose between two different CISD detection methods. Various filtering options are also included to filter out less significant CISDs.
🔶 USAGE
A Change in State of Delivery (CISD) is a concept closely related to market structures, where price breaks a level of interest, confirming trends and their continuations from the resulting breakouts.
Unlike more traditional market structures which rely on swing points, CISDs rely on a persistent sequence of candles, using the sequence extremes as breakout levels.
CISDs are detected as follows:
Bullish: The price closes above the opening price of the first candle in a sequence of bearish candles (or its own opening price if it's the only candle).
Bearish: The price closes below the opening price of the first candle in a sequence of bullish candles (or its own opening price if it's the only candle).
If a newly detected CISD aligns with the indicator's current established trend, this confirms a trend continuation (represented with a dashed line).
On the other hand, if a newly detected CISD is in the opposite direction to the detected trend it can confirm a trend reversal (represented with a solid line).
🔹 Liquidity Sweep Detection Method
Using Liquidity Sweeps to update CISD breakout levels allows us to obtain less frequent and more relevant levels that are less sensitive to noisy price variations.
Sweeps are obtained from detected Swing Points , with a higher Swing Length allowing us to obtain longer-term swing levels and potentially more detected sweeps from a specific level over time.
Note: The 'Swing Length' setting is only applicable on the Liquidity Sweep Detection Method and will only change the Liquidity levels.
A Liquidity Sweep is valid when the price reaches an important liquidity level , after which the price closes below/above this level.
Bullish scenario: The price goes below a previous unbroken Swing Low but closes above.
Bearish scenario: The price goes above a previous unbroken Swing High but closes below.
After a Liquidity Sweep has been detected, the last level of importance acts as support/resistance . Breaking this level in the other direction changes the state of delivery .
Users must keep observing the price and significant levels, as highlighted by the white rectangle in the above example.
🔹 CISD Filtering
Users can adjust the following two settings:
Minimum CISD Duration: The minimum length of the 'CISD' line
Maximum Swing Validity: The maximum length of the 'CISD' line; potential CISD lines that aren't broken are deleted when exceeding the limit.
The chart can get cluttered when the Minimum CISD Duration is low. Users could focus on a switch in trend (first solid line CISD ), where the following dashed CISD lines can be seen as extra opportunities/confirmations.
🔶 DETAIL
🔹 Using Different Timeframes
When an important liquidity level (Previous Swing high/low, FVG, etc.) is reached on the higher timeframe, the user can move to a lower timeframe to check whether there is a CISD .
Above example:
The high of the last candle breaches a liquidity level (previous Swing High). The opening price of the last candle acts as a trigger/confirmation level.
A confirmed CISD is seen in a lower timeframe, just after this Liquidity Sweep. This could be an early opportunity.
Later, a confirmed CISD on the higher timeframe is established.
🔶 SETTINGS
Detection Method: Classic or Liquidity Sweep
Swing Length: Period used for the swing detection, with higher values returning longer-term Swing Levels.
Minimum CISD Duration: The minimum length of the CISD line
Maximum Swing Validity: The maximum length of the CISD line; potential CISD lines that aren't broken are deleted when exceeding the limit.

ICT Liquidity Sweep MAX RETRI (ALERT)Strategy Description: SMC + ICT Reversal Sniper | 5-Min | R2 TP
This strategy applies Smart Money Concepts (SMC) and ICT methodology to identify high-probability reversal trades using a clean, rule-based system designed for the 5-minute timeframe.
⸻
Core Logic:
• Liquidity Sweep: Identifies stop hunts beyond recent swing highs/lows using a configurable lookback window.
• Break of Structure (BOS): Validates a directional shift after the sweep.
• Fixed R2 Risk-Reward: Entry is followed by a 2:1 take-profit target. Stop loss is set at the sweep candle’s high/low.
• No Entry Between 8 PM–12 AM NY Time: Avoids the manipulation-prone and illiquid zone.
• Discreet SL Handling: SL hits close trades silently — no labels or visuals.
⸻
Entry Precision & Timing Notes:
• The strategy may occasionally fire before a confirmed liquidity sweep — this is expected. If a sweep occurs later, you may still re-enter toward equilibrium, with take profit also targeted at equilibrium.
• Alerts or trades that trigger near 9:30 AM NY often align with real direction, but this time can be volatile.
• For more reliable and lower-risk entries, focus on the 1:30 PM to 2:00 PM silver bullet window, which tends to produce cleaner setups with more favorable flow. 🖤

Multi-Timeframe Sweep IndicatorsLiquidity Sweeps: Identify when price sweeps stops above/below key levels
Breakout Confirmation: Confirm breakouts across multiple timeframes
Entry Timing: Use lower timeframe sweeps for precise entries
Risk Management: Higher timeframe sweeps may indicate stronger moves
The indicator works best when combined with other analysis techniques like support/resistance levels, volume analysis, and market structure.
Liquidity Swing Points [BackQuant]Liquidity Swing Points
This tool marks recent swing highs and swing lows and turns them into persistent horizontal “liquidity” levels. These are places where resting orders often accumulate, such as stop losses above prior highs and below prior lows. The script detects confirmed pivots, records their prices, draws lines and labels, and manages their lifecycle on the chart so you can monitor potential sweep or breakout zones without manual redrawing.
What it plots
LQ-H at confirmed swing highs
LQ-L at confirmed swing lows
Horizontal levels that can optionally extend into the future
Timed removal of old levels to keep the chart clean
Each level stores its price, the bar where it was created, its type (high or low), plus a label and a line reference for efficient updates.
How it works
Pivot detection
A swing high is confirmed when the highest high has swing_length bars on both sides that are lower.
A swing low is confirmed when the lowest low has swing_length bars on both sides that are higher.
Pivots are only marked after they are confirmed, so they do not repaint.
Level creation
When a pivot confirms, the script records the price and the creation bar (offset by the right lookback).
A new line is plotted at that price, labeled LQ-H or LQ-L.
Rendering and extension
Levels can be drawn to the most recent bar only or extended to the right for forward reference.
Label size and line color/transparency are configurable.
Lifecycle management
On each confirmed bar, the script checks level age.
Levels older than a chosen bar count are removed automatically to reduce clutter.
How it can be used
Liquidity sweeps: Watch for price to probe beyond a level then close back inside. That behavior often signals a potential fade back into the prior range.
Breakout validation: If price pushes through a level and holds on closes, traders may treat that as continuation. Retests of the level from the other side can serve as structure checks.
Context for entries and exits: Use nearby LQ-H or LQ-L as reference for stop placement or partial-take zones, especially when other tools agree.
Multi-timeframe mapping: Plot swing points on higher timeframes, then drill down to time entries on lower timeframes as price interacts with those levels.
Why liquidity levels matter
Prior swing points are focal areas where many strategies set stops or pending orders. Price often revisits these zones, either to “sweep” resting liquidity before reversing, or to absorb it and trend. Marking these areas objectively helps frame scenarios like failed breaks, successful breakouts, and retests, and it reduces the subjectivity of eyeballing structure.
Settings to know
Swing Detection Length (swing_length), Controls sensitivity. Lower values find more local swings. Higher values find more significant ones.
Bars until removal (removeafter), Deletes levels after a fixed number of bars to prevent buildup.
Extend Levels Right (extend_levels), Keeps levels projected into the future for easier planning.
Label Size (label_size), Choose tiny to large for chart readability.
One color input controls both high and low levels with transparency for context.
Strengths
Objective marking of recent structure without hand drawing
No repaint after confirmation since pivots are locked once the right lookback completes
Lightweight and fast with simple lifecycle management
Clear visuals that integrate well with any price-action workflow
Practical tips
For scalping: use smaller swing_length to capture more granular liquidity. Keep removeafter short to avoid clutter.
For swing trading: increase swing_length so only more meaningful levels remain. Consider extending levels to the right for planning.
Combine with time-of-day filters, ATR for stop sizing, or a separate trend filter to bias trades taken at the levels.
Keep screenshots focused: one image showing a sweep and reversal, another showing a clean breakout and retest.
Limitations and notes
Levels appear after confirmation, so they are delayed by swing_length bars. This is by design to avoid repainting.
On very noisy or illiquid symbols, you may see many nearby levels. Increasing swing_length and shortening removeafter helps.
The script does not assess volume or session context. Consider pairing with volume or session tools if that is part of your process.

Liquidity Sweeps [LuxAlgo]The Liquidity Sweeps indicator detects the presence of liquidity sweeps on the user's chart, while also providing potential areas of support/resistance or entry when Liquidity levels are taken.
In the event of a Liquidity Sweep a Sweep Area is created which may provide further areas of interest.
🔶 USAGE
A Liquidity Sweep occurs when the price breaks through a liquidity level (further referred to as LqL ), after which the price returns below/above the liquidity level , forming a wick.
The script provides 2 options when this can happen:
A wick passes a LqL after which the price quickly returns.
First the closing price breaks through a LqL . After a while, the price retests the LqL and forms a wick in the opposite direction.
The examples above show a bullish and bearish scenario of "a wick passing through an LqL where the price quickly comes back". This type of Liquidity Sweep is represented by a dotted line.
The following example shows a broken LqL , where the price retests the Liquidity zone and bounces back.
Instead of a dotted line, this type of Liquidity Sweep is represented by a dashed line.
When a Liquidity Sweep takes place, this is indicated by highlighting the "wick- LqL " distance. This distance is also the basis for the Sweep Area (see next sub-section). A small 3-bar long dotted line starts from the opposite wick as an extra aid to determine potential support/resistance/entry, ...
Colors can be set in the settings (here yellow and aqua blue instead of default colors for clarity).
🔹 Sweep Areas
The distance between the LqL and the maximum limit of the wick forms a Sweep Area , which can provide a potential support/resistance or entry zone.
These examples show both types of Liquidity Sweeps , followed by a box indicating the Sweep Area .
When the Sweep Area is mitigated or a certain amount of bars has passed (Settings - 'Max bars'), the boxes will no longer be updated.
In this case, the 'Trigger' label shows the bar where the high crossed a LqL , after which a red box starts between LqL and high.
The low of the 'Trigger' bar is the starting point of a short dotted line. Next to the 'Trigger bar' the high touches the Sweep Area before returning, providing a potential short entry. One bar further, another entry opportunity presents itself when the price breaks the small dotted line.
In the following bullish example, not only do we see opportunities when the LqL has been swept, but the following Sweep Area provides some potential entries.
The small green dotted lines also act as a guide where the price breaks above, then forms a small range, after which the price continues in an upward direction.
Here, the initial trigger on the left forms a Sweep Area that is quickly broken. However, the small green line provides a potential entry area later on. The price moves in a short channel before breaking above the LqL (green dashed line), providing more potential entries. Price retests this LqL , and goes below this level. The price remained around the previously formed channel, after which the price resumed its upward trend.
🔶 SETTINGS
🔹 Liquidity Sweeps
Swings: Period used for the swing detection, with higher values returning longer term Liquidity Levels .
Options:
- Only Wicks: Only detects a Liquidity Sweep when a wick sweeps a previous wick
- Only Outbreaks & Retest: Only detects a Liquidity Sweep when the price breaks a Liquidity Level , returns & retests the Liquidity Level , and forms a wick in the opposite direction.
- Wicks + Outbreaks & Retest: Both options can be detected.
🔹 Sweep Area
Extend: Enables/Disables extension of the Sweep Area boxes.
Max Bars: Limit the extension to a certain number of bars.
Color Sweep Area box.

Liquidity Sweeps and RaidsThis basic script calculates and plots runs on liquidity levels through Raids and Sweeps. When the price violates the 3 fractal level, a raid or sweep occurs. You can use it to automate markup, understand liquidity levels, and reduce human error in your analysis. Additionally, you can set up an alarm to notify you when new sweeps or raids occur. Combine it with your current strategy or try any price action theory you prefer. Essentially, the price always seeks liquidity, so when some of it is taken, it makes sense to look for a reaction and potential reversal. Stay ahead by capitalizing on liquidity insights for potential reversals. Cheers, Cancamurria.

Liquidity Sweep Filter [AlgoAlpha]Unlock a deeper understanding of market liquidity with the Liquidity Sweep Filter by AlgoAlpha. This indicator identifies liquidity sweeps, highlighting key price levels where large liquidations have occurred. By visualizing major and minor liquidation events, traders can better anticipate potential reversals and market structure shifts, making this an essential tool for those trading in volatile conditions.
Key Features :
🔍 Liquidity Sweep Detection – Identifies and highlights areas where liquidity has been swept, distinguishing between major and minor liquidation events.
📊 Volume Profile Integration – Displays a volume profile overlay, helping traders spot high-activity price zones where the market is likely to react.
📈 Trend-Based Filtering – Utilizes an adaptive trend detection algorithm to refine liquidity sweeps based on market direction, reducing noise.
🎨 Customizable Visualization – Modify colors, thresholds, and display settings to tailor the indicator to your trading style.
🔔 Alerts for Liquidity Sweeps & Trend Changes – Stay ahead of the market by receiving alerts when significant liquidity events or trend shifts occur.
How to Use:
🛠 Add the Indicator : Add the Liquidity Sweep Filter to your chart and configure the settings based on your preferred sensitivity. Adjust the major sweep threshold to filter out smaller moves.
📊 Analyze Liquidity Zones and trend direction : Look for liquidation levels where large buy or sell stops have been triggered. Major sweeps indicate strong reactions, while minor sweeps show gradual liquidity absorption. You can also see which levels are high in liquidity by the transparency of the levels.
🔔 Set-Up Alerts : Use the in-built alerts so you don't miss a trading opportunity
How It Works :
The Liquidity Sweep Filter detects liquidity events by tracking swing highs and lows (defined as a pivot where neighboring candles are lower/higher than it) where traders are likely to have placed stop-loss orders. It evaluates volume and price action, marking areas where liquidity has been absorbed by the market. Additionally, the integrated trend filter ensures that only relevant liquidity sweeps are highlighted based on market direction, lows in an uptrend and highs in a downtrend. The trend filter works by calculating a basis, and defining trend shifts when the closing price crosses over the upper or lower bands.The included volume profile further enhances analysis by displaying key trading zones where price may react.

ICT Liquidity Sweep Asia/London 1 Trade per High & Low🧠 ICT Liquidity Sweep Asia/London — 1 Trade per High & Low
This strategy is inspired by the ICT (Inner Circle Trader) concepts of liquidity sweeps and market structure, focusing on the Asia and London sessions.
It automatically identifies liquidity grabs (sweeps) above or below key session highs/lows and enters trades with a fixed risk/reward ratio (RR).
----------------------------------------------------------------------------------
----------------------------------------------------------------------------------
⚙️ Core Logic
-Asia Session: 8:00 PM – 11:59 PM (New York time)
-London Session: 2:00 AM – 5:00 AM (New York time)
-The script marks the Asia High/Low and London High/Low ranges for each day.
-When the market sweeps above a session high → potential Short setup
-When the market sweeps below a session low → potential Long setup
-A trade is triggered when the confirmation candle closes in the opposite direction of the sweep (bearish after a high sweep, bullish after a low sweep).
-Only one trade per sweep type (1 per High, 1 per Low) is allowed per session.
----------------------------------------------------------------------------------
----------------------------------------------------------------------------------
📈 Risk Management
-Configurable Risk/Reward Target (default = 2:1)
-Configurable Position Size (number of contracts)
-Each trade uses a fixed Stop Loss (beyond the wick of the sweep) and a Take Profit calculated from the RR setting.
-All trades are automatically logged in the Strategy Tester with performance metrics.
----------------------------------------------------------------------------------
----------------------------------------------------------------------------------
💡 Features
✅ Visual session highlighting (Asia = Aqua, London = Orange)
✅ Automatic liquidity line plotting (session highs/lows)
✅ Entry & exit labels (optional visual display)
✅ Customizable RR and contract size
✅ Works on any instrument (ideal for indices, futures, or forex)
✅ Compatible with all timeframes (optimized for 1M–15M)
----------------------------------------------------------------------------------
----------------------------------------------------------------------------------
⚠️ Notes
-Best used on New York time-based charts.
-Designed for educational and backtesting purposes — not financial advice.
-Use as a foundation for further optimization (e.g., SMT confirmation, FVG filter, or time-based restrictions).
----------------------------------------------------------------------------------
----------------------------------------------------------------------------------
🧩 Recommended Use
Pair this with:
-ICT’s concepts like CISD (Change in State of Delivery) and FVGs (Fair Value Gaps)
-Higher timeframe liquidity maps
-Session bias or daily narrative filters
----------------------------------------------------------------------------------
----------------------------------------------------------------------------------
Author: jygirouard
Strategy Version: 1.3
Type: ICT Liquidity Sweep Automation
Timezone: America/New_York

MSSM - Multi-Session Structural Map (Precision Sweeps)MSSM – Multi-Session Structural Map (Precision Sweeps)
This indicator provides a structured view of the market based on four key components:
1). Previous session levels
2). Confirmed fractal swing points
3). Volume pocket highlights
4). Non-repainting precision liquidity sweep markers
It is designed to help analyze how price interacts with important reference areas and structural points. This tool does not generate signals or predictions. All information is visual and educational only.
HOW THE INDICATOR WORKS
PREVIOUS SESSION LEVELS
The script plots the previous session’s High, Low, and Mid. These levels help observe how the current session behaves around the prior day’s range. They act as reference areas only.
FRACTAL SWING MAP (NON-REPAINTING)
Confirmed fractals are used to mark historical swing highs and swing lows. Since fractals confirm after a certain number of bars, the swings do not repaint once formed. These swings provide a clearer view of market structure.
VOLUME POCKETS
The indicator highlights areas where volume expands relative to a rolling volume average. These regions show increased participation or activity. The highlights are informational and do not imply direction.
PRECISION LIQUIDITY SWEEPS (NON-REPAINTING)
A sweep is tagged only when:
• Price trades beyond a confirmed swing high or swing low
• Price closes back inside the previous swing level
• A wick rejection occurs
• Volume expands relative to a recent rolling average
These markers simply show where price interacted with liquidity around prior structural levels. They do not indicate a trading signal or bias.
HOW TO ADD THE INDICATOR
Open the Pine Editor in TradingView
Search the indicator name and add to favorites.
Click “Add to chart”
Adjust settings as needed (fractals, sweeps, volume pockets, or session levels)
HOW TO READ AND USE THE INDICATOR
SESSION LEVELS
Observe whether price respects, rejects, compresses around, or expands beyond the previous session high, low, or midpoint. These are observational reference levels only.
FRACTALS
Fractal highs and lows help visualize structural turning points. They provide a clearer picture of where liquidity may rest above or below past swing levels.
VOLUME POCKETS
When volume expands compared to the recent average, the candle is shaded. These areas may show increased participation, but no directional meaning is implied.
PRECISION SWEEPS
Sweeps highlight when price reaches beyond a prior confirmed swing level and then rejects that area with displacement. These markers identify interactions with liquidity, but they are not signals and do not forecast future outcomes.
CUSTOMIZATION OPTIONS
Users can adjust:
• Session level visibility
• Fractal sensitivity
• Volume pocket threshold
• Sweep sensitivity and visibility
• Transparency and styling
This makes the tool flexible across different symbols and timeframes.
IMPORTANT NOTES AND POLICY COMPLIANCE
• The indicator does not provide buy or sell signals
• The indicator does not predict price or direction
• All plotted elements are based on past price behavior
• All components are informational only
• Users should perform their own analysis and risk evaluation
• Past behavior does not guarantee future performance
SUMMARY
MSSM provides a structured view of price by combining previous session levels, confirmed swing structure, volume expansion zones, and non-repainting sweep identification. Its purpose is to assist traders in visually analyzing market structure while staying fully aligned with TradingView’s House Rules and content policies.

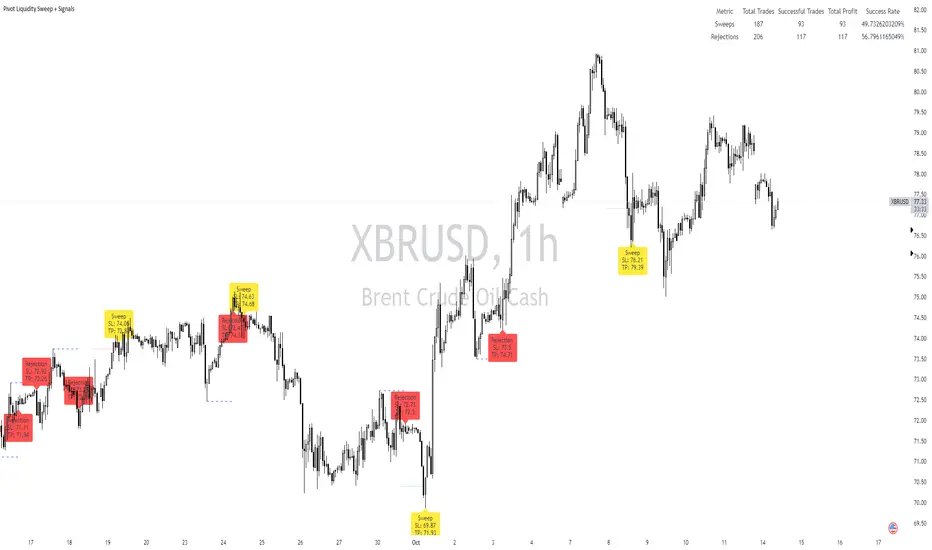
Pivot Liquidity Sweep + SignalsCore Functionalities:
Sweep Signals:
The indicator identifies sweeps of liquidity by detecting when price exceeds recent pivot highs (swing highs) or pivot lows (swing lows) and then reverses direction. It draws attention to these scenarios by labeling them on the chart.
For bullish sweep signals, the entry point is the closing price of the sweep candle, with the stop loss placed at the highest point between the sweep candle and the previous candle.
For bearish sweeps, the entry point is similarly identified, with the stop loss being the lowest price of the sweep candle and the candle before it. The profit target is dynamically set to the low or high of the closest valid pivot depending on the direction of the trade.
Rejection Signals:
Rejection signals are identified when price attempts to break a pivot high or low but fails, causing a rejection.
Bullish rejections involve price trying to break a pivot low but closing back above it, indicating potential for a bounce.
Bearish rejections follow a similar pattern, with price attempting to break a pivot high but failing to hold above it, signaling a potential bearish move.
High-Precision Intrabar Data:
The "Intrabar Precision" feature allows the indicator to use lower timeframe data to accurately plot sweeps and rejections, providing traders with precise entry and exit points.
The intrabar settings are particularly useful for traders looking for high-precision trades, such as scalpers who want to capture small yet consistent moves.
ATR and Percentage-Based Filters:
The indicator allows for customizable filters to ensure signals meet certain thresholds before being validated. Traders can use ATR (Average True Range) or percentage-based conditions to filter out low-quality signals, ensuring that the trades captured have enough volatility or price movement potential.
Dashboard:
The built-in dashboard provides a quick overview of trades executed using the indicator, displaying metrics such as the total number of sweep and rejection trades, their success rates, and total profit in points.
The dashboard is color-coded for easy reading and offers traders insights into the overall performance of their strategy, helping with ongoing evaluation and optimization.
Labeling and Alerts:
Every time a sweep or rejection signal is detected, the indicator automatically labels the chart to help traders quickly identify the trading opportunities.
Alerts are also generated for each trading signal, providing the trader with real-time notifications, which can be useful for those who are not constantly monitoring their charts.
Stop Loss and Target Adaptation:
The stop loss levels are adjusted dynamically based on the recent pivot points, and the target profit is derived from valid subsequent pivot levels to ensure realistic and efficient trade exits.
ICT Sweep + FVG Entry (v6) • Pro Pack 📌 ICT Sweep + FVG Entry Pro Pack
This indicator combines key ICT price action concepts with practical execution tools to help traders spot high-probability setups faster and more objectively. It’s designed for scalpers and intraday traders who want to keep their chart clean but never miss critical market structure events.
🔑 Features
Liquidity Pools (HTF)
• Auto-detects recent swing highs/lows from higher timeframes (5m/15m).
• Draws both lines and optional rectangles/zones for clear liquidity areas.
Liquidity Sweeps (BSL/SSL)
• Identifies when price sweeps above/below liquidity pools and rejects back.
• Optional Grade-A sweep filter (wick size + strong re-entry).
Fair Value Gaps (FVGs)
• Highlights bullish/bearish imbalances.
• Optional midline (50%) entry for precision.
• Auto-invalidation when price fully closes inside the gap.
Killzones (New York)
• Highlights AM (9:30–11:30) and PM (14:00–15:30) killzones.
• Option to block signals outside killzones for higher strike rate.
Bias Badge (DR50)
• Displays if price is trading in a Bull, Bear, or Range context based on displacement range midpoint.
SMT Assist (NQ vs ES)
• Detects simple divergences between indices:
Bearish SMT → NQ makes HH while ES doesn’t.
Bullish SMT → NQ makes LL while ES doesn’t.
SL/TP Helper & R:R Label
• Automatically draws stop loss (at sweep extreme) and target (opposite pool or recent swing).
• Displays expected Risk:Reward ratio and blocks entries if below your chosen minimum.
Filters
• ATR filter ensures signals only appear in sufficient volatility.
• Sweep quality filter avoids weak wicks and fake-outs.
🎯 How to Use
Start on HTF (5m/15m) → Identify liquidity zones and bias.
Drop to LTF (1m) → Wait for a liquidity sweep confirmation.
Check for FVG in the sweep’s direction → Look for retest entry.
Use the SL/TP helper to validate your risk/reward before taking the trade.
Focus entries during NY Killzones for maximum effectiveness.
✅ Why this helps
This tool reduces screen time and hesitation by automating repetitive ICT concepts:
Liquidity pools, sweeps, and FVGs are marked automatically.
Killzone timing and SMT divergence are simplified.
Clear visual signals for entries with built-in RR filter help keep your trading mechanical.
⚠️ Disclaimer: This script is for educational purposes only. It does not provide financial advice or guarantee results. Always use proper risk management.

Liquidity Sweeps [UAlgo]
🔶 Description:
This script, "Liquidity Sweeps by UAlgo" aims to identify and visualize potential liquidity sweeps in the market, assisting traders in spotting significant price levels where liquidity may be targeted by large orders. The script highlights pivot points and draws support and resistance lines based on user-defined parameters. When a liquidity sweep occurs, the script dynamically adjusts the displayed lines and provides annotations, signaling potential buying or selling opportunities.
🔶 Key Features:
Pivot Analysis: Utilizes pivot points to identify potential support and resistance levels.
Liquidity Sweep Detection: Dynamically adjusts support and resistance lines based on price action, highlighting liquidity sweep events.
Buy Side Liquidity Sweep Example :
Sell Side Liquidity Sweep Example :
Liquidity areas waiting to be swept are shown as "pivot high" in red and "pivot low" in green.
Customizable Parameters: Allows users to adjust parameters such as pivot length, maximum lines to draw, colors, and line width to suit their trading preferences.
Real-time Annotations: Provides real-time annotations on the chart when liquidity sweep events are detected, aiding traders in decision-making.
Disclaimer:
This script is provided for educational and informational purposes only. Trading involves risks, and it is essential to conduct thorough research and exercise caution when making financial decisions. The author does not guarantee the accuracy or completeness of the information provided by this script, and any actions taken based on this information are at the user's own risk.

Liquidity Structure & Sweeps [Visualized]Liquidity Structure & Sweeps | 流动性结构与猎杀
1. Design Philosophy & Logic
This indicator is designed based on Smart Money Concepts (SMC) and Market Microstructure principles. Unlike traditional indicators that rely on lagging averages or repainting fractals, this script focuses on "Objective Structure" and "Liquidity Grabs".
The core design philosophy rests on three pillars:
Zero Repainting (Real-time Integrity): We utilize a strict "Left-Side Confirmation" algorithm. A structure level is only stored in memory when the candle is fully closed (barstate.isconfirmed). This ensures that the historical signals you see are exactly what happened in real-time.
Institutional Memory (Visualized): Markets "remember" key levels. This script draws dashed lines extending from valid pivot points. These lines represent "resting liquidity" (Stop Orders). They remain on the chart until the price interacts with them.
Sweep vs. Breakout: Not all breaches are equal. We specifically look for "Sweeps" (Liquidity Grabs) — where price pierces a level but closes back inside. This is a classic sign of absorption and potential reversal, distinct from a structural breakout.
2. Key Features
Visualized Order Blocks: Automatically draws potential support (Green Dotted) and resistance (Red Dotted) lines based on fractal points.
Wick Detection: Filters out strong momentum breakouts. Signals are only generated when a specific "Wick Ratio" is met, indicating a rejection.
Clean Charts: Features a "Garbage Collection" mechanism. Once a level is swept, the line is removed, and a signal dot is placed. Old, untouched levels are automatically cycled out to prevent chart clutter.
3. How to Use
The Lines (Context):
Red Dotted Line: Buy-side Liquidity (Resistance). Expect potential shorts or breakouts here.
Green Dotted Line: Sell-side Liquidity (Support). Expect potential longs or breakdowns here.
The Signals (Action):
Red Dot (Bearish Sweep): Price spiked above a Resistance Line but closed below it. This suggests long stops were hunted, and bears are stepping in.
Green Dot (Bullish Sweep): Price spiked below a Support Line but closed above it. This suggests short stops were hunted, and bulls are stepping in.
Configuration:
Structure Length: Adjusts sensitivity. Higher values (e.g., 20-50) find major swing points; lower values (e.g., 5-10) find scalping setups.
Wick Filter %: The minimum size of the wick relative to the breakout. Increase this to filter for only the most dramatic rejections.
4. Developer Notes & Considerations
Why do lines disappear? In this logic, liquidity is treated as "Fuel". Once a level is swept (the stop orders are triggered), the fuel is consumed. Keeping the line would clutter the chart with invalid data.
Why is the dot small? The indicator is designed to be part of a toolchain, not a standalone signal. The minimalist design prevents visual interference with price action or other indicators.
1. 设计思路与核心逻辑
本指标基于 聪明钱概念 (SMC) 与 市场微观结构 原理设计。不同于依赖滞后均线或存在重绘问题的传统分形指标,本脚本专注于捕捉 “客观结构” 与 “流动性猎杀 (Liquidity Grabs)”。
核心设计哲学包含三大支柱:
零重绘 (Zero Repainting): 我们采用了严格的“左侧确认”算法。所有的结构位仅在K线完全收盘 (barstate.isconfirmed) 后才会被记录。这保证了您回测看到的信号与实盘完全一致,杜绝“未来函数”陷阱。
可视化的机构记忆: 市场是有记忆的。本脚本会从有效的波段高低点引出虚线。这些虚线代表了“沉睡的流动性”(止损盘聚集区)。它们会一直延伸,直到价格触碰它们。
区分“猎杀”与“突破”: 并不是所有的破位都是一样的。我们专注于识别“扫损(Sweep)”——即价格刺破了关键位,但收盘价收回了关键位内部。这是典型的吸筹或派发信号,与趋势延续的真突破有本质区别。
2. 主要功能
结构可视化: 自动基于分形点绘制潜在的支撑线(绿色虚线)和阻力线(红色虚线)。
插针检测: 过滤掉强势的实体突破。只有当价格出现明显的“长影线”拒绝行为时,才会触发信号。
图表自清洁: 内置“垃圾回收”机制。一旦某个关键位的流动性被猎杀(触发信号),该线条会被自动删除。过旧且未被触碰的线条也会被自动替换,保持图表整洁。
3. 使用指南
线条 (市场语境):
红色虚线: 买方流动性池(阻力位)。
绿色虚线: 卖方流动性池(支撑位)。
信号点 (交易动作):
红色圆点 (看跌猎杀): 价格刺破了红色阻力线,但收盘价回落到线下方。这暗示多头止损被触发,主力可能正在建立空单。
绿色圆点 (看涨猎杀): 价格刺破了绿色支撑线,但收盘价反弹到线上方。这暗示空头止损被触发,主力可能正在建立多单。
参数设置建议:
Structure Length (结构周期): 调整灵敏度。数值越大(如 20-50)锁定大级别波段;数值越小(如 5-10)适合短线剥头皮。
Wick Filter % (影线过滤): 设置影线占价格波动的最小比例。调大该数值可以只看最剧烈的反转信号。
4. 开发者注记与潜在考量
为什么线条会消失? 在本逻辑中,流动性被视为“燃料”。一旦发生猎杀(止损单成交),该位置的燃料即被消耗。移除线条是为了防止无效数据干扰判断。
为什么圆点设计得很小? 该指标旨在成为您交易工具链的一部分,而非唯一的决策依据。极简设计是为了避免干扰裸K形态或其他指标的观察。
===============================================================
这个脚本(我们称之为 Liq Structure Script)本质上是一个基于价格行为(Price Action)的结构猎杀探测器。
以下是详细的深度对比分析:
1. 如何使用? (实战操作手册)
不要把它当作“红灯停绿灯行”的傻瓜指标。把它当作一个**“战场地图”**。
第一阶段:观察结构 (The Setup)
图表上会自动画出 红色虚线(上方压力)和 绿色虚线(下方支撑)。
解读:告诉自己,“这里埋着很多人的止损单”。不要在这里盲目追涨杀跌。
第二阶段:等待猎杀 (The Trigger)
耐心等待价格冲向这些虚线。
关键动作:价格刺破虚线,然后迅速收回。
信号确认:虚线消失,留下一个 红点(顶部猎杀)或 绿点(底部猎杀)。
第三阶段:进场逻辑 (The Execution)
做空逻辑:出现红点 + K线留长上影线 → 说明多头试图突破失败,被主力“倒了一盆冷水”。此时可尝试做空,止损设在刚刚那个最高点上方一点点。
做多逻辑:出现绿点 + K线留长下影线 → 说明空头试图砸盘失败,被主力接住了。
传统爆量是“燃料”,Liq 脚本是“引爆点”。没有引爆点的爆量可能是空转;没有爆量的引爆点可能是假摔。Liq 脚本是一个免费、轻量级、基于K线逻辑的替代品。它不需要你买昂贵的数据服务,它利用的是“图表形态学”中的流动性共识。
结论:如何定位这个工具?
这个脚本不是“预测未来的水晶球”,而是一个**“高胜率区域提示器”**。
用它来找位置(哪里有陷阱?)。
用成交量来做确认(是不是真的有主力介入?)。
用宏观逻辑来定方向(现在该做多还是做空?)。
它是你交易工具链中负责**“微观入场时机(Timing)”**的那一环。

Liquidity Sweep & Reversal MapLiquidity Sweep & Reversal Map (LSRM) is a visual tool designed to help traders study how price interacts with key liquidity areas such as daily highs, daily lows, previous-day levels, and potential sweep zones. Its purpose is to map structure, highlight volatility around major reference points, and visualize how price behaves after taking liquidity.
This indicator does not attempt to predict market direction. It simply identifies conditions where price has interacted with a known reference level and marks that interaction for user analysis.
🔍 What This Indicator Shows
1. Key Liquidity Reference Levels
The script automatically draws and updates the following levels:
TH — Today’s High
TL — Today’s Low
PDH — Previous Day High
PDL — Previous Day Low
These levels are widely monitored by many traders and can be helpful when studying liquidity behavior and intraday volatility.
2. Liquidity Sweeps
A liquidity sweep occurs when:
Price briefly moves beyond a major high or low
And then closes back within the prior range
The indicator marks detected sweep interactions with:
BS (Bullish Sweep) when liquidity is taken below a low
SS (Bearish Sweep) when liquidity is taken above a high
A sweep only appears after the bar has closed, helping users analyze completed price structure.
3. Optional Sweep Zones
When enabled, the tool draws a shaded zone between:
The swept wick
The reference level
This can help highlight areas where liquidity was taken.
4. Volume & Candle Filters
The indicator includes optional filters such as:
Relative volume spikes
Strong candle body requirement
These filters are provided only to refine the visual highlight of sweeps; they do not constitute trading signals.
🎛 Customization
Users can configure:
Instrument presets
Sweep buffers
Volume sensitivity
Line visibility and thickness
Label display
Zone visibility
All settings are optional and intended for chart annotation only.
⚠️ Important Notes
This tool is not a trading system, signal generator, or strategy.
It does not provide buy/sell advice or predict future price movement.
All markings are visual aids for chart study and structural analysis only.
Users should rely on their own judgment and independent analysis when making trading decisions.
