Swing Ranges [ChartPrime]Swing Ranges is an indicator designed to provide traders with valuable insights into swing movements and real-time support and resistance (SR) levels. This tool detects price swings and plots boxes around them, allowing traders to visualize the market dynamics efficiently. The indicator's primary focus is on real-time support and resistance levels, empowering traders to make well-informed decisions in dynamic market conditions.
Key Features:
Swing Box Visualization:
Swing Ranges excels at detecting swings in the price data and visually representing them with boxes on the price chart. This enables traders to quickly identify swing ranges, essential for understanding market trends and potential reversal points. VWAP POCs are also provided giving areas of high activity in each block.
Real-Time Support and Resistance Levels:
The core feature of Swing Ranges is its real-time support and resistance levels. These levels are dynamically calculated based on the volume-weighted data for each specific range. The indicator displays the strength of support and resistance zones with percentage bars, indicating the ratio between bullish and bearish volume. This real-time information empowers traders to assess the strength and significance of each SR level, enhancing their ability to execute well-timed trades.
ATR (Average True Range) Value:
Swing Ranges also includes an ATR value label, which shows the Average True Range for the selected period. ATR aids traders in understanding market volatility, enabling them to set appropriate stop-loss and take-profit levels for their trades.
VWAP (Volume Weighted Average Price) Information:
Traders c an readily access the VWAP value through the indicator's label. VWAP provides insights into the average price at which an asset has been traded, helping traders identify potential fair value areas and market trends.
Price Difference Percentage:
Swing Ranges displays the percentage difference between the high and low of each swing. This information allows traders to gauge the magnitude of price movements and assess potential profit targets more effectively.
The indicator also has a NV value. If the NV is high e.g. 10% or more there is indecision in the market and the market is trying to remain in a given range.
Settings Inputs:
1. Length Control:
The Length setting input in Swing Ranges allows traders to adjust the sensitivity of the indicator to detect swings. Traders can customize the length based on their trading strategies and timeframes.
2. ATR Period Adjustment:
The ATR Period input allows traders to fine-tune the calculation period for the Average True Range. This feature enables traders to adapt the indicator to different market conditions and asset classes.
Swing Ranges: Real-Time Support and Resistance Indicator is a comprehensive tool that combines swing visualization with dynamic support and resistance levels. By focusing on real-time SR levels, this indicator equips traders with the essential information needed to make confident trading decisions in ever-changing market conditions.
在脚本中搜索"swing"

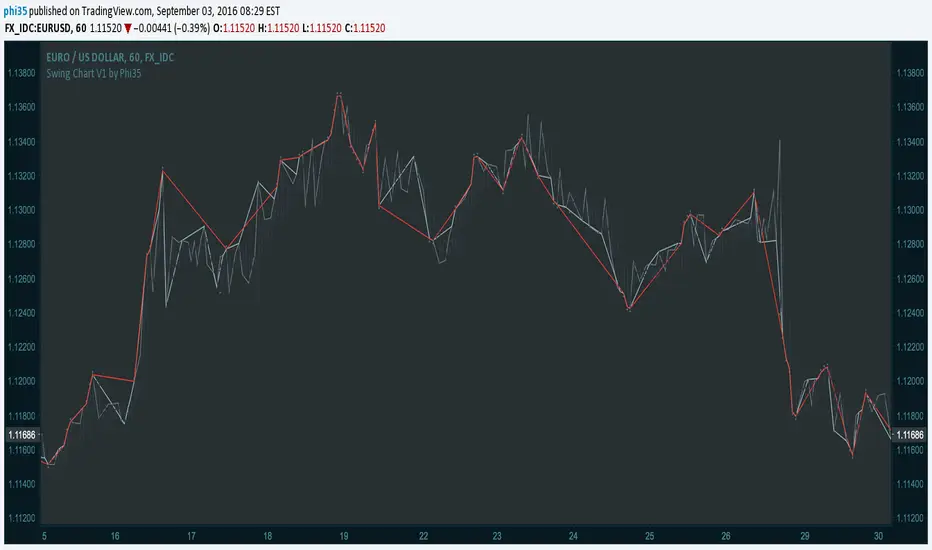
Swing Chart V1 by Phi35 © With this indicator, which plots the swing chart of the 3 degrees, swing traders can automate their work of tracking the right bars.
How it works:
Minor Degree (one bar) (gray)= If the current high is higher than the previous high or the current low is lower than the previous low.
Intermediate Degree (two bar) (baby blue)= If the current high is higher than previous and the penultimate high etc.
Main Degree (three bar) (red)= If the current high is higher than the previous, the penultimate and the high before penultimate high etc.
Alert:
On crossover there will be an alert (popup with a message) and in addition you will see "diamonds" on the place where the crossover took place
If there is an issue or any suggestions, feel free to contact me. Do not modify the code without permission.
Swing Chart V1 by Phi35 ©

Swing Reversal IndicatorSwing Reversal Indicator was meant to help identify pivot points on the chart which indicate momentum to buy and sell. The indicator uses 3 main questions to help plot the points:
Criteria
Did price take out yesterday's high or low?
Is today's range bigger than yesterday? (Indicates activity in price)
Is the close in the upper/lower portion of the candle? Thus, indicating momentum in that direction
This indicator was built to help me find pivot points for directional options trading however can be used for equities and forex swing trading and other strategies. Used in conjunction with a BB extreme can provide good setups.
Alerts are available for both the long and the short positions and the indicator will repaint as price moves.
The character Plotted can be changed in the settings
The size of the candle area can be changed as well if you want to tighten/loosen the trigger points based on the third question above.

Swing-Based Volatility IndexSwing-Based Volatility Index
This indicator helps traders quickly determine whether the market has moved enough over the past few hours to justify scalping.
It measures the percentage price swing (high to low) over a configurable time window (e.g., last 4–8 hours) and compares it to a minimum threshold (e.g., 1%).
✅ If the percent move exceeds the threshold → Market is volatile enough to scalp (green background).
🚫 If it's below the threshold → Market is too quiet (red background).
Features:
Adjustable lookback period in hours
Custom threshold for volatility sensitivity
Automatically adapts to the current chart timeframe
This tool is ideal for scalpers and short-term traders who want to avoid entering trades in low-volatility environments.

Swing Percentile Lines [QuantVue]The Swing High/Low Percentile Indicator is designed to help traders identify key price levels based on the most recent swing high and low. By anchoring to the most recent swing high and swing low, the indicator automatically generates percentile lines ( 25%, 50%, 75%) that act as dynamic support and resistance levels.
What Does the Indicator Do?
The Swing High/Low Percentile Indicator works by identifying the most recent significant price swings, whether it's a swing high or swing low. It then calculates the range between these points and divides the distance into percentage-based levels. These levels are plotted on the chart as clear, easy-to-read lines at 25%, 50%, and 75% of the range between the swing high and low.
These percentile lines serve as dynamic price zones where traders can anticipate potential reactions, whether the market is trending or consolidating.
How Can Traders Use the Indicator?
Support and Resistance: The percentile lines act as evolving support and resistance zones. Traders can anticipate price bounces or breaks at these levels, providing opportunities for trend-following or reversal trades.
Trend Identification: The indicator helps traders determine the strength of a trend. In a strong uptrend, price will likely stay above the 50% or 75% lines, while in a downtrend, it may remain below the 50% or 25% lines. This gives traders an edge in recognizing the overall market direction.
Entry and Exit Points: Traders can use the percentile lines to time their entries and exits. For example, entering a trade on a pullback to the 25% or 50% line offers a favorable risk-to-reward ratio. Similarly, the percentile lines serve as natural profit targets, allowing traders to plan exits as the price approaches the 50% or 75% levels.
Risk Management: The clear delineation of price levels makes it easy for traders to set stop-loss orders. For example, if price falls below the 25% line in an uptrend, it may signal weakness, prompting an exit or reduced position size.
Breakout and Breakdown Scenarios: When price breaks above a recent swing high or below a swing low, the percentile lines provide traders with pullback entry opportunities or key levels to watch for continuation of the move.

Swing High-Low Line ConnectorSwing High-Low Line Connector is a simple and intuitive tool that automatically detects swing highs and swing lows using fractal-style pivot logic and connects them with clean, continuous lines. This indicator helps traders visualize market structure, trend shifts, and swing-based support/resistance levels at a glance.
The script identifies each confirmed swing point based on a user-defined lookback window (left/right bars). When a new swing is confirmed, the indicator updates the previous leg or creates a new one, effectively drawing the classic “zigzag-style” connections used in discretionary trading and price-action analysis.
A dynamic tail extension is included to show the most recent swing extending toward the current price. By default, the tail follows a ZigZag-style logic—extending upward after a swing low and downward after a swing high—but users can also anchor it to Close, High, Low, or HL2.
Features
Automatic detection of swing highs and swing lows
Clean line connections between swings (similar to discretionary market-structure mapping)
Proper consolidation handling: weaker highs/lows are ignored
Optional ZigZag-style dynamic tail extension
Fully customizable lookback window, line color, and line width
Works on any market and timeframe
Use Cases
Identifying market structure (HH, HL, LH, LL)
Visualizing trend transitions
Spotting breakout levels and swing-based support/resistance
Aiding discretionary swing trading, trend following, or pattern recognition
This indicator keeps the logic simple and visual—ideal for traders who prefer clean chart structure without unnecessary noise.

Swing High Low Detector by RV5📄 Description
The Swing High Low Detector is a visual indicator that automatically detects and displays swing highs and swing lows on the chart. Swings are determined based on configurable strength parameters (number of bars before and after a high/low), allowing users to fine-tune the sensitivity of the swing points.
🔹 Current swing levels are shown as solid (or user-defined) lines that dynamically extend until broken.
🔹 Past swing levels are preserved as dashed/dotted lines once broken, allowing traders to see previous support/resistance zones.
🔹 Customizable line colors, styles, and thickness for both current and past levels.
This indicator is useful for:
Identifying key market structure turning points
Building breakout strategies
Spotting trend reversals and swing zones
⚙️ How to Use
1. Add the indicator to any chart on any timeframe.
2. Adjust the Swing Strength inputs to change how sensitive the detector is:
A higher value will filter out smaller moves.
A lower value will capture more frequent swing points.
3. Customize the line styles for visual preference.
Choose different colors, line styles (solid/dashed/dotted), and thickness for:
Current Swing Highs (SH)
Past Swing Highs
Current Swing Lows (SL)
Past Swing Lows
4. Observe:
As new swing highs/lows are detected, the indicator draws a new current level.
Once price breaks that level, the line is archived as a past level and a new current swing is drawn.
✅ Features
Fully customizable styling for all lines
Real-time updates and automatic level tracking
Supports all chart types and instruments
👨💻 Credits
Script logic and implementation by RV5. This script was developed as a tool to improve price action visualization and trading structure clarity. Not affiliated with any financial institution. Use responsibly.

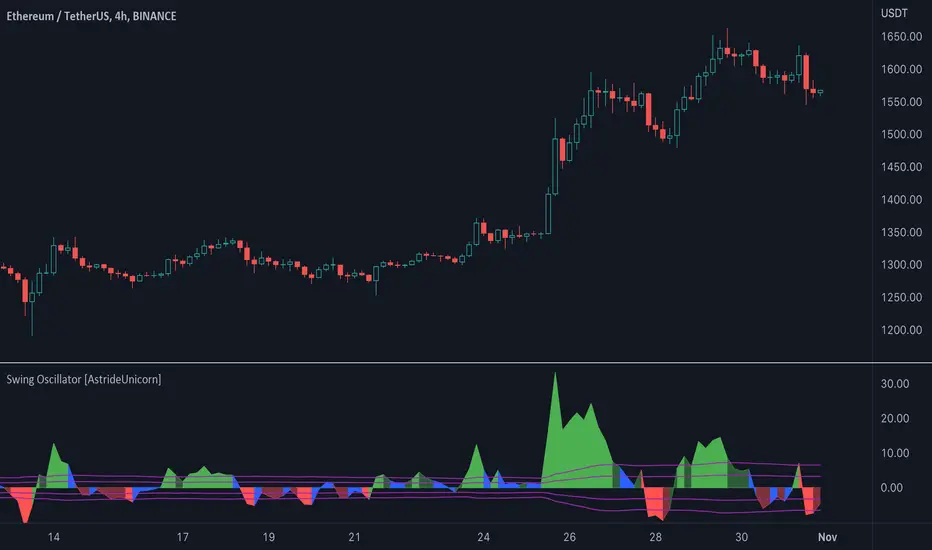
Swing Oscillator [AstrideUnicorn]The Swing Oscillator is an indicator that can help you catch small price movements, called swings. Swings are minor trends that occur when price moves between the highs and lows of a trend or range. Because of the short-term nature of swings, a new movement should be identified as soon as possible.
The indicator is based on our original formula, which averages the length of candlestick bodies and compares the result to several thresholds. This allows the algorithm to determine the direction and strength of the price movement.
HOW TO USE
When the indicator is above the zero level and colored green, it means that the price is in an upward swing. When the indicator is below the zero level and colored red, the price is in a downward swing. When the indicator is blue, the price swing is slowing down or the market is moving sideways. The amplitude of the oscillator shows the price volatility.
Swing High/Low (Adaptive)Swing High/Low (Adaptive)
Overview
The Indicator is a pivot point detection tool that identifies swing highs and lows with invalidation tracking. The key differentiator of this indicator is its adaptive invalidation system . Most pivot indicators simply mark every detected pivot without considering whether subsequent price action has made earlier pivots less relevant.
How It Works
The indicator uses Pine Script's native ta.pivotlow() and ta.pivothigh() functions combined with custom logic to detect swing points. The adaptive algorithm evaluates each potential pivot against the following criteria:
For Low Pivots:
Confirms a new low pivot when it's the next expected pivot type in the swing sequence
If consecutive lows occur, only accepts a new low if it's lower than the previous low
Marks the previous low as invalidated when a stronger low is detected
For High Pivots:
Confirms a new high pivot when it's the next expected pivot type in the swing sequence
If consecutive highs occur, only accepts a new high if it's higher than the previous high
Marks the previous high as invalidated when a stronger high is detected
This approach ensures that the indicator maintains clean swing structure and automatically adjusts when price action creates stronger pivots, providing a more realistic view of support and resistance levels.
Settings
Pivot Settings:
Left Bars : Number of bars to the left required for pivot confirmation (default: 5)
Right Bars : Number of bars to the right required for pivot confirmation (default: 5)
Pivot Display Settings:
Toggle visibility for low and high pivots independently
Customizable colors for valid pivot markers
Low pivots marked with upward triangle (▲)
High pivots marked with downward triangle (▼)
Invalid Pivot Settings:
Optional display of invalidated pivots
Separate color customization for invalid low and high pivots
Helps visualize where market structure expectations changed
ZigZag Settings:
Toggle ZigZag line display on/off
Separate colors for upward and downward price swings
Adjustable line width
Use Cases
1. Market Structure Analysis
Identify key swing points to understand the current market structure and trend direction. The adaptive invalidation feature ensures you're always looking at the most relevant pivots.
2. Support and Resistance Identification
Use confirmed swing highs and lows as potential support and resistance levels for entry and exit planning.
3. Trend Confirmation
The ZigZag visualization helps confirm trends by showing the sequence of higher highs and higher lows (uptrend) or lower highs and lower lows (downtrend).
Disclaimer
This indicator is designed as a technical analysis tool and should be used in conjunction with other forms of analysis and proper risk management. Past performance does not guarantee future results, and traders should thoroughly test any strategy before implementing it with real capital.

Swing Traces [BigBeluga]🔵 OVERVIEW
The Swing Traces indicator identifies significant swing points in the market and extends them forward as fading traces. These traces represent the memory of recent highs and lows, showing how price interacts with past turning points over time. Traders can use the fading intensity and breakout signals to gauge when a swing has lost influence or when price reacts to it again.
🔵 CONCEPTS
Swing Detection – Detects recent upper and lower swing points using sensitivity-based highs and lows.
Trace Longevity – Each swing projects a “trace” forward in time, gradually fading with age until it expires.
Trace Size – Each trace is drawn with both a main level and a size extension (half of the bar range) to highlight swing influence.
Longevity Counters – Swings remain active for a customizable number of bars before fading out or being crossed by price.
Swing Retest – Labels appear when price retest above/below an active trace extension levels, confirming potential reversal.
🔵 FEATURES
Adjustable sensitivity length for swing detection.
Separate longevity controls for upper and lower swing traces.
Fading gradient coloring for visualizing how long a trace has been active.
Double-trace plotting: one at the swing level and one offset by trace size.
Clear BUY/SELL signals when price crosses a swing trace after it has matured.
🔵 HOW TO USE
Use blue (upper) traces as resistance zones; lime (lower) traces as support zones.
Watch for fading traces: the longer they persist, the weaker their influence becomes.
Retest dots (●) confirm when price retest a trace, signaling a potential reversal.
Shorter sensitivity values detect faster, smaller swings; longer values capture major swing structures.
Combine with trend indicators or volume to filter false breakout signals.
🔵 CONCLUSION
The Swing Traces indicator is a powerful tool for mapping price memory. By projecting recent swing highs and lows forward and fading them over time, it helps traders see where price may react, consolidate, or break through with strength. Its dynamic traces and breakout labels make it especially useful for swing traders, breakout traders, and liquidity hunters.

Swing ComparatorHere I bring you an array of methods to compare the swings and consistency between assets.
This indicator is excellent for swing traders and scalpers looking to maximize their profits by examining which of two closely related pairs provides greater price fluctuation during given period.
This indicator works against two assets, which are to be configured in settings.
This indicator has 5 particular plots for you to examine, each which can be considered for you to contemplate which pair for you to next perform a trade on.
First off, let's start with the blue.
The blue is simply a pearson correlation coefficient, thankfully now included in tradingview. This provides a value of 1 as values show to be close correlation, 0 showing no correlation, and -1 showing negative correlation - meaning an increase in one pair correlates to a decrease in another pair. This will turn green when greater than 0.975, showing a very strong relationship between the two pairs, and red when below -0.975. This is the only plot to be interpreted on a scale from -1 to +1.
Next, we have the purple and yellow background plots, followed by the white and green moving averages. Though similar, these are all slightly different.
For each of these 4 plots, a value greater than 0 indicates greater price swings for your Symbol #1, while a value less than 0 indicates greater price swings for Symbol #2.
These calculations are performed on a per bar basis, meaning you're likely going to be examining bars longer than what you'll normally be trading on. Use confluence, as well as your own judgement for this.
For example, if symbol #1 provides a bar with an open value 1% greater or less than close, providing a 1% swing on a given bar, but symbol #2 provides 2%, the indicator will fall down toward the negative, as Symbol #2 had the greater swing.
First, yellow focuses on only open/close bar values, and thus the body of the candlestick.
Purple, on the other hand, focuses on the wicks of the candle - thus, the high/low values. I've opted to make these two different values as a wick focuses on the embodiment within the time period, and body focuses on the open/close instant.
Next, the green is an extended EMA of the purple - High/Low ratio. This is important to examine trend overtime, and reduce unneeded noise.
Lastly, the white is simply difference in the standard deviation of the particular bars, between the two symbols you have selected. The tends to usually tie up with the green pretty well.
Considering this is going to by nature be very noisy datasets, I have included in settings the option to extend an EMA for everything. They have their default settings, but if you'd like to examine the trend without an EMA, feel free to set it to 1 to eliminate its effects.
I have additionally added the ability to introduce clipping, as well as scale the correlation coefficient to remain visible when examining very short term time scales. In the future, I hope to properly normalize all plots to remain within a -1 to +1 basis. Please be patient as I have multiple projects ongoing.
Suggestions and constructive criticism are very well encouraged.
Anyone is welcome to utilize this in their code, as well, i just ask you provide credit.
As you reduce to time frames less than a day, you will likely have to reduce the coefficient min/max closer to 0.025, or just hide it entirely.
TODO:
Make it look better. Sorry, folks.
Introduce latency between pairs.
Examine significance of a coefficient of determination
Remove static weights and introduce z-score and linear normalization.
Consider adding room for a 3rd pair. This could get ugly, however.

Swing PointsAn indicator that identifies Swing Points (highs and lows) and then determines highs and lows of those swings. Works on all timeframes.
This is not my invention. It is a generic concept that I picked up from the trading world.
First level swings are termed as Short term Highs and Short term Lows (STH and STL)
The second level swings are termed as Long term Highs and Long term Lows (ITH and ITL)
An STH is formed when the 2nd high is higher than the highs on either side.
An ITH is formed when the 2nd STH is higher than the STH on either side.
Likewise logic for lows.
An example, A bullish trend can be expected if an ITH level is taken out after a ITL is formed after the ITH.
Inside bars: Inside bars are ignored. They can be marked, turned off by default.
Also, a "X" is placed over a swing point if two consecutive swings form simultaneously. This is turned off by default.

Swing Failure Pattern (SFP) [LuxAlgo]The Swing Failure Pattern indicator highlights Swing Failure Patterns (SFP) on the user chart, a pattern occurring during liquidity generation from significant market participants.
A Confirmation level used to confirm a trend reversal is also included. Users can additionally filter out SFP based on a set Volume % Threshold .
🔶 USAGE
Swing failure patterns occur when candle wicks exceed (above/below) a recent swing level but close back below/above it, and occur from more significant market participants engineering liquidity. This pattern can be indicative of a potential trend reversal.
A label and an accentuated wick line highlight the SFP (both can be disabled).
Using a higher "Swings" period will not return different SFP but will however potentially reduce their detection rate.
🔹 Confirmation Level
The confirmation level is the highest point between the previous swing and SFP for a bullish SFP, and the lowest point for a bearish SFP. This level allows confirming a trend reversal after an SFP once the price breaks it.
A small triangle will be displayed when the price closes beyond the confirmation level.
A more reactive and contrarian approach could use the SFP as an entry point, and the confirmation level for taking (partial) profit, or stop loss. The example below shows a possible scenario:
🔹 Volume % Threshold
During the occurrence of an SFP, the Volume % Threshold option allows comparing the cumulative volume outside the Swing level to the total volume of the candle. The following options are included:
Volume outside swing < Threshold: Volume outside the Swing level needs to be lower than x % of total candle volume. Prevent excessive liquidity generation.
Volume outside swing > Threshold: Volume outside the Swing level needs to be higher than x % of total candle volume. Requires more significant liquidity to be generated.
None: No extra filter is applied
Note that in the above case, the left SFP is no longer highlighted because the volume above the swing level was higher than the 25% threshold of the total volume.
When we change the setting to "Volume outside swing > Threshold", we get the reversed situation.
The "Volume outside Swing level" is obtained using intrabar - Lower TimeFrame (LTF) data.
At the intrabar (LTF) level, there are a maximum of 100K bars available. When using the Volume % Threshold filter, a vertical line will highlight the maximum period during which intrabars are available.
🔶 DETAILS
🔹 LTF Settings
When 'Auto' is enabled (Settings, LTF), the LTF will be the nearest possible x times smaller TF than the current TF. When 'Premium' is disabled, the minimum TF will always be 1 minute to ensure TradingView plans lower than Premium don't get an error.
Examples with current Daily TF (when Premium is enabled):
500 : 3-minute LTF
1500 (default): 1-minute LTF
5000: 30 seconds LTF (1 minute if Premium is disabled)
The concerning LTF can be seen at the right-top (default) corner.
🔶 SETTINGS
Swings: Period used for the swing detection, with higher values returning longer-term Swing Levels.
Bullish SFP: enable/disable bullish Swing Failure Patterns.
Bearish SFP: enable/disable bearish Swing Failure Patterns.
🔹 Volume Validation
Validation:
Volume outside swing < Threshold: The volume outside the swing level needs to be lower than x % of the total volume.
Volume outside swing > Threshold: The volume outside the swing level needs to be higher than x % of the total volume.
None: No extra validation is applied.
Volume % Threshold: % of total volume as threshold.
Auto + multiple: Adjusts the initial set LTF
LTF: LTF setting
Premium: Enable when your TradingView plan is Premium or higher
🔹 Dashboard
Show Dashboard: Display applied Lower Timeframe (LTF)
Location: Location of the dashboard
Size: Size of the dashboard
🔹 Style
Swing Lines
Confirmation Lines
Swing Failure Wick
Swing Failure Label
Lines / Labels: Color for lines and labels
SFP Wicks: Color for SFP wick line

Swing based support and resistanceThis indicator provided here is for identifying swing-based support and resistance levels. It uses two swing lengths, which can be adjusted by the user, to identify swings in the price data. For each swing length, the script calculates the support level as the low of the swing if the trend is up, or the high of the swing if the trend is down. It then plots the support and resistance levels on the chart, along with buy and sell signals.
The buy and sell signals are generated by comparing the current closing price to the support and resistance levels. If the closing price is above the support level, the script plots a buy signal. If the closing price is below the level, the script plots a sell signal.
To use the script, you would first need to add it to your trading platform. Once it is added, you can configure the swing lengths and other parameters to suit your trading style. You can then apply the script to a chart and begin using the support and resistance levels and buy and sell signals to make trading decisions.
Points to be noted while using the indicator:
# The script is designed to be used on a daily chart. However, you can also use it on other timeframes, such as weekly or monthly charts.
# The swing lengths that you choose will depend on your trading style. If you are a swing trader, you may want to use longer swing lengths. If you are a day trader, you may want to use shorter swing lengths.
# Remember, the support and resistance levels generated by the script are not exact price points. They are rather zones where demand and supply can change. Therefore, you should always use other technical analysis tools and indicators to confirm your trading decisions.
# Overall, the script is a useful tool for identifying swing-based support and resistance levels. It can be used by traders of all experience levels to generate trading ideas and improve their trading performance.
To use the swing-based support and resistance indicator with respect to price, you can follow these steps:
=> Identify the support and resistance levels that have been generated by the indicator.
=> Look for price action that is taking place near these levels.
=> If the price is above the level, look for bullish reversals or continuations.
=> If the price is below the level, look for bearish reversals or continuations.
For Example,
=> Bullish reversal: The price is above the level and forms a bullish candlestick pattern, such as a bullish hammer or engulfing pattern.
=> Bullish continuation: The price is above the level and bounces off of the level.
=> Bearish reversal: The price is below the level and forms a bearish candlestick pattern, such as a bearish hammer or engulfing pattern.
=> Bearish continuation: The price is below the level and rejects the level.
$$ You can also use the indicator to identify potential trading entry and exit points. For example, you could enter a long trade when the price breaks above a resistance level and exit the trade when the price retraces to the resistance level. Or, you could enter a short trade when the price breaks below a support level and exit the trade when the price rallies to the support level.
This swing-based support and resistance indicator is just one tool that you can use to trade. You should always use other technical analysis tools and indicators, such as price action and trend analysis, to confirm your trading decisions.
Additionally:
=> Be aware of the overall trend direction. If the trend is up, you should be looking for bullish reversals or continuations. If the trend is down, you should be looking for bearish reversals or continuations.
=> Use a stop loss order to limit your risk on each trade.
=> Consider using a position sizing strategy to manage your risk.
=> Do your own research and backtest any trading strategy before using it in a live trading environment.
Follow us for timely updates regarding future indicators and give it a like if you appreciate the indicator.

Swing Highs/Lows & Candle Patterns [LuxAlgo]This script labels swing highs and swing lows as well as the candle pattern that occurred at that precise point. The script can detect the following 6 candle patterns: hammer, inverse hammer, bullish engulfing, hanging man, shooting star, and bearish engulfing.
This indicator by its very nature backpaints by default, meaning that the displayed components are offset in the past.
🔶 USAGE
It can be interesting to see if a top or bottom is associated with a specific candle pattern, this allows us to study the potential of such a pattern to indicate a reversal. You can hover on a label with a specific pattern to see more details about it.
The notations HH, HL, LH, and LL you can see on the labels are defined as follows:
HH : Higher high
HL : Higher low
LH : Lower high
LL : Lower low
🔶 SETTING
Length: Sensitivity of the swing high/low detection, with lower values returning the maximum/minimum of shorter-term price variations.

Swing Profile Analyzer [ChartPrime]Swing Profile Analyzer
The Swing Profile Analyzer is a comprehensive tool designed to provide traders with valuable insights into swing frequency profiles, enabling them to identify key price levels and areas of market interest.
⯁ KEY FEATURES
Swing Frequency Profiles
Automatically plots frequency profiles for each swing, highlighting price distribution and key levels of significance.
Point of Control (POC) Line
Marks the price level with the highest number of closes within a swing, acting as a key area for potential price reactions.
Customizable Trend Display
Allows users to toggle between displaying profiles for bullish swings, bearish swings, or both, offering tailored analysis.
Integrated ZigZag Lines
Visualizes swing highs and lows, providing a clear picture of market trends and reversals.
Dynamic Profile Visualization
Profiles are color-coded to indicate the frequency of closes, with the highest value bins distinctly marked for easy recognition.
Max Frequency Highlight
Displays numerical values for the most active price level within each profile, showing how many closes occurred at the peak bin.
Updates only after swing formed
Profiles and POC lines automatically appear after swing is done
⯁ HOW TO USE
Identify Critical Price Levels
Use the POC line and frequency distribution to locate levels where price is likely to react or consolidate.
Analyze Swing Characteristics
Observe swing profiles to understand the strength, duration, and behavior of market trends.
Plan Entries and Exits
Leverage significant price levels and high-frequency bins to make more informed trading decisions.
Focus on Specific Trends
Filter profiles to analyze bullish or bearish swings based on your trading strategy.
⯁ CONCLUSION
The Swing Profile Analyzer is an essential tool for traders seeking to understand price dynamics within market swings. By combining frequency profiles, POC levels, and trend visualization, it enhances your ability to interpret and act on market movements effectively.

Gann Swing Oscillator The Gann Swing Oscillator has been adapted from Robert Krausz's book,
"A W.D. Gann Treasure Discovered". The Gann Swing Oscillator helps
define market swings.

Swing Anchored Vwap [BigBeluga]🔵 OVERVIEW
Swing Anchored Vwap tracks the market’s directional behavior by anchoring VWAPs (Volume Weighted Average Price) to dynamically detected swing highs and lows. It visually distinguishes the active swing VWAP from historical ones—offering traders a clean view of trend-aligned value zones with clearly marked inflection points.
🔵 CONCEPTS
Swing Anchored VWAPs: VWAPs are initiated from recent swing highs during downtrends and swing lows during uptrends.
Trend Detection: The indicator identifies trend shifts based on the breaking of recent highest or lowest price value.
Trend-Based Coloring:
• Green VWAPs: are drawn from swing lows in uptrends.
• Blue VWAPs: are drawn from swing highs in downtrends.
Sensitivity Control: The Length input defines how far back the script looks to determine swing points—shorter lengths make it more reactive.
🔵 FEATURES
Real-time VWAP projection from the current swing point, updated live.
Historical VWAP traces with slightly faded color to emphasize the current active one.
Swing markers automatically placed on highs/lows where VWAPs are anchored.
Label with price value at the end of each active VWAP line for clarity.
Adaptive color scheme that visually separates uptrend/downtrend zones.
🔵 HOW TO USE
Use active VWAP as a dynamic support/resistance guide during ongoing trends.
Observe breaks or rejections around these VWAPs for trend continuation or reversal clues .
Compare current price position relative to swing VWAPs to assess trend maturity and extension .
Combine with volume analysis or structure to increase conviction at swing points.
🔵 CONCLUSION
Swing Anchored Vwap merges the logic of anchored VWAPs and swing structure into a responsive visual tool. It helps traders stay aligned with the current trend while offering historical context via previous value anchors—ideal for intraday to swing-level analysis.

Swing Breakout Sequence [LuxAlgo]The Swing Breakout Sequence tool enables traders to identify a directional price action scalping sequence comprising two unsuccessful breakouts in the same direction, with the expectation of a third.
🔶 USAGE
This sequence looks for pressure on one side of a swing zone.
The market tried to break out of the zone twice but failed. This led to a pullback into the zone after each attempt. Once a reversal inside the zone is identified, the sequence is complete. It is expected that the market will move from the final reversal within the zone to the final breakout attempt outside the zone.
The sequence of price action is as follows:
Point 1: Breakout attempt out of the swing zone
Point 2: Pullback into the zone
Point 3: Breakout attempt out of Point 1
Point 4: Pullback into the zone, tapping into Point 2 liquidity
Point 5: Reversal structure with Point 4 in the form of a double top or double bottom
This sequence assumes traders will be caught off-guard when they try to capitalize on the initial breakout at Point 1, which is likely to result in a loss. If the breakout at Point 3 fails, all traders will be caught out and switch positions.
If there is enough pressure in the swing zone to cause a reversal at Point 5, the trapped traders could be the start of the next breakout attempt.
🔹 Sequence Detection
Traders can define sequence behavior and adjust detection with three parameters from the Settings panel.
Disabling Points 4 and 5 will detect the most uncompleted sequences.
🔹 Showing/Hiding Elements
Traders can change the look of sequences by showing or hiding their parts using the Style settings.
🔶 SETTINGS
Swing Length: Number of candles to confirm a swing high or swing low. A higher number detects larger swings.
Internal Length: Number of candles to confirm a internal high or internal low. A lower number detects smaller swings. It must be the same size or smaller than the swing length.
🔹 Detection
Point 4 Beyond Point 2: It only detects sequences where Point 4 is beyond Point 2.
Show Point 5: Enable/disable Point 5 detection.
Require Equal H/L at Point 5: Enable/Disable double top/bottom detection at Point 5 within a given threshold. A bigger value detects more sequences.
🔹 Style
Show Sequence Path: Enable/disable a line between sequence points.
Show Boxes: Enable/disable colored boxes for each sequence.
Show Lines: Enable/disable horizontal lines from each point of the sequence.
Default Color: Define the color or enable/disable auto color.

Swing Failure Pattern SFP [TradingFinder] SFP ICT Strategy🔵 Introduction
The Swing Failure Pattern (SFP), also referred to as a "Fake Breakout" or "False Breakout," is a vital concept in technical analysis. This pattern is derived from classic technical analysis, price action strategies, ICT concepts, and Smart Money Concepts.
It’s frequently utilized by traders to identify potential trend reversals in financial markets, especially in volatile markets like cryptocurrencies and forex. SFP helps traders recognize failed attempts to breach key support or resistance levels, providing strategic opportunities for trades.
The Swing Failure Pattern (SFP) is a popular strategy among traders used to identify false breakouts and potential trend reversals in the market. This strategy involves spotting moments where the price attempts to break above or below a previous high or low (breakout) but fails to sustain the move, leading to a sharp reversal.
Traders use this strategy to identify liquidity zones where stop orders (stop hunt) are typically placed and targeted by larger market participants or whales.
When the price penetrates these areas but fails to hold the levels, a liquidity sweep occurs, signaling exhaustion in the trend and a potential reversal. This strategy allows traders to enter the market at the right time and capitalize on opportunities created by false breakouts.
🟣 Types of SFP
When analyzing SFPs, two main variations are essential :
Real SFP : This occurs when the price breaks a critical level but fails to close above it, then quickly reverses. Due to its clarity and strong signal, this SFP type is highly reliable for traders.
Considerable SFP : In this scenario, the price closes slightly above a key level but quickly declines. Although significant, it is not as definitive or trustworthy as a Real SFP.
🟣 Understanding SFP
The Swing Failure Pattern, or False Breakout, is identified when the price momentarily breaks a crucial support or resistance level but cannot maintain the movement, leading to a rapid reversal.
The pattern can be categorized as follows :
Bullish SFP : This type occurs when the price dips below a support level but rebounds above it, signaling that sellers failed to push the price lower, indicating a potential upward trend.
Bearish SFP : This pattern forms when the price surpasses a resistance level but fails to hold, suggesting that buyers couldn’t maintain the higher price, leading to a potential decline.
🔵 How to Use
To effectively identify an SFP or Fake Breakout on a price chart, traders should follow these steps :
Identify Key Levels: Locate significant support or resistance levels on the chart.
Observe the Fake Breakout: The price should break the identified level but fail to close beyond it.
Monitor Price Reversal: After the breakout, the price should quickly reverse direction.
Execute the Trade: Traders typically enter the market after confirming the SFP.
🟣 Examples
Bullish Example : Bitcoin breaks below a $30,000 support level, drops to $29,000, but closes above $30,000 by the end of the day, signaling a Real Bullish SFP.
Bearish Example : Ethereum surpasses a $2,000 resistance level, rises to $2,100, but then falls back below $2,000, forming a Bearish SFP.
🟣 Pros and Cons of SFP
Pros :
Effective in identifying strong reversal points.
Offers a favorable risk-to-reward ratio.
Applicable across different timeframes.
Cons :
Requires experience and deep market understanding.
Risk of encountering false breakouts.
Should be combined with other technical tools for optimal effectiveness.
🔵 Settings
🟣 Logical settings
Swing period : You can set the swing detection period.
SFP Type : Choose between "All", "Real" and "Considerable" modes to identify the swing failure pattern.
Max Swing Back Method : It is in two modes "All" and "Custom". If it is in "All" mode, it will check all swings, and if it is in "Custom" mode, it will check the swings to the extent you determine.
Max Swing Back : You can set the number of swings that will go back for checking.
🟣 Display settings
Displaying or not displaying swings and setting the color of labels and lines.
🟣 Alert Settings
Alert SFP : Enables alerts for Swing Failure Pattern.
Message Frequency : Determines the frequency of alerts. Options include 'All' (every function call), 'Once Per Bar' (first call within the bar), and 'Once Per Bar Close' (final script execution of the real-time bar). Default is 'Once per Bar'.
Show Alert Time by Time Zone : Configures the time zone for alert messages. Default is 'UTC'.
🔵 Conclusion
The Swing Failure Pattern (SFP), or False Breakout, is an essential analytical tool that assists traders in identifying key market reversal points for successful trading.
By understanding the nuances between Real SFP and Considerable SFP, and integrating this pattern with other technical analysis tools, traders can make more informed decisions and better manage their trading risks.

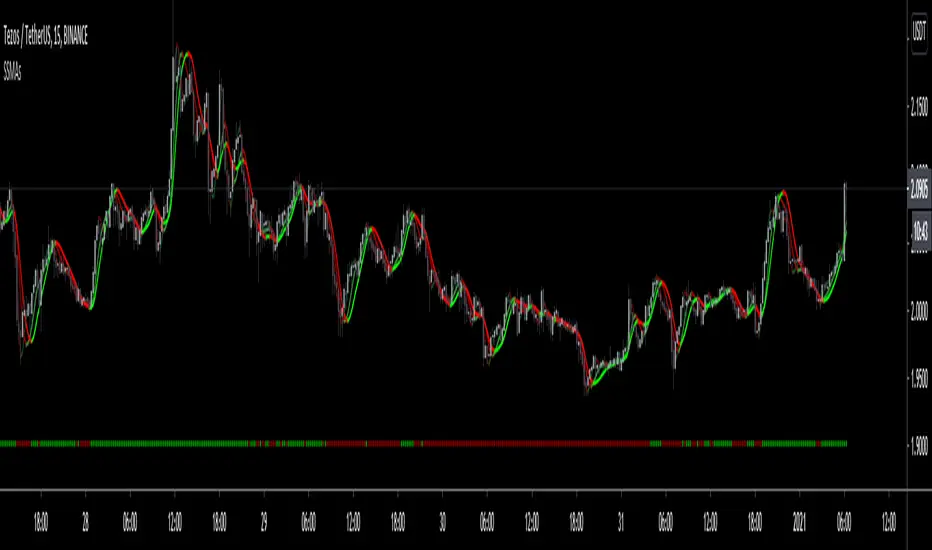
SwingScalpin MA'sDefault
HMA's + Trend Signals
Default SMA's
ALMA
BarColoring
The idea behind this script was to incorporate a few different moving average types into 1 indicator so multiple trading strategies could be implemented depending on Price Action. This indicator includes 3 HMA's, 2 user defined EMA/SMA's, 1 ALMA (which also is used for the bar coloring), and Trend signals at the bottom of the chart (which are defined by the 1st MA). By default all of the Moving Averages are set to false because they aren't meant to be used together unless you so chose to. The only feauture initially being shown are the Trend signals at the bottom of the screen.
HMA's - The default lengths for the HMA's are 7, 14, and 21.
This is not Financial Advice nor am I saying this works all of the time but here are a few examples of how I've traded the HMA's... OF course thid depends on overall PA but the idea is to enter and exit when all
three HMA's turn Green or Red...
For quicker entries and exits, you could enter when the Fast HMA crosses the Medium HMA and exit when the it crosses back over/under the Medium HMA.
For more of a swing trade and when there's definitely an established trend, I would stay in the trade until Fast HMA crosses under the Slow HMA, otherwise it might just be a normal retrace prior to making another move up.
When PA is ranging but not really trending in either direction, I'll use the Slow HMA as somewhat of a Trailing SL.
The 2 user defined moving averages can either be an EMA or SMA. The 1st MA is set to the 200 SMA by default, which also triggers the Trend signals at the bottom of the chart. The 2nd MA is set to the 6 SMA by default.
The ALMA is set to 50 by default, which is also used for the bar coloring. Lastly, all of the MA's change color depending on the trend.
SwingTrade ADX Strategy v6This is a swing trading strategy that combines VWAP (Volume Weighted Average Price), ADX (Average Directional Index) for trend strength, and volume ratios to generate long/short entry and exit signals. It's designed for daily charts but can be adapted.
#### Key Features:
- **Entries**: Based on VWAP crossovers, rising/falling delta (price deviation from VWAP), ADX trend confirmation, and volume ratios.
- **Exits**: Dynamic exits when VWAP delta reverses after a peak.
- **Filters**: Optional toggles for VWAP signals, ADX, and volume. Backtest date range for custom periods.
- **Visuals**: VWAP line, signal shapes/labels, and an info panel showing key metrics (VWAP Delta %, ADX, Volume Ratio).
- **Alerts**: Built-in alerts for buy/sell entries and exits.
#### How to Use:
1. Apply to your chart (e.g., stocks, forex, crypto).
2. Adjust parameters in the settings (e.g., ADX threshold, volume period).
3. Enable/disable indicators as needed.
4. Backtest using the date filters and review equity curve.
**Disclaimer**: This is for educational purposes only. Past performance is not indicative of future results. Not financial advice—trade at your own risk. Backtest thoroughly and use with proper risk management.
Feedback welcome! If you find it useful, give it a like.
