[TehThomas] - ICT VI / FVG / IFVG / Liquidity📌 Overview
This TradingView indicator is designed to help traders spot key price inefficiencies and liquidity events based on ICT (Inner Circle Trader) concepts. The script automatically highlights important areas on the chart, such as Volume Imbalances (VI), Fair Value Gaps (FVG), Inverted Fair Value Gaps (IFVG), and Liquidity Sweeps, giving traders a clear view of where price might react.
By marking these zones visually, the indicator serves as a liquidity map, showing where smart money could be targeting orders or rebalancing price action.
🔑 How the Script Works
The indicator detects four major market inefficiencies and liquidity patterns, each offering valuable insights into how price might behave:
1️⃣ Volume Imbalance (VI)
Bullish VI: When the current candle has higher volume than the previous candle in an upward move, this suggests demand is pushing the price up, creating potential buying opportunities.
Bearish VI: When the current candle has higher volume than the previous candle in a downward move, this suggests supply is pushing the price down, highlighting potential selling opportunities.
How to take trades:
Buy: Enter a long position when a bullish VI appears and the price is near a support zone or key level (such as the previous swing low or FVG).
Sell: Enter a short position when a bearish VI appears and the price is near a resistance zone or key level (such as the previous swing high or FVG).
2️⃣ Fair Value Gap (FVG)
Bullish FVG: A gap in price action where the low of the second candle is higher than the high of the first candle. Price tends to return to fill these gaps before continuing upward.
Bearish FVG: A gap in price action where the high of the second candle is lower than the low of the first candle. Price tends to return to fill these gaps before continuing downward.
How to take trades:
Buy: Enter long after a pullback into a bullish FVG zone and if price action shows signs of rejection (such as bullish candlestick patterns or strong momentum).
Sell: Enter short after a pullback into a bearish FVG zone and if price action shows signs of rejection (such as bearish candlestick patterns or strong downward momentum).
3️⃣ Inverted Fair Value Gap (IFVG)
An Inverted Fair Value Gap (IFVG) refers to a Fair Value Gap (FVG) that has already been filled or broken through by price action. Essentially, it is a gap that has been revisited by price and has now been mitigated or broken.
Example:
For Continuation: After price fills the gap, it may continue in the same direction. If price breaks through a bullish FVG and shows continuation, it may signal that the market is still in a strong uptrend.
For Reversal: If the price returns to an inverted FVG after breaching it, and then starts showing signs of reversal (e.g., reversal candlestick patterns, or a shift in momentum), this could signal an entry point in the opposite direction.
How to take trades:
Buy: Consider entering long when price returns to an IFVG zone that aligns with other bullish confluences, such as a bullish VI or liquidity sweep.
Sell: Consider entering short when price returns to a bearish IFVG zone that aligns with other bearish confluences, such as a bearish VI or liquidity sweep.
4️⃣ Liquidity Sweeps
Liquidity sweeps occur when the market temporarily breaks a key high or low to trigger stop-loss orders or lure traders into the wrong direction before reversing.
How to take trades:
Buy: If a liquidity sweep breaks a key resistance or swing high but fails to close above it, enter long when price begins to reverse in the opposite direction, ideally near a previous support or FVG zone.
Sell: If a liquidity sweep breaks a key support or swing low but fails to close below it, enter short when price begins to reverse in the opposite direction, ideally near a previous resistance or FVG zone.
🎯 Trade Setup and Confirmation Strategy
Here’s how to combine these concepts for high-probability trade setups:
Liquidity Sweeps + Volume Imbalances:
If a liquidity sweep occurs in conjunction with a volume imbalance (especially on a higher timeframe), this can act as a confirmation signal to enter the trade.
Example: A liquidity sweep breaks a previous high, but the price fails to close above it. If this happens alongside a break of a Volume imbalance (VI) , it could be a strong signal to sell.
FVG/IFVG Mitigation + Liquidity Sweeps:
Price often returns to mitigate imbalances, and when a liquidity sweep occurs near an unfilled gap, it could trigger a reversal.
Example: After an upward trend, a bearish liquidity sweep breaks a previous swing low, and price then revisits a bearish FVG and creates an IFVG, signaling an opportunity to buy.
Directional Bias (Higher Timeframe Analysis):
Always consider the higher timeframe trend to confirm trade direction. A bullish FVG or bullish VI on the lower timeframe aligns with a bullish trend on the higher timeframe.
Confluence with Key Levels:
When these patterns align with important price levels such as support, resistance, or previously identified swing highs/lows, it enhances the probability of a successful trade.
⚙️ How It Helps in Trading Strategy
The indicator assists in several aspects of trading:
Liquidity Hunts: Price often sweeps liquidity before making major moves.
Entry Confirmation: Use imbalances or sweeps as extra confluence for trade entries.
Mitigation Zones: Price frequently returns to fill inefficiencies before reversing.
Directional Bias: Bullish or bearish gaps align with the higher timeframe narrative.
🔍 ICT Concepts Included
✅Volume Imbalance (VI): High-volume inefficiencies.
✅Fair Value Gap (FVG): Standard price gaps.
✅Inverted Fair Value Gap (IFVG): Filtered large price gaps.
✅Liquidity Sweeps: Stop-hunting patterns by smart money.
⚠️ Disclaimer
This indicator is built for educational purposes and should not be considered financial advice. Trading carries risk, and no tool guarantees profits. Always use proper risk management and perform your own analysis before entering any trade.
在脚本中搜索"swing high low"

Swing Percentile Lines [QuantVue]The Swing High/Low Percentile Indicator is designed to help traders identify key price levels based on the most recent swing high and low. By anchoring to the most recent swing high and swing low, the indicator automatically generates percentile lines ( 25%, 50%, 75%) that act as dynamic support and resistance levels.
What Does the Indicator Do?
The Swing High/Low Percentile Indicator works by identifying the most recent significant price swings, whether it's a swing high or swing low. It then calculates the range between these points and divides the distance into percentage-based levels. These levels are plotted on the chart as clear, easy-to-read lines at 25%, 50%, and 75% of the range between the swing high and low.
These percentile lines serve as dynamic price zones where traders can anticipate potential reactions, whether the market is trending or consolidating.
How Can Traders Use the Indicator?
Support and Resistance: The percentile lines act as evolving support and resistance zones. Traders can anticipate price bounces or breaks at these levels, providing opportunities for trend-following or reversal trades.
Trend Identification: The indicator helps traders determine the strength of a trend. In a strong uptrend, price will likely stay above the 50% or 75% lines, while in a downtrend, it may remain below the 50% or 25% lines. This gives traders an edge in recognizing the overall market direction.
Entry and Exit Points: Traders can use the percentile lines to time their entries and exits. For example, entering a trade on a pullback to the 25% or 50% line offers a favorable risk-to-reward ratio. Similarly, the percentile lines serve as natural profit targets, allowing traders to plan exits as the price approaches the 50% or 75% levels.
Risk Management: The clear delineation of price levels makes it easy for traders to set stop-loss orders. For example, if price falls below the 25% line in an uptrend, it may signal weakness, prompting an exit or reduced position size.
Breakout and Breakdown Scenarios: When price breaks above a recent swing high or below a swing low, the percentile lines provide traders with pullback entry opportunities or key levels to watch for continuation of the move.

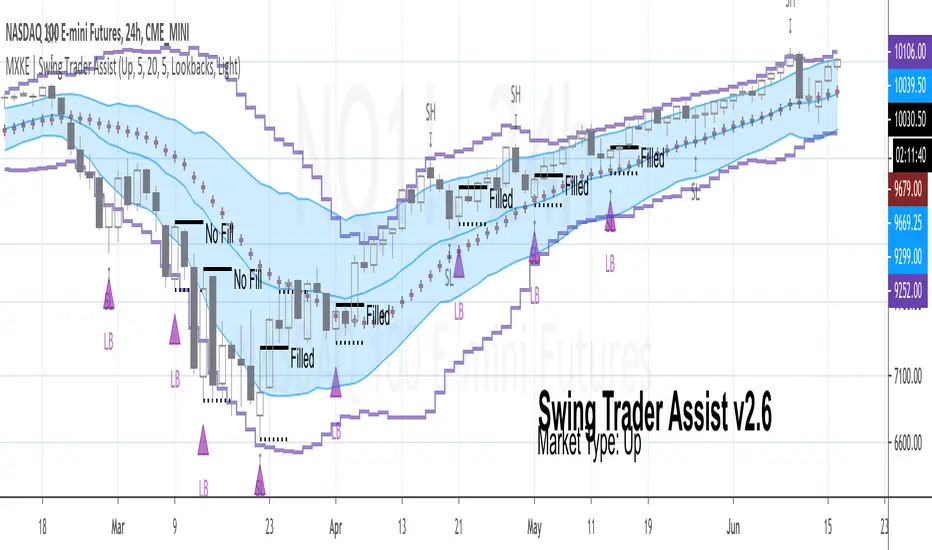
MXKE | Swing Trader AssistIntroduction
Swing Trader Assist indicator is designed to assist in the systematic identification of Hammers & Lookback signals within Uptrending markets, Stars & Lookback signals within Downtrending markets, and Mean Reversion signals within Sideways markets. The trader must first identify a strong market trend, then apply the indicator. Application of the indicator to weak trends will render equally weak signals. Application of the indicator to strong trends will render equally strong signals. Identification of strong trends is the responsibility of the individual trader and is instrumental to the successful deployment of this indicator and accompanying trading plan.
*Please comment below to request access*
*Please share with me on Twitter your usage and/or ideas for improvement so that I may improve this indicator in the future*
Market Types
Uptrend: Higher highs + Higher lows
Downtrend: Lower highs + Lower lows
Sideways: Higher highs + Lower lows (Expanding Range) or Lower highs + Higher lows (Narrowing Range)
Position Sizing
1R = .25%-2% of total nominal capital dependent upon timeframe and risk appetite
Order Types
Entry: Buy Stop 1 tick above High of “Up” Signal Bars; Sell Stop 1 tick below Low of “Down” Signal Bars
Stop: Bar Close <= 1 tick below Low of “Up” Signal Bar; Bar Close >= 1 tick above High of “Down” Signal Bar
Profit Target: 1.5R distance from “Up” or “Down” fill level with the option to trail stop on each new swing high/low; Bollinger Band Midline minimum 1.5R distance from “Sideways” fill level with option to trail stop on continuation to the opposite end of the range (opposite Bollinger Band)
Trading Plan
❑ Market Type is clearly identifiable as Up, Down or Sideways
❑ Swing Trader Assist indicator is set to the corresponding Market Type: Up, Down or Sideways
❑ Position size is no more than .25%-2% of total nominal capital (based on distance from Signal Bar fill level to Signal Bar stop level as 1R)
❑ Distance from Signal Bar fill level to potential Profit Target is minimum 1.5R
❑ On Hammer or Star fill: close position into trend extension at 1.5R+ or adjust trailing stop on each new swing high/low
❑ On Mean Reversion fill: close position at midline or adjust trailing stop on each continuation to opposite end of range
Usage Notes
The indicator will display developing signals intrabar and it is therefore suggested to wait until bar close to act on any signals. “Autodetect” setting under “Market Type” is currently in beta mode. While it is designed to reveal only relevant signals within strong trends based on a series of EMAs, this setting has not been extensively tested. Use with caution.
The indicator is not meant to be a mechanical trading system. It is designed to assist the trader in objectively and systematically identifying signal bars during the execution of the below swing trading plan. It is up to the trader to determine if overall price action warrants acting upon the signal bars or not.
Case Studies
Advanced Institucional Trading IndicatorThe Advanced Institutional Trading Indicator is a comprehensive technical analysis tool that combines four institutional trading concepts to identify where large market participants hunt liquidity, establish positions, and create supply/demand imbalances. The indicator integrates pivot-based reversal signals, liquidity sweep detection, volumetric order blocks, and equal highs/lows identification into a unified framework for analyzing institutional footprints in the market.
What It Detects
Pivot-Based Reversal Signals: Swing highs/lows marking potential trend reversals
Liquidity Sweeps: False breakouts indicating institutional stop-hunting
Volumetric Order Blocks: Supply/demand zones with buying vs selling pressure ratios
Equal Highs/Lows (EQH/EQL): Liquidity pools where stops cluster
In Practice
Traders can watch for equal highs/lows near order blocks, wait for sweeps of these levels as confirmation of liquidity capture, then look for reversal signals to time entries with the expectation that institutions have now positioned themselves and the true directional move can begin.
Logic used
Pivots: Standard functions with configurable periods, signals when swing type alternates
Sweeps: Detects brief violations of swing levels with cooldown filter
Order Blocks: Three-candle volume split into buying/selling pressure, filtered by ATR
Equal Levels: Compares consecutive pivots within ATR-based threshold
Visual representation
Reversal Signals: Green "Buy-point"/red "Sell-point" labels.
Sweeps: Dashed lines with "Sweep" text and swing markers.
Order Blocks: Colored boxes with volumetric bars and percentages.
Equal Levels: Golden lines with $ symbols.
Customization options
Pivot Length, Cooldown Period, Swing Length, Zone Count (1/3/5/10), ATR Multiplier, Threshold, customizable colors and styles.
Recommendations for use: Lower timeframes use smaller parameters (5-15 pivot, 20-35 swing). Higher timeframes use larger (20-50 pivot, 50-100 swing). Adjust for volatility.
Originality and value
While this indicator utilizes established concepts from institutional trading methodology (particularly Smart Money Concepts and ICT principles), its value proposition includes:
- Integration: Combines four complementary analysis tools into a single cohesive framework rather than requiring multiple separate indicators
- Volumetric Enhancement: Adds quantitative volume analysis to order blocks, showing not just where institutions positioned but how much buying vs selling pressure existed
- Automated Zone Management: Intelligently combines overlapping order blocks to reduce visual noise while preserving essential information
- Intelligent Filtering: Uses ATR-based thresholds for equal highs/lows and maximum order block size, adapting to market volatility
- Coordinated Signaling: All components reference similar swing detection logic, creating alignment between different institutional footprint indicators
Disclaimer
This indicator is a technical analysis tool and does not constitute financial advice.
/////Descripcion en español/////
El Advanced Institutional Trading Indicator combina cuatro conceptos institucionales—reversiones por pivotes, barridos de liquidez, bloques volumétricos y niveles iguales—para identificar dónde grandes participantes cazan liquidez y establecen posiciones.
Qué detecta
1. Reversiones por Pivotes: Máximos/mínimos marcando cambios de tendencia
2. Barridos de Liquidez: Falsas roturas indicando caza de stops institucional
3. Bloques Volumétricos: Zonas oferta/demanda con ratios presión compradora/vendedora
4. Niveles Iguales (EQH/EQL): Pools de liquidez donde se agrupan stops
Cómo usarlo
Observar niveles iguales cerca de bloques, esperar barridos como confirmación de captura de liquidez, entrar con señales de reversión cuando instituciones se han posicionado.
Lógica utilizada
- Pivotes: Funciones estándar configurables, señaliza cuando alternan
- Barridos: Detecta violaciones breves con filtro de enfriamiento
- Bloques: Volumen de tres velas dividido en presión compradora/vendedora, filtrado por ATR
- Niveles Iguales: Compara pivotes consecutivos dentro de umbral ATR
Representación visual
Señales: Etiquetas "Buy/Sell-point" verdes/rojas. Barridos: Líneas punteadas con "Sweep" y marcadores swing. Bloques: Cajas con barras volumétricas y porcentajes. Niveles: Líneas doradas con símbolo $.
Configuraciones clave
Pivot Length, Cooldown Period, Swing Length, Zone Count (1/3/5/10), ATR Multiplier, Threshold, colores y estilos personalizables.
Consejos: Marcos menores usan parámetros pequeños (5-15 pivot, 20-35 swing). Marcos mayores usan grandes (20-50 pivot, 50-100 swing). Ajustar según volatilidad.
Originalidad
Integra cuatro herramientas en un marco. Añade análisis volumétrico a bloques. Combina automáticamente zonas superpuestas. Usa filtrado adaptativo basado en ATR. Alinea componentes con lógica unificada basada en Smart Money/ICT.
Descargo
Herramienta de análisis técnico, no asesoramiento financiero.

ICT Confirmed FVG Indicator ICT FVG Indicator (Confirmed by Swings)
Summary
This indicator is designed to identify high-probability Fair Value Gaps (FVGs) by confirming them with market structure. It filters out random imbalances and only highlights the FVGs that are created at the same time as a confirmed ICT Swing High or Swing Low.
The core principle is to connect price imbalances directly to significant shifts in market structure, providing a cleaner and more powerful signal.
What It Does
Identifies Swing Points: Automatically detects and draws confirmed swing highs (resistance) and swing lows (support) on your chart based on the settings you choose.
Finds Fair Value Gaps: It scans the chart for the classic 3-candle FVG pattern (also known as a BISI or SIBI).
Confirms FVGs with Swings: This is the most important feature. The indicator will only draw an FVG box if one of the three candles that created the FVG is also a confirmed swing point. This ensures you are only seeing imbalances that are directly related to a break in market structure.
Invalidates Old FVGs: To keep the chart clean, the indicator will automatically remove an FVG box after the price has fully passed through it a certain number of times (customizable in the settings).
Settings Explained
ICT Swings Settings
Left/Right Strength: Controls the sensitivity of the swing detection. Higher numbers require a more significant, obvious swing point to be confirmed. Lower numbers will identify more minor swings.
Max Swing Lines: Sets the maximum number of swing high and swing low lines to display on the chart at one time.
Swing High/Low Color: Customize the color of the swing point lines.
FVG Settings
Show Bullish/Bearish FVG: Use these checkboxes to turn the bullish (green) or bearish (red) FVG boxes on or off.
Bullish/Bearish FVG Color: Customize the color of the FVG boxes.
FVG Invalidation Threshold: This sets how many times the price can fully close on the other side of an FVG before the box is automatically removed.
Max Active FVGs to Show: Sets the maximum number of FVG boxes to keep on the chart to prevent clutter.
Key Features
High-Probability Signals: Filters out noise by focusing only on FVGs that are confirmed by a shift in market structure.
Clean Visuals: Automatically draws and removes swing lines and FVG boxes to keep your chart uncluttered.
Fully Customizable: Adjust the sensitivity of the swing detection and the appearance of the FVGs to fit your trading style.
Pure ICT Concepts: Built strictly on the principles of Inner Circle Trader for a method-consistent analysis.

Swing Failure Pattern (SFP) DetectorDescription
The Swing Failure Pattern (SFP) Detector is a powerful tool designed to help traders identify potential liquidity grabs and reversal zones using local and higher timeframe (HTF) swing points.
🧠 What It Does
This indicator detects Swing Failure Patterns—a price action concept where price breaks a previous swing high/low but closes back within range, suggesting a failed breakout and potential reversal. It highlights both local SFPs and HTF SFPs for added confluence.
⚙️ Core Logic
Swing Detection: Uses pivot highs/lows over a configurable length or an optional dynamic length based on ATR volatility.
SFP Criteria:
Bearish SFP: High exceeds last swing high, but candle closes below that swing level.
Bullish SFP: Low undercuts last swing low, but candle closes above that swing level.
HTF Support: Detects higher timeframe pivots using request.security() and overlays HTF SFPs on the current chart.
Visual Aids: SFP labels and optional background highlights are drawn when a valid pattern is detected. Dashed horizontal lines track the last swing points used in the logic.
Alerts: Four alert conditions are provided to notify users of local and HTF SFPs.
📌 How To Use It
Apply this indicator to any chart and timeframe.
Use dynamic length mode for adaptive responsiveness in volatile or low-volume environments.
Watch for SFPs at known liquidity zones (e.g., support/resistance, OB/FVG zones).
Use HTF SFPs as confirmation for higher conviction entries or exits.
🔒 Closed Source Justification
While the SFP concept is known, this script introduces a dual-frame detection engine that synchronizes pivot points across timeframes, applies volatility-adjusted swing detection, and includes a memory-efficient rendering logic to maintain responsiveness—even on dense charts. These enhancements provide practical trading edge and execution confidence that go beyond standard open-source implementations.
📈 Best Use Cases
Liquidity sweep confirmations
Smart Money Concept (SMC) trading
HTF/MTF alignment strategies
Reversal entries and scalp setups
🛠️ Inputs
Swing Length for Current TF: Set the fixed lookback period for local swings.
Use Dynamic Swing Length (ATR-Based): Enable auto-adjusting lookback using volatility.
Higher Timeframe for SFP Overlay: Select your HTF (e.g., D for daily).
Swing Length for HTF: Set HTF pivot detection sensitivity.
Highlight Background on SFP: Toggle background color highlighting on detection.
Disclaimer
This tool is intended for educational and informational purposes only. Trading involves risk, and past performance does not guarantee future results. Always do your own research and consult a financial advisor if necessary.

ICT Turtle Soup (Liquidity Reversal)ICT Turtle Soup — Liquidity Reversal Detection
Classic Liquidity Trap Reversal Strategy for Smart Money Traders
This indicator implements the ICT Turtle Soup concept — a classic liquidity-based reversal pattern — which occurs when price runs above or below a recent swing level to grab liquidity, then sharply reverses. This pattern is commonly used in Smart Money Concepts (SMC) and Inner Circle Trader (ICT) strategies to anticipate false breakouts and high-probability reversals.
🔍 What This Script Does:
Identifies Swing Highs & Lows
Detects recent swing highs and lows using a customizable lookback period.
Tracks Liquidity Grabs
A bearish Turtle Soup setup is triggered when price breaks above a recent swing high but closes back below it.
A bullish Turtle Soup setup is triggered when price breaks below a recent swing low but closes back above it.
These conditions often signal liquidity traps, where price sweeps resting orders before reversing.
Plots Signals Directly on the Chart
Turtle Soup setups are marked with 🐢🔻 (bearish) and 🐢🔺 (bullish) labels.
Optional full-text labels can also be displayed for clarity and journaling.
Includes Alert Conditions
Alerts can be enabled to notify you of bullish or bearish Turtle Soup reversals in real-time.
⚙️ Customization Features:
Adjustable swing lookback period
Enable/disable Turtle Soup labels
Set label font size
Choose your preferred bullish/bearish signal colors
💡 How to Use:
Add this script to your chart (ideally on intraday timeframes such as 5m–15m).
Wait for a Turtle Soup signal near a key swing high/low or liquidity zone.
Combine with other confirmation tools (e.g., FVGs, Order Blocks, OTE) for stronger setups.
Use alerts to stay ahead of fast-moving reversals.
🧠 Why It Works:
Turtle Soup setups are rooted in liquidity theory — they exploit the market’s tendency to sweep obvious swing levels before reversing. These moves often trap retail traders and mark the beginning of Smart Money entries.
🔗 Best Used With:
Maximize the edge by combining this with other SMC tools:
✅ First FVG — Opening Range Fair Value Gap Detector
✅ ICT SMC Liquidity Grabs + OB + Fibonacci OTE Levels
✅ Liquidity Levels — Smart Swing Lows
Together, they create a complete ecosystem for identifying, confirming, and executing liquidity-driven trade setups with precision.

FVG, Swing, Target, D/W/M High Low Detector Basic by Trader Riaz"FVG, Swing, Target, D/W/M High Low Detector Basic by Trader Riaz " is a powerful TradingView indicator designed to enhance your trading strategy by identifying key market structures and levels. This all-in-one tool detects Fair Value Gaps (FVGs), Swing Highs/Lows, and previous Day, Previous Week, and Previous Month Highs/Lows, helping traders make informed decisions with ease.
Key Features:
Bullish & Bearish FVG Detection: Highlights Fair Value Gaps with customizable colors, labels, and extension options.
Swing Highs & Lows: Automatically detects and marks Swing Highs and Lows with adjustable display settings and extensions.
Next Target Levels: Identifies potential price targets based on market direction (rising or falling).
Daily, Weekly, and Monthly High/Low Levels: Displays previous day, week, and month highs/lows with customizable colors.
Customizable Settings: Fully adjustable inputs for colors, number of levels to display, and extension periods.
Clean Visuals: Intuitive and non-intrusive design with dashed lines, labels, and tooltips for better chart readability.
This indicator is ideal for traders looking to identify key price levels, improve market structure analysis, and enhance their trading strategies.
Happy Trading,
Trader Riaz

Fibonacci Optimal Entry Zone [OTE] (Zeiierman)█ Overview
Fibonacci Optimal Entry Zone (Zeiierman) is a high-precision market structure tool designed to help traders identify ideal entry zones during trending markets. Built on the principles of Smart Money Concepts (SMC) and Fibonacci retracements, this indicator highlights key areas where price is most likely to react — specifically within the "Golden Zone" (between the 50% and 61.8% retracement).
It tracks structural pivot shifts (CHoCH) and dynamically adjusts Fibonacci levels based on real-time swing tracking. Whether you're trading breakouts, pullbacks, or optimal entries, this tool brings unparalleled clarity to structure-based strategies.
Ideal for traders who rely on confluence, this indicator visually synchronizes swing highs/lows, market structure shifts, Fibonacci retracement levels, and trend alignment — all without clutter or lag.
⚪ The Structural Assumption
Price moves in waves, but key retracements often lead to continuation or reversal — especially when aligned with structure breaks and trend shifts.
The Optimal Entry Zone captures this behavior by anchoring Fibonacci levels between recent swing extremes. The most powerful area — the Golden Zone — marks where institutional re-entry is likely, providing traders with a sniper-like roadmap to structure-based entries.
█ How It Works
⚪ Structure Tracking Engine
At its core, the indicator detects pivots and classifies trend direction:
Structure Period – Determines the depth of pivots used to detect swing highs/lows.
CHoCH – Break of structure logic identifies where the trend shifts or continues, marked visually on the chart.
Bullish & Bearish Modes – Independently toggle uptrend and downtrend detection and styling.
⚪ Fibonacci Engine
Upon each confirmed structural shift, Fibonacci retracement levels are projected between swing extremes:
Custom Levels – Choose which retracements (0.50, 0.618, etc.) are shown.
Real-Time Adjustments – When "Swing Tracker" is enabled, levels and labels update dynamically as price forms new swings.
Example:
If you disable the Swing Tracker, the Golden Level is calculated using the most recent confirmed swing high and low.
If you enable the Swing Tracker, the Golden Level is calculated from the latest swing high or low, making it more adaptive as the trend evolves in real time.
█ How to Use
⚪ Structure-Based Entry
Wait for CHoCH events and use the resulting Fibonacci projection to identify entry points. Enter trades as price taps into the Golden Zone, especially when confluence forms with swing structure or order blocks.
⚪ Real-Time Reaction Tracking
Enable Swing Tracker to keep the tool live — constantly updating zones as price shifts. This is especially useful for scalpers or intraday traders who rely on fresh swing zones.
█ Settings
Structure Period – Number of bars used to define swing pivots. Larger values = stronger structure.
Swing Tracker – Auto-updates fib levels as new highs/lows form.
Show Previous Levels – Keep older fib zones on chart or reset with each structure shift.
-----------------
Disclaimer
The content provided in my scripts, indicators, ideas, algorithms, and systems is for educational and informational purposes only. It does not constitute financial advice, investment recommendations, or a solicitation to buy or sell any financial instruments. I will not accept liability for any loss or damage, including without limitation any loss of profit, which may arise directly or indirectly from the use of or reliance on such information.
All investments involve risk, and the past performance of a security, industry, sector, market, financial product, trading strategy, backtest, or individual's trading does not guarantee future results or returns. Investors are fully responsible for any investment decisions they make. Such decisions should be based solely on an evaluation of their financial circumstances, investment objectives, risk tolerance, and liquidity needs.

BullDozz Fibo ZigZagFibo ZigZag - Advanced Fibonacci Retracement Tool 🔥
📌 Overview
The Fibo ZigZag indicator is a powerful tool for trend structure analysis using the ZigZag pattern and Fibonacci retracement levels. It automatically identifies swing highs & lows, draws ZigZag lines, and overlays Fibonacci levels with price labels at the right end for better readability.
This indicator is designed for traders who use price action, trend reversal strategies, and support/resistance analysis.
🛠 Features
✅ Automatic ZigZag detection with customizable depth, deviation, and backstep
✅ Fibonacci retracement levels (0%, 23.6%, 38.2%, 50%, 61.8%, 100%, 161.8%, 261.8%, 423.6%)
✅ Price labels at Fibonacci levels (placed at the right end of the levels)
✅ Alerts for new swing highs & lows
✅ Customizable line colors, text colors, and label sizes
✅ Lightweight and optimized for fast performance
📊 How It Works
1️⃣ The script detects ZigZag structure points based on price swings
2️⃣ It connects recent highs & lows with a ZigZag line
3️⃣ Fibonacci retracement levels are calculated and drawn between the last two significant swing points
4️⃣ Each Fibo level is labeled with its percentage & exact price, placed at the right end for clarity
5️⃣ Alerts trigger automatically when a new swing high or low is detected
⚙ Customization Options
🔹 ZigZag Settings: Adjust Depth, Deviation, BackStep, and Leg length
🔹 Fibonacci Levels: Modify line colors, label text colors, and visibility
🔹 Alerts: Enable/disable trend change alerts
📈 Best Use Cases
🚀 Identifying Trend Reversals – Detect key turning points using Fibonacci levels
📉 Support & Resistance Trading – Use retracement levels as entry/exit points
📊 Swing Trading & Scalping – Combine ZigZag with price action for effective strategies
🔔 Alert-Based Trading – Get notified when new swing highs/lows form
🚀 How to Use
📌 Add the indicator to your chart
📌 Adjust the settings to match your trading strategy
📌 Use the Fibonacci levels & ZigZag lines to analyze trend direction & key price zones
📌 Wait for alerts or manually enter trades based on price reaction to Fibo levels
📢 Final Thoughts
The Fibo ZigZag is an essential tool for traders who rely on price action, trend reversals, and Fibonacci levels. Whether you're a beginner or a pro, this indicator helps you spot high-probability trading opportunities with ease.
⚡ Try it now & enhance your trading strategy! 🚀
💬 Let us know your feedback & suggestions in the comments! Happy trading! 📊🔥

Swing Points AlertSwing Points Alert with Adjustable Delay
Description:
This script is designed to detect and alert traders about significant swing highs and lows on the chart. The script is equipped with customizable pivot detection settings and an innovative **Alert Delay** mechanism, allowing users to fine-tune their notifications to reduce noise and focus on key price movements.
Key Features:
1. **Swing High/Low Detection:**
- Identifies swing highs and lows based on user-defined pivot length.
- Visualizes these points with customizable labels for clarity.
2. **Customizable Alerts:**
- Enables real-time alerts for swing highs and lows.
- Users can adjust the delay for alerts to avoid false signals during volatile periods.
3. **Dynamic Label Management:**
- Automatically manages the number of displayed swing point labels.
- Removes crossed or outdated labels based on user preferences.
4. **Flexible Label Styling:**
- Provides multiple label styles (e.g., triangles, circles, arrows) and color customization for both swing highs and lows.
How the Alert Delay Works:
The **Alert Delay** helps filter signals by introducing a delay before triggering alerts. The delay is calculated as follows:
**Alert Delay (%) x Time Frame = Alert Delay in Time Frame Units**
For example:
- If the **Alert Delay** is set to 30% and the timeframe is **15 minutes**, the alert will be triggered after a delay of:
\
This ensures the alert is triggered only if the swing high/low condition remains valid for at least 4.5 minutes.
Important Notes:
1. **Timeframe Sensitivity:**
- This script is optimized for use across various timeframes, but users must adjust the **Alert Delay** percentage to match their trading style and timeframe.
- For example, higher timeframes may require lower delay percentages for timely alerts.
2. **Customization Options:**
- Easily customize pivot detection length, alert delay, label styles, and colors to suit your preferences.
3. **Support:**
- If you encounter any challenges or need help optimizing the script for your specific trading scenario, feel free to reach out for assistance.
Trade Entry Detector, Wick to Body Ratio Trade Entry Detector: Wick-to-Body Ratio Strategy with Bollinger Bands
Overview
The Trade Entry Detector is a custom strategy for TradingView that leverages the Bollinger Bands and a unique wick-to-body ratio approach to capture precise entry opportunities. This indicator is designed for traders who want to pinpoint high-probability reversal points when price interacts with Bollinger Bands, all while offering flexible entry fill options.
The strategy performs primary analysis on the daily time frame, regardless of your current chart setting, allowing you to view daily Bollinger Band levels and entry signals even on lower time frames. This approach is suitable for swing traders and short-term traders looking to align intraday moves with higher time frame signals.
How the Strategy Works
1. Bollinger Band Analysis on the Daily Time Frame
Bollinger Bands are calculated using a 20-period simple moving average (SMA) and a standard deviation multiplier (default is 2). These bands dynamically expand and contract based on market volatility, making them ideal for identifying overbought and oversold conditions:
* Upper Band: Indicates potential overbought levels.
* Lower Band: Indicates potential oversold levels.
2. Wick-to-Body Ratio Condition
This strategy places significant emphasis on candle wicks relative to the candle body. Here’s why:
* A large upper wick relative to the body signals potential selling pressure after testing the upper Bollinger Band.
* A large lower wick relative to the body indicates buying support after testing the lower Bollinger Band.
* Ratio Threshold: You can set a minimum wick-to-body ratio (default is 1.0), meaning that the wick must be at least equal in size to the body. This ensures only candles with significant reversals are considered for entry.
3. Flexible Entry Timing
To adapt to various trading styles, the indicator allows you to choose the entry fill timing:
* Daily Close: Enter at the close of the daily candle.
* Daily Open: Enter at the open of the following daily candle.
* HOD (High of Day): Set entry at the daily high, for those who want confirmation of upward momentum.
* LOD (Low of Day): Set entry at the daily low, ideal for confirming downward movement.
4. Position Sizing and Risk Management
The strategy calculates position size based on a fixed risk percentage of your account balance (default is 1%). This approach dynamically adjusts position sizes based on stop-loss distance:
* Stop Loss: Placed at the nearest swing high (for shorts) or swing low (for longs).
* Take Profit: Exits are triggered when the price reaches the opposite Bollinger Band.
5. Order Expiration
Each pending order (long or short) expires after two days if unfilled, allowing for new setups on subsequent candles if conditions are met again.
Using the Trade Entry Detector
Step-by-Step Guide
1. Set the Primary Time Frame
The core calculations run on the daily time frame, but the strategy can be applied to intraday charts (e.g., 65-minute or 15-minute) for deeper insights.
2. Adjust Bollinger Band Settings
* Length: Default is 20, which determines the period for calculating the moving average.
* Standard Deviation Multiplier: Default is 2.0, which sets the width of the bands. Adjusting this can help you capture broader or tighter volatility ranges.
3. Define the Wick-to-Body Ratio
Set the minimum ratio between wick and body (default 1.0). Higher values filter out candles with less wick-to-body contrast, focusing on stronger rejection moves.
4. Choose Entry Fill Timing
Select your preferred fill condition:
* Daily Close: Confirms the trade at the end of the daily session.
* Daily Open: Executes the entry at the open of the next day.
* HOD/LOD: Uses the daily high or low as an additional confirmation for upward or downward moves.
5. Position Sizing and Risk Management
* Set your account balance and risk percentage. The strategy automatically calculates position sizes based on the stop distance to manage risk efficiently.
* Stop Loss and Take Profit points are automatically set based on swing highs/lows and opposing Bollinger Bands, respectively.
Practical Example
Let’s say SPY (S&P 500 ETF) tests the lower Bollinger Band on the daily time frame, with a lower wick that is twice the size of the body (meeting the 1.0 ratio threshold). Here’s how the strategy might proceed:
1. Signal: The lower wick on SPY suggests buying interest at the lower Bollinger Band.
2. Entry Fill Timing: If you’ve selected "Daily Open," the entry order will be placed at the next day's open price.
3. Stop Loss: Positioned at the nearest daily swing low to minimize risk.
4. Take Profit: If SPY price moves up and reaches the upper Bollinger Band, the position is automatically closed.
Indicator Features and Benefits
* Multi-Time Frame Compatibility: Perform daily analysis while tracking signals on any intraday chart.
* Automatic Position Sizing: Tailor risk per trade based on account balance and desired risk percentage.
* Flexible Entry Options: Choose from close, open, HOD, or LOD for optimal timing.
* Effective Trend Reversal Identification: Uses wick-to-body ratio and Bollinger Band interaction to pinpoint potential reversals.
* Dynamic Visualization: Bollinger Bands are displayed on your chosen time frame, allowing seamless intraday tracking.
Summary
The Trade Entry Detector provides a unique, data-driven way to spot reversal points with customizable entry options. By combining Bollinger Bands with wick-to-body ratio conditions, it identifies potential trade setups where price has tested extremes and shown reversal signals. With its flexible entry timing, risk management features, and multi-time frame compatibility, this indicator is ideal for traders looking to blend daily market context with shorter-term execution.
Tips for Usage:
* For swing trading, consider the Daily Open or Close entry options.
* For momentum entries, HOD or LOD may offer better alignment with the direction of the wick.
* Backtest on different assets to find optimal Bollinger Band and wick-to-body settings for your market.
Use this indicator to enhance your understanding of price behavior at key levels and improve the precision of your entry points. Happy trading!

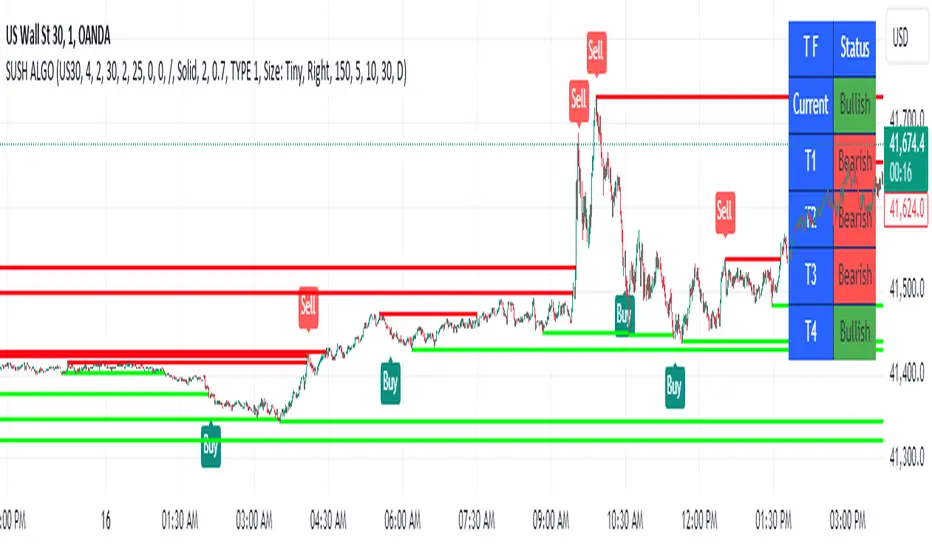
SUSH ALGOStep-by-Step Guide for Trading Using the Script
1. Asset Selection
When applying this script, the first thing to do is select your desired asset to trade.
You can select from the following assets within the script:
Scalping
Gold
USD/JPY
EUR/USD
EUR/JPY
BTC/USD
NIFTY 50
The parameters for the strategy (e.g., q, r, s, and ADX Threshold) will adjust automatically based on your selected asset. If you want to use custom parameters, turn on the Use Manual Settings option.
2. Adjust Manual Settings (Optional)
Use Manual Settings: Toggle this if you want to input your custom values for the strategy parameters.
Manual q: Affects swing period calculation.
Manual r: Affects the smoothing in the calculation of the oscillator.
Manual s: Affects the smoothing period of the main line of the oscillator.
Manual Signal Length: Length of the signal line for generating buy/sell signals.
Manual ADX Threshold: Adjusts the ADX value to filter trades based on trend strength.
3. Reading the SMI (Stochastic Momentum Index) Oscillator
SMI: This indicator oscillates between overbought and oversold levels, signaling potential entry and exit points.
Overbought Level: +30
Oversold Level: -30
The signal line is calculated based on the smoothed SMI value.
A crossover above the signal line in the oversold region (< -30) signals a buy.
A crossunder below the signal line in the overbought region (> +30) signals a sell.
4. Trade Signal Alerts
Buy Signal Alert: Triggered when the SMI crosses over the signal line in the oversold zone, and ADX exceeds the threshold.
Sell Signal Alert: Triggered when the SMI crosses under the signal line in the overbought zone, and ADX exceeds the threshold.
5. Entry, Stop Loss, and Target Levels
Entry Line: The script will plot an entry line at the close price when a buy or sell signal is triggered.
Stop Loss: A stop loss will be set based on the lowest low (for buy signals) or highest high (for sell signals) of the previous candles.
Take Profit Targets:
Target 1 (TP1): 3 times the size of the entry candle.
Target 2 (TP2): 6 times the size of the entry candle.
Target 3 (TP3): 10 times the size of the entry candle.
Make sure the Show Entry, Show Stop Loss, and Show Targets toggles are enabled to visualize these lines on the chart.
6. Monitoring the ADX (Average Directional Index)
The ADX value filters weak signals, ensuring that you trade only in trending markets.
If ADX > adxThreshold, the trend is strong, and the buy or sell signal becomes valid.
If ADX < adxThreshold, the trade signals are ignored to avoid trading in sideways markets.
7. Box, Line, and Label Toggles for Swing Highs/Lows
The script allows you to visualize swing highs and lows for better market context. You can toggle the following options:
Show Boxes: Displays rectangular boxes around the swing highs and lows.
Show Swing Lines: Plots lines at swing highs and lows for visual confirmation of key price levels.
Show Labels: Adds text labels to the swing levels, indicating whether they represent a swing high or low.
8. Customize Appearance (Optional)
You can change the appearance of the boxes, lines, and labels, such as their color, width, and style (solid or dotted), from the Appearance settings.
9. Monitor Volume and Open Interest (Optional)
You can also track volume and open interest (OI) data from various exchanges like Binance and BitMEX to get additional confirmations.
Steps for Trading
1.Select your asset from the drop-down menu based on your trading preferences.
2.Adjust manual settings (optional) if you want to use your own parameters for the strategy.
3.Wait for a buy or sell signal to trigger based on the crossover of the SMI oscillator in the overbought/oversold regions.
4.Once a signal is triggered, check for the plotted entry price, stop loss, and take profit levels on your chart.
5.Monitor the ADX value to ensure that the market is trending strongly.
6.If the trade meets your criteria, enter the trade at the indicated price.
Set your stop loss and take profit orders as indicated by the script.
Key Notes
# This strategy is designed for both trending and mean-reversion markets depending on the asset and the ADX value.
# Make sure to practice proper risk management by adjusting the stop loss and position size based on your risk tolerance.
MonkeyblackmailThis script consists of several sections. test it and tell me your concerns. a lot of more works will be done
Volume Accumulation : The first part of the script checks for a new 5-minute interval and accumulates the volume of the current interval. It separates the volume into buying volume and selling volume based on whether the closing price is closer to the high or low of the bar.
Volume Normalization and Pressure Calculation : The script then normalizes the volume with a 20-period EMA, and calculates buying pressure, selling pressure, and total pressure. These calculations provide insight into the underlying demand (buying pressure) and supply (selling pressure) conditions in the market.
RSI Calculation and Overbought/Oversold Conditions : The script calculates the RSI (Relative Strength Index) and checks whether it is in an overbought (RSI > 70) or oversold (RSI < 30) state. The RSI is a momentum indicator, providing insights into the speed and change of price movements.
Volume Condition Check and Wondertrend Indicator : The script checks if the volume is high for the past five bars. If it is, it applies the Wondertrend Indicator, which uses a combination of the Parabolic SAR (Stop and Reverse) and Keltner Channel to identify potential trends in the market.
Swing High/Low and Fibonacci Retracement : The script identifies swing high and swing low points using a specified pivot length. Then, it draws Fibonacci retracement levels between these swing high and swing low points.
he monkeyblackmail script works well in the 5 minutes chart and combines several elements of technical analysis, including volume analysis, momentum indicators, trend-following indicators, volatility channels, and Fibonacci retracements. It aims to provide a comprehensive view of the market condition, highlighting key levels and potential trends in an easily understandable format. Don’t be too quick to start trading with it, first study how it work and you will blackmail the market.

One Trade Setup for LifeIndicators are refered from @TFlab and @ChartPrime and @UAlgo
***
## Indicator Overview 🚀
**One Trade Setup for Life** is a sophisticated TradingView Pine Script indicator blending Smart Money Concepts (SMC), advanced Price Action, and Liquidity Analysis. It provides signals for structural market moves, trade setups, and custom alerts. This tool is designed for **precision execution**, giving traders a comprehensive edge in diverse market conditions.
***
## Key Logic Sections & Explanation
### Smart Money Concept Logic 💸
- **Pivot Lines**: Plots SMC levels based on swing high/low pivots, customizable for wick/body detection and colored to represent bullish or bearish market structure.
- **Market Structure Detection**: Tracks changes such as BOS (Break of Structure) and CHoCH (Change of Character), using real-time breakout logic to highlight structural shifts, confirm reversal setups, and trigger accompanying alerts.
- **Engulfing & Confirmation**: Identifies engulfing candles, confirms market structure changes, and plots colored lines—with shape plots at exact highs/lows for visual clarity.
***
### Pure Price Action 📈
- **Swing Detection**: Adjustable bars for detecting swing points, making the indicator sensitive to trend reversals and continuations based on candle closes or wicks.
- **BOS/CHoCH Lines**: Plots dashed, solid, or dotted lines (user-selected) to visualize structural changes in price, adding color-coded markers for transparency.
- **Sentiment Table**: Displays an emoji-based sentiment table at the chart bottom, updating live to quickly gauge overall price action and market mood (bull, bear, neutral emoji).
***
### Supertrend Logic 🟩🟥
- **ATR-Based Trend Filter**: Implements Supertrend bands using customizable ATR length, multiplier, and increment. Options include normalization for flexibility in ranging versus trending markets.
- **Multi-Factor Signals**: Detects buy/sell crossovers and plots median/stdev areas for additional confirmation. Users can visually track Supertrend support/resistance as trade triggers.
***
### RSI & Activity Analysis 📊
- **RSI Calculation**: Provides customizable RSI length, overbought/oversold thresholds. Candle coloring flips as RSI hits extreme levels, giving immediate visual signals for exhaustion or reversals.
- **Trading Volume Proxy**: Advanced logic computes percentile rankings and plots quintile bands, triggering signal arrows when activity surges above or below key thresholds.
***
### Liquidity Sweep & Fair Value Gap Logic 💧
- **Sweep Zones**: Detects price sweeps at key resistance/support lines generated from pivots, marking with labels and enabling sweep alerts.
- **FVG & Mitigation**: Integrates Fair Value Gap (FVG) detection. The indicator can filter FVG zones by aggressiveness, classify supply/demand FVGs, and highlight where price is likely to react for entry or exit.
***
### Support, Resistance, and Swing Levels 🟦🟥
- **Multi-Period SR Lines**: Draws dynamic lines for support/resistance from high/low pivots, adjustable for length and quantity, and visually distinct using color, label, and style options.
- **Main Swing Alerts**: Tracks swing direction, assigns colors, and fires alerts only when direction changes, ensuring traders catch priority momentum shifts.
***
### Detailed Alerts System 🚨
- **Custom Alert Inputs**: Users can toggle alerts for CHoCH, BOS, liquidity structure, high-volume, FVG events, sweep zones, false breakouts, and trigger candles—ensuring critical signals are never missed.
- **On-Chart Graphics**: Circles, arrows, and emoji labels clearly mark confirmation, swings, and reversal points directly on the chart, streamlining decision-making.
***
## Example Markdown Table: Alert Features
| Alert Type | Logic/Trigger | Emoji | Visual Output |
|------------------------|--------------------------------------|-------|---------------------------|
| CHoCH (Change of Char.)| Counter-trend BOS detection | 🔄 | Colored line & arrow |
| BOS (Break of Struct.) | Trend BOS, confirming market shift | 💥 | Line/circle at high/low |
| Liquidity Sweep | Price breaks support/resistance | 💧 | Label "Sweep" + alert |
| FVG Alert | FVG zone formation by aggression | ⚡ | Box highlight + alert |
| Supertrend Trigger | Median/std crossovers | 🟩🟥 | Colored area, Buy/Sell |
***
## Customization, Emoji & Styling 🎨
- **All key inputs are grouped and tooltipped for easy setup.**
- **Charts use emojis for sentiment** and direction, visible on tables and labels.
- **Colors are user-selected** for all markers (pivot, BOS, CHoCH, FVG, SR, swing).
- **Visuals (circles/arrows)** highlight entry, exit, and alert points for instant interpretation—making the script unique and easy to use.
***
## Publication & Use 🌐
This script is covered under the Mozilla Public License 2.0. When publishing, provide the following metadata:
- **Title**: One Trade Setup for Life
- **Description**: A fusion tool combining SMC, price action, advanced liquidity analytics, and market structure detection—with a robust alert system and richly visual trading interface.
**Enjoy clear signals, custom alerts, and visually appealing chart markers—all in one package!** 🏆

TRAPPER TRENDLINES — RSIBuilds dynamic RSI trendlines by connecting the two most recent confirmed RSI swing points (highs→highs for resistance, lows→lows for support). Includes optional channel shading for the 30–70 zone, an RSI moving average, clean break alerts, and simple bullish/bearish divergence alerts versus price.
How it works
RSI pivots: A point on RSI is a swing high/low only if it is the most extreme value compared with a set number of bars on the left and the right (the Pivot Lookback).
RSI trendlines:
Resistance connects the last two confirmed RSI swing highs.
Support connects the last two confirmed RSI swing lows.
Lines can be Full Extend (update into the future) or Pivot Only.
Channel block: Optional fill of the 30–70 range for fast visual context.
Alerts:
Breaks of RSI support/resistance trendlines.
Basic bullish/bearish RSI divergences versus price pivots.
Inputs
RSI
RSI Length: Default 14 (standard).
Pivot Lookback: Bars to the left/right required to confirm an RSI swing.
Overbought / Oversold: 70 / 30 by default.
Line Extension: Full Extend or Pivot Only.
Visuals
Show RSI Moving Average / Signal Length: Optional smoothing line on RSI.
RSI/Signal colors: Customize plot colors.
Show 30–70 Channel Block: Toggle the middle-zone fill.
Tint pane background when RSI in channel: Optional subtle background when RSI is between OB/OS.
Divergences & Alerts
Enable RSI TL Break Alerts: Alert conditions for RSI line breaks.
Enable Divergence Alerts: Bullish/Bearish divergence alerts versus price.
Pairing with price for confluence/divergence
For accurate confluence and clearer divergences, align this RSI tool with your price trendline tool (for example, TRAPPER TRENDLINES — PRICE):
Set RSI Pivot Lookback equal to the Pivot Left/Right size used on price.
Example: Price uses Pivot Left = 50 and Pivot Right = 50 → set RSI Pivot Lookback = 50.
Keep RSI Length = 14 and OB/OS = 70/30 unless you have a specific edge.
Interpretation:
Confluence: Price reacts at its trendline while RSI reacts at its own line in the same direction.
Divergence: Price makes a higher high while RSI makes a lower high (bearish), or price makes a lower low while RSI makes a higher low (bullish), using matched pivot windows.
Suggested settings
Higher timeframes (4H / 1D / 1W): Pivot Lookback = 50; optional RSI MA length 14; channel block ON.
Intraday (15m / 30m / 1H): Pivot Lookback = 30; optional RSI MA length 14.
Always mirror your price pivot size to this RSI Pivot Lookback for consistent swings.
Reading the signals
RSI trendline touch/hold: Momentum reacting at structure; look for confluence with price levels.
RSI Trendline Break Up / Down: Momentum shift; consider price structure and retests.
Bullish/Bearish Divergence: Confirm only when pivots are matched and the new swing is confirmed.
Notes & limitations
Pivots require future bars to confirm by design; trendlines update as new swings confirm.
Divergence logic compares RSI pivots to price pivots with the same lookback; mismatched windows can produce false positives.
No strategy entries/exits or performance claims are provided. This is an analytical tool.
Alerts (titles/messages)
RSI: Trendline Break Up — “RSI broke falling resistance line.”
RSI: Trendline Break Down — “RSI broke rising support line.”
RSI: Bullish Divergence — “Bullish RSI divergence confirmed.”
RSI: Bearish Divergence — “Bearish RSI divergence confirmed.”
Quick start
Add the indicator to a separate pane.
Set Pivot Lookback to match your price tool’s pivot size (e.g., 50).
Optionally toggle the RSI MA and Channel Block for clarity.
Enable alerts if you want notifications on RSI line breaks and divergences.
Use with TRAPPER TRENDLINES — PRICE or any price-based trendline tool for confluence/divergence analysis.
Compliance
This script is for educational purposes only and does not constitute financial advice. Trading involves risk. Past performance does not guarantee future results. No performance claims are made.

Hassi XAUUSD Advanced FVG EMA/BOS/RSI/Volume + Session FilterWhat it does :
This strategy automates a popular ICT-style idea on XAUUSD (Gold): trade only when price taps back into a Fair Value Gap (FVG), but filter entries with trend, structure, momentum, volume, and session rules. It manages risk with fixed TP/SL (points) and shows a compact backtest panel on chart.
Core Logic
1) Market Structure (BOS)
Detects recent swing highs/lows and flags a Break of Structure:
BOS Up when price breaks the latest swing high.
BOS Down when price breaks the latest swing low.
2) FVG Detection (3-candle)
Bullish FVG when low > high and low > high .
Bearish FVG when high < low and high < low .
The most recent qualifying gap is drawn as a shaded box (optional).
3) Bias & Filters
Trend Bias: price vs EMA (default 200). Longs only above EMA; shorts only below.
Momentum: optional RSI filter (default 14); avoid longs in OB & shorts in OS.
Volume: optional filter requiring current volume > SMA(20) × multiplier.
Sessions: optional London / New York (PKT) time windows.
Entries & Exits
Long Entry (all must be true)
Above EMA, RSI bullish, volume ok, session ok, BOS Up.
A recent Bullish FVG exists (within N bars).
Price taps back into the FVG (low ≤ top & close > bottom) with a bullish candle.
Short Entry (mirror)
Below EMA, RSI bearish, volume ok, session ok, BOS Down.
A recent Bearish FVG exists (within N bars).
Price taps (high ≥ bottom & close < top) with a bearish candle.
Risk / R:R
Exits use fixed points on XAUUSD (default TP 100, SL 50).
On many gold feeds 1.0 = 10 points; inputs convert to price automatically.
“One-trade-at-a-time”: a new signal won’t fire until the previous position is flat.
Chart Labels
On entry, the script plots BUY/SELL plus fixed TP/SL lines & labels anchored to the entry bar (they don’t drift with price).
Visuals & Tools
EMA line (green/red by bias).
Swing points (tiny triangles) to see structure.
FVG boxes (green/red, optional).
Session shading (subtle blue overlay).
Stats Panel (top-right):
Total Trades, TP Hits, SL Hits, Win Rate, Profit Factor, Net P&L.
Inputs (quick guide)
EMA Length (default 200)
Swing Lookback for BOS (default 5)
FVG Box Length (how far the zone extends to the right)
TP / SL (points) for XAUUSD + display Risk:Reward
Sessions (PKT): London & New York windows + toggle
Filters: Volume (multiplier), RSI (length, OB/OS)
Visibility: show/hide FVG boxes & TP/SL drawings
Alerts
Buy Signal / Sell Signal on valid entries
Position Opened / Position Closed notifications
Best Practices & Notes
Designed for XAUUSD 15-minute. You can test other timeframes, but retune TP/SL points and filters accordingly.
Broker ticks differ: if your symbol steps are not 0.1, adjust TP/SL points.
Use with a HTF confluence (e.g., D1/4H bias, key S/R, news awareness).
Backtests are approximations; real results vary with spreads, slippage, and execution.
Disclaimer: This tool is for educational purposes. It is not financial advice. Always test before using on live capital.

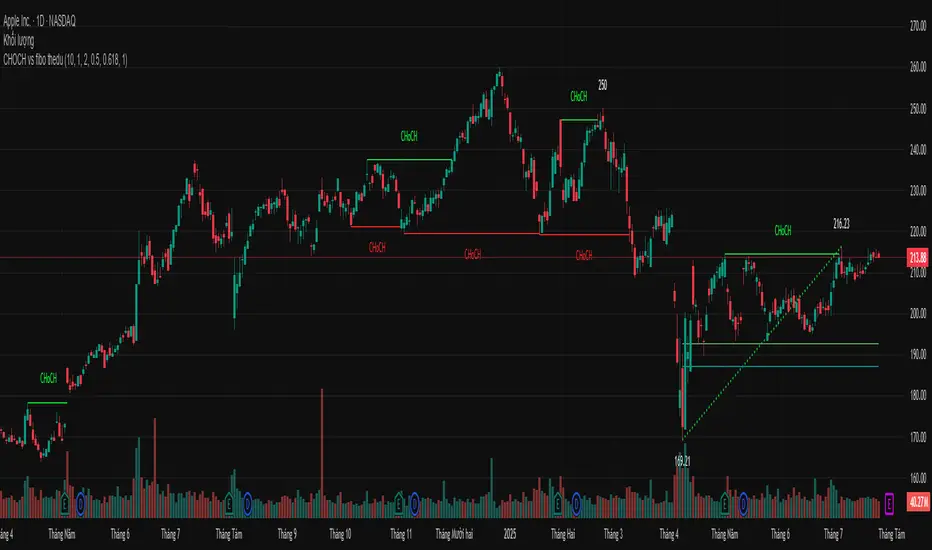
CHOCH vs fibo thedu// ~~ Tooltips {
string t1 = "Defines how many bars back the pivot high/low is calculated from. Higher values detect stronger swing structures."
string t2 = "Enable to display bullish market structure (higher highs and higher lows)."
string t3 = "Select the color of bullish structure lines and labels."
string t4 = "Enable to display bearish market structure (lower highs and lower lows)."
string t5 = "Select the color of bearish structure lines and labels."
string t6 = "Width of the Break of Structure (BoS) line to make it more visible on the chart."
string t7 = "Enable automatic tracking of recent swing points. Adjusts Fibonacci levels in real-time as new swings form."
string t8 = "Enable to draw dotted lines connecting swing highs/lows (the swing trend line)."
string t9 = "Adjust the thickness of the swing trend line. Useful for emphasizing or de-emphasizing swing connections."
string t10 = "Enable to show price labels at swing highs/lows. Helps visualize turning points with exact prices."
string t11 = "Show previous (historical) Fibonacci levels instead of clearing them each time new structure forms."
string t12 = "Enable to keep Fibonacci levels extended forward to the current bar. Helps maintain context while trading."
string t13 = "Enable to fill the Golden Zone (typically 0.5 - 0.618 retracement) between the first two Fibonacci levels."
string t14 = "Select the fill color for the Golden Zone. Softer transparency is ideal to avoid chart clutter."
string t15 = "Enable or disable individual Fibonacci levels. Checked levels will be drawn on the chart."
string t16 = "Customize the specific Fibonacci retracement level value. 0.50 is midpoint, 0.618 is golden ratio."
string t17 = "Choose the color for each Fibonacci level line. Use contrasting colors for clarity."
string t18 = "Sets the thickness of the Fibonacci level lines. Increase for better visibility."
string t19 = "Enable alerts for bullish CHOCH signals."
string t20 = "Enable alerts for bearish CHOCH signals."
string t21 = "Enable alerts when price touches Fibonacci levels."
string t22 = "Enable alerts when price enters the Golden Zone."
Pure Price Action Momentum OscillatorComplete Trading Guide: Pure Price Action Momentum Oscillator
1. Script Overview
What It Does
Tracks real-time momentum strength (bullish/bearish acceleration)
Identifies dynamic support/resistance zones for momentum (not price)
Alerts when momentum breaks or holds critical levels
What It Doesn’t Do
Predict long-term trends (use with trend indicators)
Replace price-based S/R levels (use alongside them)
Work well in extreme choppiness (adjust settings or avoid)
2. Key Features & Components
Feature Purpose Visual Cue
Momentum Histogram Shows strength/direction of price acceleration Color-coded bars
Zero Line Bullish/bearish momentum baseline Gray line (0 level)
Support Zone (Blue) Momentum floor where bounces happen Blue horizontal line
Resistance Zone (Orange) Momentum ceiling where pullbacks start Orange horizontal line
Stateful Alerts Persistent signals until conditions reverse Green/Red labels
3. Best Timeframes & Markets
Market Recommended Timeframe Notes
Stocks 5min - 1H Works best with high liquidity
Forex 15min - 4H Avoid during major news spikes
Crypto 1H - 4H Use with volume confirmation
Futures 5min - 1H Ideal for intraday momentum trades
❌ Avoid: Tick charts, <1min (too noisy), >Daily (loses sensitivity).
4. Confirmation Tools (Must-Use Combos)
A. Trend Confirmation
200 EMA (Price Chart)
Only trade longs if price > 200 EMA + momentum supports
Only trade shorts if price < 200 EMA + momentum confirms
ADX (14)
Use when ADX > 25 (strong trend) + momentum aligns
B. Volume Confirmation
Volume Profile
Enter longs only if momentum breaks resistance at high-volume nodes
VWAP
Buy pullbacks when momentum holds support and price is above VWAP
C. Price Structure
Fibonacci Retracements
Look for momentum breaks at 61.8% Fib levels for high-probability trades
Market Structure (Higher Lows/Lower Highs)
Momentum breakouts work best when price confirms trend
5. Trading Signals & Execution Rules
A. Breakout Trades (High Momentum)
Signal Conditions Action
Resistance Broken Histogram > Orange Zone + Price > Key S/R Enter Long
Support Broken Histogram < Blue Zone + Price < Key S/R Enter Short
Stop Loss:
Longs: 1 tick below nearest swing low
Shorts: 1 tick above nearest swing high
Take Profit:
Trail using the opposite zone (exit long when momentum drops below support)
B. Reversal Trades (Momentum Exhaustion)
Signal Conditions Action
Resistance Holding Histogram rejects Orange Zone + Bearish candle Short Entry
Support Holding Histogram bounces off Blue Zone + Bullish candle Long Entry
Stop Loss:
Beyond the recent swing high/low
Take Profit:
At next key S/R level
6. Advanced Interpretation
A. Divergence Trading
Hidden Bullish Divergence:
Price makes higher low, but momentum makes lower low → Potential reversal up
Hidden Bearish Divergence:
Price makes lower high, but momentum makes higher high → Potential reversal down
B. Session-Based Trading
London Open (3 AM EST): Watch for momentum breaks with volume surge
NY Midday (10 AM - 12 PM EST): Best for trend continuation
Crypto (UTC Midnight): Often sees volatility spikes
7. Risk Management & Position Sizing
Risk per trade: 1-2% of account
Leverage: ≤5x for intraday, ≤2x for swing
Avoid trading:
First 15 mins after major news
Low-volume periods (e.g., forex after 5 PM EST)
8. Pro Tips for Consistency
✅ Wait for Close: Don’t trade wicks, wait for candle close beyond zones.
✅ Combine with Price Action: Only trade if momentum aligns with candlestick patterns (e.g., pin bars, engulfing).
✅ Adjust Lookback: Increase in choppy markets, decrease in trends.
9. Limitations & Fixes
Issue Solution
Whipsaws in choppy markets Increase Min Lookback to 30+
Slow reaction in trends Reduce Max Lookback to 50
False breakouts Require volume confirmation
Final Verdict
This script is best used as a momentum filter – not a standalone system. Combine with:
✔ Trend indicators (200 EMA, ADX)
✔ Volume analysis (VWAP, Volume Profile)
✔ Price structure (S/R, Fibs)

Bober XM v2.0# ₿ober XM v2.0 Trading Bot Documentation
**Developer's Note**: While our previous Bot 1.3.1 was removed due to guideline violations, this setback only fueled our determination to create something even better. Rising from this challenge, Bober XM 2.0 emerges not just as an update, but as a complete reimagining with multi-timeframe analysis, enhanced filters, and superior adaptability. This adversity pushed us to innovate further and deliver a strategy that's smarter, more agile, and more powerful than ever before. Challenges create opportunity - welcome to Cryptobeat's finest work yet.
## !!!!You need to tune it for your own pair and timeframe and retune it periodicaly!!!!!
## Overview
The ₿ober XM v2.0 is an advanced dual-channel trading bot with multi-timeframe analysis capabilities. It integrates multiple technical indicators, customizable risk management, and advanced order execution via webhook for automated trading. The bot's distinctive feature is its separate channel systems for long and short positions, allowing for asymmetric trade strategies that adapt to different market conditions across multiple timeframes.
### Key Features
- **Multi-Timeframe Analysis**: Analyze price data across multiple timeframes simultaneously
- **Dual Channel System**: Separate parameter sets for long and short positions
- **Advanced Entry Filters**: RSI, Volatility, Volume, Bollinger Bands, and KEMAD filters
- **Machine Learning Moving Average**: Adaptive prediction-based channels
- **Multiple Entry Strategies**: Breakout, Pullback, and Mean Reversion modes
- **Risk Management**: Customizable stop-loss, take-profit, and trailing stop settings
- **Webhook Integration**: Compatible with external trading bots and platforms
### Strategy Components
| Component | Description |
|---------|-------------|
| **Dual Channel Trading** | Uses either Keltner Channels or Machine Learning Moving Average (MLMA) with separate settings for long and short positions |
| **MLMA Implementation** | Machine learning algorithm that predicts future price movements and creates adaptive bands |
| **Pivot Point SuperTrend** | Trend identification and confirmation system based on pivot points |
| **Three Entry Strategies** | Choose between Breakout, Pullback, or Mean Reversion approaches |
| **Advanced Filter System** | Multiple customizable filters with multi-timeframe support to avoid false signals |
| **Custom Exit Logic** | Exits based on OBV crossover of its moving average combined with pivot trend changes |
### Note for Novice Users
This is a fully featured real trading bot and can be tweaked for any ticker — SOL is just an example. It follows this structure:
1. **Indicator** – gives the initial signal
2. **Entry strategy** – decides when to open a trade
3. **Exit strategy** – defines when to close it
4. **Trend confirmation** – ensures the trade follows the market direction
5. **Filters** – cuts out noise and avoids weak setups
6. **Risk management** – controls losses and protects your capital
To tune it for a different pair, you'll need to start from scratch:
1. Select the timeframe (candle size)
2. Turn off all filters and trend entry/exit confirmations
3. Choose a channel type, channel source and entry strategy
4. Adjust risk parameters
5. Tune long and short settings for the channel
6. Fine-tune the Pivot Point Supertrend and Main Exit condition OBV
This will generate a lot of signals and activity on the chart. Your next task is to find the right combination of filters and settings to reduce noise and tune it for profitability.
### Default Strategy values
Default values are tuned for: Symbol BITGET:SOLUSDT.P 5min candle
Filters are off by default: Try to play with it to understand how it works
## Configuration Guide
### General Settings
| Setting | Description | Default Value |
|---------|-------------|---------------|
| **Long Positions** | Enable or disable long trades | Enabled |
| **Short Positions** | Enable or disable short trades | Enabled |
| **Risk/Reward Area** | Visual display of stop-loss and take-profit zones | Enabled |
| **Long Entry Source** | Price data used for long entry signals | hl2 (High+Low/2) |
| **Short Entry Source** | Price data used for short entry signals | hl2 (High+Low/2) |
The bot allows you to trade long positions, short positions, or both simultaneously. Each direction has its own set of parameters, allowing for fine-tuned strategies that recognize the asymmetric nature of market movements.
### Multi-Timeframe Settings
1. **Enable Multi-Timeframe Analysis**: Toggle 'Enable Multi-Timeframe Analysis' in the Multi-Timeframe Settings section
2. **Configure Timeframes**: Set appropriate higher timeframes based on your trading style:
- Timeframe 1: Default is now 15 minutes (intraday confirmation)
- Timeframe 2: Default is 4 hours (trend direction)
3. **Select Sources per Indicator**: For each indicator (RSI, KEMAD, Volume, etc.), choose:
- The desired timeframe (current, mtf1, or mtf2)
- The appropriate price type (open, high, low, close, hl2, hlc3, ohlc4)
### Entry Strategies
- **Breakout**: Enter when price breaks above/below the channel
- **Pullback**: Enter when price pulls back to the channel
- **Mean Reversion**: Enter when price is extended from the channel
You can enable different strategies for long and short positions.
### Core Components
### Risk Management
- **Position Size**: Control risk with percentage-based position sizing
- **Stop Loss Options**:
- Fixed: Set a specific price or percentage from entry
- ATR-based: Dynamic stop-loss based on market volatility
- Swing: Uses recent swing high/low points
- **Take Profit**: Multiple targets with percentage allocation
- **Trailing Stop**: Dynamic stop that follows price movement
## Advanced Usage Strategies
### Moving Average Type Selection Guide
- **SMA**: More stable in choppy markets, good for higher timeframes
- **EMA/WMA**: More responsive to recent price changes, better for entry signals
- **VWMA**: Adds volume weighting for stronger trends, use with Volume filter
- **HMA**: Balance between responsiveness and noise reduction, good for volatile markets
### Multi-Timeframe Strategy Approaches
- **Trend Confirmation**: Use higher timeframe RSI (mtf2) for overall trend, current timeframe for entries
- **Entry Precision**: Use KEMAD on current timeframe with volume filter on mtf1
- **False Signal Reduction**: Apply RSI filter on mtf1 with strict KEMAD settings
### Market Condition Optimization
| Market Condition | Recommended Settings |
|------------------|----------------------|
| **Trending** | Use Breakout strategy with KEMAD filter on higher timeframe |
| **Ranging** | Use Mean Reversion with strict RSI filter (mtf1) |
| **Volatile** | Increase ATR multipliers, use HMA for moving averages |
| **Low Volatility** | Decrease noise parameters, use pullback strategy |
## Webhook Integration
The strategy features a professional webhook system that allows direct connectivity to your exchange or trading platform of choice through third-party services like 3commas, Alertatron, or Autoview.
The webhook payload includes all necessary parameters for automated execution:
- Entry price and direction
- Stop loss and take profit levels
- Position size
- Custom identifier for webhook routing
## Performance Optimization Tips
1. **Start with Defaults**: Begin with the default settings for your timeframe before customizing
2. **Adjust One Component at a Time**: Make incremental changes and test the impact
3. **Match MA Types to Market Conditions**: Use appropriate moving average types based on the Market Condition Optimization table
4. **Timeframe Synergy**: Create logical relationships between timeframes (e.g., 5min chart with 15min and 4h higher timeframes)
5. **Periodic Retuning**: Markets evolve - regularly review and adjust parameters
## Common Setups
### Crypto Trend-Following
- MLMA with EMA or HMA
- Higher RSI thresholds (75/25)
- KEMAD filter on mtf1
- Breakout entry strategy
### Stock Swing Trading
- MLMA with SMA for stability
- Volume filter with higher threshold
- KEMAD with increased filter order
- Pullback entry strategy
### Forex Scalping
- MLMA with WMA and lower noise parameter
- RSI filter on current timeframe
- Use highest timeframe for trend direction only
- Mean Reversion strategy
## Webhook Configuration
- **Benefits**:
- Automated trade execution without manual intervention
- Immediate response to market conditions
- Consistent execution of your strategy
- **Implementation Notes**:
- Requires proper webhook configuration on your exchange or platform
- Test thoroughly with small position sizes before full deployment
- Consider latency between signal generation and execution
### Backtesting Period
Define a specific historical period to evaluate the bot's performance:
| Setting | Description | Default Value |
|---------|-------------|---------------|
| **Start Date** | Beginning of backtest period | January 1, 2025 |
| **End Date** | End of backtest period | December 31, 2026 |
- **Best Practice**: Test across different market conditions (bull markets, bear markets, sideways markets)
- **Limitation**: Past performance doesn't guarantee future results
## Entry and Exit Strategies
### Dual-Channel System
A key innovation of the Bober XM is its dual-channel approach:
- **Independent Parameters**: Each trade direction has its own channel settings
- **Asymmetric Trading**: Recognizes that markets often behave differently in uptrends versus downtrends
- **Optimized Performance**: Fine-tune settings for both bullish and bearish conditions
This approach allows the bot to adapt to the natural asymmetry of markets, where uptrends often develop gradually while downtrends can be sharp and sudden.
### Channel Types
#### 1. Keltner Channels
Traditional volatility-based channels using EMA and ATR:
| Setting | Long Default | Short Default |
|---------|--------------|---------------|
| **EMA Length** | 37 | 20 |
| **ATR Length** | 13 | 17 |
| **Multiplier** | 1.4 | 1.9 |
| **Source** | low | high |
- **Strengths**:
- Reliable in trending markets
- Less prone to whipsaws than Bollinger Bands
- Clear visual representation of volatility
- **Weaknesses**:
- Can lag during rapid market changes
- Less effective in choppy, non-trending markets
#### 2. Machine Learning Moving Average (MLMA)
Advanced predictive model using kernel regression (RBF kernel):
| Setting | Description | Options |
|---------|-------------|--------|
| **Source MA** | Price data used for MA calculations | Any price source (low/high/close/etc.) |
| **Moving Average Type** | Type of MA algorithm for calculations | SMA, EMA, WMA, VWMA, RMA, HMA |
| **Trend Source** | Price data used for trend determination | Any price source (close default) |
| **Window Size** | Historical window for MLMA calculations | 5+ (default: 16) |
| **Forecast Length** | Number of bars to forecast ahead | 1+ (default: 3) |
| **Noise Parameter** | Controls smoothness of prediction | 0.01+ (default: ~0.43) |
| **Band Multiplier** | Multiplier for channel width | 0.1+ (default: 0.5-0.6) |
- **Strengths**:
- Predictive rather than reactive
- Adapts quickly to changing market conditions
- Better at identifying trend reversals early
- **Weaknesses**:
- More computationally intensive
- Requires careful parameter tuning
- Can be sensitive to input data quality
### Entry Strategies
| Strategy | Description | Ideal Market Conditions |
|----------|-------------|-------------------------|
| **Breakout** | Enters when price breaks through channel bands, indicating strong momentum | High volatility, emerging trends |
| **Pullback** | Enters when price retraces to the middle band after testing extremes | Established trends with regular pullbacks |
| **Mean Reversion** | Enters at channel extremes, betting on a return to the mean | Range-bound or oscillating markets |
#### Breakout Strategy (Default)
- **Implementation**: Enters long when price crosses above the upper band, short when price crosses below the lower band
- **Strengths**: Captures strong momentum moves, performs well in trending markets
- **Weaknesses**: Can lead to late entries, higher risk of false breakouts
- **Optimization Tips**:
- Increase channel multiplier for fewer but more reliable signals
- Combine with volume confirmation for better accuracy
#### Pullback Strategy
- **Implementation**: Enters long when price pulls back to middle band during uptrend, short during downtrend pullbacks
- **Strengths**: Better entry prices, lower risk, higher probability setups
- **Weaknesses**: Misses some strong moves, requires clear trend identification
- **Optimization Tips**:
- Use with trend filters to confirm overall direction
- Adjust middle band calculation for market volatility
#### Mean Reversion Strategy
- **Implementation**: Enters long at lower band, short at upper band, expecting price to revert to the mean
- **Strengths**: Excellent entry prices, works well in ranging markets
- **Weaknesses**: Dangerous in strong trends, can lead to fighting the trend
- **Optimization Tips**:
- Implement strong trend filters to avoid counter-trend trades
- Use smaller position sizes due to higher risk nature
### Confirmation Indicators
#### Pivot Point SuperTrend
Combines pivot points with ATR-based SuperTrend for trend confirmation:
| Setting | Default Value |
|---------|---------------|
| **Pivot Period** | 25 |
| **ATR Factor** | 2.2 |
| **ATR Period** | 41 |
- **Function**: Identifies significant market turning points and confirms trend direction
- **Implementation**: Requires price to respect the SuperTrend line for trade confirmation
#### Weighted Moving Average (WMA)
Provides additional confirmation layer for entries:
| Setting | Default Value |
|---------|---------------|
| **Period** | 15 |
| **Source** | ohlc4 (average of Open, High, Low, Close) |
- **Function**: Confirms trend direction and filters out low-quality signals
- **Implementation**: Price must be above WMA for longs, below for shorts
### Exit Strategies
#### On-Balance Volume (OBV) Based Exits
Uses volume flow to identify potential reversals:
| Setting | Default Value |
|---------|---------------|
| **Source** | ohlc4 |
| **MA Type** | HMA (Options: SMA, EMA, WMA, RMA, VWMA, HMA) |
| **Period** | 22 |
- **Function**: Identifies divergences between price and volume to exit before reversals
- **Implementation**: Exits when OBV crosses its moving average in the opposite direction
- **Customizable MA Type**: Different MA types provide varying sensitivity to OBV changes:
- **SMA**: Traditional simple average, equal weight to all periods
- **EMA**: More weight to recent data, responds faster to price changes
- **WMA**: Weighted by recency, smoother than EMA
- **RMA**: Similar to EMA but smoother, reduces noise
- **VWMA**: Factors in volume, helpful for OBV confirmation
- **HMA**: Reduces lag while maintaining smoothness (default)
#### ADX Exit Confirmation
Uses Average Directional Index to confirm trend exhaustion:
| Setting | Default Value |
|---------|---------------|
| **ADX Threshold** | 35 |
| **ADX Smoothing** | 60 |
| **DI Length** | 60 |
- **Function**: Confirms trend weakness before exiting positions
- **Implementation**: Requires ADX to drop below threshold or DI lines to cross
## Filter System
### RSI Filter
- **Function**: Controls entries based on momentum conditions
- **Parameters**:
- Period: 15 (default)
- Overbought level: 71
- Oversold level: 23
- Multi-timeframe support: Current, MTF1 (15min), or MTF2 (4h)
- Customizable price source (open, high, low, close, hl2, hlc3, ohlc4)
- **Implementation**: Blocks long entries when RSI > overbought, short entries when RSI < oversold
### Volatility Filter
- **Function**: Prevents trading during excessive market volatility
- **Parameters**:
- Measure: ATR (Average True Range)
- Period: Customizable (default varies by timeframe)
- Threshold: Adjustable multiplier
- Multi-timeframe support
- Customizable price source
- **Implementation**: Blocks trades when current volatility exceeds threshold × average volatility
### Volume Filter
- **Function**: Ensures adequate market liquidity for trades
- **Parameters**:
- Threshold: 0.4× average (default)
- Measurement period: 5 (default)
- Moving average type: Customizable (HMA default)
- Multi-timeframe support
- Customizable price source
- **Implementation**: Requires current volume to exceed threshold × average volume
### Bollinger Bands Filter
- **Function**: Controls entries based on price relative to statistical boundaries
- **Parameters**:
- Period: Customizable
- Standard deviation multiplier: Adjustable
- Moving average type: Customizable
- Multi-timeframe support
- Customizable price source
- **Implementation**: Can require price to be within bands or breaking out of bands depending on strategy
### KEMAD Filter (Kalman EMA Distance)
- **Function**: Advanced trend confirmation using Kalman filter algorithm
- **Parameters**:
- Process Noise: 0.35 (controls smoothness)
- Measurement Noise: 24 (controls reactivity)
- Filter Order: 6 (higher = more smoothing)
- ATR Length: 8 (for bandwidth calculation)
- Upper Multiplier: 2.0 (for long signals)
- Lower Multiplier: 2.7 (for short signals)
- Multi-timeframe support
- Customizable visual indicators
- **Implementation**: Generates signals based on price position relative to Kalman-filtered EMA bands
## Risk Management System
### Position Sizing
Automatically calculates position size based on account equity and risk parameters:
| Setting | Default Value |
|---------|---------------|
| **Risk % of Equity** | 50% |
- **Implementation**:
- Position size = (Account equity × Risk %) ÷ (Entry price × Stop loss distance)
- Adjusts automatically based on volatility and stop placement
- **Best Practices**:
- Start with lower risk percentages (1-2%) until strategy is proven
- Consider reducing risk during high volatility periods
### Stop-Loss Methods
Multiple stop-loss calculation methods with separate configurations for long and short positions:
| Method | Description | Configuration |
|--------|-------------|---------------|
| **ATR-Based** | Dynamic stops based on volatility | ATR Period: 14, Multiplier: 2.0 |
| **Percentage** | Fixed percentage from entry | Long: 1.5%, Short: 1.5% |
| **PIP-Based** | Fixed currency unit distance | 10.0 pips |
- **Implementation Notes**:
- ATR-based stops adapt to changing market volatility
- Percentage stops maintain consistent risk exposure
- PIP-based stops provide precise control in stable markets
### Trailing Stops
Locks in profits by adjusting stop-loss levels as price moves favorably:
| Setting | Default Value |
|---------|---------------|
| **Stop-Loss %** | 1.5% |
| **Activation Threshold** | 2.1% |
| **Trailing Distance** | 1.4% |
- **Implementation**:
- Initial stop remains fixed until profit reaches activation threshold
- Once activated, stop follows price at specified distance
- Locks in profit while allowing room for normal price fluctuations
### Risk-Reward Parameters
Defines the relationship between risk and potential reward:
| Setting | Default Value |
|---------|---------------|
| **Risk-Reward Ratio** | 1.4 |
| **Take Profit %** | 2.4% |
| **Stop-Loss %** | 1.5% |
- **Implementation**:
- Take profit distance = Stop loss distance × Risk-reward ratio
- Higher ratios require fewer winning trades for profitability
- Lower ratios increase win rate but reduce average profit
### Filter Combinations
The strategy allows for simultaneous application of multiple filters:
- **Recommended Combinations**:
- Trending markets: RSI + KEMAD filters
- Ranging markets: Bollinger Bands + Volatility filters
- All markets: Volume filter as minimum requirement
- **Performance Impact**:
- Each additional filter reduces the number of trades
- Quality of remaining trades typically improves
- Optimal combination depends on market conditions and timeframe
### Multi-Timeframe Filter Applications
| Filter Type | Current Timeframe | MTF1 (15min) | MTF2 (4h) |
|-------------|-------------------|-------------|------------|
| RSI | Quick entries/exits | Intraday trend | Overall trend |
| Volume | Immediate liquidity | Sustained support | Market participation |
| Volatility | Entry timing | Short-term risk | Regime changes |
| KEMAD | Precise signals | Trend confirmation | Major reversals |
## Visual Indicators and Chart Analysis
The bot provides comprehensive visual feedback on the chart:
- **Channel Bands**: Keltner or MLMA bands showing potential support/resistance
- **Pivot SuperTrend**: Colored line showing trend direction and potential reversal points
- **Entry/Exit Markers**: Annotations showing actual trade entries and exits
- **Risk/Reward Zones**: Visual representation of stop-loss and take-profit levels
These visual elements allow for:
- Real-time strategy assessment
- Post-trade analysis and optimization
- Educational understanding of the strategy logic
## Implementation Guide
### TradingView Setup
1. Load the script in TradingView Pine Editor
2. Apply to your preferred chart and timeframe
3. Adjust parameters based on your trading preferences
4. Enable alerts for webhook integration
### Webhook Integration
1. Configure webhook URL in TradingView alerts
2. Set up receiving endpoint on your trading platform
3. Define message format matching the bot's output
4. Test with small position sizes before full deployment
### Optimization Process
1. Backtest across different market conditions
2. Identify parameter sensitivity through multiple tests
3. Focus on risk management parameters first
4. Fine-tune entry/exit conditions based on performance metrics
5. Validate with out-of-sample testing
## Performance Considerations
### Strengths
- Adaptability to different market conditions through dual channels
- Multiple layers of confirmation reducing false signals
- Comprehensive risk management protecting capital
- Machine learning integration for predictive edge
### Limitations
- Complex parameter set requiring careful optimization
- Potential over-optimization risk with so many variables
- Computational intensity of MLMA calculations
- Dependency on proper webhook configuration for execution
### Best Practices
- Start with conservative risk settings (1-2% of equity)
- Test thoroughly in demo environment before live trading
- Monitor performance regularly and adjust parameters
- Consider market regime changes when evaluating results
## Conclusion
The ₿ober XM v2.0 represents a significant evolution in trading strategy design, combining traditional technical analysis with machine learning elements and multi-timeframe analysis. The core strength of this system lies in its adaptability and recognition of market asymmetry.
### Market Asymmetry and Adaptive Approach
The strategy acknowledges a fundamental truth about markets: bullish and bearish phases behave differently and should be treated as distinct environments. The dual-channel system with separate parameters for long and short positions directly addresses this asymmetry, allowing for optimized performance regardless of market direction.
### Targeted Backtesting Philosophy
It's counterproductive to run backtests over excessively long periods. Markets evolve continuously, and strategies that worked in previous market regimes may be ineffective in current conditions. Instead:
- Test specific market phases separately (bull markets, bear markets, range-bound periods)
- Regularly re-optimize parameters as market conditions change
- Focus on recent performance with higher weight than historical results
- Test across multiple timeframes to ensure robustness
### Multi-Timeframe Analysis as a Game-Changer
The integration of multi-timeframe analysis fundamentally transforms the strategy's effectiveness:
- **Increased Safety**: Higher timeframe confirmations reduce false signals and improve trade quality
- **Context Awareness**: Decisions made with awareness of larger trends reduce adverse entries
- **Adaptable Precision**: Apply strict filters on lower timeframes while maintaining awareness of broader conditions
- **Reduced Noise**: Higher timeframe data naturally filters market noise that can trigger poor entries
The ₿ober XM v2.0 provides traders with a framework that acknowledges market complexity while offering practical tools to navigate it. With proper setup, realistic expectations, and attention to changing market conditions, it delivers a sophisticated approach to systematic trading that can be continuously refined and optimized.

RSI Divergence Strategy - AliferCryptoStrategy Overview
The RSI Divergence Strategy is designed to identify potential reversals by detecting regular bullish and bearish divergences between price action and the Relative Strength Index (RSI). It automatically enters positions when a divergence is confirmed and manages risk with configurable stop-loss and take-profit levels.
Key Features
Automatic Divergence Detection: Scans for RSI pivot lows/highs vs. price pivots using user-defined lookback windows and bar ranges.
Dual SL/TP Methods:
- Swing-based: Stops placed a configurable percentage beyond the most recent swing high/low.
- ATR-based: Stops placed at a multiple of Average True Range, with a separate risk/reward multiplier.
Long and Short Entries: Buys on bullish divergences; sells short on bearish divergences.
Fully Customizable: Input groups for RSI, divergence, swing, ATR, and general SL/TP settings.
Visual Plotting: Marks divergences on chart and plots stop-loss (red) and take-profit (green) lines for active trades.
Alerts: Built-in alert conditions for both bullish and bearish RSI divergences.
Detailed Logic
RSI Calculation: Computes RSI of chosen source over a specified period.
Pivot Detection:
- Identifies RSI pivot lows/highs by scanning a lookback window to the left and right.
- Uses ta.barssince to ensure pivots are separated by a minimum/maximum number of bars.
Divergence Confirmation:
- Bullish: Price makes a lower low while RSI makes a higher low.
- Bearish: Price makes a higher high while RSI makes a lower high.
Entry:
- Opens a Long position when bullish divergence is true.
- Opens a Short position when bearish divergence is true.
Stop-Loss & Take-Profit:
- Swing Method: Computes the recent swing high/low then adjusts by a percentage margin.
- ATR Method: Uses the current ATR × multiplier applied to the entry price.
- Take-Profit: Calculated as entry price ± (risk × R/R ratio).
Exit Orders: Uses strategy.exit to place bracket orders (stop + limit) for both long and short positions.
Inputs and Configuration
RSI Settings: Length & price source for the RSI.
Divergence Settings: Pivot lookback parameters and valid bar ranges.
SL/TP Settings: Choice between Swing or ATR method.
Swing Settings: Swing lookback length, margin (%), and risk/reward ratio.
ATR Settings: ATR length, stop multiplier, and risk/reward ratio.
Usage Notes
Adjust the Pivot Lookback and Range values to suit the volatility and timeframe of your market.
Use higher ATR multipliers for wider stops in choppy conditions, or tighten swing margins in trending markets.
Backtest different R/R ratios to find the balance between win rate and reward.
Disclaimer
This script is for educational purposes only and does not constitute financial advice. Trading carries significant risk and you may lose more than your initial investment. Always conduct your own research and consider consulting a professional before making any trading decisions.

Trendline Breakout Navigator [LuxAlgo]The Trendline Breakout Navigator indicator shows three trendlines, representing trends of different significance between Swing Points.
Dots highlight a Higher Low (HL) or Lower High (LH) that pierces through the Trendline without the closing price breaking the Trendline.
A bar color and background color option is included, which offers insights into the price against the trendlines.
🔶 USAGE
Trendlines (TL) are drawn, starting as a horizontal line from a Swing Point.
When an HL (in the case of a bullish TL) or an LH (bearish TL) is found, this Swing Point is connected to the first Swing Point. In both cases, the TL can be optimized when one or more historical close prices breach the TL (see DETAILS).
A solid-styled long-term trendline represents the overall market direction, while a dashed-styled medium-term trendline captures medium-term movements within the long-term trend. Finally, a dotted-styled short-term trendline tracks short-term fluctuations.
🔹 Swing Points vs. Trend
A "Higher High" (HH) or "Lower Low" (LL) will initialize a new trendline, respectively, starting from the previous "Swing Low" or Swing High".
To spot the trend shift, "HH/LL" labels and an optional background color are included. They can be enabled/disabled or set at "Long, Medium, or Short" term TL (Settings—"MS", "HH/LL" and "Background Color").
These features are linked to one Trendline of choice only.
Where the "HH/LL" labels can show a potential trend shift, the background color is:
Green from the moment the close price breaks above a bearish trendline or when an HH occurs
Red from the moment the close price breaks below a bullish trendline or when an LL occurs
🔹 Bar Color
The bar color will depend on the location of the closing price against the three trendlines. When a trendline is unavailable (for example, if the close price breaks the TL and there is no HH/LL), the last known trendline value will be considered.
All three trendlines influence the bar color.
If the close price is above the "Long Term" TL, the bar color will show a gradient of green, darker when the close price is below the "Medium Term" and/or "Short Term" TLs.
On the other hand, when the close price is below the "Long Term" TL, the bar color will show a gradient of red, which becomes darker when the close price is above the "Medium Term" and/or "Short Term" TLs.
To keep the above example simple, only the "Long Term" TL is considered. The white line (not included in the script) resembles the actual value of the TL at each bar, where you can see the effect on the bar color.
Combined with the trendlines and dots, the bar color can provide extra depth and insights into the underlying trends.
🔹 Tested Trendlines
If a new HL/LH pierces the Trendline without the close price breaking the Trendline, the Trendline will be updated.
The exact location where the price exceeded the Trendline is visualized by a dot, colored blue on a bullish trendline and orange when bearish.
These dots can be indicative of a potential trend continuation or reversal.
🔹 Higher TimeFrame Option
The "Period" setting enables users to visualize higher-timeframe trendlines as long as the line length doesn't exceed 5000 bars.
🔶 DETAILS
When a new trendline is drawn, the script first draws a preliminary line and then checks whether a historical close price exceeded this line above (in the case of a bearish TL) or below (in a bullish case).
Subsequently, the most valid point in between is chosen as the starting point of the Trendline.
🔶 SETTINGS
Period: Choose "chart" for trendlines from the current chart timeframe, or choose a higher timeframe
🔹 Swing Length
Toggle and Swing Length for three trendlines: Period used for the swing detection, with higher values returning longer-term Swing Levels.
🔹 Style
Trendline: color for bullish/bearish Trendline
Wick Dot: color for bullish/bearish trendline test
Term: Long-, medium- or short-term
HH/LL: Show HH/LL labels (with or without previous Swing High/Low) of chosen Term
Background Color: Green when the closing price is above the trendline of choice, red otherwise
Bar Color

Fixed Straddle with dynamic Res/Sup [BlueChip Algos]Fixed Straddle/Strangle with Dynamic Resistance and Support indicator is designed for options traders focusing on combined straddle and strangle premiums of particular strikes (without rolling). This script offers dynamic charting capabilities with integrated technical indicators, making it a valuable tool for traders in the Indian options market.
About the Indicator
This indicator allows traders to analyze straddle and strangle positions using pre-set strike prices. It dynamically plots resistance and support levels based on price movements using swing HIGHs and LOWs, plots potential stop-loss levels using ATR Stop Loss combined with other customizable indicators like Moving Averages, SuperTrend and VWAP
Features
Straddle and Strangle Analysis: Users can analyze options straddle or custom strangle positions by specifying the exact strike prices for both CE (Call) and PE (Put) options. Please note that one needs to give required strike in all 3 fields mandatorily (Fixes staddle, CE and PE) irrespective of whether you select straddle or strangle in the dropdown.
Dynamic Resistance and Support: The script dynamically adjusts support and resistance levels based on price movements, providing insights into potential price reversal points.
Comprehensive Indicator Suite: Includes popular indicators like Moving Averages, SuperTrend, ATR Stop Loss, and VWAP, each customizable to fit the trader's strategy.
Input Parameters
Chart Type: Choose between "Fixed Straddle" and "Fixed Strangle" for the analysis.
Symbol Selection: Select from various Indian indices such as NIFTY, BANKNIFTY, MIDCAP, FINNIFTY, SENSEX, BANKEX, or input a custom symbol.
Strike Prices: Set the exact strike prices for the fixed straddle or strangle analysis. Note to enter value in all 3 strike fields irrespective of straddle or strangle selection.
Expiry Date: Select the expiry date for the options.
Indicator Settings: Customize each indicator’s parameters, including Moving Averages, SuperTrend, ATR Stop Loss, VWAP, and Swing High/Low levels.
Understanding the Indicator
1. Dynamic Resistance and Support Levels using swing H/Ls
Purpose: This indicator identifies significant swing highs and lows, which are key levels for potential price reversals or continuation.
Parameters:
Swing Length: Number of bars used to confirm swing highs and lows.
How It Works: The Swing High/Low Levels are plotted based on past price action, marking the areas where the price has previously reversed, helping traders set their stop-loss or take-profit levels.
2. VWAP (Volume Weighted Average Price)
Purpose: VWAP provides the average price weighted by volume over a specified period. It is widely used by traders to identify the true average price of a security.
How It Works: VWAP is plotted as a line on the chart, which helps in understanding the price direction in relation to the day's volume-weighted average price.
3. ATR Stop Loss
Purpose: The ATR Stop Loss dynamically adjusts stop-loss levels based on the market’s volatility, calculated through the ATR.
Parameters:
ATR Period: Number of periods over which ATR is calculated.
Multiplier: Factor that determines the distance of the stop-loss from the current price.
How It Works: This indicator adjusts the stop-loss level to protect against large market swings, moving closer or further away based on the ATR value.
4. Moving Average (MA)
Purpose: The Moving Average smooths price data to help identify trends and reversals. It is useful for understanding the overall market direction.
Parameters:
MA Source: Data source for the Moving Average calculation (e.g., Close price).
MA Length: The number of periods used to calculate the Moving Average.
MA Smoothing: The type of smoothing applied, such as SMA, EMA, WMA, or RMA.
5. SuperTrend
Purpose: SuperTrend is a trend-following indicator that helps traders identify the prevailing market trend and potential entry/exit points.
Parameters:
Factor: The multiplier applied to the ATR (Average True Range) for calculating the SuperTrend bands.
ATR Period: The number of periods used for calculating the ATR.
How It Works: The SuperTrend line acts as a support or resistance level. A price above the SuperTrend line indicates a bullish trend, while a price below it indicates a bearish trend.