Swing Trading SPX CorrelationThis is a long timeframe script designed to benefit from the correlation with the Percentage of stocks Above 200 moving average from SPX
At the same time with this percentage we are creating a weighted moving average to smooth its accuracy.
The rules are simple :
If the moving average is increasing its a long signal/short exit
If the moving average is decreased its a short signal/long exit.
Curently the strategy has been adapted for long only entries.
If you have any questions let me know !
在脚本中搜索"swing"

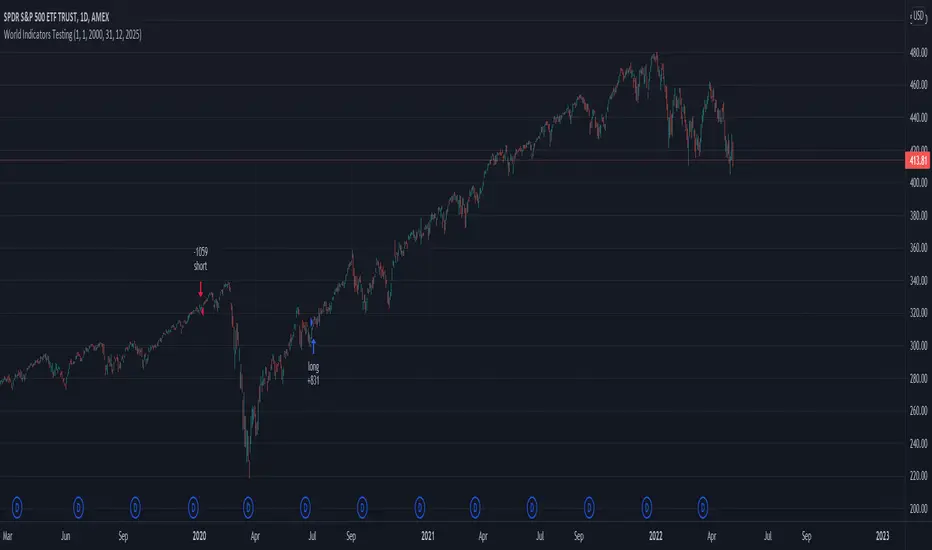
Swing Stock designed for Monthly/Yearly Trading This is a strategy tester designed around the most important data from FRED - Federal Reserve Economic Data
As input data, we have:
// Personal Consumption Expenditures
// Real Retail and Food Services Sales
// Leading Index for the United States
// All Employees: Total Nonfarm Payrolls
// Real Gross Domestic Product
// Gross Domestic Product
I adapted the long and short entry based on the GDP data, since they are most accurate in prediction compared to the rest.
However, feel free to test with other as well if you want.
For this test I compared previous GDP values, if they were higher than previous that represent a long signals, if they were smaller that represents a reversal=short signal.
From the tests performed we can see that GDP is highly accurate and overall as long as there is patience, profits are going to be make, sometimes even beat the index itself.
If you have any questions, let me know !
Swing Assassin's Consolidated ScriptI put this script together to essentially consolidate a number of scripts that I use on a daily basis into one script. This is an ongoing improvement effort, so there may be some garbage in here right now so keep that in mind if you intend to use this to help in your trading.
There are 5 moving averages (Hull). I use the Fast, Mid and Slow to find entries after I us the Medium Slow and Super Slow to identify a trend. Otherwise, I have those three turned off.
This script also uses Bollinger Bands which I literally cannot trade without.
The script also has anchored VWAP , automated support/resistance lines, and a homebrewed Volume Profile that is a copy from Ildar Akhmetgaleev's indicator "Poor Man's Volume Profile" used under Mozilla Public License Version 2.0.

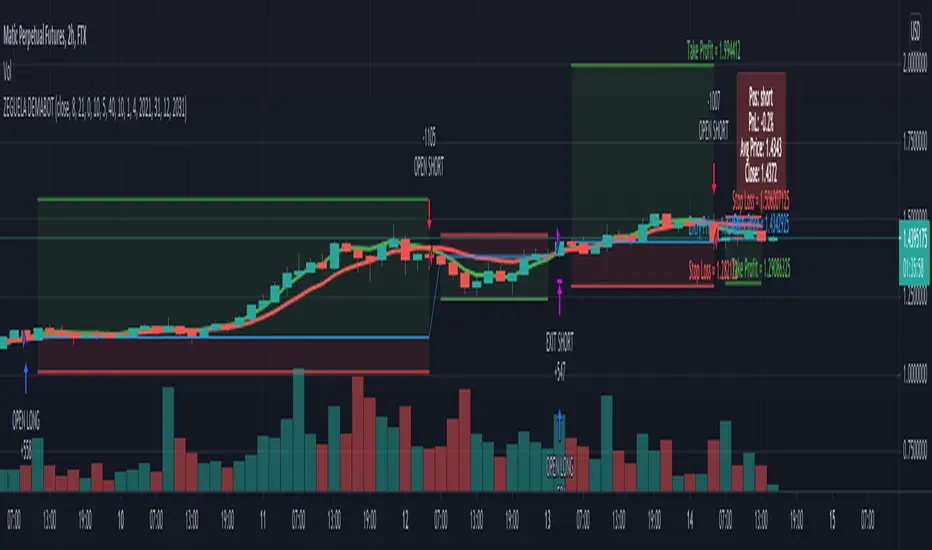
ZEGUELA DEMABOTSwing trading bot strategy. This indicator uses Dema 8 and Dema 24 crosses to throw buy and sell signals. You can also se take profit and stop loss parameters
Swing High Low Price Channel V.1You should buy/sell small order at small plot zone or after small plot. And, Buy/sell big order at big plot zone or after big plot.
Recommended, You should use this with Fibonacci Retracement, Price Action or Graph Pattern.


Penny Stock Short Signal Pro# Penny Stock Short Signal Pro (PSSP) v1.0
## Complete User Guide & Documentation
---
# 📋 TABLE OF CONTENTS
1. (#introduction)
2. (#why-short-penny-stocks)
3. (#the-7-core-detection-systems)
4. (#installation--setup)
5. (#understanding-the-dashboard)
6. (#input-settings-deep-dive)
7. (#visual-elements-explained)
8. (#alert-configuration)
9. (#trading-strategies)
10. (#risk-management)
11. (#best-practices)
12. (#troubleshooting)
13. (#changelog)
---
# Introduction
**Penny Stock Short Signal Pro (PSSP)** is a comprehensive Pine Script v6 indicator specifically engineered for identifying high-probability short-selling opportunities on low-priced, high-volatility stocks. Unlike generic indicators that apply broad technical analysis, PSSP is purpose-built for the unique characteristics of penny stock price action—where parabolic moves, retail FOMO, and violent reversals create predictable patterns for prepared traders.
## Key Features
- **7 Independent Detection Systems** working in concert to identify exhaustion points
- **Composite Signal Engine** that requires multiple confirmations before triggering
- **Real-Time Dashboard** displaying all signal states and market metrics
- **Automatic Risk Management** with dynamic stop-loss and profit target calculations
- **Customizable Sensitivity** for different trading styles (scalping vs. swing)
- **Built-in Alert System** for all major signal types
## Who Is This For?
- **Active Day Traders** looking to capitalize on intraday reversals
- **Short Sellers** who specialize in penny stocks and small caps
- **Momentum Traders** who want to identify when momentum is exhausting
- **Risk-Conscious Traders** who need clear entry/exit levels
---
# Why Short Penny Stocks?
## The Penny Stock Lifecycle
Penny stocks follow a remarkably predictable lifecycle that creates shorting opportunities:
```
PHASE 1: ACCUMULATION
└── Low volume, tight range
└── Smart money quietly building positions
PHASE 2: MARKUP / PROMOTION
└── News catalyst or promotional campaign
└── Volume increases, price begins rising
└── Early momentum traders enter
PHASE 3: DISTRIBUTION (YOUR OPPORTUNITY)
└── Parabolic move attracts retail FOMO buyers
└── Smart money selling into strength
└── Volume climax signals exhaustion
└── ⚠️ PSSP SIGNALS FIRE HERE ⚠️
PHASE 4: DECLINE
└── Support breaks, panic selling
└── Price returns toward origin
└── Short sellers profit
```
## Why Shorts Work on Penny Stocks
1. **No Fundamental Support**: Most penny stocks have no earnings, revenue, or assets to justify elevated prices
2. **Promotional Nature**: Many rallies are driven by promoters who will eventually stop
3. **Retail Exhaustion**: Retail buying power is finite—when it's exhausted, gravity takes over
4. **Float Dynamics**: Low float stocks move fast in both directions
5. **Technical Levels Matter**: VWAP, round numbers, and prior highs become self-fulfilling resistance
---
# The 7 Core Detection Systems
PSSP employs seven independent detection algorithms. Each identifies a specific type of exhaustion or reversal signal. When multiple systems fire simultaneously, the probability of a successful short dramatically increases.
---
## 1. PARABOLIC EXHAUSTION DETECTOR
### What It Detects
Identifies when price has moved too far, too fast and is likely to reverse. This system looks for the classic "blow-off top" pattern common in penny stock runners.
### Technical Logic
```
Parabolic Signal = TRUE when:
├── Consecutive green candles ≥ threshold (default: 3)
├── AND price extension from VWAP ≥ threshold ATRs (default: 1.5)
└── OR shooting star / upper wick rejection pattern forms
```
### Visual Representation
```
╱╲ ← Shooting star / upper wick
╱ ╲ (Parabolic exhaustion)
╱
╱
╱
══════════════ VWAP
╱
╱
```
### Why It Works on Penny Stocks
Penny stocks are notorious for parabolic moves driven by retail FOMO. When everyone who wants to buy has bought, there's no one left to push prices higher. The shooting star pattern shows that sellers are already stepping in at higher prices.
### Key Settings
| Parameter | Default | Range | Description |
|-----------|---------|-------|-------------|
| Lookback Period | 10 | 3-30 | Bars to analyze for pattern |
| Extension Threshold | 1.5 ATR | 0.5-5.0 | How far above VWAP is "parabolic" |
| Consecutive Green Bars | 3 | 2-10 | Minimum green bars for exhaustion |
---
## 2. VWAP REJECTION SYSTEM
### What It Detects
Volume Weighted Average Price (VWAP) is the single most important level for institutional traders. This system identifies when price tests above VWAP and gets rejected back below—a powerful short signal.
### Technical Logic
```
VWAP Rejection = TRUE when:
├── Candle high pierces above VWAP
├── AND candle closes below VWAP
├── AND candle is bearish (close < open)
└── AND rejection distance is within sensitivity threshold
```
### Visual Representation
```
High ──→ ╱╲
╱ ╲
VWAP ════════╱════╲═══════════
Close ←── Rejection
```
### Extended VWAP Signals
The system also tracks VWAP standard deviation bands. Rejection from the upper band (2 standard deviations above VWAP) is an even stronger signal.
### Why It Works on Penny Stocks
- Algorithms and institutions use VWAP as their benchmark
- Failed attempts to reclaim VWAP often lead to waterfall selling
- VWAP acts as a "magnet" that price tends to revert toward
### Key Settings
| Parameter | Default | Range | Description |
|-----------|---------|-------|-------------|
| Rejection Sensitivity | 0.5 ATR | 0.1-2.0 | How close to VWAP for valid rejection |
| Show VWAP Line | True | - | Display VWAP on chart |
| Show VWAP Bands | True | - | Display standard deviation bands |
| Band Multiplier | 2.0 | 0.5-4.0 | Standard deviations for bands |
---
## 3. VOLUME CLIMAX DETECTOR
### What It Detects
Identifies "blow-off tops" where extreme volume accompanies a price spike. This often marks the exact top as it represents maximum retail participation—after which buying power is exhausted.
### Technical Logic
```
Volume Climax = TRUE when:
├── Current volume ≥ (Average volume × Climax Multiple)
├── AND one of:
│ ├── Selling into the high (upper wick > lower wick on green bar)
│ └── OR post-climax weakness (red bar following climax bar)
```
### Visual Representation
```
Price: ╱╲
╱ ╲
╱ ╲
╱ ╲
╱
Volume:
▂▃▅▇██▇▅▃▂▁
↑
Volume Climax (3x+ average)
```
### Why It Works on Penny Stocks
- Retail traders pile in at the top, creating volume spikes
- Market makers and smart money use this liquidity to exit
- Once the volume spike passes, there's no fuel left for higher prices
- The "smart money selling into dumb money buying" creates the top
### Key Settings
| Parameter | Default | Range | Description |
|-----------|---------|-------|-------------|
| Volume MA Length | 20 | 5-50 | Period for average volume calculation |
| Climax Volume Multiple | 3.0x | 1.5-10.0 | Multiple of average for "climax" |
| Show Volume Bars | True | - | Visual volume representation |
---
## 4. RSI DIVERGENCE ANALYZER
### What It Detects
Bearish divergence occurs when price makes higher highs but RSI (momentum) makes lower highs. This indicates that momentum is weakening even as price pushes higher—a warning of imminent reversal.
### Technical Logic
```
Bearish Divergence = TRUE when:
├── RSI is in overbought territory (> threshold)
├── AND RSI is declining (current < previous < prior)
└── Indicates momentum exhaustion before price catches up
```
### Visual Representation
```
Price: /\ /\
/ \ / \ ← Higher high
/ \/
/
/
RSI: /\
/ \ /\
/ \/ \ ← Lower high (DIVERGENCE)
/ \
════════════════════ Overbought (70)
```
### Why It Works on Penny Stocks
- Penny stocks often push to new highs on weaker and weaker momentum
- Divergence signals that fewer buyers are participating at each new high
- Eventually, the lack of buying pressure leads to collapse
### Key Settings
| Parameter | Default | Range | Description |
|-----------|---------|-------|-------------|
| RSI Length | 14 | 5-30 | Standard RSI calculation period |
| Overbought Level | 70 | 60-90 | RSI level considered overbought |
| Divergence Lookback | 14 | 5-30 | Bars to look back for swing highs |
---
## 5. KEY LEVEL REJECTION TRACKER
### What It Detects
Identifies rejections from significant price levels where shorts are likely to be concentrated: High of Day (HOD), premarket highs, and psychological levels (whole and half dollars).
### Technical Logic
```
Level Rejection = TRUE when:
├── Price touches key level (within 0.2% tolerance)
├── AND candle is bearish (close < open)
├── AND close is in lower portion of candle range
│
├── Key Levels Tracked:
│ ├── High of Day (HOD)
│ ├── Premarket High
│ └── Psychological levels ($1.00, $1.50, $2.00, etc.)
```
### Visual Representation
```
HOD ─────────────────────────────────
╱╲ ← Rejection
╱ ╲
╱ ╲
╱
─────────────────────────────────
PM High ─────────────────────────────
```
### Why It Works on Penny Stocks
- **HOD**: The high of day is where the most traders are trapped long. Failure to break HOD often triggers stop-loss cascades
- **Premarket High**: Represents overnight enthusiasm; failure to exceed often means the "news" is priced in
- **Psychological Levels**: Round numbers ($1, $2, $5) attract orders and act as natural resistance
### Key Settings
| Parameter | Default | Range | Description |
|-----------|---------|-------|-------------|
| Track HOD Rejection | True | - | Monitor high of day |
| Track Premarket High | True | - | Monitor premarket resistance |
| Track Psychological Levels | True | - | Monitor round numbers |
---
## 6. FAILED BREAKOUT DETECTOR
### What It Detects
Identifies "bull traps" where price breaks above resistance but immediately fails and closes back below. This traps breakout buyers and often leads to accelerated selling.
### Technical Logic
```
Failed Breakout = TRUE when:
├── Price breaks above recent high (lookback period)
├── AND one of:
│ ├── Same bar closes below the breakout level
│ └── OR following bars show consecutive red candles
```
### Visual Representation
```
╱╲
╱ ╲ ← False breakout
Recent High ══╱════╲════════════════
╱ ╲
╱ ╲
╱ ╲ ← Trapped longs panic sell
```
### Why It Works on Penny Stocks
- Breakout traders enter on the break, providing exit liquidity for smart money
- When the breakout fails, these traders become trapped and must exit
- Their forced selling accelerates the decline
- Penny stocks have thin order books, making failed breakouts especially violent
### Key Settings
| Parameter | Default | Range | Description |
|-----------|---------|-------|-------------|
| Breakout Lookback | 5 | 2-15 | Bars to define "recent high" |
| Confirmation Bars | 2 | 1-5 | Bars to confirm failure |
---
## 7. MOVING AVERAGE BREAKDOWN SYSTEM
### What It Detects
Monitors exponential moving averages (EMAs) for bearish crossovers and price rejections. EMA crosses often signal trend changes, while rejections from EMAs indicate resistance.
### Technical Logic
```
MA Breakdown = TRUE when:
├── Bearish EMA cross (fast crosses below slow)
└── OR EMA rejection (price tests EMA from below and fails)
```
### Visual Representation
```
╱╲ ← Rejection from EMA
╱ ╲
EMA 9 ═══════════╱════╲═══════════
╲
EMA 20 ═══════════════════╲════════
╲
Bearish cross ↓
```
### Why It Works on Penny Stocks
- EMAs smooth out the noise and show underlying trend direction
- When fast EMA crosses below slow EMA, it signals momentum shift
- Rejected attempts to reclaim EMAs show sellers are in control
### Key Settings
| Parameter | Default | Range | Description |
|-----------|---------|-------|-------------|
| Fast EMA | 9 | 3-20 | Short-term trend |
| Slow EMA | 20 | 10-50 | Medium-term trend |
| Show EMAs | True | - | Display on chart |
---
# Installation & Setup
## Step 1: Access Pine Editor
1. Open TradingView (tradingview.com)
2. Open any chart
3. Click "Pine Editor" at the bottom of the screen
## Step 2: Create New Indicator
1. Click "Open" → "New blank indicator"
2. Delete any existing code
3. Paste the entire PSSP code
## Step 3: Save and Add to Chart
1. Click "Save" (give it a name like "PSSP")
2. Click "Add to chart"
3. The indicator will appear with default settings
## Step 4: Configure Settings
1. Click the gear icon (⚙️) on the indicator
2. Adjust settings based on your trading style (see Settings section)
3. Click "OK" to apply
## Recommended Chart Setup
- **Timeframe**: 1-minute or 5-minute for scalping, 15-minute for swing shorts
- **Chart Type**: Candlestick
- **Extended Hours**: Enable if trading premarket/afterhours
- **Volume**: Can disable default volume since PSSP tracks it
---
# Understanding the Dashboard
The real-time dashboard provides at-a-glance status of all systems:
```
┌─────────────────────────────────────────┐
│ 📊 SHORT SIGNAL DASHBOARD │
├─────────────────────────────────────────┤
│ Signal Strength: 5/7 │
├─────────────────────────────────────────┤
│ ─── ACTIVE SIGNALS ─── │
│ │
│ Parabolic Exhaustion 🔴 2.1 ATR │
│ VWAP Rejection 🔴 Above │
│ Volume Climax 🔴 4.2x Avg │
│ RSI Divergence ⚪ RSI: 68 │
│ Level Rejection 🔴 @ HOD │
│ Failed Breakout 🔴 │
│ MA Breakdown ⚪ Bullish │
├─────────────────────────────────────────┤
│ ─── RISK LEVELS ─── │
│ Stop: $2.45 T1: $2.10 T2: $1.85 │
└─────────────────────────────────────────┘
```
## Dashboard Elements Explained
### Signal Strength Indicator
| Rating | Signals | Color | Interpretation |
|--------|---------|-------|----------------|
| STRONG | 5-7 | Red | High-confidence short opportunity |
| MODERATE | 3-4 | Orange | Decent setup, consider other factors |
| WEAK | 1-2 | Gray | Insufficient confirmation |
| NONE | 0 | Gray | No short signals active |
### Signal Status Icons
- 🔴 = Signal is ACTIVE (condition met)
- ⚪ = Signal is INACTIVE (condition not met)
### Contextual Metrics
Each signal row includes relevant metrics:
- **Parabolic**: Shows ATR extension from VWAP
- **VWAP**: Shows if price is Above/Below VWAP
- **Volume**: Shows current volume as multiple of average
- **RSI**: Shows current RSI value
- **Level**: Shows which level was touched (HOD, PM High, etc.)
- **MA**: Shows EMA relationship (Bullish/Bearish)
### Risk Levels
When a composite short signal fires:
- **Stop**: Suggested stop-loss level (high + ATR multiple)
- **T1**: First profit target (1:1 risk/reward)
- **T2**: Second profit target (user-defined R:R)
---
# Input Settings Deep Dive
## Group 1: Parabolic Exhaustion
| Setting | Default | Conservative | Aggressive | Description |
|---------|---------|--------------|------------|-------------|
| Enable | True | True | True | Turn system on/off |
| Lookback Period | 10 | 15 | 5 | Bars analyzed for pattern |
| Extension Threshold | 1.5 | 2.0 | 1.0 | ATRs above VWAP for "parabolic" |
| Consecutive Green Bars | 3 | 4 | 2 | Minimum green bars required |
**Tuning Tips:**
- Lower thresholds = more signals but more false positives
- Higher thresholds = fewer signals but higher quality
- For very volatile penny stocks, consider higher thresholds
## Group 2: VWAP Rejection
| Setting | Default | Conservative | Aggressive | Description |
|---------|---------|--------------|------------|-------------|
| Enable | True | True | True | Turn system on/off |
| Rejection Sensitivity | 0.5 | 0.3 | 0.8 | ATR distance for valid rejection |
| Show VWAP Line | True | True | True | Display VWAP |
| Show VWAP Bands | True | True | True | Display deviation bands |
| Band Multiplier | 2.0 | 2.5 | 1.5 | Standard deviations for bands |
**Tuning Tips:**
- Tighter sensitivity (lower number) = must reject very close to VWAP
- Wider bands = less frequent upper band rejections but more significant
## Group 3: Volume Climax
| Setting | Default | Conservative | Aggressive | Description |
|---------|---------|--------------|------------|-------------|
| Enable | True | True | True | Turn system on/off |
| Volume MA Length | 20 | 30 | 10 | Baseline volume period |
| Climax Volume Multiple | 3.0 | 4.0 | 2.0 | Multiple for "climax" status |
| Show Volume Profile | True | True | True | Visual volume bars |
**Tuning Tips:**
- Higher multiple = only extreme volume spikes trigger
- Shorter MA = more responsive to recent volume changes
- For highly liquid stocks, consider higher multiples
## Group 4: Momentum Divergence
| Setting | Default | Conservative | Aggressive | Description |
|---------|---------|--------------|------------|-------------|
| Enable | True | True | True | Turn system on/off |
| RSI Length | 14 | 21 | 7 | RSI calculation period |
| Overbought Level | 70 | 75 | 65 | Threshold for "overbought" |
| Divergence Lookback | 14 | 20 | 10 | Bars for swing high detection |
**Tuning Tips:**
- Lower overbought threshold = more frequent signals
- Shorter RSI length = more responsive but noisier
## Group 5: Key Level Rejection
| Setting | Default | Description |
|---------|---------|-------------|
| Enable | True | Master toggle for level system |
| Track Premarket High | True | Monitor premarket resistance |
| Track HOD Rejection | True | Monitor high of day |
| Track Psychological Levels | True | Monitor round numbers |
**Tuning Tips:**
- Disable premarket tracking if stock doesn't have significant premarket activity
- Psychological levels work best on stocks under $10
## Group 6: Failed Follow-Through
| Setting | Default | Conservative | Aggressive | Description |
|---------|---------|--------------|------------|-------------|
| Enable | True | True | True | Turn system on/off |
| Breakout Lookback | 5 | 8 | 3 | Bars defining "recent high" |
| Confirmation Bars | 2 | 3 | 1 | Bars to confirm failure |
**Tuning Tips:**
- Shorter lookback = more breakouts detected but smaller significance
- More confirmation bars = higher confidence but later entry
## Group 7: Moving Average Signals
| Setting | Default | Conservative | Aggressive | Description |
|---------|---------|--------------|------------|-------------|
| Enable | True | True | True | Turn system on/off |
| Fast EMA | 9 | 12 | 5 | Short-term trend |
| Slow EMA | 20 | 26 | 13 | Medium-term trend |
| Show EMAs | True | True | True | Display on chart |
**Tuning Tips:**
- Standard 9/20 works well for most penny stocks
- Faster EMAs (5/13) for scalping, slower (12/26) for swing trading
## Group 8: Composite Signal
| Setting | Default | Conservative | Aggressive | Description |
|---------|---------|--------------|------------|-------------|
| Minimum Signals | 3 | 4-5 | 2 | Signals needed for trigger |
| Show Dashboard | True | True | True | Display signal table |
| Dashboard Position | top_right | - | - | Screen location |
**Tuning Tips:**
- **Minimum Signals is the most important setting**
- Higher minimum = fewer trades but higher win rate
- Lower minimum = more trades but more false signals
## Group 9: Risk Management
| Setting | Default | Conservative | Aggressive | Description |
|---------|---------|--------------|------------|-------------|
| Show Stop Levels | True | True | True | Display stop loss |
| Stop ATR Multiple | 1.5 | 2.0 | 1.0 | Stop distance in ATRs |
| Show Targets | True | True | True | Display profit targets |
| Target R:R | 2.0 | 1.5 | 3.0 | Risk:Reward for Target 2 |
**Tuning Tips:**
- Tighter stops (lower ATR multiple) = less risk but more stop-outs
- Higher R:R targets = bigger winners but fewer targets hit
## Group 10: Visual Settings
| Setting | Default | Description |
|---------|---------|-------------|
| Bullish Color | Green | Color for bullish elements |
| Bearish Color | Red | Color for bearish/short signals |
| Warning Color | Orange | Color for caution signals |
| Neutral Color | Gray | Color for inactive elements |
---
# Visual Elements Explained
## Chart Overlays
### VWAP Line (Blue)
- **Solid blue line** = Volume Weighted Average Price
- Price above VWAP = bullish bias
- Price below VWAP = bearish bias
- **Use**: Short when price rejects from above VWAP
### VWAP Bands (Purple circles)
- Upper band = 2 standard deviations above VWAP
- Lower band = 2 standard deviations below VWAP
- **Use**: Extreme extension to upper band signals potential reversal
### EMAs (Orange and Red)
- **Orange line** = Fast EMA (9-period default)
- **Red line** = Slow EMA (20-period default)
- **Use**: Bearish cross or price rejection from EMAs confirms short
### HOD Line (Red, dashed)
- Shows the current day's high
- **Use**: Rejection from HOD is a key short signal
### Premarket High (Orange, dashed)
- Shows premarket session high
- **Use**: Failure to break PM high often signals weakness
## Signal Markers
### Individual Signal Markers (Small)
| Shape | Color | Signal |
|-------|-------|--------|
| ▼ Triangle | Purple | Parabolic Exhaustion |
| ✕ X-Cross | Blue | VWAP Rejection |
| ◆ Diamond | Yellow | Volume Climax |
| ● Circle | Orange | RSI Divergence |
| ■ Square | Red | Failed Breakout |
### Composite Short Signal (Large)
- **Large red triangle** with "SHORT" text
- Only appears when minimum signal threshold is met
- This is your primary trading signal
## Risk Level Lines
### Stop Loss (Red line)
- Calculated as: Entry + (ATR × Stop Multiple)
- Represents maximum acceptable loss
- **RESPECT THIS LEVEL**
### Target 1 (Light green line)
- First profit target at 1:1 risk/reward
- Consider taking partial profits here
### Target 2 (Dark green line)
- Second profit target at user-defined R:R
- Let winners run to this level
## Background Coloring
### Light Red Background
- Appears when composite short signal is active
- Indicates you should be looking for shorts, not longs
### Light Purple Background
- Appears during extreme parabolic extension
- Warning of potential imminent reversal
---
# Alert Configuration
## Available Alerts
### 1. Composite Short Signal
**Best for**: Primary trading signal
```
Condition: Composite short signal fires
Message: "PSSP: Short Signal Triggered - {ticker} at {close}"
```
### 2. Parabolic Exhaustion
**Best for**: Early warning of potential top
```
Condition: Parabolic exhaustion detected
Message: "PSSP: Parabolic exhaustion detected on {ticker}"
```
### 3. Volume Climax
**Best for**: Blow-off top identification
```
Condition: Volume climax occurs
Message: "PSSP: Volume climax / blow-off top on {ticker}"
```
### 4. Strong Short Setup (5+ Signals)
**Best for**: High-confidence opportunities only
```
Condition: 5 or more signals active
Message: "PSSP: STRONG short setup on {ticker}"
```
### 5. Very Strong Short Setup (6+ Signals)
**Best for**: Maximum confidence trades
```
Condition: 6 or more signals active
Message: "PSSP: VERY STRONG short setup on {ticker}"
```
### 6. Failed Breakout
**Best for**: Bull trap identification
```
Condition: Failed breakout detected
Message: "PSSP: Failed breakout detected on {ticker}"
```
### 7. Key Level Rejection
**Best for**: Resistance level plays
```
Condition: Key level rejection occurs
Message: "PSSP: Key level rejection on {ticker}"
```
## Setting Up Alerts in TradingView
1. Right-click on the chart
2. Select "Add Alert"
3. Set Condition to "Penny Stock Short Signal Pro"
4. Choose your desired alert condition
5. Configure notification method (popup, email, webhook, etc.)
6. Set expiration (or "Open-ended" for permanent)
7. Click "Create"
## Alert Strategy Recommendations
### For Active Day Traders
- Enable: Composite Short Signal, Volume Climax
- Set to: Popup + Sound
- Check frequently during market hours
### For Swing Traders
- Enable: Strong Short Setup (5+), Very Strong Short Setup (6+)
- Set to: Email + Mobile Push
- Review at key times (open, lunch, close)
### For Part-Time Traders
- Enable: Very Strong Short Setup (6+) only
- Set to: Email + SMS
- Only trade highest-conviction setups
---
# Trading Strategies
## Strategy 1: The Parabolic Fade
**Setup Requirements:**
- Parabolic Exhaustion signal ACTIVE
- Extension from VWAP ≥ 2.0 ATR
- Volume climax or declining volume on push
**Entry:**
- Short on first red candle after signal
- Or short on break below prior candle's low
**Stop Loss:**
- Above the high of the parabolic move
- Maximum: 1.5 ATR above entry
**Targets:**
- T1: VWAP (take 50% off)
- T2: Lower VWAP band or LOD
**Best Time:** 9:30-10:30 AM (morning runners)
---
## Strategy 2: VWAP Rejection Short
**Setup Requirements:**
- VWAP Rejection signal ACTIVE
- Price came from below VWAP
- Rejection candle has significant upper wick
**Entry:**
- Short on close below VWAP
- Or short on break below rejection candle low
**Stop Loss:**
- Above VWAP + 0.5 ATR
- Or above rejection candle high
**Targets:**
- T1: Lower VWAP band
- T2: Prior support or LOD
**Best Time:** Midday (11:00 AM - 2:00 PM)
---
## Strategy 3: HOD Failure Short
**Setup Requirements:**
- Level Rejection signal ACTIVE (HOD)
- Multiple tests of HOD without breakthrough
- Volume declining on each test
**Entry:**
- Short on confirmed HOD rejection
- Wait for close below the rejection candle
**Stop Loss:**
- Above HOD + 0.25 ATR (tight)
- Clear invalidation if HOD breaks
**Targets:**
- T1: VWAP
- T2: Morning support levels
**Best Time:** 10:30 AM - 12:00 PM
---
## Strategy 4: Volume Climax Fade
**Setup Requirements:**
- Volume Climax signal ACTIVE
- Volume ≥ 3x average on green candle
- Followed by bearish candle or upper wick
**Entry:**
- Short on first red candle after climax
- Or short on break below climax candle low
**Stop Loss:**
- Above climax candle high
- Give room for volatility spike
**Targets:**
- T1: 50% retracement of the run
- T2: VWAP or start of the run
**Best Time:** First hour of trading
---
## Strategy 5: The Full Composite (High Conviction)
**Setup Requirements:**
- Composite Short signal ACTIVE
- Minimum 4-5 individual signals
- Clear visual of signal markers clustering
**Entry:**
- Short immediately on composite signal
- Use market order for fast-moving stocks
**Stop Loss:**
- Use indicator's automatic stop level
- Do not deviate from system
**Targets:**
- T1: Indicator's T1 level (1:1)
- T2: Indicator's T2 level (2:1)
**Best Time:** Any time with sufficient signals
---
# Risk Management
## Position Sizing Formula
```
Position Size = (Account Risk %) / (Stop Loss %)
Example:
- Account: $25,000
- Risk per trade: 1% = $250
- Entry: $2.00
- Stop: $2.20 (10% stop)
- Position Size: $250 / 10% = $2,500 worth
- Shares: $2,500 / $2.00 = 1,250 shares
```
## Risk Rules
### The 1% Rule
Never risk more than 1% of your account on any single trade. For a $25,000 account, max risk = $250.
### The 2x Stop Rule
If your stop gets hit twice on the same stock, stop trading it for the day. The pattern isn't working.
### The Daily Loss Limit
Set a maximum daily loss (e.g., 3% of account). Stop trading if hit.
### The Size-Down Rule
After a losing trade, reduce your next position size by 50%. Rebuild after a winner.
## Short-Specific Risks
### The Short Squeeze
- Penny stocks can squeeze violently
- ALWAYS use stops
- Never "hope" a position comes back
- Size appropriately for volatility
### The Hard-to-Borrow
- Check borrow availability before trading
- High borrow fees eat into profits
- Some stocks become HTB mid-trade
### The Halt Risk
- Penny stocks can halt on volatility
- Position size for worst-case halt against you
- Halts can open significantly higher
---
# Best Practices
## DO's
✅ **Wait for multiple signals** - Single signals have lower accuracy
✅ **Trade with the trend** - Short when daily trend is down
✅ **Use the dashboard** - Check signal count before entering
✅ **Respect stops** - The indicator calculates them for a reason
✅ **Size appropriately** - Penny stocks are volatile; position small
✅ **Trade liquid stocks** - Volume ≥ 500K daily average
✅ **Know the catalyst** - Understand why the stock is moving
✅ **Take partial profits** - Secure gains at T1
✅ **Journal your trades** - Track what works and what doesn't
✅ **Time your entries** - Best shorts often come 10:30-11:30 AM
## DON'Ts
❌ **Don't short strong stocks** - If it won't go down, don't force it
❌ **Don't fight the tape** - A stock going up can keep going up
❌ **Don't average up on losers** - Adding to losing shorts is dangerous
❌ **Don't ignore the dashboard** - It exists to help you
❌ **Don't overtrade** - Quality over quantity
❌ **Don't short into news** - Wait for the reaction first
❌ **Don't trade the first 5 minutes** - Too chaotic for reliable signals
❌ **Don't hold overnight** - Penny stock gaps can destroy accounts
❌ **Don't trade without stops** - Ever.
❌ **Don't trade on tilt** - After losses, take a break
## Optimal Trading Windows
| Time (ET) | Quality | Notes |
|-----------|---------|-------|
| 9:30-9:35 | ⭐ | Too volatile, avoid |
| 9:35-10:30 | ⭐⭐⭐⭐⭐ | Best shorts, morning runners exhaust |
| 10:30-11:30 | ⭐⭐⭐⭐ | Secondary exhaustion, HOD rejections |
| 11:30-2:00 | ⭐⭐ | Midday lull, lower quality |
| 2:00-3:00 | ⭐⭐⭐ | Afternoon setups develop |
| 3:00-3:30 | ⭐⭐⭐⭐ | End of day momentum |
| 3:30-4:00 | ⭐⭐ | Closing volatility, risky |
---
# Troubleshooting
## Common Issues
### "Signals aren't appearing"
- Check that the relevant system is enabled in settings
- Ensure minimum signals threshold isn't too high
- Verify the stock has sufficient volume for calculations
### "Too many false signals"
- Increase minimum signals threshold
- Use more conservative settings (see Settings section)
- Focus on stocks with cleaner price action
### "Dashboard not showing"
- Ensure "Show Signal Dashboard" is enabled
- Check that your chart has enough space
- Try a different dashboard position
### "VWAP line is missing"
- VWAP requires intraday timeframes (1m, 5m, 15m, etc.)
- VWAP resets daily; won't show on daily+ charts
- Ensure "Show VWAP Line" is enabled
### "Stop loss seems too tight/wide"
- Adjust Stop ATR Multiple in Risk Management settings
- Lower multiple = tighter stop
- Higher multiple = wider stop
### "Alerts not triggering"
- Verify alert is set to the correct indicator
- Check that alert hasn't expired
- Ensure notification settings are configured in TradingView
## Performance Optimization
If the indicator is slow:
1. Reduce the number of visual elements shown
2. Disable unused signal systems
3. Use on fewer simultaneous charts
4. Close unused browser tabs
---
# Changelog
## Version 1.0 (Initial Release)
- 7 core detection systems implemented
- Real-time signal dashboard
- Automatic risk management calculations
- 7 alert conditions
- Full visual overlay system
- Comprehensive input settings
## Planned Features (Future Updates)
- Scanner integration for multi-stock screening
- Machine learning signal weighting
- Backtesting statistics panel
- Volume profile analysis
- Level 2 data integration (if available)
- Custom timeframe VWAP options
---
# Support & Feedback
## Reporting Issues
When reporting issues, please include:
1. TradingView username
2. Stock symbol and timeframe
3. Screenshot of the issue
4. Your indicator settings
5. Steps to reproduce
## Feature Requests
We welcome suggestions for improving PSSP. Consider:
- What specific pattern are you trying to catch?
- How would this help your trading?
- Any reference examples?
---
# Disclaimer
**IMPORTANT: This indicator is for educational and informational purposes only.**
- Past performance does not guarantee future results
- Short selling carries unlimited risk potential
- Always use proper position sizing and stop losses
- Paper trade before using real capital
- The creator assumes no liability for trading losses
- Consult a financial advisor before trading
**Trade at your own risk.**
---
*Penny Stock Short Signal Pro v1.0*
*Pine Script v6*
*© 2025*

EMA 9/15 AI Buy Sell Signal (KEWME)This strategy is primarily a Trend Following and Scalping strategy. It relies on the crossover of two Exponential Moving Averages (EMA) to identify short-term momentum shifts. The "AI" or "KEWME" part usually refers to the filtering logic added to standard EMAs to reduce false signals during choppy (sideways) markets.
1. Core Components
Fast EMA (Period 9): This tracks the most recent price data very closely. It reacts quickly to price changes.
Slow EMA (Period 15): This acts as the baseline or immediate support/resistance level. It reacts slower than the 9 EMA.
2. Buy Signal Logic (Long Entry)
A Buy signal is generated when the short-term momentum shifts upwards.
Crossover Condition: The EMA 9 (Fast) must cross ABOVE the EMA 15 (Slow).
Candle Confirmation: The candle causing the crossover should ideally close green (bullish) and above both EMA lines.
AI/Filter Logic:
Slope Check: The "AI" logic checks if the slope of the EMA 15 is pointing up. If the lines are flat (horizontal), the signal is often ignored to avoid sideways markets.
Volume: There should be higher than average volume during the crossover to confirm the strength of the move.
Trader's Action: Enter a Buy position immediately after the candle closes.
3. Sell Signal Logic (Short Entry)
A Sell signal is generated when the short-term momentum shifts downwards.
Crossunder Condition: The EMA 9 (Fast) must cross BELOW the EMA 15 (Slow).
Candle Confirmation: The candle causing the crossover should ideally close red (bearish) and below both EMA lines.
AI/Filter Logic:
Slope Check: The "AI" logic checks if the slope of the EMA 15 is pointing down.
Volume: Selling pressure (volume) should be visible.
Trader's Action: Enter a Sell position immediately after the candle closes.
4. The "AI" filtering (Why it is different from basic EMA)
Standard EMA crossovers often fail in "Choppy Markets" (when price moves up and down within a small range), causing losses. The KEWME/AI version usually adds these extra rules:
Range Filter: If the distance between EMA 9 and EMA 15 is very small (the lines are hugging each other), the AI suppresses the signal. It waits for the lines to "fan out" or separate.
Trend Alignment: It might check a higher timeframe (like 200 EMA). If the price is above the 200 EMA, it might only show Buy signals and hide Sell signals (Trend Filtering).
5. Exit Strategy (Stop Loss & Target)
Stop Loss (SL):
For Buy: Just below the recent Swing Low or below the EMA 15.
For Sell: Just above the recent Swing High or above the EMA 15.
Take Profit (TP): usually taken when the EMAs cross back in the opposite direction, or at a 1:1.5 Risk-Reward ratio.

SOFT V2PV_Pivot _Validation FAST_SLOWSOFT V2PV is a market structure indicator based on confirmed price pivots, combining two independent detection engines:
• FAST engine: early detection (more signals, lower reliability)
• SLOW engine: delayed detection (fewer signals, higher reliability)
• CONFIRMED signals: validated when FAST and SLOW agree within a confirmation window
Main features:
- Pivot labels marking structural turning points
- Validation labels displayed on the confirmation candle (not on the pivot bar)
- Configurable vertical stacking for FAST / SLOW / CONFIRMED labels
- Reliability score table (LOW / MED / HIGH)
- Built-in TradingView alerts (FAST, SLOW, CONFIRMED, ANY signal)
Signal interpretation:
LOW (FAST) → aggressive / early signal
MED (SLOW) → more reliable structural signal
HIGH (CONFIRMED) → high-probability setup (FAST + SLOW)
The indicator is designed for intraday and swing trading.
It works on all markets: indices, forex, crypto, commodities, and metals.
⚠️ Important notes:
- Pivot points are confirmed only after a defined number of bars (ZigZag-like logic).
- Signals are plotted only after confirmation.
- No intentional repainting: once a signal is displayed, it does not move or disappear.

ZigZag Volume Profile [ChartPrime]⯁ OVERVIEW
ZigZag Volume Profile combines swing structure with volume analytics by plotting a ZigZag of major price swings and overlaying a detailed volume profile around each swing. At the end of each swing, it highlights the Point of Control (POC) — the price level with the highest traded volume — and extends it forward to identify key areas of potential support or resistance.
⯁ KEY FEATURES
ZigZag Swing Detection:
Automatically detects swing highs and lows based on a user-defined length, creating clean visual segments of market structure.
These segments act as boundaries for volume profile calculations.
swingHigh = ta.highest(swingLength)
swingLow = ta.lowest(swingLength)
ZigZag Channel Visualization:
The ZigZag structure is connected with sloped lines, forming a visual “channel” of the price movement.
The ZigZag can optionally, scaled by ATR.
Volume Profile Around Each Swing:
For every completed swing (high to low or low to high), the indicator constructs a full volume profile using user-defined bin counts.
It scans volume across price levels in the swing and plots histogram-style bins using a gradient color to indicate volume magnitude.
Dynamic Bin Width and Slope Adjustment:
Bins are distributed across a vertical ATR-based range, and their width is adjusted based on the percentage of total swing volume.
The volume fill direction is adapted to the swing’s slope for visually aligned plotting.
POC Detection and Extension:
The highest volume bin in each swing is identified as the Point of Control (POC).
This level is plotted with a thicker line and extended horizontally into the future as a key reaction level.
Automatic POC Expiry on Price Interaction:
POC lines are continuously extended unless breached by price.
When price crosses the POC level, the extension is terminated — signaling that the level may have been absorbed.
Clean Volume Bin Visualization:
Bin colors range from green (low volume) to blue (higher volume), with the POC always marked in red by default for easy identification.
Volume percentages are optionally labeled at each bin level.
Flexible Swing Profile Parameters:
Users can control:
Number of volume bins
Bin width
Channel width (ATR factor)
Visibility of the swing channel or POC lines
Efficient Memory Handling:
Old POC lines and volume profiles are automatically removed from memory after a threshold to keep charts clean and performant.
⯁ USAGE
Use ZigZag swings to define market structure visually.
Analyze volume profile around each swing to understand where most trading activity occurred.
Use POC extensions as dynamic support/resistance zones for entries, stops, or take-profits.
Watch for price interaction with extended POC lines — breaks may suggest absorbed liquidity or breakout potential.
Use the ATR-based channel width to adapt profiles based on market volatility.
⯁ CONCLUSION
ZigZag Volume Profile offers a powerful fusion of structure and volume. By plotting detailed volume profiles over each price swing and extending the POC as actionable S/R levels, this tool provides deep insight into market participation zones — giving traders a tactical edge in both ranging and trending environments.

Elliott Wave Rule EngineWhat this tool does
The indicator scans price for two concurrent swing structures—a Small (shorter-degree) and a Large (higher-degree) set—then applies an Elliott/NeoWave rule engine to the most recent 5-swing motive (1-2-3-4-5) or 3-swing corrective (A-B-C). It produces:
Blue lines for Small swings and Orange lines for Large swings.
A rule dashboard (optional) showing PASS/FAIL/WARN for core rules & guidelines.
Buy/Sell labels when (a) a valid motive completes and (b) loop “consensus,” alignment, and scoring gates are satisfied.
Reading the chart
Small swings: thin blue segments, built from your Small settings.
Large swings: thicker orange segments, from your Large settings.
Background tint: faint green when a motive (impulse/diagonal) is valid right now on Small.
Labels (if enabled):
“1…5” or “A-B-C” markers on the latest detected structure.
Buy/Sell label at the last pivot when all gates pass; text may include a score %.
How it works
For both Small and Large degrees the script:
- Loops over all (left, right) combinations you specify (e.g., Small Left = 3..6, Right = 0..0) and calls ta.pivothigh/low.
- Aggregates the results:
- Keeps the most extreme pivot found in the loop (highest high or lowest low) that’s newer than the last accepted swing.
- Gates acceptance by minimum % change versus the last opposite swing (inside the loop) and a post-aggregation filter (Small Minimum swing %, Large Minimum swing %).
- Merges back-to-back same-type swings (HH or LL) by keeping only the more extreme one.
- Keeps only the last N=lookbackWaves swings (default 100).
- Consensus (used for signals) comes from the loop counts:
- sBuyConsensus = small L-count / total-combos (bullish bias)
- sSellConsensus = small H-count / total-combos (bearish bias)
(and the same for Large). This is a data-driven “how many combos agreed” measure.
2) Rule engine (Impulse/Diagonal vs. Corrective)
When there are at least 6 Small swings, the engine tests 1-2-3-4-5:
Hard rules (must pass for an Impulse):
- Wave-2 not > 100% of Wave-1 (no retrace beyond start of W1).
- Wave-3 not the shortest among 1,3,5.
- Wave-4 doesn’t overlap Wave-1 (if it does, structure may be a Diagonal).
- Diagonal eligibility: Rules 1 & 2 pass but Rule 3 fails ⇒ eligible as a Diagonal (
Guidelines (7 checks, count toward a threshold you set):
- W2 retraces a Fib level (within ±fibTol).
- W4 retraces a Fib level (within ±fibTol).
- W3 strongest momentum (speed = |Δprice| / bars).
- Alternation: W2 vs W4 have meaningfully different “sharpness” (price per bar), threshold altSlopeThr.
- Proportion (Price): |W1| and |W3| within propTolP× each other.
- Proportion (Time): W1W3 and W2W4 durations within propTolT×.
- W5 weaker than W3 (momentum divergence proxy).
A Motive is valid if:
- Impulse: all 3 hard rules pass and guideline passes ≥ Min guideline passes.
- Diagonal: diagonal-eligible and guideline passes ≥ Min guideline passes.
- if motive fails, the engine still evaluates ABC as Zigzag and Flat to populate the table:
- Zigzag: B shallower than ~0.618A; C ≈ A or 1.618A (±fibTol).
- Flat: B ≥ ~0.9A; expanded flat if B > 1.0A and C in *A; “running” note if C < A.
3) Signal logic (consensus-gated & scored)
Signals fire only on new Small pivots and only if a Small motive just validated:Direction comes from the motive’s W1 (up = bull, down = bear).
Consensus checks (from the loop):
Use Sell consensus if the last pivot is a High, or Buy consensus if it’s a Low.Require it ≥ Min SMALL loop consensus and ahead of the opposite side by at least Min consensus margin.If you also require Large quality: check the corresponding Large consensus ≥ Min LARGE loop consensus.
Alignment: If Require small/large directional alignment is ON, Small and Large directions must match (or the Large motive must be complete).
Score:
- If Large not required: finalScore = smallConsensus × smallQuality.
- If Large required: finalScore = smallConsensus × smallQuality × largeQuality.
- Need finalScore ≥ Min final score.
When all gates pass, you’ll see “Buy xx%” or “Sell xx%” at the pivot.
Inputs (explained):
- Smaller Wave Swing Detection (Looped)
- Small Left Min / Max (default 3..6): ta.pivot* left widths to scan.
- Small Right Min / Max (default 0..0): right widths to scan (0 = earliest confirmation).
- Small Minimum swing % (post-aggregation) (0.3%): filters out tiny swings after the loop.
- Larger Wave Swing Detection (Looped)
- Large Left Min / Max (100..200) and Right Min/Max (0..0): higher-degree scan (defaults are big; adjust for intraday).
- Large Minimum swing % (post-aggregation) (1.5%).
- Loop Filters (inside the loop)
- Small loop min % change (0.20%): a candidate pivot counts only if move vs. last opposite Small swing ≥ this.
- Large loop min % change (1.50%): same idea for Large.
Rule Engine Tolerances
- Fibonacci tolerance (±%) (0.05 = 5%): closeness to Fib levels.
-Same-degree TIME proportion max (x) (2.00×) and PRICE proportion max (x) (3.00×).
- Alternation slope ratio threshold (0.10): higher = stricter alternation.
- Min guideline passes (0–7) (5): threshold for motive validity.
- Signal Probability (Loop Consensus)
- Min SMALL loop consensus (0.60).
- Min LARGE loop consensus (0.50) (used only if Large validation matters).
- Min consensus margin vs opposite (0.10): e.g., 0.60 vs 0.45 fails (margin 0.15 passes).
Require LARGE 1–5 valid (or diagonal) for signal (off by default).
Min final score (0.20): gate on the composite score.
Annotate label with score % (on).
WARN (orange): guideline not met—pattern can still be valid if total passes ≥ Min guideline passes.
FAQ
Q: Why did I get a diagonal instead of an impulse?
A: Wave-4 overlapped Wave-1 (Rule 3). If Rules 1 & 2 pass and guidelines meet your minimum, it’s eligible as a Diagonal.
Q: Where do Buy/Sell labels come from?
A: Only after a valid Small motive at a new pivot, and only if consensus, alignment, and final score gates pass (per your settings).
Q: It “missed” a wave in hindsight.
A: Pivots require right bars to confirm; extremely tight settings can filter that swing; adjust Small min % or ranges.
Q: Are there repaints?
A: No, It uses standard pivot confirmation; until a pivot is confirmed, recent swings can evolve. After confirmation, lines/labels are stable.
Limitations & disclaimers
Elliott/NeoWave rules are heuristics; markets are messy. Treat outputs as structured context, not certainty.
Consensus is pattern-scan agreement, not probability of profit Not investment advice; always couple with risk management.

TraderDemircan Auto Fibonacci RetracementDescription:
What This Indicator Does:This indicator automatically identifies significant swing high and swing low points within a customizable lookback period and draws comprehensive Fibonacci retracement and extension levels between them. Unlike the manual Fibonacci tool that requires you to constantly redraw levels as price action evolves, this automated version continuously updates the Fibonacci grid based on the most recent major swing points, ensuring you always have current and relevant support/resistance zones displayed on your chart.Key Features:
Automatic Swing Detection: Continuously scans the specified lookback period to find the most significant high and low points, eliminating manual drawing errors
Comprehensive Level Coverage: Plots 16 Fibonacci levels including 7 retracement levels (0.0 to 1.0) and 9 extension levels (1.115 to 3.618)
Top-Down Methodology: Draws from swing high to swing low (right-to-left), following the traditional Fibonacci retracement convention where 100% is at the top
Dual Labeling System: Shows both exact price values and Fibonacci percentages for easy reference
Complete Customization: Individual toggle controls and color selection for each of the 16 levels
Flexible Display Options: Adjust line thickness (1-5), style (solid/dashed/dotted), and extension direction (left/right/both)
Visual Swing Markers: Red diamond at the swing high (starting point) and green diamond at the swing low (ending point)
Optional Trend Line: Connects the two swing points to visualize the overall price movement direction
How It Works:The indicator employs a sophisticated swing point detection algorithm that operates in two stages:Stage 1 - Find the Swing Low (Support Base):
Scans the entire lookback period to identify the lowest low, which becomes the anchor point (0.0 level in traditional retracement terms, though displayed at the bottom of the grid).Stage 2 - Find the Swing High (Resistance Peak):
After identifying the swing low, searches for the highest high that occurred after that low point, establishing the swing range. This creates a valid price movement range for Fibonacci analysis.Fibonacci Calculation Method:
The indicator uses the top-down approach where:
1.0 Level = Swing High (100% retracement, the top)
0.0 Level = Swing Low (0% retracement, the bottom)
Retracement Levels (0.236 to 0.786) = Potential support zones during pullbacks from the high
Extension Levels (1.115 to 3.618) = Potential target zones below the swing low
Formula: Price = SwingHigh - (SwingHigh - SwingLow) × FibonacciLevelThis ensures that 0.0 is at the bottom and extensions (>1.0) plot below the swing low, following standard Fibonacci retracement convention.Fibonacci Levels Explained:Retracement Levels (0.0 - 1.0):
0.0 (Gray): Swing low - the base support level
0.236 (Red): Shallow retracement, first minor support
0.382 (Orange): Moderate retracement, commonly watched support
0.5 (Purple): Psychological midpoint, significant support/resistance
0.618 (Blue - Golden Ratio): The most important retracement level, high-probability reversal zone
0.786 (Cyan): Deep retracement, last defense before full reversal
1.0 (Gray): Swing high - the initial resistance level
Extension Levels (1.115 - 3.618):
1.115 (Green): First extension, minimal downside target
1.272 (Light Green): Minor extension, common profit target
1.414 (Yellow-Green): Square root of 2, mathematical significance
1.618 (Gold - Golden Extension): Primary downside target, most watched extension level
2.0 (Orange-Red): 200% extension, psychological round number
2.382 (Pink): Secondary extension target
2.618 (Purple): Deep extension, major target zone
3.272 (Deep Purple): Extreme extension level
3.618 (Blue): Maximum extension, rare but powerful target
How to Use:For Retracement Trading (Buying Pullbacks in Uptrends):
Wait for price to make a significant move up from swing low to swing high
When price starts pulling back, watch for reactions at key Fibonacci levels
Most common entry zones: 0.382, 0.5, and especially 0.618 (golden ratio)
Enter long positions when price shows reversal signals (candlestick patterns, volume increase) at these levels
Place stop loss below the next Fibonacci level
Target: Return to swing high or higher extension levels
For Extension Trading (Profit Targets):
After price breaks below the swing low (0.0 level), use extensions as profit targets
First target: 1.272 (conservative)
Primary target: 1.618 (golden extension - most commonly reached)
Extended target: 2.618 (for strong trends)
Extreme target: 3.618 (only in powerful trending moves)
For Counter-Trend Trading (Fading Extremes):
When price reaches deep retracements (0.786 or below), look for exhaustion signals
Watch for divergences between price and momentum indicators at these levels
Enter reversal trades with tight stops below the swing low
Target: 0.5 or 0.382 levels on the bounce
For Trend Continuation:
In strong uptrends, shallow retracements (0.236 to 0.382) often hold
Use these as low-risk entry points to join the existing trend
Failure to hold 0.5 suggests weakening momentum
Breaking below 0.618 often indicates trend reversal, not just retracement
Multi-Timeframe Strategy:
Use daily timeframe Fibonacci for major support/resistance zones
Use 4H or 1H Fibonacci for precise entry timing within those zones
Confluence between multiple timeframe Fibonacci levels creates high-probability zones
Example: Daily 0.618 level aligning with 4H 0.5 level = strong support
Settings Guide:Lookback Period (10-500):
Short (20-50): Captures recent swings, more frequent updates, suited for day trading
Medium (50-150): Balanced approach, good for swing trading (default: 100)
Long (150-500): Identifies major market structure, suited for position trading
Higher values = more stable levels but slower to adapt to new trends
Pivot Sensitivity (1-20):
Controls how many candles are required to confirm a swing point
Low (1-5): More sensitive, identifies minor swings (default: 5)
High (10-20): Less sensitive, only major swings qualify
Use higher sensitivity on lower timeframes to filter noise
Individual Level Toggles:
Enable only the levels you actively trade to reduce chart clutter
Common minimalist setup: Show only 0.382, 0.5, 0.618, 1.0, 1.618, 2.618
Comprehensive setup: Enable all levels for maximum information
Visual Customization:
Line Thickness: Thicker lines (3-5) for presentation, thinner (1-2) for trading
Line Style: Solid for primary levels (0.5, 0.618, 1.618), dashed/dotted for secondary
Price Labels: Essential for knowing exact entry/exit prices
Percent Labels: Helpful for quickly identifying which Fibonacci level you're looking at
Extension Direction: Extend right for forward-looking analysis, left for historical context
What Makes This Original:While Fibonacci indicators are common on TradingView, this script's originality comes from:
Intelligent Two-Stage Detection: Unlike simple high/low finders, this uses a sequential approach (find low first, then find the high that occurred after it), ensuring logical price flow representation
Comprehensive Level Set: Includes 16 levels spanning from retracement to extreme extensions, more than most Fibonacci tools
Top-Down Methodology: Properly implements the traditional Fibonacci retracement convention (high to low) rather than the reverse
Automatic Range Validation: Only draws Fibonacci when both swing points are valid and in the correct temporal order
Dual Extension Options: Separate controls for extending lines left (historical context) and right (forward projection)
Smart Label Positioning: Places percentage labels on the left and price labels on the right for clarity
Visual Swing Confirmation: Diamond markers at swing points help users understand why levels are positioned where they are
Important Considerations:
Historical Nature: Fibonacci retracements are based on past price swings; they don't predict future moves, only suggest potential support/resistance
Self-Fulfilling Prophecy: Fibonacci levels work partly because many traders watch them, creating actual support/resistance at those levels
Not All Levels Hold: In strong trends, price may slice through multiple Fibonacci levels without pausing
Context Matters: Fibonacci works best when aligned with other support/resistance (previous highs/lows, moving averages, trendlines)
Volume Confirmation: The most reliable Fibonacci reversals occur with volume spikes at key levels
Dynamic Updates: The levels will redraw as new swing highs/lows form, so don't rely solely on static screenshots
Best Practices:
Don't Trade Blindly: Fibonacci levels are zones, not exact prices. Look for confirmation (candlestick patterns, indicators, volume)
Combine with Price Action: Watch for pin bars, engulfing candles, or doji at key Fibonacci levels
Use Stop Losses: Place stops beyond the next Fibonacci level to give trades room but limit risk
Scale In/Out: Consider entering partial positions at 0.5 and adding more at 0.618 rather than all-in at one level
Check Multiple Timeframes: Daily Fibonacci + 4H Fibonacci convergence = high-probability zone
Respect the 0.618: This golden ratio level is historically the most reliable for reversals
Extensions Need Strong Trends: Don't expect extensions to be hit unless there's clear momentum beyond the swing low
Optimal Timeframes:
Scalping (1-5 minutes): Lookback 20-30, watch 0.382, 0.5, 0.618 only
Day Trading (15m-1H): Lookback 50-100, all retracement levels important
Swing Trading (4H-Daily): Lookback 100-200, focus on 0.5, 0.618, 0.786, and extensions
Position Trading (Daily-Weekly): Lookback 200-500, all levels relevant for long-term planning
Common Fibonacci Trading Mistakes to Avoid:
Wrong Swing Selection: Choosing insignificant swings produces meaningless levels
Premature Entry: Entering as soon as price touches a Fibonacci level without confirmation
Ignoring Trend: Fighting the main trend by buying deep retracements in downtrends
Over-Reliance: Using Fibonacci in isolation without confirming with other technical factors
Static Analysis: Not updating your Fibonacci as market structure evolves
Arbitrary Lookback: Using the same lookback period for all assets and timeframes
Integration with Other Tools:Fibonacci + Moving Averages:
When 0.618 level aligns with 50 or 200 EMA, confluence creates stronger support
Price bouncing from both Fibonacci and MA simultaneously = high-probability trade
Fibonacci + RSI/Stochastic:
Oversold indicators at 0.618 or deeper retracements = strong buy signal
Overbought indicators at swing high (1.0) = potential reversal warning
Fibonacci + Volume Profile:
High-volume nodes aligning with Fibonacci levels create robust support/resistance
Low-volume areas near Fibonacci levels may see rapid price movement through them
Fibonacci + Trendlines:
Fibonacci retracement level + ascending trendline = double support
Breaking both simultaneously confirms trend change
Technical Notes:
Uses ta.lowest() and ta.highest() for efficient swing detection across the lookback period
Implements dynamic line and label arrays for clean redraws without memory leaks
All calculations update in real-time as new bars form
Extension options allow customization without modifying core code
Format.mintick ensures price labels match the symbol's minimum price increment
Tooltip on swing markers shows exact price values for precision

BUZARA// © Buzzara
// =================================
// PLEASE SUPPORT THE TEAM
// =================================
//
// Telegram: t.me
// =================================
//@version=5
VERSION = ' Buzzara2.0'
strategy('ALGOX V6_1_24', shorttitle = '🚀〄 Buzzara2.0 〄🚀'+ VERSION, overlay = true, explicit_plot_zorder = true, pyramiding = 0, default_qty_type = strategy.percent_of_equity, initial_capital = 1000, default_qty_value = 1, calc_on_every_tick = false, process_orders_on_close = true)
G_SCRIPT01 = '■ ' + 'SAIYAN OCC'
//#region ———— <↓↓↓ G_SCRIPT01 ↓↓↓> {
// === INPUTS ===
res = input.timeframe('15', 'TIMEFRAME', group ="NON REPAINT")
useRes = input(true, 'Use Alternate Signals')
intRes = input(10, 'Multiplier for Alernate Signals')
basisType = input.string('ALMA', 'MA Type: ', options= )
basisLen = input.int(50, 'MA Period', minval=1)
offsetSigma = input.int(5, 'Offset for LSMA / Sigma for ALMA', minval=0)
offsetALMA = input.float(2, 'Offset for ALMA', minval=0, step=0.01)
scolor = input(false, 'Show coloured Bars to indicate Trend?')
delayOffset = input.int(0, 'Delay Open/Close MA', minval=0, step=1,
tooltip = 'Forces Non-Repainting')
tradeType = input.string('BOTH', 'What trades should be taken : ',
options = )
//=== /INPUTS ===
h = input(false, 'Signals for Heikin Ashi Candles')
//INDICATOR SETTINGS
swing_length = input.int(10, 'Swing High/Low Length', group = 'Settings', minval = 1, maxval = 50)
history_of_demand_to_keep = input.int(20, 'History To Keep', minval = 5, maxval = 50)
box_width = input.float(2.5, 'Supply/Demand Box Width', group = 'Settings', minval = 1, maxval = 10, step = 0.5)
//INDICATOR VISUAL SETTINGS
show_zigzag = input.bool(false, 'Show Zig Zag', group = 'Visual Settings', inline = '1')
show_price_action_labels = input.bool(false, 'Show Price Action Labels', group = 'Visual Settings', inline = '2')
supply_color = input.color(#00000000, 'Supply', group = 'Visual Settings', inline = '3')
supply_outline_color = input.color(#00000000, 'Outline', group = 'Visual Settings', inline = '3')
demand_color = input.color(#00000000, 'Demand', group = 'Visual Settings', inline = '4')
demand_outline_color = input.color(#00000000, 'Outline', group = 'Visual Settings', inline = '4')
bos_label_color = input.color(#00000000, 'BOS Label', group = 'Visual Settings', inline = '5')
poi_label_color = input.color(#00000000, 'POI Label', group = 'Visual Settings', inline = '7')
poi_border_color = input.color(#00000000, 'POI border', group = 'Visual Settings', inline = '7')
swing_type_color = input.color(#00000000, 'Price Action Label', group = 'Visual Settings', inline = '8')
zigzag_color = input.color(#00000000, 'Zig Zag', group = 'Visual Settings', inline = '9')
//END SETTINGS
// FUNCTION TO ADD NEW AND REMOVE LAST IN ARRAY
f_array_add_pop(array, new_value_to_add) =>
array.unshift(array, new_value_to_add)
array.pop(array)
// FUNCTION SWING H & L LABELS
f_sh_sl_labels(array, swing_type) =>
var string label_text = na
if swing_type == 1
if array.get(array, 0) >= array.get(array, 1)
label_text := 'HH'
else
label_text := 'LH'
label.new(
bar_index - swing_length,
array.get(array,0),
text = label_text,
style = label.style_label_down,
textcolor = swing_type_color,
color = swing_type_color,
size = size.tiny)
else if swing_type == -1
if array.get(array, 0) >= array.get(array, 1)
label_text := 'HL'
else
label_text := 'LL'
label.new(
bar_index - swing_length,
array.get(array,0),
text = label_text,
style = label.style_label_up,
textcolor = swing_type_color,
color = swing_type_color,
size = size.tiny)
// FUNCTION MAKE SURE SUPPLY ISNT OVERLAPPING
f_check_overlapping(new_poi, box_array, atrValue) =>
atr_threshold = atrValue * 2
okay_to_draw = true
for i = 0 to array.size(box_array) - 1
top = box.get_top(array.get(box_array, i))
bottom = box.get_bottom(array.get(box_array, i))
poi = (top + bottom) / 2
upper_boundary = poi + atr_threshold
lower_boundary = poi - atr_threshold
if new_poi >= lower_boundary and new_poi <= upper_boundary
okay_to_draw := false
break
else
okay_to_draw := true
okay_to_draw
// FUNCTION TO DRAW SUPPLY OR DEMAND ZONE
f_supply_demand(value_array, bn_array, box_array, label_array, box_type, atrValue) =>
atr_buffer = atrValue * (box_width / 10)
box_left = array.get(bn_array, 0)
box_right = bar_index
var float box_top = 0.00
var float box_bottom = 0.00
var float poi = 0.00
if box_type == 1
box_top := array.get(value_array, 0)
box_bottom := box_top - atr_buffer
poi := (box_top + box_bottom) / 2
else if box_type == -1
box_bottom := array.get(value_array, 0)
box_top := box_bottom + atr_buffer
poi := (box_top + box_bottom) / 2
okay_to_draw = f_check_overlapping(poi, box_array, atrValue)
// okay_to_draw = true
//delete oldest box, and then create a new box and add it to the array
if box_type == 1 and okay_to_draw
box.delete( array.get(box_array, array.size(box_array) - 1) )
f_array_add_pop(box_array, box.new( left = box_left, top = box_top, right = box_right, bottom = box_bottom, border_color = supply_outline_color,
bgcolor = supply_color, extend = extend.right, text = 'SUPPLY', text_halign = text.align_center, text_valign = text.align_center, text_color = poi_label_color, text_size = size.small, xloc = xloc.bar_index))
box.delete( array.get(label_array, array.size(label_array) - 1) )
f_array_add_pop(label_array, box.new( left = box_left, top = poi, right = box_right, bottom = poi, border_color = poi_border_color,
bgcolor = poi_border_color, extend = extend.right, text = 'POI', text_halign = text.align_left, text_valign = text.align_center, text_color = poi_label_color, text_size = size.small, xloc = xloc.bar_index))
else if box_type == -1 and okay_to_draw
box.delete( array.get(box_array, array.size(box_array) - 1) )
f_array_add_pop(box_array, box.new( left = box_left, top = box_top, right = box_right, bottom = box_bottom, border_color = demand_outline_color,
bgcolor = demand_color, extend = extend.right, text = 'DEMAND', text_halign = text.align_center, text_valign = text.align_center, text_color = poi_label_color, text_size = size.small, xloc = xloc.bar_index))
box.delete( array.get(label_array, array.size(label_array) - 1) )
f_array_add_pop(label_array, box.new( left = box_left, top = poi, right = box_right, bottom = poi, border_color = poi_border_color,
bgcolor = poi_border_color, extend = extend.right, text = 'POI', text_halign = text.align_left, text_valign = text.align_center, text_color = poi_label_color, text_size = size.small, xloc = xloc.bar_index))
// FUNCTION TO CHANGE SUPPLY/DEMAND TO A BOS IF BROKEN
f_sd_to_bos(box_array, bos_array, label_array, zone_type) =>
if zone_type == 1
for i = 0 to array.size(box_array) - 1
level_to_break = box.get_top(array.get(box_array,i))
// if ta.crossover(close, level_to_break)
if close >= level_to_break
copied_box = box.copy(array.get(box_array,i))
f_array_add_pop(bos_array, copied_box)
mid = (box.get_top(array.get(box_array,i)) + box.get_bottom(array.get(box_array,i))) / 2
box.set_top(array.get(bos_array,0), mid)
box.set_bottom(array.get(bos_array,0), mid)
box.set_extend( array.get(bos_array,0), extend.none)
box.set_right( array.get(bos_array,0), bar_index)
box.set_text( array.get(bos_array,0), 'BOS' )
box.set_text_color( array.get(bos_array,0), bos_label_color)
box.set_text_size( array.get(bos_array,0), size.small)
box.set_text_halign( array.get(bos_array,0), text.align_center)
box.set_text_valign( array.get(bos_array,0), text.align_center)
box.delete(array.get(box_array, i))
box.delete(array.get(label_array, i))
if zone_type == -1
for i = 0 to array.size(box_array) - 1
level_to_break = box.get_bottom(array.get(box_array,i))
// if ta.crossunder(close, level_to_break)
if close <= level_to_break
copied_box = box.copy(array.get(box_array,i))
f_array_add_pop(bos_array, copied_box)
mid = (box.get_top(array.get(box_array,i)) + box.get_bottom(array.get(box_array,i))) / 2
box.set_top(array.get(bos_array,0), mid)
box.set_bottom(array.get(bos_array,0), mid)
box.set_extend( array.get(bos_array,0), extend.none)
box.set_right( array.get(bos_array,0), bar_index)
box.set_text( array.get(bos_array,0), 'BOS' )
box.set_text_color( array.get(bos_array,0), bos_label_color)
box.set_text_size( array.get(bos_array,0), size.small)
box.set_text_halign( array.get(bos_array,0), text.align_center)
box.set_text_valign( array.get(bos_array,0), text.align_center)
box.delete(array.get(box_array, i))
box.delete(array.get(label_array, i))
// FUNCTION MANAGE CURRENT BOXES BY CHANGING ENDPOINT
f_extend_box_endpoint(box_array) =>
for i = 0 to array.size(box_array) - 1
box.set_right(array.get(box_array, i), bar_index + 100)
//
stratRes = timeframe.ismonthly ? str.tostring(timeframe.multiplier * intRes, '###M') :
timeframe.isweekly ? str.tostring(timeframe.multiplier * intRes, '###W') :
timeframe.isdaily ? str.tostring(timeframe.multiplier * intRes, '###D') :
timeframe.isintraday ? str.tostring(timeframe.multiplier * intRes, '####') :
'60'
src = h ? request.security(ticker.heikinashi(syminfo.tickerid),
timeframe.period, close, lookahead = barmerge.lookahead_off) : close
// CALCULATE ATR
atrValue = ta.atr(50)
// CALCULATE SWING HIGHS & SWING LOWS
swing_high = ta.pivothigh(high, swing_length, swing_length)
swing_low = ta.pivotlow(low, swing_length, swing_length)
// ARRAYS FOR SWING H/L & BN
var swing_high_values = array.new_float(5,0.00)
var swing_low_values = array.new_float(5,0.00)
var swing_high_bns = array.new_int(5,0)
var swing_low_bns = array.new_int(5,0)
// ARRAYS FOR SUPPLY / DEMAND
var current_supply_box = array.new_box(history_of_demand_to_keep, na)
var current_demand_box = array.new_box(history_of_demand_to_keep, na)
// ARRAYS FOR SUPPLY / DEMAND POI LABELS
var current_supply_poi = array.new_box(history_of_demand_to_keep, na)
var current_demand_poi = array.new_box(history_of_demand_to_keep, na)
// ARRAYS FOR BOS
var supply_bos = array.new_box(5, na)
var demand_bos = array.new_box(5, na)
//END CALCULATIONS
// NEW SWING HIGH
if not na(swing_high)
//MANAGE SWING HIGH VALUES
f_array_add_pop(swing_high_values, swing_high)
f_array_add_pop(swing_high_bns, bar_index )
if show_price_action_labels
f_sh_sl_labels(swing_high_values, 1)
f_supply_demand(swing_high_values, swing_high_bns, current_supply_box, current_supply_poi, 1, atrValue)
// NEW SWING LOW
else if not na(swing_low)
//MANAGE SWING LOW VALUES
f_array_add_pop(swing_low_values, swing_low)
f_array_add_pop(swing_low_bns, bar_index )
if show_price_action_labels
f_sh_sl_labels(swing_low_values, -1)
f_supply_demand(swing_low_values, swing_low_bns, current_demand_box, current_demand_poi, -1, atrValue)
f_sd_to_bos(current_supply_box, supply_bos, current_supply_poi, 1)
f_sd_to_bos(current_demand_box, demand_bos, current_demand_poi, -1)
f_extend_box_endpoint(current_supply_box)
f_extend_box_endpoint(current_demand_box)
channelBal = input.bool(false, "Channel Balance", group = "CHART")
lr_slope(_src, _len) =>
x = 0.0, y = 0.0, x2 = 0.0, xy = 0.0
for i = 0 to _len - 1
val = _src
per = i + 1
x += per
y += val
x2 += per * per
xy += val * per
_slp = (_len * xy - x * y) / (_len * x2 - x * x)
_avg = y / _len
_int = _avg - _slp * x / _len + _slp
lr_dev(_src, _len, _slp, _avg, _int) =>
upDev = 0.0, dnDev = 0.0
val = _int
for j = 0 to _len - 1
price = high - val
if price > upDev
upDev := price
price := val - low
if price > dnDev
dnDev := price
price := _src
val += _slp
//
= ta.kc(close, 80, 10.5)
= ta.kc(close, 80, 9.5)
= ta.kc(close, 80, 8)
= ta.kc(close, 80, 3)
barsL = 10
barsR = 10
pivotHigh = fixnan(ta.pivothigh(barsL, barsR) )
pivotLow = fixnan(ta.pivotlow(barsL, barsR) )
source = close, period = 150
= lr_slope(source, period)
= lr_dev(source, period, s, a, i)
y1 = low - (ta.atr(30) * 2), y1B = low - ta.atr(30)
y2 = high + (ta.atr(30) * 2), y2B = high + ta.atr(30)
x1 = bar_index - period + 1, _y1 = i + s * (period - 1), x2 = bar_index, _y2 = i
//Functions
//Line Style function
get_line_style(style) =>
out = switch style
'???' => line.style_solid
'----' => line.style_dashed
' ' => line.style_dotted
//Function to get order block coordinates
get_coordinates(condition, top, btm, ob_val)=>
var ob_top = array.new_float(0)
var ob_btm = array.new_float(0)
var ob_avg = array.new_float(0)
var ob_left = array.new_int(0)
float ob = na
//Append coordinates to arrays
if condition
avg = math.avg(top, btm)
array.unshift(ob_top, top)
array.unshift(ob_btm, btm)
array.unshift(ob_avg, avg)
ob := ob_val
//Function to remove mitigated order blocks from coordinate arrays
remove_mitigated(ob_top, ob_btm, ob_left, ob_avg, target, bull)=>
mitigated = false
target_array = bull ? ob_btm : ob_top
for element in target_array
idx = array.indexof(target_array, element)
if (bull ? target < element : target > element)
mitigated := true
array.remove(ob_top, idx)
array.remove(ob_btm, idx)
array.remove(ob_avg, idx)
array.remove(ob_left, idx)
mitigated
//Function to set order blocks
set_order_blocks(ob_top, ob_btm, ob_left, ob_avg, ext_last, bg_css, border_css, lvl_css)=>
var ob_box = array.new_box(0)
var ob_lvl = array.new_line(0)
//Global elements
var os = 0
var target_bull = 0.
var target_bear = 0.
// Create non-repainting security function
rp_security(_symbol, _res, _src) =>
request.security(_symbol, _res, _src )
htfHigh = rp_security(syminfo.tickerid, res, high)
htfLow = rp_security(syminfo.tickerid, res, low)
// Main Indicator
// Functions
smoothrng(x, t, m) =>
wper = t * 2 - 1
avrng = ta.ema(math.abs(x - x ), t)
smoothrng = ta.ema(avrng, wper) * m
rngfilt(x, r) =>
rngfilt = x
rngfilt := x > nz(rngfilt ) ? x - r < nz(rngfilt ) ? nz(rngfilt ) : x - r : x + r > nz(rngfilt ) ? nz(rngfilt ) : x + r
percWidth(len, perc) => (ta.highest(len) - ta.lowest(len)) * perc / 100
securityNoRep(sym, res, src) => request.security(sym, res, src, barmerge.gaps_off, barmerge.lookahead_on)
swingPoints(prd) =>
pivHi = ta.pivothigh(prd, prd)
pivLo = ta.pivotlow (prd, prd)
last_pivHi = ta.valuewhen(pivHi, pivHi, 1)
last_pivLo = ta.valuewhen(pivLo, pivLo, 1)
hh = pivHi and pivHi > last_pivHi ? pivHi : na
lh = pivHi and pivHi < last_pivHi ? pivHi : na
hl = pivLo and pivLo > last_pivLo ? pivLo : na
ll = pivLo and pivLo < last_pivLo ? pivLo : na
f_chartTfInMinutes() =>
float _resInMinutes = timeframe.multiplier * (
timeframe.isseconds ? 1 :
timeframe.isminutes ? 1. :
timeframe.isdaily ? 60. * 24 :
timeframe.isweekly ? 60. * 24 * 7 :
timeframe.ismonthly ? 60. * 24 * 30.4375 : na)
f_kc(src, len, sensitivity) =>
basis = ta.sma(src, len)
span = ta.atr(len)
wavetrend(src, chlLen, avgLen) =>
esa = ta.ema(src, chlLen)
d = ta.ema(math.abs(src - esa), chlLen)
ci = (src - esa) / (0.015 * d)
wt1 = ta.ema(ci, avgLen)
wt2 = ta.sma(wt1, 3)
f_top_fractal(_src) => _src < _src and _src < _src and _src > _src and _src > _src
f_bot_fractal(_src) => _src > _src and _src > _src and _src < _src and _src < _src
top_fractal = f_top_fractal(src)
bot_fractal = f_bot_fractal(src)
f_fractalize (_src) => top_fractal ? 1 : bot_fractal ? -1 : 0
f_findDivs(src, topLimit, botLimit) =>
fractalTop = f_fractalize(src) > 0 and src >= topLimit ? src : na
fractalBot = f_fractalize(src) < 0 and src <= botLimit ? src : na
highPrev = ta.valuewhen(fractalTop, src , 0)
highPrice = ta.valuewhen(fractalTop, high , 0)
lowPrev = ta.valuewhen(fractalBot, src , 0)
lowPrice = ta.valuewhen(fractalBot, low , 0)
bearSignal = fractalTop and high > highPrice and src < highPrev
bullSignal = fractalBot and low < lowPrice and src > lowPrev
// Get user input
enableSR = input(false , "SR On/Off", group="SR")
colorSup = input(#00000000 , "Support Color", group="SR")
colorRes = input(#00000000 , "Resistance Color", group="SR")
strengthSR = input.int(2 , "S/R Strength", 1, group="SR")
lineStyle = input.string("Dotted", "Line Style", , group="SR")
lineWidth = input.int(2 , "S/R Line Width", 1, group="SR")
useZones = input(true , "Zones On/Off", group="SR")
useHLZones = input(true , "High Low Zones On/Off", group="SR")
zoneWidth = input.int(2 , "Zone Width %", 0,
tooltip = "it's calculated using % of the distance between highest/lowest in last 300 bars", group="SR")
expandSR = input(true , "Expand SR")
// Get components
rb = 10
prd = 284
ChannelW = 10
label_loc = 55
style = lineStyle == "Solid" ? line.style_solid :
lineStyle == "Dotted" ? line.style_dotted : line.style_dashed
ph = ta.pivothigh(rb, rb)
pl = ta.pivotlow (rb, rb)
sr_levels = array.new_float(21, na)
prdhighest = ta.highest(prd)
prdlowest = ta.lowest(prd)
cwidth = percWidth(prd, ChannelW)
zonePerc = percWidth(300, zoneWidth)
aas = array.new_bool(41, true)
u1 = 0.0, u1 := nz(u1 )
d1 = 0.0, d1 := nz(d1 )
highestph = 0.0, highestph := highestph
lowestpl = 0.0, lowestpl := lowestpl
var sr_levs = array.new_float(21, na)
label hlabel = na, label.delete(hlabel )
label llabel = na, label.delete(llabel )
var sr_lines = array.new_line(21, na)
var sr_linesH = array.new_line(21, na)
var sr_linesL = array.new_line(21, na)
var sr_linesF = array.new_linefill(21, na)
var sr_labels = array.new_label(21, na)
if (not na(ph) or not na(pl))
for x = 0 to array.size(sr_levels) - 1
array.set(sr_levels, x, na)
highestph := prdlowest
lowestpl := prdhighest
countpp = 0
for x = 0 to prd
if na(close )
break
if not na(ph ) or not na(pl )
highestph := math.max(highestph, nz(ph , prdlowest), nz(pl , prdlowest))
lowestpl := math.min(lowestpl, nz(ph , prdhighest), nz(pl , prdhighest))
countpp += 1
if countpp > 40
break
if array.get(aas, countpp)
upl = (not na(ph ) and (ph != 0) ? high : low ) + cwidth
dnl = (not na(ph ) and (ph != 0) ? high : low ) - cwidth
u1 := countpp == 1 ? upl : u1
d1 := countpp == 1 ? dnl : d1
tmp = array.new_bool(41, true)
cnt = 0
tpoint = 0
for xx = 0 to prd
if na(close )
break
if not na(ph ) or not na(pl )
chg = false
cnt += 1
if cnt > 40
break
if array.get(aas, cnt)
if not na(ph )
if high <= upl and high >= dnl
tpoint += 1
chg := true
if not na(pl )
if low <= upl and low >= dnl
tpoint += 1
chg := true
if chg and cnt < 41
array.set(tmp, cnt, false)
if tpoint >= strengthSR
for g = 0 to 40 by 1
if not array.get(tmp, g)
array.set(aas, g, false)
if (not na(ph ) and countpp < 21)
array.set(sr_levels, countpp, high )
if (not na(pl ) and countpp < 21)
array.set(sr_levels, countpp, low )
// Plot
var line highest_ = na, line.delete(highest_)
var line lowest_ = na, line.delete(lowest_)
var line highest_fill1 = na, line.delete(highest_fill1)
var line highest_fill2 = na, line.delete(highest_fill2)
var line lowest_fill1 = na, line.delete(lowest_fill1)
var line lowest_fill2 = na, line.delete(lowest_fill2)
hi_col = close >= highestph ? colorSup : colorRes
lo_col = close >= lowestpl ? colorSup : colorRes
if enableSR
highest_ := line.new(bar_index - 311, highestph, bar_index, highestph, xloc.bar_index, expandSR ? extend.both : extend.right, hi_col, style, lineWidth)
lowest_ := line.new(bar_index - 311, lowestpl , bar_index, lowestpl , xloc.bar_index, expandSR ? extend.both : extend.right, lo_col, style, lineWidth)
if useHLZones
highest_fill1 := line.new(bar_index - 311, highestph + zonePerc, bar_index, highestph + zonePerc, xloc.bar_index, expandSR ? extend.both : extend.right, na)
highest_fill2 := line.new(bar_index - 311, highestph - zonePerc, bar_index, highestph - zonePerc, xloc.bar_index, expandSR ? extend.both : extend.right, na)
lowest_fill1 := line.new(bar_index - 311, lowestpl + zonePerc , bar_index, lowestpl + zonePerc , xloc.bar_index, expandSR ? extend.both : extend.right, na)
lowest_fill2 := line.new(bar_index - 311, lowestpl - zonePerc , bar_index, lowestpl - zonePerc , xloc.bar_index, expandSR ? extend.both : extend.right, na)
linefill.new(highest_fill1, highest_fill2, hi_col)
linefill.new(lowest_fill1 , lowest_fill2 , lo_col)
if (not na(ph) or not na(pl))
for x = 0 to array.size(sr_lines) - 1
array.set(sr_levs, x, array.get(sr_levels, x))
for x = 0 to array.size(sr_lines) - 1
line.delete(array.get(sr_lines, x))
line.delete(array.get(sr_linesH, x))
line.delete(array.get(sr_linesL, x))
linefill.delete(array.get(sr_linesF, x))
if (not na(array.get(sr_levs, x)) and enableSR)
line_col = close >= array.get(sr_levs, x) ? colorSup : colorRes
array.set(sr_lines, x, line.new(bar_index - 355, array.get(sr_levs, x), bar_index, array.get(sr_levs, x), xloc.bar_index, expandSR ? extend.both : extend.right, line_col, style, lineWidth))
if useZones
array.set(sr_linesH, x, line.new(bar_index - 355, array.get(sr_levs, x) + zonePerc, bar_index, array.get(sr_levs, x) + zonePerc, xloc.bar_index, expandSR ? extend.both : extend.right, na))
array.set(sr_linesL, x, line.new(bar_index - 355, array.get(sr_levs, x) - zonePerc, bar_index, array.get(sr_levs, x) - zonePerc, xloc.bar_index, expandSR ? extend.both : extend.right, na))
array.set(sr_linesF, x, linefill.new(array.get(sr_linesH, x), array.get(sr_linesL, x), line_col))
for x = 0 to array.size(sr_labels) - 1
label.delete(array.get(sr_labels, x))
if (not na(array.get(sr_levs, x)) and enableSR)
lab_loc = close >= array.get(sr_levs, x) ? label.style_label_up : label.style_label_down
lab_col = close >= array.get(sr_levs, x) ? colorSup : colorRes
array.set(sr_labels, x, label.new(bar_index + label_loc, array.get(sr_levs, x), str.tostring(math.round_to_mintick(array.get(sr_levs, x))), color=lab_col , textcolor=#000000, style=lab_loc))
hlabel := enableSR ? label.new(bar_index + label_loc + math.round(math.sign(label_loc)) * 20, highestph, "High Level : " + str.tostring(highestph), color=hi_col, textcolor=#000000, style=label.style_label_down) : na
llabel := enableSR ? label.new(bar_index + label_loc + math.round(math.sign(label_loc)) * 20, lowestpl , "Low Level : " + str.tostring(lowestpl) , color=lo_col, textcolor=#000000, style=label.style_label_up ) : na
// Get components
rsi = ta.rsi(close, 28)
//rsiOb = rsi > 78 and rsi > ta.ema(rsi, 10)
//rsiOs = rsi < 27 and rsi < ta.ema(rsi, 10)
rsiOb = rsi > 65 and rsi > ta.ema(rsi, 10)
rsiOs = rsi < 35 and rsi < ta.ema(rsi, 10)
dHigh = securityNoRep(syminfo.tickerid, "D", high )
dLow = securityNoRep(syminfo.tickerid, "D", low )
dClose = securityNoRep(syminfo.tickerid, "D", close )
ema = ta.ema(close, 144)
emaBull = close > ema
equal_tf(res) => str.tonumber(res) == f_chartTfInMinutes() and not timeframe.isseconds
higher_tf(res) => str.tonumber(res) > f_chartTfInMinutes() or timeframe.isseconds
too_small_tf(res) => (timeframe.isweekly and res=="1") or (timeframe.ismonthly and str.tonumber(res) < 10)
securityNoRep1(sym, res, src) =>
bool bull_ = na
bull_ := equal_tf(res) ? src : bull_
bull_ := higher_tf(res) ? request.security(sym, res, src, barmerge.gaps_off, barmerge.lookahead_on) : bull_
bull_array = request.security_lower_tf(syminfo.tickerid, higher_tf(res) ? str.tostring(f_chartTfInMinutes()) + (timeframe.isseconds ? "S" : "") : too_small_tf(res) ? (timeframe.isweekly ? "3" : "10") : res, src)
if array.size(bull_array) > 1 and not equal_tf(res) and not higher_tf(res)
bull_ := array.pop(bull_array)
array.clear(bull_array)
bull_
// === BASE FUNCTIONS ===
// Returns MA input selection variant, default to SMA if blank or typo.
variant(type, src, len, offSig, offALMA) =>
v1 = ta.sma(src, len) // Simple
v2 = ta.ema(src, len) // Exponential
v3 = 2 * v2 - ta.ema(v2, len) // Double Exponential
v4 = 3 * (v2 - ta.ema(v2, len)) + ta.ema(ta.ema(v2, len), len) // Triple Exponential
v5 = ta.wma(src, len) // Weighted
v6 = ta.vwma(src, len) // Volume Weighted
v7 = 0.0
sma_1 = ta.sma(src, len) // Smoothed
v7 := na(v7 ) ? sma_1 : (v7 * (len - 1) + src) / len
v8 = ta.wma(2 * ta.wma(src, len / 2) - ta.wma(src, len), math.round(math.sqrt(len))) // Hull
v9 = ta.linreg(src, len, offSig) // Least Squares
v10 = ta.alma(src, len, offALMA, offSig) // Arnaud Legoux
v11 = ta.sma(v1, len) // Triangular (extreme smooth)
// SuperSmoother filter
// 2013 John F. Ehlers
a1 = math.exp(-1.414 * 3.14159 / len)
b1 = 2 * a1 * math.cos(1.414 * 3.14159 / len)
c2 = b1
c3 = -a1 * a1
c1 = 1 - c2 - c3
v12 = 0.0
v12 := c1 * (src + nz(src )) / 2 + c2 * nz(v12 ) + c3 * nz(v12 )
type == 'EMA' ? v2 : type == 'DEMA' ? v3 : type == 'TEMA' ? v4 : type == 'WMA' ? v5 : type == 'VWMA' ? v6 : type == 'SMMA' ? v7 : type == 'HullMA' ? v8 : type == 'LSMA' ? v9 : type == 'ALMA' ? v10 : type == 'TMA' ? v11 : type == 'SSMA' ? v12 : v1
// security wrapper for repeat calls
reso(exp, use, res) =>
security_1 = request.security(syminfo.tickerid, res, exp, gaps = barmerge.gaps_off, lookahead = barmerge.lookahead_on)
use ? security_1 : exp
// === /BASE FUNCTIONS ===
// === SERIES SETUP ===
closeSeries = variant(basisType, close , basisLen, offsetSigma, offsetALMA)
openSeries = variant(basisType, open , basisLen, offsetSigma, offsetALMA)
// === /SERIES ===
// Get Alternate resolution Series if selected.
closeSeriesAlt = reso(closeSeries, useRes, stratRes)
openSeriesAlt = reso(openSeries, useRes, stratRes)
//
lxTrigger = false
sxTrigger = false
leTrigger = ta.crossover (closeSeriesAlt, openSeriesAlt)
seTrigger = ta.crossunder(closeSeriesAlt, openSeriesAlt)
G_RISK = '■ ' + 'Risk Management'
//#region ———— <↓↓↓ G_RISK ↓↓↓> {
// ———————————
//Tooltip
T_LVL = '(%) Exit Level'
T_QTY = '(%) Adjust trade exit volume'
T_MSG = 'Paste JSON message for your bot'
//Webhook Message
O_LEMSG = 'Long Entry'
O_LXMSGSL = 'Long SL'
O_LXMSGTP1 = 'Long TP1'
O_LXMSGTP2 = 'Long TP2'
O_LXMSGTP3 = 'Long TP3'
O_LXMSG = 'Long Exit'
O_SEMSG = 'Short Entry'
O_SXMSGSL = 'Short SL'
O_SXMSGA = 'Short TP1'
O_SXMSGB = 'Short TP2'
O_SXMSGC = 'Short TP3'
O_SXMSGX = 'Short Exit'
// ——————————— | | | Line length guide |
i_lxLvlTP1 = input.float (0.2, 'Level TP1' , group = G_RISK,
tooltip = T_LVL)
i_lxQtyTP1 = input.float (80.0, 'Qty TP1' , group = G_RISK,
tooltip = T_QTY)
i_lxLvlTP2 = input.float (0.5, 'Level TP2' , group = G_RISK,
tooltip = T_LVL)
i_lxQtyTP2 = input.float (10.0, 'Qty TP2' , group = G_RISK,
tooltip = T_QTY)
i_lxLvlTP3 = input.float (7.0, 'Level TP3' , group = G_RISK,
tooltip = T_LVL)
i_lxQtyTP3 = input.float (2, 'Qty TP3' , group = G_RISK,
tooltip = T_QTY)
i_lxLvlSL = input.float (0.5, 'Stop Loss' , group = G_RISK,
tooltip = T_LVL)
i_sxLvlTP1 = i_lxLvlTP1
i_sxQtyTP1 = i_lxQtyTP1
i_sxLvlTP2 = i_lxLvlTP2
i_sxQtyTP2 = i_lxQtyTP2
i_sxLvlTP3 = i_lxLvlTP3
i_sxQtyTP3 = i_lxQtyTP3
i_sxLvlSL = i_lxLvlSL
G_MSG = '■ ' + 'Webhook Message'
i_leMsg = input.string (O_LEMSG ,'Long Entry' , group = G_MSG, tooltip = T_MSG)
i_lxMsgSL = input.string (O_LXMSGSL ,'Long SL' , group = G_MSG, tooltip = T_MSG)
i_lxMsgTP1 = input.string (O_LXMSGTP1,'Long TP1' , group = G_MSG, tooltip = T_MSG)
i_lxMsgTP2 = input.string (O_LXMSGTP2,'Long TP2' , group = G_MSG, tooltip = T_MSG)
i_lxMsgTP3 = input.string (O_LXMSGTP3,'Long TP3' , group = G_MSG, tooltip = T_MSG)
i_lxMsg = input.string (O_LXMSG ,'Long Exit' , group = G_MSG, tooltip = T_MSG)
i_seMsg = input.string (O_SEMSG ,'Short Entry' , group = G_MSG, tooltip = T_MSG)
i_sxMsgSL = input.string (O_SXMSGSL ,'Short SL' , group = G_MSG, tooltip = T_MSG)
i_sxMsgTP1 = input.string (O_SXMSGA ,'Short TP1' , group = G_MSG, tooltip = T_MSG)
i_sxMsgTP2 = input.string (O_SXMSGB ,'Short TP2' , group = G_MSG, tooltip = T_MSG)
i_sxMsgTP3 = input.string (O_SXMSGC ,'Short TP3' , group = G_MSG, tooltip = T_MSG)
i_sxMsg = input.string (O_SXMSGX ,'Short Exit' , group = G_MSG, tooltip = T_MSG)
i_src = close
G_DISPLAY = 'Display'
//
i_alertOn = input.bool (true, 'Alert Labels On/Off' , group = G_DISPLAY)
i_barColOn = input.bool (true, 'Bar Color On/Off' , group = G_DISPLAY)
// ———————————
// @function Calculate the Take Profit line, and the crossover or crossunder
f_tp(_condition, _conditionValue, _leTrigger, _seTrigger, _src, _lxLvlTP, _sxLvlTP)=>
var float _tpLine = 0.0
_topLvl = _src + (_src * (_lxLvlTP / 100))
_botLvl = _src - (_src * (_sxLvlTP / 100))
_tpLine := _condition != _conditionValue and _leTrigger ? _topLvl :
_condition != -_conditionValue and _seTrigger ? _botLvl :
nz(_tpLine )
// @function Similar to "ta.crossover" or "ta.crossunder"
f_cross(_scr1, _scr2, _over)=>
_cross = _over ? _scr1 > _scr2 and _scr1 < _scr2 :
_scr1 < _scr2 and _scr1 > _scr2
// ———————————
//
var float condition = 0.0
var float slLine = 0.0
var float entryLine = 0.0
//
entryLine := leTrigger and condition <= 0.0 ? close :
seTrigger and condition >= 0.0 ? close : nz(entryLine )
//
slTopLvl = i_src + (i_src * (i_lxLvlSL / 100))
slBotLvl = i_src - (i_src * (i_sxLvlSL / 100))
slLine := condition <= 0.0 and leTrigger ? slBotLvl :
condition >= 0.0 and seTrigger ? slTopLvl : nz(slLine )
slLong = f_cross(low, slLine, false)
slShort = f_cross(high, slLine, true )
//
= f_tp(condition, 1.2,leTrigger, seTrigger, i_src, i_lxLvlTP3, i_sxLvlTP3)
= f_tp(condition, 1.1,leTrigger, seTrigger, i_src, i_lxLvlTP2, i_sxLvlTP2)
= f_tp(condition, 1.0,leTrigger, seTrigger, i_src, i_lxLvlTP1, i_sxLvlTP1)
tp3Long = f_cross(high, tp3Line, true )
tp3Short = f_cross(low, tp3Line, false)
tp2Long = f_cross(high, tp2Line, true )
tp2Short = f_cross(low, tp2Line, false)
tp1Long = f_cross(high, tp1Line, true )
tp1Short = f_cross(low, tp1Line, false)
switch
leTrigger and condition <= 0.0 => condition := 1.0
seTrigger and condition >= 0.0 => condition := -1.0
tp3Long and condition == 1.2 => condition := 1.3
tp3Short and condition == -1.2 => condition := -1.3
tp2Long and condition == 1.1 => condition := 1.2
tp2Short and condition == -1.1 => condition := -1.2
tp1Long and condition == 1.0 => condition := 1.1
tp1Short and condition == -1.0 => condition := -1.1
slLong and condition >= 1.0 => condition := 0.0
slShort and condition <= -1.0 => condition := 0.0
lxTrigger and condition >= 1.0 => condition := 0.0
sxTrigger and condition <= -1.0 => condition := 0.0
longE = leTrigger and condition <= 0.0 and condition == 1.0
shortE = seTrigger and condition >= 0.0 and condition == -1.0
longX = lxTrigger and condition >= 1.0 and condition == 0.0
shortX = sxTrigger and condition <= -1.0 and condition == 0.0
longSL = slLong and condition >= 1.0 and condition == 0.0
shortSL = slShort and condition <= -1.0 and condition == 0.0
longTP3 = tp3Long and condition == 1.2 and condition == 1.3
shortTP3 = tp3Short and condition == -1.2 and condition == -1.3
longTP2 = tp2Long and condition == 1.1 and condition == 1.2
shortTP2 = tp2Short and condition == -1.1 and condition == -1.2
longTP1 = tp1Long and condition == 1.0 and condition == 1.1
shortTP1 = tp1Short and condition == -1.0 and condition == -1.1
// ——————————— {
//
if strategy.position_size <= 0 and longE and barstate.isconfirmed
strategy.entry(
'Long',
strategy.long,
alert_message = i_leMsg,
comment = 'LE')
if strategy.position_size > 0 and condition == 1.0
strategy.exit(
id = 'LXTP1',
from_entry = 'Long',
qty_percent = i_lxQtyTP1,
limit = tp1Line,
stop = slLine,
comment_profit = 'LXTP1',
comment_loss = 'SL',
alert_profit = i_lxMsgTP1,
alert_loss = i_lxMsgSL)
if strategy.position_size > 0 and condition == 1.1
strategy.exit(
id = 'LXTP2',
from_entry = 'Long',
qty_percent = i_lxQtyTP2,
limit = tp2Line,
stop = slLine,
comment_profit = 'LXTP2',
comment_loss = 'SL',
alert_profit = i_lxMsgTP2,
alert_loss = i_lxMsgSL)
if strategy.position_size > 0 and condition == 1.2
strategy.exit(
id = 'LXTP3',
from_entry = 'Long',
qty_percent = i_lxQtyTP3,
limit = tp3Line,
stop = slLine,
comment_profit = 'LXTP3',
comment_loss = 'SL',
alert_profit = i_lxMsgTP3,
alert_loss = i_lxMsgSL)
if longX
strategy.close(
'Long',
alert_message = i_lxMsg,
comment = 'LX')
//
if strategy.position_size >= 0 and shortE and barstate.isconfirmed
strategy.entry(
'Short',
strategy.short,
alert_message = i_leMsg,
comment = 'SE')
if strategy.position_size < 0 and condition == -1.0
strategy.exit(
id = 'SXTP1',
from_entry = 'Short',
qty_percent = i_sxQtyTP1,
limit = tp1Line,
stop = slLine,
comment_profit = 'SXTP1',
comment_loss = 'SL',
alert_profit = i_sxMsgTP1,
alert_loss = i_sxMsgSL)
if strategy.position_size < 0 and condition == -1.1
strategy.exit(
id = 'SXTP2',
from_entry = 'Short',
qty_percent = i_sxQtyTP2,
limit = tp2Line,
stop = slLine,
comment_profit = 'SXTP2',
comment_loss = 'SL',
alert_profit = i_sxMsgTP2,
alert_loss = i_sxMsgSL)
if strategy.position_size < 0 and condition == -1.2
strategy.exit(
id = 'SXTP3',
from_entry = 'Short',
qty_percent = i_sxQtyTP3,
limit = tp3Line,
stop = slLine,
comment_profit = 'SXTP3',
comment_loss = 'SL',
alert_profit = i_sxMsgTP3,
alert_loss = i_sxMsgSL)
if shortX
strategy.close(
'Short',
alert_message = i_sxMsg,
comment = 'SX')
// ———————————
c_tp = leTrigger or seTrigger ? na :
condition == 0.0 ? na : color.green
c_entry = leTrigger or seTrigger ? na :
condition == 0.0 ? na : color.blue
c_sl = leTrigger or seTrigger ? na :
condition == 0.0 ? na : color.red
p_tp1Line = plot (
condition == 1.0 or
condition == -1.0 ? tp1Line : na,
title = "TP Line 1",
color = c_tp,
linewidth = 1,
style = plot.style_linebr)
p_tp2Line = plot (
condition == 1.0 or
condition == -1.0 or
condition == 1.1 or
condition == -1.1 ? tp2Line : na,
title = "TP Line 2",
color = c_tp,
linewidth = 1,
style = plot.style_linebr)
p_tp3Line = plot (
condition == 1.0 or
condition == -1.0 or
condition == 1.1 or
condition == -1.1 or
condition == 1.2 or
condition == -1.2 ? tp3Line : na,
title = "TP Line 3",
color = c_tp,
linewidth = 1,
style = plot.style_linebr)
p_entryLine = plot (
condition >= 1.0 or
condition <= -1.0 ? entryLine : na,
title = "Entry Line",
color = c_entry,
linewidth = 1,
style = plot.style_linebr)
p_slLine = plot (
condition == 1.0 or
condition == -1.0 or
condition == 1.1 or
condition == -1.1 or
condition == 1.2 or
condition == -1.2 ? slLine : na,
title = "SL Line",
color = c_sl,
linewidth = 1,
style = plot.style_linebr)
fill(
p_tp3Line, p_entryLine,
color = leTrigger or seTrigger ? na :color.new(color.green, 90))
fill(
p_entryLine, p_slLine,
color = leTrigger or seTrigger ? na :color.new(color.red, 90))
//
plotshape(
i_alertOn and longE,
title = 'Long',
text = 'Long',
textcolor = color.white,
color = color.green,
style = shape.labelup,
size = size.tiny,
location = location.belowbar)
plotshape(
i_alertOn and shortE,
title = 'Short',
text = 'Short',
textcolor = color.white,
color = color.red,
style = shape.labeldown,
size = size.tiny,
location = location.abovebar)
plotshape(
i_alertOn and (longX or shortX) ? close : na,
title = 'Close',
text = 'Close',
textcolor = color.white,
color = color.gray,
style = shape.labelup,
size = size.tiny,
location = location.absolute)
l_tp = i_alertOn and (longTP1 or shortTP1) ? close : na
plotshape(
l_tp,
title = "TP1 Cross",
text = "TP1",
textcolor = color.white,
color = color.olive,
style = shape.labelup,
size = size.tiny,
location = location.absolute)
plotshape(
i_alertOn and (longTP2 or shortTP2) ? close : na,
title = "TP2 Cross",
text = "TP2",
textcolor = color.white,
color = color.olive,
style = shape.labelup,
size = size.tiny,
location = location.absolute)
plotshape(
i_alertOn and (longTP3 or shortTP3) ? close : na,
title = "TP3 Cross",
text = "TP3",
textcolor = color.white,
color = color.olive,
style = shape.labelup,
size = size.tiny,
location = location.absolute)
plotshape(
i_alertOn and (longSL or shortSL) ? close : na,
title = "SL Cross",
text = "SL",
textcolor = color.white,
color = color.maroon,
style = shape.labelup,
size = size.tiny,
location = location.absolute)
//
plot(
na,
title = "─── ───",
editable = false,
display = display.data_window)
plot(
condition,
title = "condition",
editable = false,
display = display.data_window)
plot(
strategy.position_size * 100,
title = ".position_size",
editable = false,
display = display.data_window)
//#endregion }
// ——————————— <↑↑↑ G_RISK ↑↑↑>
//#region ———— <↓↓↓ G_SCRIPT02 ↓↓↓> {
// @function Queues a new element in an array and de-queues its first element.
f_qDq(_array, _val) =>
array.push(_array, _val)
_return = array.shift(_array)
_return
var line a_slLine = array.new_line(1)
var line a_entryLine = array.new_line(1)
var line a_tp3Line = array.new_line(1)
var line a_tp2Line = array.new_line(1)
var line a_tp1Line = array.new_line(1)
var label a_slLabel = array.new_label(1)
var label a_tp3label = array.new_label(1)
var label a_tp2label = array.new_label(1)
var label a_tp1label = array.new_label(1)
var label a_entryLabel = array.new_label(1)
newEntry = longE or shortE
entryIndex = 1
entryIndex := newEntry ? bar_index : nz(entryIndex )
lasTrade = bar_index >= entryIndex
l_right = 10
line.delete(
f_qDq(a_slLine,
line.new(
entryIndex,
slLine,
last_bar_index + l_right,
slLine,
style = line.style_solid,
color = c_sl)))
line.delete(
f_qDq(a_entryLine,
line.new(
entryIndex,
entryLine,
last_bar_index + l_right,
entryLine,
style = line.style_solid,
color = color.blue)))
line.delete(
f_qDq(a_tp3Line,
line.new(
entryIndex,
tp3Line,
last_bar_index + l_right,
tp3Line,
style = line.style_solid,
color = c_tp)))
line.delete(
f_qDq(a_tp2Line,
line.new(
entryIndex,
tp2Line,
last_bar_index + l_right,
tp2Line,
style = line.style_solid,
color = c_tp)))
line.delete(
f_qDq(a_tp1Line,
line.new(
entryIndex,
tp1Line,
last_bar_index + l_right,
tp1Line,
style = line.style_solid,
color = c_tp)))
label.delete(
f_qDq(a_slLabel,
label.new(
last_bar_index + l_right,
slLine,
'SL: ' + str.tostring(slLine, '##.###'),
style = label.style_label_left,
textcolor = color.white,
color = c_sl)))
label.delete(
f_qDq(a_entryLabel,
label.new(
last_bar_index + l_right,
entryLine,
'Entry: ' + str.tostring(entryLine, '##.###'),
style = label.style_label_left,
textcolor = color.white,
color = color.blue)))
label.delete(
f_qDq(a_tp3label,
label.new(
last_bar_index + l_right,
tp3Line,
'TP3: ' + str.tostring(tp3Line, '##.###'),
style = label.style_label_left,
textcolor = color.white,
color = c_tp)))
label.delete(
f_qDq(a_tp2label,
label.new(
last_bar_index + l_right,
tp2Line,
'TP2: ' + str.tostring(tp2Line, '##.###'),
style = label.style_label_left,
textcolor = color.white,
color = c_tp)))
label.delete(
f_qDq(a_tp1label,
label.new(
last_bar_index + l_right,
tp1Line,
'TP1: ' + str.tostring(tp1Line, '##.###'),
style = label.style_label_left,
textcolor = color.white,
color = c_tp)))
// ———————————
//
if longE or shortE or longX or shortX
alert(message = 'Any Alert', freq = alert.freq_once_per_bar_close)
if longE
alert(message = 'Long Entry', freq = alert.freq_once_per_bar_close)
if shortE
alert(message = 'Short Entry', freq = alert.freq_once_per_bar_close)
if longX
alert(message = 'Long Exit', freq = alert.freq_once_per_bar_close)
if shortX
alert(message = 'Short Exit', freq = alert.freq_once_per_bar_close)
//#endregion }
// ——————————— <↑↑↑ G_SCRIPT03 ↑↑↑>

Fibonacci Trend - Aynet1. Inputs
lookbackPeriod: Defines the number of bars to consider for calculating swing highs and lows. Default is 20.
fibLevel1 to fibLevel5: Fibonacci retracement levels to calculate price levels (23.6%, 38.2%, 50%, 61.8%, 78.6%).
useTime: Enables or disables time-based Fibonacci projections.
riskPercent: Defines the percentage of risk for trading purposes (currently not used in calculations).
2. Functions
isSwingHigh(index): Identifies a swing high at the given index, where the high of that candle is higher than both its previous and subsequent candles.
isSwingLow(index): Identifies a swing low at the given index, where the low of that candle is lower than both its previous and subsequent candles.
3. Variables
swingHigh and swingLow: Store the most recent swing high and swing low prices.
swingHighTime and swingLowTime: Store the timestamps of the swing high and swing low.
fib1 to fib5: Fibonacci levels based on the difference between swingHigh and swingLow.
4. Swing Point Detection
The script checks if the last bar is a swing high or swing low using the isSwingHigh() and isSwingLow() functions.
If a swing high is detected:
The high price is stored in swingHigh.
The timestamp of the swing high is stored in swingHighTime.
If a swing low is detected:
The low price is stored in swingLow.
The timestamp of the swing low is stored in swingLowTime.
5. Fibonacci Levels Calculation
If both swingHigh and swingLow are defined, the script calculates the Fibonacci retracement levels (fib1 to fib5) based on the price difference (priceDiff = swingHigh - swingLow).
6. Plotting Fibonacci Levels
Fibonacci levels (fib1 to fib5) are plotted as horizontal lines using the line.new() function.
Labels (e.g., "23.6%") are added near the lines to indicate the level.
Lines and labels are color-coded:
23.6% → Blue
38.2% → Green
50.0% → Yellow
61.8% → Orange
78.6% → Red
7. Filling Between Fibonacci Levels
The plot() function creates lines for each Fibonacci level.
The fill() function is used to fill the space between two levels with semi-transparent colors:
Blue → Between fib1 and fib2
Green → Between fib2 and fib3
Yellow → Between fib3 and fib4
Orange → Between fib4 and fib5
8. Time-Based Fibonacci Projections
If useTime is enabled:
The time difference (timeDiff) between the swing high and swing low is calculated.
Fibonacci time projections are added based on multiples of 23.6%.
If the current time reaches a projected time, a label (e.g., "T1", "T2") is displayed near the high price.
9. Trading Logic
Two placeholder variables are defined for trading logic:
longCondition: Tracks whether a condition for a long trade is met (currently not implemented).
shortCondition: Tracks whether a condition for a short trade is met (currently not implemented).
These variables can be extended to define entry/exit signals based on Fibonacci levels.
How It Works
Detect Swing Points: It identifies recent swing high and swing low points on the chart.
Calculate Fibonacci Levels: Based on the swing points, it computes retracement levels.
Visualize Levels: Plots the levels on the chart with labels and fills between them.
Time Projections: Optionally calculates time-based projections for future price movements.
Trading Opportunities: The framework provides tools for detecting potential reversal or breakout zones using Fibonacci levels.
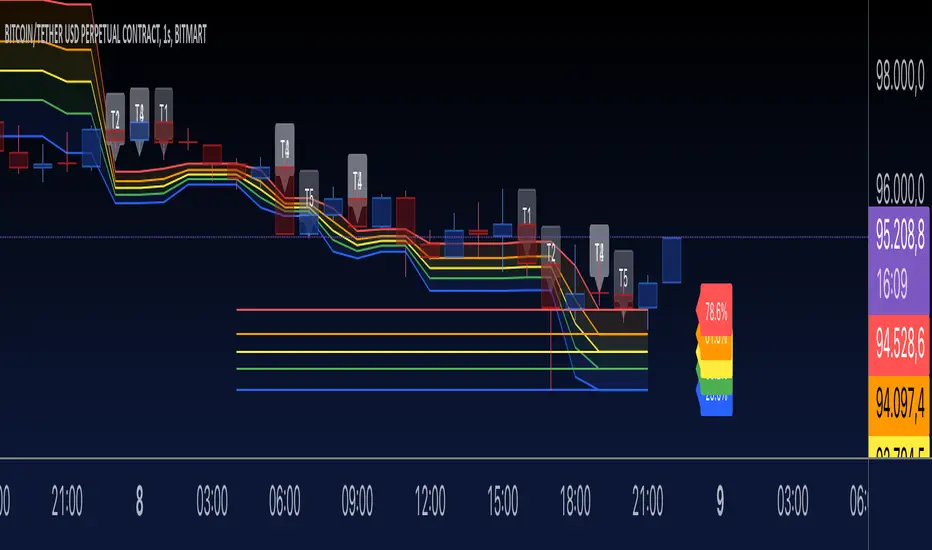
SMT Divergence [Kodexius]SMT Divergence is a correlation-based divergence detector built around the Smart Money Technique concept: when two normally correlated instruments should be making similar swing progress, but one prints a new extreme while the other fails to confirm it. This “disagreement” can be a valuable contextual signal around liquidity runs, distribution phases, and potential reversal or continuation points.
The script compares the chart symbol (primary) with a user-selected comparison symbol (for example BTC vs ETH, ES vs NQ, EUR/USD vs GBP/USD) and automatically scans both instruments for confirmed swing highs and swing lows using pivot logic. Once swings are established, it checks for classic SMT conditions:
Primary makes a new swing extreme while the comparison symbol forms a non-confirming swing .
To support a wider range of markets, the indicator includes an Inverse Correlation option for pairs that typically move opposite to each other (for example DXY vs EUR/USD). With this enabled, the divergence rules are logically flipped so that the script still detects “non-confirmation” in a way that is consistent with the pair’s relationship.
The indicator is designed to be readable and actionable. It can draw divergence labels directly on the main chart, connect the relevant swing points with lines, show a compact information table with the last signal and settings, and optionally render the comparison symbol as a mini candle chart in the indicator pane for quick visual validation.
🔹 Features
🔸 Two-Symbol SMT Analysis (Primary vs Compare)
Select any comparison symbol to evaluate correlation structure and divergence. The script fetches the comparison OHLC data using the current chart timeframe to keep both series aligned for analysis.
🔸 Inverse Correlation Mode
For inversely correlated pairs, enable “Inverse Correlation” so the script interprets confirmation appropriately (for example, a higher low on the comparison instrument might be expected to correspond to a lower low on the primary, depending on the relationship). This helps avoid false conclusions when the pair naturally moves opposite.
🔸 Pivot-Based Swing with Adjustable Sensitivity
Swings are detected using confirmed pivots (left bars and right bars). This provides cleaner structural swing points compared with raw candle-to-candle comparisons, and it lets you control sensitivity for different market conditions and timeframes. The script also limits stored swing history to keep performance stable.
🔸 Flexible Detection Mode: Time Matched or Independent Swings
You can choose how swings are paired across instruments:
Time Matched searches for a comparison swing that occurred at the same pivot time as the primary swing.
Independent Swings compares each symbol’s own last two swings without requiring an exact time match.
🔸 Range Control and Noise Filtering
To reduce weak or irrelevant signals:
“Max Bars Between Swings” ensures the two swings being compared are close enough in structure to be meaningful.
“Min Price Diff (%)” can require a minimum percentage change between the primary’s last two swing prices to confirm the move is significant.
🔸 Clear Visual Output with Tooltips
When a divergence is detected, the script can print a label (“SMT”) with bullish or bearish styling and a tooltip that includes the symbol pair and the primary swing price for quick context.
🔸 Divergence Lines for Context
Optional lines connect the relevant swing points, making it easier to see the exact structure that triggered the signal. One line can be drawn on the main chart and another in the indicator pane for the comparison series.
🔸 Info Table (At a Glance)
A compact table can display the active symbols, correlation mode, total divergences stored, and the most recent signal type.
🔸 Alerts Included
Built-in alert conditions are provided for bullish SMT, bearish SMT, and any SMT event so you can automate notifications without editing the code.
🔸 Optional Comparison Candle Panel
If enabled, the indicator can plot the comparison symbol as candles in the indicator pane. This is useful for confirming whether the divergence is happening around major levels, consolidations, or impulsive legs on the secondary instrument.
🔹 Calculations
This section summarizes the core logic used by the script.
1. Data Synchronization (Comparison Symbol)
The comparison instrument is requested on the chart’s current timeframe so swing calculations are performed consistently:
=
request.security(compareSymbolInput, timeframe.period, )
This ensures pivots and swing times are derived from the same bar cadence as the primary chart.
2. Swing Detection via Confirmed Pivots
Swings are detected using pivot logic with user-defined left and right bars:
primaryPivotHigh = ta.pivothigh(high, pivotLeftBars, pivotRightBars)
primaryPivotLow = ta.pivotlow(low, pivotLeftBars, pivotRightBars)
Because pivots are confirmed only after the “right bars” have closed, the script stores each swing using an offset so the swing’s bar index and time reflect where the pivot actually occurred, not where it was confirmed.
3. Swing Storage and Retrieval
Both symbols maintain arrays of SwingPoint objects. Each new swing is pushed into the array, and older swings are dropped once the array exceeds the configured maximum. This makes the divergence engine predictable and prevents uncontrolled memory growth.
The script then retrieves the last and previous swing highs and lows (per symbol) to evaluate structure.
4. Matching Logic (Time Matched vs Independent)
When “Time Matched” is selected, the script searches the comparison swing array for a pivot that occurred at the exact same timestamp as the primary swing. When “Independent Swings” is selected, it simply uses the comparison symbol’s last two swings of the same type.
5. Bullish SMT Condition (LL vs HL)
A bullish SMT event is defined as:
Primary forms a lower low (last low < previous low)
Comparison forms a higher low (last low > previous low)
If inverse correlation is enabled, the comparison condition flips to maintain logical confirmation rules
The two primary swings must be within the configured bar distance window
Optional minimum percentage difference must be satisfied
A simple anti duplication rule prevents repeated triggers on the same structure
These checks are implemented directly in the bullish detection block.
6. Bearish SMT Condition (HH vs LH)
A bearish SMT event is defined as:
Primary forms a higher high (last high > previous high)
Comparison forms a lower high (last high < previous high)
Inverse correlation flips the comparison rule
Range checks, minimum difference filtering, and duplicate protection apply similarly
These checks are implemented in the bearish detection block.
7. Percentage Difference Filter
The optional “Min Price Diff (%)” filter measures the relative distance between the last two primary swing prices. This prevents very small structural changes from being treated as valid SMT signals.
priceDiffPerc = math.abs(lastSwing.price - prevSwing.price) / prevSwing.price * 100.0
The divergence condition is only allowed to trigger if this value exceeds the user defined threshold.
priceOk = priceDiffPerc >= minPriceDiff
This filter is especially useful on higher timeframes or during low volatility conditions, where micro structure noise can otherwise produce misleading signals.
8. Visualization and Output
When a divergence is confirmed, the script:
Stores the event in a divergence array (limited by “Max Divergences to Display”)
Draws a directional SMT label with a tooltip (optional)
Draws connecting lines using time based coordinates for clean alignment (optional)
It also updates an information table on the last bar only, and exposes alertconditions for automation workflows.

Golden Cross 50/200 EMATrend-following systems are characterized by having a low win rate, yet in the right circumstances (trending markets and higher timeframes) they can deliver returns that even surpass those of systems with a high win rate.
Below, I show you a simple bullish trend-following system with clear execution rules:
System Rules
-Long entries when the 50-period EMA crosses above the 200-period EMA.
-Stop Loss (SL) placed at the lowest low of the 15 candles prior to the entry candle.
-Take Profit (TP) triggered when the 50-period EMA crosses below the 200-period EMA.
Risk Management
-Initial capital: $10,000
-Position size: 10% of capital per trade
-Commissions: 0.1% per trade
Important Note:
In the code, the stop loss is defined using the swing low (15 candles), but the position size is not adjusted based on the distance to the stop loss. In other words, 10% of the equity is risked on each trade, but the actual loss on the trade is not controlled by a maximum fixed percentage of the account — it depends entirely on the stop loss level. This means the loss on a single trade could be significantly higher or lower than 10% of the account equity, depending on volatility.
Implementing leverage or reducing position size based on volatility is something I haven’t been able to include in the code, but it would dramatically improve the system’s performance. It would fix a consistent percentage loss per trade, preventing losses from fluctuating wildly with changes in volatility.
For example, we can maintain a fixed loss percentage when volatility is low by using the following formula:
Leverage = % of SL you’re willing to risk / % volatility from entry point to stop loss
And when volatility is high and would exceed the fixed percentage we want to expose per trade (if the SL is hit), we could reduce the position size accordingly.
Practical example:
Imagine we only want to risk 15% of the position value if the stop loss is triggered on Tesla (which has high volatility), but the distance to the SL represents a potential 23.57% drop. In this case, we subtract the desired risk (15%) from the actual volatility-based loss (23.57%):
23.57% − 15% = 8.57%
Now suppose we normally use $200 per trade.
To calculate 8.57% of $200:
200 × (8.57 / 100) = $17.14
Then subtract that amount from the original position size:
$200 − $17.14 = $182.86
In summary:
If we reduce the position size to $182.86 (instead of the usual $200), even if Tesla moves 23.57% against us and hits the stop loss, we would still only lose approximately 15% of the original $200 position — exactly the risk level we defined. This way, we strictly respect our risk management rules regardless of volatility swings.
I hope this clearly explains the importance of capping losses at a fixed percentage per trade. This keeps risk under control while maintaining a consistent percentage of capital invested per trade — preventing both statistical distortion of the system and the potential destruction of the account.
About the code:
Strategy declaration:
The strategy is named 'Golden Cross 50/200 EMA'.
overlay=true means it will be drawn directly on the price chart.
initial_capital=10000 sets the initial capital to $10,000.
default_qty_type=strategy.percent_of_equity and default_qty_value=10 means each trade uses 10% of available equity.
margin_long=0 indicates no margin is used for long positions (this is likely for simulation purposes only; in real trading, margin would be required).
commission_type=strategy.commission.percent and commission_value=0.1 sets a 0.1% commission per trade.
Indicators:
Calculates two EMAs: a 50-period EMA (ema50) and a 200-period EMA (ema200).
Crossover detection:
bullCross is triggered when the 50-period EMA crosses above the 200-period EMA (Golden Cross).
bearCross is triggered when the 50-period EMA crosses below the 200-period EMA (Death Cross).
Recent swing:
swingLow calculates the lowest low of the previous 15 periods.
Stop Loss:
entryStopLoss is a variable initialized as na (not available) and is updated to the current swingLow value whenever a bullCross occurs.
Entry and exit conditions:
Entry: When a bullCross occurs, the initial stop loss is set to the current swingLow and a long position is opened.
Exit on opposite signal: When a bearCross occurs, the long position is closed.
Exit on stop loss: If the price falls below entryStopLoss while a position is open, the position is closed.
Visualization:
Both EMAs are plotted (50-period in blue, 200-period in red).
Green triangles are plotted below the bar on a bullCross, and red triangles above the bar on a bearCross.
A horizontal orange line is drawn that shows the stop loss level whenever a position is open.
Alerts:
Alerts are created for:Long entry
Exit on bearish crossover (Death Cross)
Exit triggered by stop loss
Favorable Conditions:
Tesla (45-minute timeframe)
June 29, 2010 – November 17, 2025
Total net profit: $12,458.73 or +124.59%
Maximum drawdown: $1,210.40 or 8.29%
Total trades: 107
Winning trades: 27.10% (29/107)
Profit factor: 3.141
Tesla (1-hour timeframe)
June 29, 2010 – November 17, 2025
Total net profit: $7,681.83 or +76.82%
Maximum drawdown: $993.36 or 7.30%
Total trades: 75
Winning trades: 29.33% (22/75)
Profit factor: 3.157
Netflix (45-minute timeframe)
May 23, 2002 – November 17, 2025
Total net profit: $11,380.73 or +113.81%
Maximum drawdown: $699.45 or 5.98%
Total trades: 134
Winning trades: 36.57% (49/134)
Profit factor: 2.885
Netflix (1-hour timeframe)
May 23, 2002 – November 17, 2025
Total net profit: $11,689.05 or +116.89%
Maximum drawdown: $844.55 or 7.24%
Total trades: 107
Winning trades: 37.38% (40/107)
Profit factor: 2.915
Netflix (2-hour timeframe)
May 23, 2002 – November 17, 2025
Total net profit: $12,807.71 or +128.10%
Maximum drawdown: $866.52 or 6.03%
Total trades: 56
Winning trades: 41.07% (23/56)
Profit factor: 3.891
Meta (45-minute timeframe)
May 18, 2012 – November 17, 2025
Total net profit: $2,370.02 or +23.70%
Maximum drawdown: $365.27 or 3.50%
Total trades: 83
Winning trades: 31.33% (26/83)
Profit factor: 2.419
Apple (45-minute timeframe)
January 3, 2000 – November 17, 2025
Total net profit: $8,232.55 or +80.59%
Maximum drawdown: $581.11 or 3.16%
Total trades: 140
Winning trades: 34.29% (48/140)
Profit factor: 3.009
Apple (1-hour timeframe)
January 3, 2000 – November 17, 2025
Total net profit: $9,685.89 or +94.93%
Maximum drawdown: $374.69 or 2.26%
Total trades: 118
Winning trades: 35.59% (42/118)
Profit factor: 3.463
Apple (2-hour timeframe)
January 3, 2000 – November 17, 2025
Total net profit: $8,001.28 or +77.99%
Maximum drawdown: $755.84 or 7.56%
Total trades: 67
Winning trades: 41.79% (28/67)
Profit factor: 3.825
NVDA (15-minute timeframe)
January 3, 2000 – November 17, 2025
Total net profit: $11,828.56 or +118.29%
Maximum drawdown: $1,275.43 or 8.06%
Total trades: 466
Winning trades: 28.11% (131/466)
Profit factor: 2.033
NVDA (30-minute timeframe)
January 3, 2000 – November 17, 2025
Total net profit: $12,203.21 or +122.03%
Maximum drawdown: $1,661.86 or 10.35%
Total trades: 245
Winning trades: 28.98% (71/245)
Profit factor: 2.291
NVDA (45-minute timeframe)
January 3, 2000 – November 17, 2025
Total net profit: $16,793.48 or +167.93%
Maximum drawdown: $1,458.81 or 8.40%
Total trades: 172
Winning trades: 33.14% (57/172)
Profit factor: 2.927

Logarithmic Regression AlternativeLogarithmic regression is typically used to model situations where growth or decay accelerates rapidly at first and then slows over time. Bitcoin is a good example.
𝑦 = 𝑎 + 𝑏 * ln(𝑥)
With this logarithmic regression (log reg) formula 𝑦 (price) is calculated with constants 𝑎 and 𝑏, where 𝑥 is the bar_index .
Instead of using the sum of log x/y values, together with the dot product of log x/y and the sum of the square of log x-values, to calculate a and b, I wanted to see if it was possible to calculate a and b differently.
In this script, the log reg is calculated with several different assumed a & b values, after which the log reg level is compared to each Swing. The log reg, where all swings on average are closest to the level, produces the final 𝑎 & 𝑏 values used to display the levels.
🔶 USAGE
The script shows the calculated logarithmic regression value from historical swings, provided there are enough swings, the price pattern fits the log reg model, and previous swings are close to the calculated Top/Bottom levels.
When the price approaches one of the calculated Top or Bottom levels, these levels could act as potential cycle Top or Bottom.
Since the logarithmic regression depends on swing values, each new value will change the calculation. A well-fitted model could not fit anymore in the future.
Swings are based on Weekly bars. A Top Swing, for example, with Swing setting 30, is the highest value in 60 weeks. Thirty bars at the left and right of the Swing will be lower than the Top Swing. This means that a confirmation is triggered 30 weeks after the Swing. The period will be automatically multiplied by 7 on the daily chart, where 30 becomes 210 bars.
Please note that the goal of this script is not to show swings rapidly; it is meant to show the potential next cycle's Top/Bottom levels.
🔹 Multiple Levels
The script includes the option to display 3 Top/Bottom levels, which uses different values for the swing calculations.
Top: 'high', 'maximum open/close' or 'close'
Bottom: 'low', 'minimum open/close' or 'close'
These levels can be adjusted up/down with a percentage.
Lastly, an "Average" is included for each set, which will only be visible when "AVG" is enabled, together with both Top and Bottom levels.
🔹 Notes
Users have to check the validity of swings; the above example only uses 1 Top Swing for its calculations, making the Top level unreliable.
Here, 1 of the Bottom Swings is pretty far from the bottom level, changing the swing settings can give a more reliable bottom level where all swings are close to that level.
Note the display was set at "Logarithmic", it can just as well be shown as "Regular"
In the example below, the price evolution does not fit the logarithmic regression model, where growth should accelerate rapidly at first and then slows over time.
Please note that this script can only be used on a daily timeframe or higher; using it at a lower timeframe will show a warning. Also, it doesn't work with bar-replay.
🔶 DETAILS
The code gathers data from historical swings. At the last bar, all swings are calculated with different a and b values. The a and b values which results in the smallest difference between all swings and Top/Bottom levels become the final a and b values.
The ranges of a and b are between -20.000 to +20.000, which means a and b will have the values -20.000, -19.999, -19.998, -19.997, -19.996, ... -> +20.000.
As you can imagine, the number of calculations is enormous. Therefore, the calculation is split into parts, first very roughly and then very fine.
The first calculations are done between -20 and +20 (-20, -19, -18, ...), resulting in, for example, 4.
The next set of calculations is performed only around the previous result, in this case between 3 (4-1) and 5 (4+1), resulting in, for example, 3.9. The next set goes even more in detail, for example, between 3.8 (3.9-0.1) and 4.0 (3.9 + 0.1), and so on.
1) -20 -> +20 , then loop with step 1 (result (example): 4 )
2) 4 - 1 -> 4 +1 , then loop with step 0.1 (result (example): 3.9 )
3) 3.9 - 0.1 -> 3.9 +0.1 , then loop with step 0.01 (result (example): 3.93 )
4) 3.93 - 0.01 -> 3.93 +0.01, then loop with step 0.001 (result (example): 3.928)
This ensures complicated calculations with less effort.
These calculations are done at the last bar, where the levels are displayed, which means you can see different results when a new swing is found.
Also, note that this indicator has been developed for a daily (or higher) timeframe chart.
🔶 SETTINGS
Three sets
High/Low
• color setting
• Swing Length settings for 'High' & 'Low'
• % adjustment for 'High' & 'Low'
• AVG: shows average (when both 'High' and 'Low' are enabled)
Max/Min (maximum open/close, minimum open/close)
• color setting
• Swing Length settings for 'Max' & 'Min'
• % adjustment for 'Max' & 'Min'
• AVG: shows average (when both 'Max' and 'Min' are enabled)
Close H/Close L (close Top/Bottom level)
• color setting
• Swing Length settings for 'Close H' & 'Close L'
• % adjustment for 'Close H' & 'Close L'
• AVG: shows average (when both 'Close H' and 'Close L' are enabled)
Show Dashboard, including Top/Bottom levels of the desired source and calculated a and b values.
Show Swings + Dot size

Sentinel Market Structure [JOAT]
Sentinel Market Structure - Smart Money Structure Analysis
Introduction and Purpose
Sentinel Market Structure is an open-source overlay indicator that identifies swing highs/lows, tracks market structure (HH/HL/LH/LL), detects Break of Structure (BOS) and Change of Character (CHoCH) signals, and marks order blocks. The core problem this indicator solves is that retail traders often miss structural shifts that smart money traders use to identify trend changes.
This indicator addresses that by automatically tracking market structure and alerting traders to key structural breaks that often precede significant moves.
Why These Components Work Together
Each component provides different structural information:
1. Swing Detection - Identifies significant pivot highs and lows. These are the building blocks of market structure.
2. Structure Labels (HH/HL/LH/LL) - Classifies each swing relative to the previous swing. Higher Highs + Higher Lows = uptrend. Lower Highs + Lower Lows = downtrend.
3. Break of Structure (BOS) - Identifies when price breaks a swing level in the direction of the trend. This is a continuation signal.
4. Change of Character (CHoCH) - Identifies when price breaks a swing level against the trend. This is a potential reversal signal.
5. Order Blocks - Marks the last opposing candle before an impulse move. These zones often act as future support/resistance.
How the Detection Works
Swing Detection:
bool swingHighDetected = high == ta.highest(high, swingLength * 2 + 1)
bool swingLowDetected = low == ta.lowest(low, swingLength * 2 + 1)
BOS vs CHoCH Logic:
// BOS: Break in direction of trend (continuation)
bool bullishBOS = close > lastSwingHigh and marketTrend >= 0
// CHoCH: Break against trend (reversal signal)
bool bullishCHOCH = close > lastSwingHigh and marketTrend < 0
Order Block Detection:
bool bullOB = close < open and // Previous candle bearish
close > open and // Current candle bullish
close > high and // Breaking above
(high - low) > ta.atr(14) * 1.5 // Strong impulse
Signal Types
HH (Higher High) - Swing high above previous swing high (bullish structure)
HL (Higher Low) - Swing low above previous swing low (bullish structure)
LH (Lower High) - Swing high below previous swing high (bearish structure)
LL (Lower Low) - Swing low below previous swing low (bearish structure)
BOS↑/BOS↓ - Break of structure in trend direction (continuation)
CHoCH↑/CHoCH↓ - Change of character against trend (potential reversal)
Dashboard Information
Trend - Current market bias (BULLISH/BEARISH/NEUTRAL)
Swing High - Last swing high price with HH/LH label
Swing Low - Last swing low price with HL/LL label
Structure - Current structure state (HH+HL, LH+LL, etc.)
Price - Price position relative to structure
How to Use This Indicator
For Trend Following:
1. Identify trend using structure (HH+HL = uptrend, LH+LL = downtrend)
2. Enter on BOS signals in trend direction
3. Use swing levels for stop placement
For Reversal Trading:
1. Watch for CHoCH signals (break against trend)
2. Confirm with order block formation
3. Enter on retest of order block zone
For Risk Management:
1. Place stops beyond swing highs/lows
2. Use structure lines as trailing stop references
3. Exit when CHoCH signals against your position
Input Parameters
Swing Detection Length (5) - Bars on each side for pivot detection
Show Swing High/Low Points (true) - Toggle swing markers
Show BOS/CHoCH (true) - Toggle structural break signals
Show Structure Lines (true) - Toggle horizontal swing lines
Show Order Blocks (true) - Toggle order block zones
Zone Extension (50) - How far order block boxes extend
Timeframe Recommendations
15m-1H: Good for intraday structure analysis
4H-Daily: Best for swing trading structure
Lower timeframes require smaller swing detection length
Limitations
Swing detection has inherent lag (needs confirmation bars)
Not all BOS/CHoCH signals lead to continuation/reversal
Order block zones are simplified (not full ICT methodology)
Structure analysis is subjective - different traders see different swings
Open-Source and Disclaimer
This script is published as open-source under the Mozilla Public License 2.0 for educational purposes.
This indicator does not constitute financial advice. Market structure analysis does not guarantee trade outcomes. Always use proper risk management.
- Made with passion by officialjackofalltrades

TRAPPER TRENDLINES — PRICEDraws dynamic trendlines on price by connecting the two most recent confirmed swing points (highs to highs for resistance, lows to lows for support). Swings are defined with a symmetric left/right pivot window. Old anchors are ignored so lines stay attached to current structure. Optional break alerts are included.
How it works (plain language)
Pivots: A bar is a swing high (or low) only if it’s the most extreme point compared with a set number of bars on the left and the right.
Lines:
Support connects the last two confirmed swing lows.
Resistance connects the last two confirmed swing highs.
Lines can be extended right only or both left & right (toggle).
Recency filter: Only swings within the last N bars are kept. This avoids anchoring to very old pivots far from current price.
Alerts: Optional alerts fire when price closes above resistance or below support.
Inputs
Auto Settings
Auto pivot size by chart timeframe: When ON, the script picks a pivot size suitable for the current timeframe (you can scale it with Auto pivot multiplier). When OFF, the manual left/right inputs are used.
Auto pivot multiplier: Scales the auto pivot size (e.g., 1.5 makes pivots stricter).
Manual Pivots
Pivot Left / Pivot Right: Bars to the left/right required to confirm a swing. Example: Left=50 & Right=50 keeps only major swings.
Recency Filter
Use last N bars for pivots: Swings older than this window are discarded so trendlines stay relevant to current price.
Style
Support/Resistance color: Line colors.
Extend Left & Right: When ON, both endpoints extend; when OFF, lines extend to the right only.
Alerts
Enable Break Alerts: When ON, alert conditions are exposed:
Price: Break Up — close above resistance.
Price: Break Down — close below support.
Suggested settings
Higher timeframes (4H / 1D / 1W):
Manual: Pivot Left = 50, Pivot Right = 50, Use last N bars = 400–800.
Or enable Auto with Auto pivot multiplier = 1.0–1.5.
Intraday (15m / 30m / 1H):
Manual: Pivot Left = 30, Pivot Right = 30, Use last N bars = 300–500.
Or enable Auto with multiplier ≈ 1.0–1.2.
Pairing with RSI for confluence/divergence
This tool is designed to pair with a companion TRAPPER TRENDLINES — RSI (or any RSI trendline script):
To mirror swings, set RSI Pivot Lookback equal to the price Pivot Left/Right you use here.
Example: Price = 50/50 → RSI Pivot Lookback = 50.
Keep RSI at Length 14 with 70/30 channel for clarity.
Confluence: Price holds/rejects at a trendline while RSI trendline agrees.
Divergence: Price prints a higher high (resistance line rising) while RSI prints a lower high (RSI resistance line falling), or vice-versa for lows. Matching pivot windows makes these relationships clear and reduces false signals.
Reading the signals
Trendline touch/hold: Potential reaction area; wait for follow-through.
Break Up / Break Down (alerts): Close beyond the line. Consider retest behavior, higher-timeframe context, and volume/RSI confirmation.
Notes & limitations
Pivots require future bars to confirm (by design). Lines update as pivots confirm.
“Use last N bars” purposely ignores very old swings. Increase this value if you need legacy structure.
Lines are based on two most recent confirmed pivots per side; rapidly changing markets can replace anchors as new swings confirm.
This is a visual/analytical tool. No strategy entries/exits or performance claims are provided.
Compliance
This script is for educational purposes only and does not constitute financial advice. Trading involves risk. Past results do not guarantee future outcomes. No promises of profit, accuracy, or performance are made.
Alerts (titles/messages)
Price: Break Up — “Price broke above resistance trendline.”
Price: Break Down — “Price broke below support trendline.”
Quick start
Add the indicator to your chart.
Choose Auto or set Pivot Left/Right manually.
Set Use last N bars for how far back to consider swings.
Toggle Extend Left & Right to your preference.
(Optional) Add your RSI trendline indicator and match Pivot Lookback with your price pivot size for clean confluence/divergence.
Enable alerts if you want notifications on breaks.

Pure Price Zone Flow🔎 What this indicator is
It’s a price-action-based zone indicator. Unlike moving average systems, this one relies only on:
1. Swing Highs & Swing Lows → The highest and lowest points within a recent lookback period (like "mini support & resistance").
2. ATR (Average True Range) → A volatility measure that expands the zone, making it more adaptive to different market conditions.
3. Breakouts & Retests → When price breaks above a swing high (bullish) or below a swing low (bearish), the indicator marks it and highlights the new trend.
👉 The goal is to spot clean structure shifts and define clear trend zones where traders can position themselves.
________________________________________
⚙️ How it is calculated
1. Swing High & Swing Low
o We look back len candles (default 20).
o Find the highest high (swingHigh) and the lowest low (swingLow) in that window.
o This forms the price range zone.
2. ATR Expansion
o We calculate ATR over the same len.
o Add/subtract it (multiplied by atrMult) to the zone edges to expand them.
o This ensures the zones breathe with volatility (tight in quiet markets, wide in choppy ones).
3. Mid-Zone
o Simply the average of swingHigh and swingLow.
o If price is above mid → bullish bias.
o If below mid → bearish bias.
o This gives us the trend color for candles.
4. Breakouts
o If the close crosses above swingHigh, we mark a bullish breakout with a label.
o If the close crosses below swingLow, we mark a bearish breakdown.
________________________________________
📊 How it helps traders
This indicator helps by:
1. Identifying Structure Shifts
o Many traders watch swing highs/lows for breakouts or reversals.
o This automates the process and visually confirms when structure is broken.
2. Dynamic Zone Trading
o Instead of fixed support/resistance, the ATR expansion adapts to volatility.
o This avoids false signals in high-volatility conditions.
3. Trend Bias at a Glance
o Candle coloring instantly tells you whether price is in bullish or bearish territory relative to the mid-zone.
4. Breakout Confirmation
o The labels show when a breakout has occurred, so traders can react quickly (e.g., enter with trend, wait for retest, or avoid fading moves).
________________________________________
🌍 Markets it works best in
• Crypto (Bitcoin, Ethereum, etc.): Very effective since crypto is breakout-driven and respects swing levels.
• Forex: Good for volatility-adaptive structure analysis, especially in trending pairs.
• Indices (SPX, NASDAQ, DAX, NIFTY): Useful for breakout trading during session opens or key news events.
• Commodities (Gold, Oil, Silver): Works well to define intraday ranges and breakout levels.
⚠️ Less useful in low-volatility, mean-reverting assets (like some penny stocks or sideways ranges), because breakouts may be rare or fake.
________________________________________
💡 How it adds value
• Strips away unnecessary complexity (no lagging averages).
• Focuses directly on what price is doing structurally.
• Adaptive → works across different markets & timeframes.
• Easy visualization → zones, trend coloring, breakout markers.
• Helps traders trade with the flow of the market, instead of guessing tops/bottoms.
________________________________________
👉 In short:
This indicator turns raw price action into clear, actionable zones.
It highlights when the market shifts from balance to breakout, so traders can align with momentum rather than fighting it.

Tahir's Dual MTF order blocks Order Blocks + Swing Levels (Dual MTF, Fixed, Extended, NoAutoClose)
This tool combines smart orderblock detection with swinghigh / swinglow validation, designed for traders who want precise, rulebased zone plotting without repainting tricks or automatic deletion of historical levels.
🔥 What this indicator does
1️⃣ Detects Order Blocks Across Multiple Timeframes
It automatically finds bullish & bearish order blocks using three layers:
Current timeframe OBs
Higher Timeframe 1 (custom selectable)
Higher Timeframe 2 (custom selectable)
Each layer is colorcoded so you instantly know where institutional zones exist.
Order blocks remain extended forward until price fills them, giving a realistic market structure map.
2️⃣ Keeps Zones Until They Are Truly Filled
Unlike many scripts that autodelete boxes, this version:
✔️ Extends zones to the right
✔️ Tracks “active” vs. “filled” OBs
✔️ Prevents unnecessary removal
This allows proper backtesting and historical reference.
3️⃣ SwingHigh & SwingLow Confirmation
The script overlays SWL/SWH labels to identify pivot turning points.
An order block becomes a validated zone when:
Bullish OB + Swing Low (SWL)
Bearish OB + Swing High (SWH)
Validated zones are highlighted with special colors:
🟩 Lime = Valid Bullish OB
🟪 Fuchsia = Valid Bearish OB
This filters out weak zones and highlights only strong price bases.
4️⃣ DualTimeframe Logic
You can enable/disable each timeframe independently:
HTF1 (e.g., 1H)
HTF2 (e.g., 4H)
Current chart timeframe
This gives flexibility for scalpers, swing traders, and position traders.
5️⃣ Optimized & Debugged
The script has:
Memory controls (limits stored boxes)
Stable boxextension logic
No repainting structure logic
Clearly separated and readable functions
Everything is optimized to avoid lag while handling many OB zones.
⚙️ Key Inputs
Show Long / Short OBs
Enable HTF1 & HTF2
Custom timeframes
Swing detection length
Memory limit for stored zones
📌 UseCases
Institutional trading models
Smartmoney concepts
Supply & demand zone trading
Confluence with entries (FVG, BOS, RSI, etc.)
This indicator is a visual decisionsupport tool — not a buy/sell signal system.
⚠️ Disclaimer
This script does not repaint, but trading always carries risk.
Use alongside price action and risk management.

VPOC Harmonics - Liquidity-Weighted Price / Time RatiosVPOC Harmonics - Liquidity-Weighted Price / Time Ratios
Summary
This indicator transforms a swing’s price range, duration, and liquidity profile into a structured set of price-per-bar ratios. By anchoring two points and manually entering the swing’s VPOC (highest-volume price), it generates candidate compression values that unify price, time, and liquidity structure. These values can be applied to chart scaling, harmonic testing, and liquidity-aware market geometry.
________________________________________
Overview
Most swing analysis tools only consider price (ΔP) and time (N bars). This script goes further by incorporating the VPOC (Point of Control) — the price with the highest traded volume — directly into swing geometry.
• Anchors define the swing’s Low (L), High (H), and bar count (N).
• The user manually enters the VPOC (highest-volume price).
• The indicator then computes a suite of ratios that integrate range, duration, and liquidity placement.
The output is a table of liquidity-weighted price-per-bar candidates, designed for compression testing and harmonic analysis across swings and instruments.
________________________________________
How to Use
1. Select a Swing
- Place Anchor A and Anchor B to define the swing’s Low, High, and bar count.
2. Find the VPOC
- Apply TradingView’s Fixed Range Volume Profile tool over the same swing.
- Identify the Point of Control (POC) — the price level with the highest traded volume.
3. Enter the VPOC
- Manually input the POC into the indicator settings.
4. Review Outputs
- The table will display candidate ratios expressed mainly as price-per-bar values.
5. Apply in Practice
- Use the ratios as chart compression inputs or as benchmarks for testing harmonic alignments across swings.
________________________________________
Outputs
Swing & Inputs
• Bars (N): total bar count of the swing.
• Low (L): swing low price.
• High (H): swing high price.
• ΔP = H − L: price range.
• Mid = (L + H) ÷ 2: midpoint price.
• VPOC (V): user-entered highest-volume price.
• Base slope s0 = ΔP ÷ N: average change per bar.
• π-adjusted slope sπ = (π × ΔP) ÷ (2 × N): slope adjusted for half-cycle arc geometry.
________________________________________
VPOC Harmony Ratios (L, H, V, N)
• λ = (V − L) ÷ ΔP: normalized VPOC position within the range.
• R = (V − L) ÷ (H − V): symmetry ratio comparing lower vs. upper segment.
• s1 = (V − L) ÷ N: slope from Low → VPOC.
• s2 = (H − V) ÷ N: slope from VPOC → High.
________________________________________
Blended Means (s1, s2)
These combine the two segment slopes in different ways:
• HM(s1,s2) = 2 ÷ (1/s1 + 1/s2): Harmonic mean, emphasizes the smaller slope.
• GM(s1,s2) = sqrt(s1 × s2): Geometric mean, balances both slopes proportionally.
• RMS(s1,s2) = sqrt((s1² + s2²) ÷ 2): Root-mean-square, emphasizes the larger slope.
• L2 = sqrt(s1² + s2²): Euclidean norm, the vector length of both slopes combined.
________________________________________
Slope Blends
• Quadratic weighting: s_quad = s0 × ((V−L)² + (H−V)²) ÷ (ΔP²)
• Tilted slope: s_tilt = s0 × (0.5 + λ)
• Entropy-scaled slope: s_ent = s0 × H2(λ), with H2(λ) = −
________________________________________
Curvature & Liquidity Extensions
• π-arc × λ: s_arc = sπ × λ
• Liquidity-π: s_piV = sπ × (V ÷ Mid)
________________________________________
Scale-Normalized Families
With k = sqrt(H ÷ L):
• k (scale factor) = sqrt(H ÷ L)
• s_comp = s0 ÷ k: compressed slope candidate
• s_exp = s0 × k: expanded slope candidate
• Exponentiated blends:
- s_kλ = s0 × k^(2λ−1)
- s_φλ = s0 × φ^(2λ−1), with φ = golden ratio ≈ 1.618
- s_√2λ = s0 × (√2)^(2λ−1)
________________________________________
Practical Application
All formulas generate liquidity-weighted price-per-bar ratios that integrate range, time, and VPOC placement.
These values are designed for:
• Chart compression settings
• Testing harmonic alignments across swings
• Liquidity-aware scaling experiments
________________________________________
