Swing Point Indicator🔍 How does it work?
He looks at a candle and compares it with a number of candles to the left and right.
If that candle is the highest of that group, then it is a swing high.
If that candle is the lowest, then it is a swing low.
📈 What do you use it for?
Reading market structure:
You can easily see higher highs / higher lows (bullish structure)
Or lower highs / lower lows (bearish structure)
Determining BOS & CHoCH:
If a new swing low breaks below the previous one → Break of Structure (BOS)
If you go from HH/HL to LH/LL → Change of Character (CHoCH)
Finding entry and exit points:
You know where to expect price reactions (at swing points)
Good for pullback entries or stop loss placement
Drawing smart zones:
You can draw from swing high to swing low for Fibs, order blocks or S&D zones
*** Translated with www.DeepL.com (free version) ***
在脚本中搜索"swing"

Rendon1 Swing Market Turns**Swing Market Turns Indicator**
This indicator identifies potential swing highs and swing lows by integrating Relative Strength Index (RSI), volume confirmation, and higher timeframe (HTF) levels to accurately detect market reversals and turning points. Specifically optimized for swing traders, this tool aims to pinpoint moments when price momentum is shifting, providing clear signals for trade entries and exits.
### How It Works:
- **RSI Divergence:** Detects momentum shifts through RSI overbought and oversold conditions.
- **Higher Timeframe Levels:** Confirms reversals using support and resistance levels from higher timeframes.
- **Volume Confirmation:** Ensures stronger validity of signals by checking if current volume exceeds the moving average of recent volume.
### Key Features:
- Visual labels on chart clearly indicating potential swing highs and lows.
- Customizable RSI period, RSI overbought/oversold thresholds, volume moving average length, and higher timeframe selections.
- Built-in alert conditions for immediate notifications when swing opportunities are detected.
### Recommended Use:
- Ideal for traders focusing on swing trading strategies, particularly those looking for high-probability turning points.
- Effective across multiple assets including forex, stocks, commodities, and crypto.
- Suitable for various intraday and higher timeframes, with customization options available.
### Settings:
- **RSI Period:** Adjust the sensitivity of RSI calculation.
- **Higher Timeframe:** Select the timeframe used for support/resistance reference.
- **RSI Overbought/Oversold:** Customize thresholds defining extreme RSI values.
- **Volume MA Length:** Specify the length for volume moving average calculation.
Feel free to customize the parameters to best fit your trading style and asset of choice.
**Disclaimer:**
This indicator does not guarantee profitable trades and should be used in conjunction with proper risk management and additional analysis methods.
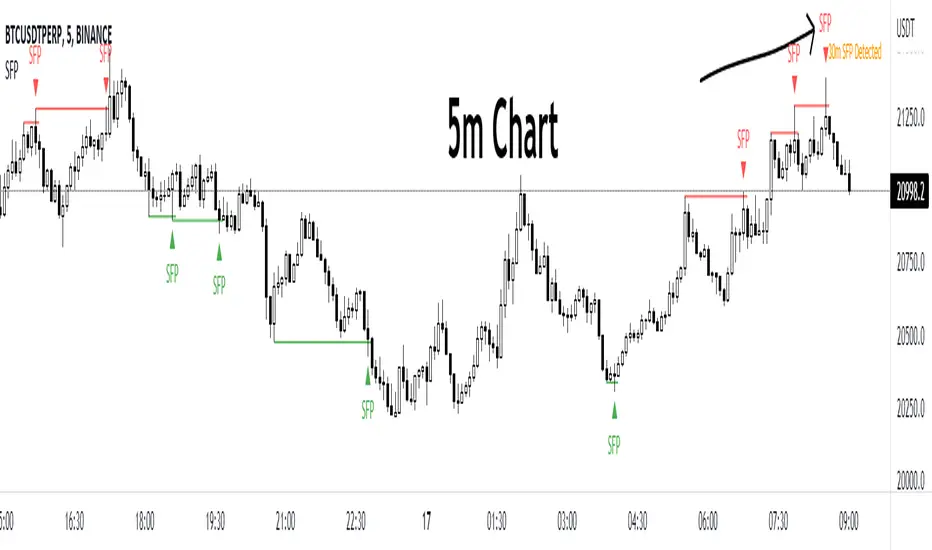
CandelaCharts - Swing Failure Pattern (SFP)# SWING FAILURE PATTERN
📝 Overview
The Swing Failure Pattern (SFP) indicator is designed to identify and highlight Swing Failure Patterns on a user’s chart. This pattern typically emerges when significant market participants generate liquidity by driving price action to key levels. An SFP occurs when the price temporarily breaks above a resistance level or below a support level, only to quickly reverse and return within the previous range. These movements are often associated with stop-loss hunting or liquidity grabs, providing traders with potential opportunities to anticipate reversals or key market turning points.
A Bullish SFP occurs when the price dips below a key support level, triggering stop-loss orders, but then swiftly reverses upward, signaling a potential upward trend or reversal.
A Bearish SFP happens when the price spikes above a key resistance level, triggering stop-losses of short positions, but then quickly reverses downward, indicating a potential bearish trend or reversal.
The indicator is a powerful tool for traders, helping to identify liquidity grabs and potential reversal points in real-time. Marking bullish and bearish Swing Failure Patterns on the chart, it provides clear visual cues for spotting market traps set by major players, enabling more informed trading decisions and improved risk management.
📦 Features
Bullish/Bearish SFPs
Styling
⚙️ Settings
Length: Determines the detection length of each SFP
Bullish SFP: Displays the bullish SFPs
Bearish SFP: Displays the bearish SFPs
Label: Controls the size of the label
⚡️ Showcase
Bullish
Bearish
Both
📒 Usage
The best approach is to combine a few complementary indicators to gain a clearer market perspective. This doesn’t mean relying on the Golden Cross, RSI divergences, SFPs, and funding rates simultaneously, but rather focusing on one or two that align well in a given scenario.
The example above demonstrates the confluence of a Bearish Swing Failure Pattern (SFP) with an RSI divergence. This combination strengthens the signal, as the Bearish SFP indicates a potential reversal after a liquidity grab, while the RSI divergence confirms weakening momentum at the key level. Together, these indicators provide a more robust setup for identifying potential market reversals with greater confidence.
🚨 Alerts
This script provides alert options for all signals.
Bearish Signal
A bearish signal is triggered when a Bearish SFP is formed.
Bullish Signal
A bullish signal is triggered when a Bullish SFP is formed.
⚠️ Disclaimer
Trading involves significant risk, and many participants may incur losses. The content on this site is not intended as financial advice and should not be interpreted as such. Decisions to buy, sell, hold, or trade securities, commodities, or other financial instruments carry inherent risks and are best made with guidance from qualified financial professionals. Past performance is not indicative of future results.

Swing High/Low Pivots Strategy [LV]The Swing High/Low Pivots Strategy was developed as a counter-momentum trading tool.
The strategy is suitable for any market and the default values used in the input settings menu are set for Bitcoin (best on 15min). These values, expressed in minimum ticks (or pips if symbol is Forex) make this tool perfectly adaptable to every symbol and/or timeframe.
Check tooltips in the settings menu for more details about every user input.
STRTEGY ENTRY & EXIT MECHANISMS:
Trades Entry based on the detection of swing highs and lows for short and long entries respectively, validated by:
- Limit orders placed after each new pivot level confirmation
- Moving averages trend filter (if enabled)
- No active trade currently open
Trades Exit when the price reaches take-profit or stop-loss level as defined in the settings menu. A double entry/second take-profit level can be enabled for partial exits, with dynamic stop-loss adjustment for the remaining position.
Enhanced Trade Precision:
By limiting entries to confirmed swing high (HH, LH) or swing low (HL, LL) pivot points, the strategy ensures that trades occur at levels of significant price reversals. This precision reduces the likelihood of entering trades in the midst of a trend or during uncertain price action.
Risk Management Optimization:
The strategy incorporates clearly defined stop-loss (SL) and take-profit (TP) levels derived from the pivot points. This structured approach minimizes potential losses while locking in profits, which is critical for consistent performance in volatile markets.
Trend Filtering for Better Entry:
The use of a configurable moving average filter adds a layer of trend validation. This prevents entering trades against the dominant market trend, increasing the probability of success for each trade.
Avoidance of Noise:
The lookback period (length parameter) confirms pivots only after a set number of bars, effectively filtering out market noise and ensuring that entries are based on reliable, well-defined price movements.
Adaptability Across Markets:
The strategy is versatile and can be applied across different markets (Forex, stocks, crypto) due to its dynamic use of ticks and pips converters. It adapts seamlessly to varying price scales and asset types.
Dual Quantity Entries:
The original and optionnal double-entry mechanism allows traders to capture both short-term and extended profits by scaling out of positions. This adaptive approach caters to varying risk appetites and market conditions.
Clear Visualization:
The plotted pivot points, entry limits, SL, and TP levels provide visual clarity, making it easy for traders to track the strategy's behavior and make informed decisions.
Automated Execution with Alerts:
Integrated alerts for both entries and exits ensure timely actions without the need for constant market monitoring, enhancing efficiency. Configurable alert messages are suitable for API use.
Any feedback, comments, or suggestions for improvement are always welcome.
Hope you enjoy!

Swing Points [Syafiq.Jr]The Swing Points indicator by Syafiq.Jr is designed to identify and visualize pivotal market structures such as Higher Highs (HH), Lower Highs (LH), Lower Lows (LL), and Higher Lows (HL) directly on the chart. This tool is essential for traders who utilize swing trading strategies and rely on understanding market trends through key price levels.
Key Features:
Pivot Strength: Configurable pivot strength to customize the sensitivity of swing points.
Customizable Visuals: Users can adjust the colors and visibility of the zones for each swing point category (HH, LH, LL, HL) based on their preferences.
Multiple Timeframe Support: The indicator offers the flexibility to display swing points from the current timeframe or higher timeframes such as 5-minute, 15-minute, 30-minute, 1-hour, 4-hour, and daily intervals.
Dynamic Extension Lines: Automatically extend key levels across the chart for ongoing reference.
Configurable Font Sizes: Adjust the font size for labels marking the swing points to ensure clear visualization.
This indicator is ideal for traders who need to spot and track critical swing points across different timeframes, enabling better decision-making in trending and ranging markets.

Swing Points [CrossTrade]The "Swing Points" indicator is designed to help identify key swing points, trends, and potential support and resistance areas on a trading chart. This indicator overlays on the price chart and offers several features for enhanced market analysis.
Swing Point Identification: The indicator identifies swing highs and lows (pivot points) over a user-defined period. These points are crucial in understanding market reversals and momentum.
Swing Points Display: Users have the option to visually display these pivot points on the chart. Swing highs are marked with a red "H" above the bar, and swing lows with a green "L" below the bar, aiding in quick visual identification.
Center Line Calculation and Display: A dynamic center line is calculated using the pivot points, providing a baseline that adapts to market movements. The center line's appearance changes based on its position relative to the current price, making it a useful trend indicator.
Support and Resistance Levels: The indicator plots horizontal support and resistance lines based on the swing lows and highs, respectively. This feature helps traders identify potential areas of price consolidation or breakout.
Customization Options: Users can customize the period for swing point calculation and choose whether to display the pivot points, center line, and support/resistance levels.
Alert Features
Swing High Break Alert: An alert is triggered when a new swing high is detected, signaling a potential upward momentum shift.
Swing Low Break Alert: This alert activates when a new swing low is formed, possibly indicating a downward momentum shift.
Center Line Trend Color Change Alert: Alerts users when the center line changes its trend color, which could signify a change in overall market trend direction.

Swing Pivots [UkutaLabs]█ OVERVIEW
The Swing Pivots indicator uses relevant price-action information to identify key levels of Support and Resistance. Traders will be able to use current day Swing Pivots as well as mirror higher time frame Swing Pivots to gain a stronger understanding of overall market strength and key levels.
The aim of this script is to improve the users trading experience by offering a versatile toolkit that can be used in a wide variety of trading strategies to help simplify the complexities of the market.
█ USAGE
Throughout the trading day, the script will automatically identify key High and Low levels in the market based on currently relevant price action information, giving users potentially strong support and resistance levels which serve to guide the trader throughout the complexities in the market.
The script will also Identify powerful Order Blocks which are clusters of orders executed at a specific price level which represent an imbalance between supply and demand. By identifying Order Blocks, the script can indicate valuable supply and demand zones which help signal potential market turning points for the trader.
Furthermore, the script allows the user to mirror higher time frame Swing Pivots onto lower time frame charts to gain a stronger understanding of overall market strength and key levels on multiple time frames from a single chart.
█ SETTINGS
Configuration
Pivot Strength: Determines the sensitivity of the pivot calculation. A higher strength will result in less pivots being drawn, and a lower strength will result in more pivots being drawn.
Current Time frame
• Display: Determines whether or not Swing Pivots from the current time frame will be drawn on the chart.
5 Minute (Higher Time Frame)
• Display: Determines whether or not Swing Pivots from the 5 minute time frame will be drawn on the chart.
15 Minute (Higher Time Frame)
• Display: Determines whether or not Swing Pivots from the 15 minute time frame will be drawn on the chart.
30 Minute (Higher Time Frame)
• Display: Determines whether or not Swing Pivots from the 30 minute time frame will be drawn on the chart.
1 Hour (Higher Time Frame)
• Display: Determines whether or not Swing Pivots from the 1 hour time frame will be drawn on the chart.
4 Hour (Higher Time Frame)
• Display: Determines whether or not Swing Pivots from the 4 hour time frame will be drawn on the chart.
Daily (Higher Time Frame)
• Display: Determines whether or not Swing Pivots from the daily time frame will be drawn on the chart.

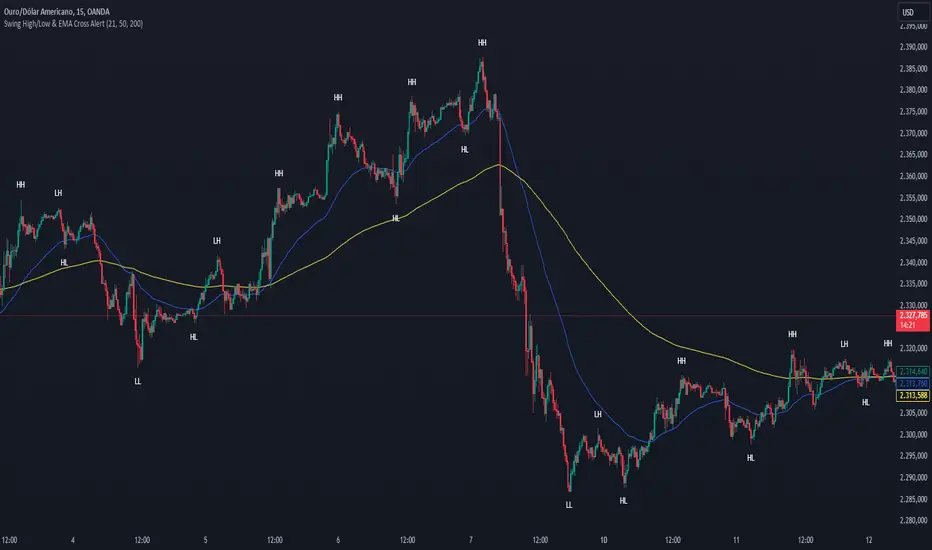
Swing High/Low & EMA Cross AlertScript Description:
This script on TradingView combines the detection of Swing High/Low points with exponential moving average (EMA) crossovers to provide buy and sell alerts and to mark swing points on the chart.
What the Script Does:
Swing High/Low Detection:
Uses the ta.pivothigh function to detect significant high points and the ta.pivotlow function to detect significant low points.
For each detected point, the script checks if it is a new higher high (HH) or lower high (LH) for the highs, and a new lower low (LL) or higher low (HL) for the lows.
Creates visual labels to identify these points on the chart, helping traders to visualize potential reversal points.
EMA Crossover:
Calculates two EMAs: a fast EMA (fastEMA) with a default period of 50 and a slow EMA (slowEMA) with a default period of 200.
Detects bullish crossovers (when fastEMA crosses above slowEMA) and bearish crossunders (when fastEMA crosses below slowEMA).
Generates buy and sell alerts based on these crossovers.
How the Script Works:
EMA Calculation: EMAs are calculated using the closing prices and user-defined periods.
Swing High/Low Detection: Uses the high and low values from the previous length bars to determine the swing points.
Alert Generation: Alerts are triggered when crossovers between the EMAs occur.
How to Use the Script:
Add to Chart: Insert the script into TradingView and apply it to the desired chart.
Configure Parameters:
Adjust the detection period for swing points (length).
Configure the periods for the EMAs (fastLen and slowLen).
Customize the colors for the swing point labels as per your preference.
Monitor Alerts: Use the EMA crossover alerts to make buy or sell decisions. Observe the swing point labels to identify potential trend reversals.
Justification for the Combination:
EMAs: Widely used to identify trend direction. Combining a fast EMA with a slow EMA helps capture both short-term and long-term trend changes.
Swing High/Low: Identifies reversal points in price, which are crucial for determining potential entry and exit points in trades.
Combination:
Combining EMAs and Swing High/Low provides a comprehensive view of price behavior, helping traders to effectively identify trends and reversal points.
This script is useful for traders who want to combine trend analysis (via EMAs) with the identification of reversal points (Swing High/Low), providing a more complete view of price behavior on the chart.
Swing Failure Zones and Signals [AlgoAlpha]Elevate your trading strategy with the Swing Failure Zones and Signals indicator by AlgoAlpha! This powerful tool helps you identify potential swing failure zones, offering clear bullish and bearish signals to guide your trading decisions. 📈💡
🎨 Bullish/Bearish Color Customization : Easily set the colors for bullish and bearish signals to match your chart preferences.
🧹 Mitigated Zone Removal : Option to remove mitigated zones from the chart for a cleaner view.
🔍 Range High/Low Lookback : Adjustable lookback period for determining significant highs and lows.
🖌 Dynamic Zone Creation : Automatically draws zones based on swing failure criteria.
🔔 Alert Conditions : Set alerts for both bullish and bearish swing failure conditions to stay informed without constant monitoring.
Quick Guide to Using the Swing Failure Zones and Signals Indicator
🛠 Add the Indicator : Search for "Swing Failure Zones and Signals " in TradingView's Indicators & Strategies. Customize settings like lookback period, colors, and zone removal options to fit your trading style.
📊 Market Analysis : Watch for the appearance of the zones and the directional arrows for potential reversal signals. Use these signals to identify key market entries and exits.
🔔 Alerts : Enable alerts for bullish and bearish swing failure conditions to capture trading opportunities without constant chart monitoring.
How it works
The indicator calculates the direction and length of each candle to identify swing failure points by comparing current high and low prices with those from the lookback period. A bullish swing failure is detected when the current low is lower than the previous low and the close is higher than the previous high, while a bearish swing failure occurs when the current high is higher than the previous high and the close is lower than the previous low. Upon detection, the script creates zones on the chart to indicate these failure points and manages them by removing invalidated zones based on the user's settings. Visual signals are plotted on the chart as arrows, and alerts are set for these conditions to help traders capture potential entry opportunities efficiently.
Enhance your trading edge with this robust tool designed to spotlight critical swing failure points in the market! 💪📈

Swing Point Oscillator with Trend Filter [Quantigenics]The "Swing Point Oscillator with Trend Filter" is a sophisticated trading oscillator designed to enhance trading decisions by adapting to market conditions. Oscillators typically signal overbought/oversold market states, often yielding false signals in strong trends. This trend indicator addresses this by implementing a 'Trend Filter' which changes color in strong trends, alerting traders to avoid typical oscillator reversals. In strong trends (when the trend Filter is red), mid-high or mid-low levels can be used for pullback entries. In more neutral markets (when the trend Filter is close to blue), extreme high and low levels (top and bottom) can be used, as a true 'over bought / over sold' oscillator. The oscillator combines components of the Stochastic Oscillator and the CCI, then normalizes the result, providing a unique, adaptive signal. The color-coded lines and Trend Filter offer clear visual cues, making this a comprehensive tool for various market scenarios.
Caution: Always use the indicator in conjunction with other tools and analysis methods to confirm trading decisions. Avoid trading solely based on this indicator.
GOLD 4HR
CL1! 4HR
How to Use:
Swing Point Oscillator: Displays the momentum of the price relative to its recent high and low.
Trend Filter: Highlights the general direction of the market trend.
Zones: Visual representation to categorize oscillator values (Up Zone and Down Zone).
Interpretation:
Oscillator:
When the oscillator moves upward and approaches or enters the Up Zone, it indicates increasing bullish momentum.
When the oscillator moves downward and approaches or enters the Down Zone, it suggests increasing bearish momentum.
Values near the middle (around zero) often indicate indecision or consolidation in the market.
Trend Filter:
A trend filter line above the Mid-High or below the Mid-Low suggests a strong trend.
When the trend filter is between the Mid-High and Mid-Low, it might indicate a weaker or sideways trend.
Its color will change based on its position relative to the zones. For instance, it turns red when indicating a stronger trend.
Zones:
Up Zone: The area between the Top Line and the Mid-High. Indicates strong bullish momentum when the oscillator is within this zone.
Down Zone: The area between the Mid-Low and the Bottom Line. Indicates strong bearish momentum when the oscillator is in this zone.
Trading Tips:
Bullish Scenario: Consider long positions when the oscillator is rising, and the trend filter indicates a strong upward trend.
Bearish Scenario: Consider short positions when the oscillator is falling, and the trend filter indicates a strong downward trend.

Swing Failure Reversal StrategyThis strategy is using Swing Failure Patterns as a reversion indicator.
The strategy automatically adapts itself to the timeframe of the current chart.
Swing Failure Pattern occurs when the price trend fails to set new highs in uptrend or meet new lows in a downtrend. This pattern helps traders decide when to enter and exit the market. Usually, traders enter in the downtrend i.e. lower price highs and lower price lows, and exit in the uptrend situation i.e. higher price highs and higher price lows. Thus, traders go against the current trend. This helps the traders take advantage of early trend reversal indicators.
Types of Failure Swing :
Failure Swing Top: This occurs when the stock price goes higher whereas the RSI fails to make a higher high and falls below the recent fail point. The Fail Point is where the RSI line is below the recent swing low. This Failure Swing indicates a short position.
Failure Swing Bottom: This occurs when the stock price gets lower whereas RSI fails to make a lower low and rises over the recent fail point. Fail point is the point where the RSI line is above the recent swing high. This Failure Swing indicates a long position.

Swing Failure Pattern by EmreKbThe indicator detect to swing failure pattern and shows it.
Swing Failure Pattern (or SFP) is a type of reversal pattern in which (swing) traders target stop-losses above a key swing low or below a key swing high to push the price in the other direction by generating enough liquidity.
Swing Trades Validator - The One TraderThis swing trading strategy validator is built on the original strategy taught in my bootcamp for swing traders.
The strategy is simple and follows a trend trading pattern on prices reacting to Exponential Moving Averages over a multiple time-frame analysis.
The details of the strategy are as follows:
- Holding Period : Upto a couple of months
- Time-frames to be analysed : Month - Week - Day
- Trade Execution : Daily Time-frame
Analysis Details:
Step 1 : On the Monthly time-frame, the candle needs to be bullish with the latest close being higher than the opening price of the month.
Step 2 : The price needs to be above the 8ema on the Monthly time-frame.
Step 3 : The 8ema must be above the 20ema on the Monthly time-frame.
The above steps indicate a bullish strength in the instrument on the Monthly time-frame.
Step 4 : On the Weekly time-frame, the candle needs to be bullish with the latest close being higher than the opening price of the week.
Step 5 : The price needs to be above the 8ema on the Weekly time-frame.
Step 6 : The 8ema must be above the 20ema on the Weekly time-frame.
The above steps indicate a bullish strength in the instrument on the Weekly time-frame.
Step 7 : On the Daily time-frame, the candle needs to be bullish with the latest close being higher than the opening price of the day.
Step 8 : The price needs to be above the 8ema on the Daily time-frame.
Step 9 : The 8ema must be above the 20ema on the Daily time-frame.
The above steps indicate a bullish strength in the instrument on the Daily time-frame.
Step 10 : While the 8ema is above the 20ema on the Daily time-frame, the price must be allowed to rise before a pullback is seen towards the moving averages, indicating a bearish move trying to change the trend.
Step 11 : These pullback candles need to form a pattern called the Ring Low with the second pullback candle having a lower high and lower low and the low of the last pullback candle being lesser than or equal to the fat ema on the Daily time-frame.
Step 12 : If the stock is still bullish and the trend is displaying a strength in the underlying bullish direction, then there will be a resumption candle that will have a closing price higher than the previous day's high price.
This trend continuation signal is a confirmation that the instrument will continue in the underlying trend direction and we will be able to enter if this condition is satisfied.
The profit and loss percentages are set at a default 10% as this can be a minimum risk : reward for swing trades on average, but the inputs have been made available to the users in order to adjust the risk : reward to find the most optimum breathing room for each individual stock or instrument. This will give the user a highly custom overview of the strategy on individual instruments based on their volatility and price movements.
The strategy tester will auto back-test this strategy historically and find all the trades that were taken based on this strategy and populate a performance summary.
The most important data in V1.0 of this script are as follows:
1. No. of Trades Taken : We want to see many trades being taken on this strategy in that particular instrument. This shows us a healthy report on the number of winning vs. losing trades.
2. Percentage Profitable : We want to see that this strategy has worked out in the past and is giving us a high probability of return. This in no way an indication that the strategy will definitely work out in the future as well, but gives us an idea of whether or not we should enter this trade.
3. No. of Winning Trades vs. Losing Trades : We would like to see a significantly higher number of winning trades.
4. Avg. # of bars in a trade : This gives us an idea of how long on average we might have to wait to see the results of this strategy either in favor of our reward or against our desired direction. Some trades can be completed in around 15-20 bars on average and some trades have shown to take upto 45 days to reach desired reward. This is in line with our planned holding period, but gives the trader a sense of time and increased level of patience.
The future updates will have more utility of the various elements of the strategy tester and the entire exit strategy will be integrated into the script.
This script is not to be used as a standalone method and must be studied well in order to execute trades. I have not hidden visibility on other time-frames, but since order execution is done on the Daily time-frame, the script must run on the Daily time-frame only.
There are many other factors to be taken into consideration before entering a trade and proper risk management and position sizing rules must be followed.
Our bootcamp participants will use this strategy tester in conjunction with the invite-only Trading Toolkit assigned to them.
The development of this script will be ongoing and all comments and feedback are welcome.

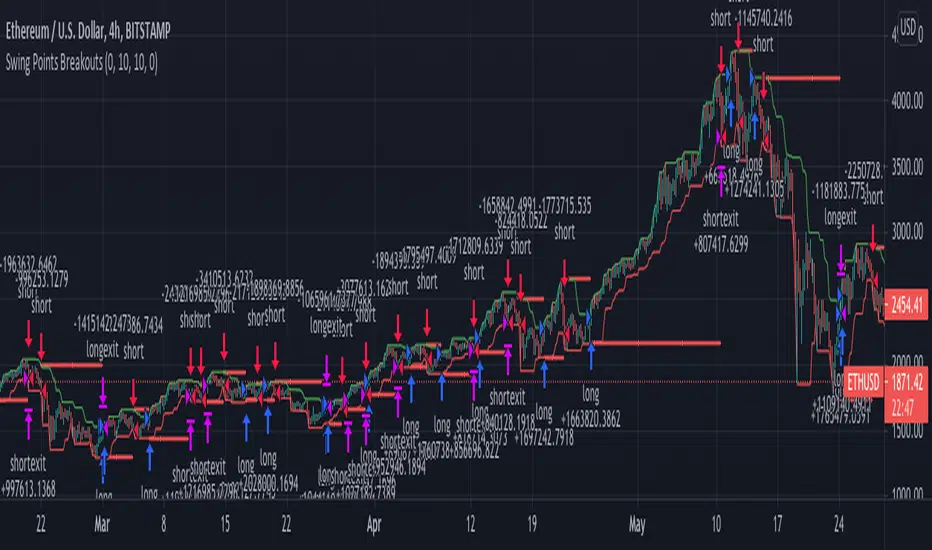
Swing Points BreakoutsLong term strategy for managing a Crypto investment with Swing Trades of more than 1 day. The strategy buys with a
stop order at the Swing High price (green line) and sells with a stop order at the Swing Low price (red line).
The direction of the strategy can be adjusted in the Inputs panel.
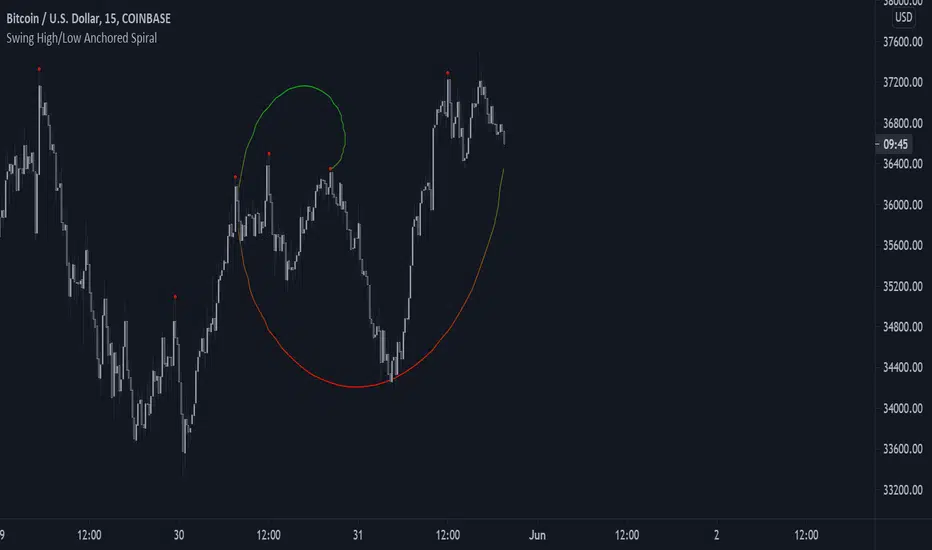
Swing High/Low Anchored SpiralFit the estimate of an Archimedean spiral to the price, with a central point determined by swing high/lows.
Users can determine which historical swing high/low to use as the spiral central point and can choose the number of turns it should make.
You can create cool shapes, cool enough to satisfy your apophenia needs.
If you are having issues just hide and unhide the script, or just lower the length/occurrence setting.
Posting is impossible without the support of my Patreons as well as @LuxAlgo, my scripts are dedicated to them.
Swing-Trade-Stocks SystemThis is a simple swing trade system inspired by sources on the internet. The rules are as follows:
Buy when first green arrow appears after 10ma above 30ma
Set stop-loss below most recent support
Set take-profit below most recent swing point high or wait until price closes below 30ma (red)
Short when first purple arrow appears after 10ma below 30ma
Set stop-loss above most recent resistance
Set take-profit above most recent swing point low or wait until price closes above 30ma (red)
The background color changes based on the direction of SPY. If SPY is going down (10ma < 30ma) the
background will be red and only short indicators (purple arrows) will appear. If SPY is going up (10ma > 30ma),
the background will be green and only long indicators (green arrows) will appear.
Happy trading!
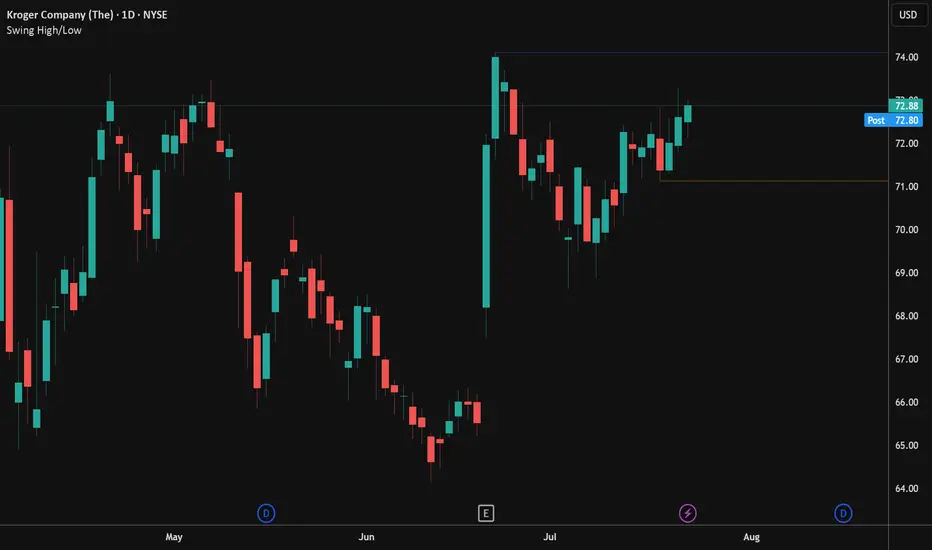
Swing High/LowPlots the swing high and low points based on user configurable look back settings. Also allows you to plot the most recent swing low as a horizontal line for obvious stop point on long setups.
Swing PointsVery basic indicator to highlight Swing Low and Swing High points in the chart with some primitive filtering to reduce noise.

Swing High Low Liquidity Pools with Purge CriteriaThis Pine Script indicator plots dynamic liquidity pool levels from swing highs/lows using two configurable sensitivities (short-term and longer-term), extends lines until breached by a percentage threshold, and displays horizontal All-Time High (ATH) and All-Time Low (ATL) lines. User can choose to hide liquidity pool levels that are no longer active.
Recommended for higher time frames like daily and weekly.

Swing HelperThis script, titled "Swing helper", is a multi-metric dashboard designed to provide a comprehensive snapshot of a security's volatility, relative volume, and price action health directly on the chart. It focuses on Average Daily Range (ADR) relationship and key performance indicators to help traders identify setups like volatility contractions or trend strength.
Key Features
Dual-ADR Analysis: Calculates and compares Long-Term (LT) and Short-Term (ST) ADR percentages. The ADR Ratio helps identify when volatility is expanding or contracting relative to historical norms.
Relative Volume (RVol): Compares current volume to a 20-day moving average, highlighting institutional participation.
Dynamic Closing Range: Visualizes where the price is closing relative to the day's true range (the "Closing Range %"), indicating buying or selling pressure.
SMA 50 Distance: A unique metric that measures the price's distance from the 50-day Simple Moving Average in "ADR units," helping to gauge how overextended a stock is.
Automated Price Projections: Dynamically plots -1x and -2x ADR levels from the current price to provide immediate downside targets or support levels.
Custom Bar Coloring: Highlights specific price action patterns:
Inside Days (Blue)
Upside Reversals (Green)
Downside Reversals (Red)
Visual Customization
The script includes a highly flexible Summary Table with customizable positions, sizes, and colors (including borders and headers), allowing it to fit into any dark or light mode chart layout without obstructing price action.
How to Use
Volatility Contraction: Watch for the ADR Ratio to drop, indicating a tightening range before a potential breakout.
Relative Strength: Look for high RVol combined with a high Closing Range % (e.g., >75%) to confirm strong demand.
Mean Reversion: Use the SMA50 Dist metric to identify when a stock is "stretched" too far from its moving average relative to its daily volatility.

Swing Traders Panel: Beta RVOL ATR Market Sector FnG ImtiazHA compact decision-support panel for swing traders combining volatility, relative volume, market & sector regime, and a 3-zone Fear/Greed filter to improve trade context and risk management.

Swing Trade AL/SAT + Güç Derecesi_huğurlu
Weak signal → MACD crossover only.
Moderate signal → MACD crossover + RSI confirmation.
Strong signal → MACD crossover + RSI + Stoch RSI confirmation.
BUY/SELL labels appear on the chart in different colors and sizes.
This way, you can instantly see which signal is more reliable.
Zayıf sinyal → sadece MACD kesişim var
Orta sinyal → MACD kesişim + RSI teyidi.
Güçlü sinyal → MACD kesişim + RSI + Stoch RSI teyidi.

Swing Data - SimplifiedThe swing data indicator by jfsrev but simplified. Thank you jfsrev for your work!