HFT Divergence Hunter IndicatorDefault Settings are meant to be used in BTC/USDT chart on 5 min time frame on Binance Futures. If you want to use for another asset on another time frame YOU MUST CHANGE THE SETTINGS
This is a divergence finding indicator developed by HFT Research. It is a highly customizable indicator and provides endless opportunities to find profitable trades in the market.
Use Envelope, this is the main decision maker in this strategy. The idea behind is that you choose the length of the moving average and set an offset % to create an upper and lower band. If you click on “display envelope” you will be able to visually see the band you have created. This way, you get to scalp the market as the price is diverging and moving away from the moving average. As the famous saying goes, moving averages act like magnets and prices always visits them back. Using this ideology, we aim to capitilize on the price swings that move away from the chosen moving average by x%.
STARC Bands;
These are two bands that are applied above and below a simple moving average of an asset’s price. The upper band is created by adding the value of the average true range (ATR) or a multiple of i. The lower band is created by subtracting the value of the ATR from the SMA. The channel can provide traders with ideas on when to buy or sell. During an overall uptrend, buying near the lower band and selling near the top band is favorable. However, from our testing results it does fairly poorly in crypto markets while it does pretty well in traditional markets.
Use RSI;
One of the most commonly used indicators in the trading world. The idea is simple, buy when its oversold and sell when its overbought. You can use RSI as a secondary confirmation of the dips. It can be turned on and off.
Use MFI
MFI stands for Money Flow Index and it is an oscillator like RSI. However, it does track the price in a different fashion than RSI providing a reliable option. It uses the price and volume data for identifying overbought and oversold signals in an asset.
Use Fisher Transform
Even though, it has a funny name, Fisher is actually a very decent and reliable indicator. It converts the prices into a Gaussian normal distribution channel. Therefore, the indicator detects when the prices have moved to an extreme, based on recent price action.
Use VWAP
VWAP stands for volume weighted average price. It is an extremely useful indicator when trading intra-day. It does reset every trading session which is at 00:00 UTC. Instead of looking at x number of candles and providing an average price, it will take into consideration the volume that’s traded at a certain price and weigh it accordingly. It will NOT give entry signals but act as a filter. If the price is above VWAP will filter out the shorts and other way around for longs.
Use ADX
Average directional index is a powerful indicator when one is assessing the strength of a trend as well as measuring the volatility in the market. Unfortunately, the worst market condition for this strategy is sideways market. ADX becomes a useful tool since it can detect trend. If the volatility is low and there is no real price movement, ADX will pick that up and will not let you get in trades during a sideways market. It will allow you to enter trades only when the market is trending.
Use Super trend Filter
The indicator works well in a trending market but can give false signals when a market is trading in a range.
It uses the ATR (average true range) as part of its calculation which takes into account the volatility of the market. The ATR is adjusted using the multiplier setting which determines how sensitive the indicator is.
Use MA Filter
Lookback: It is an option to look back x number of candles to validate the price crossing. If the market is choppy and the price keeps crossing up and down the moving average you have chosen, it will generate a lot of “noisy” signals. This option allows you to confirm the cross by selecting how many candles the price needs to stay above or below the moving average. Setting it 0 will turn it off.
MA Filter Type: There is a selection of moving averages that is available on TradingView currently. You can choose from 14 different moving average types to detect the trend as accurate as possible.
Filter Length: You can select the length of your moving average. Most commonly used length being 50,100 and 200.
Filter Type: This is our propriety smoothing method in order to make the moving averages lag less and influence the way they are calculated slightly. Type 1 being the normal calculation and type 2 being the secret sauce.
Reverse MA Filter: This option allows you to use the moving average in reverse. For example, the strategy will go long when the price is above the moving average. However, if you use the reserve MA Filter, you will go short when the price is above the moving average. This method works best in sideways market where price usually retraces back to the moving average. So, in an anticipation of price reverting back to the moving average, it is a useful piece of option to use during sideway markets.
Use MACD Filter
MACD here will act as a filter rather than an entry signal generator. There are a few different ways to use this MACD filter. You can click on the Use MACD filter and it will use filter out the shorts generated in a bullish territory and longs generated in the bearish territory. It will greatly reduce the number of trades the strategy will trade because MACD is a lagging indicator. By the time MACD turns bullish or bearish, most of the other indicators will have already generated the signals. Therefore, resulting in less trades. You can use MACD filter as MA oscillator meaning that it will only look at the MA lines in MACD to filter out trades. Alternatively, you can use it with the histogram (Signal lines) meaning that it will only look at the histogram whether its below or above the zero line in order to filter out the trades.
TP (%)
Place your desired take profit percentage here. Default is 1.5%
Move SL At Entry x% Profit
This is when the strategy will move your SL to the entry point if the position reaches x% profit. It can also generate a signal which can be automated to adjust the SL on the exchange.
SL (%)
Place your desired stop loss percentage here. Default is 1%
If you want to get access to this indicator please DM me or visit our website.
在脚本中搜索"take profit"

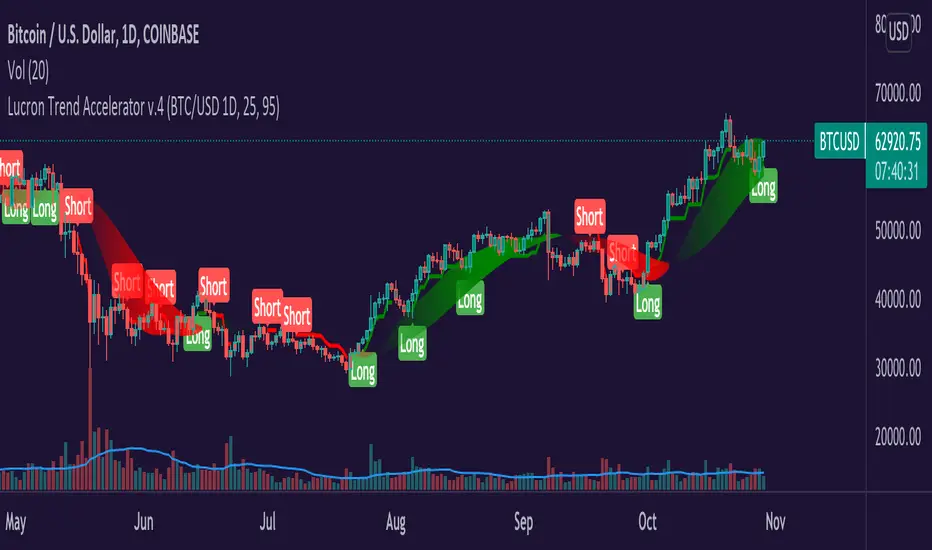
Lucron Trend Accelerator v.4Hey Everyone,
The Lucron Trend Accelerator v.4 is finally available. This indicator is market-specific, which means that it's proprietary code has been tested with best results in the following markets:
BTCUSD - DAILY TIMEFRAME
EURUSD - 1 HOUR TIMEFRAME
This can be applied to any market and any timeframe, but for best results, it's recommended to be used in the above markets. In the future, we are planning to add additional markets.
How it works:
Entry:
The indicator's code identifies emerging bullish and bearish trends. It then displays a "Long" OR "Short" signal on the chart - This marks an entry opportunity.
Position Management:
As the trend continues and your profit increases you will see a ribbon that affirms the direction of the trend. Green for long, and red for short.
Take Profit/ Exit:
Once you have completed the steps above just keep an eye out for a new signal. This signal will inform you of a shifting trend. It will display in the following ways:
A new "Long" Or "Short" signal displayed on your chart
A change in the color of the trend ribbon (from green to red)
If you have implemented a trailing stop, you'll be covered and should capture your profits or limit your risk before the next signal.
If you see any of these signals make sure to take action in order to protect your profits.
You can:
1. Exit the current trade & enter a new trade
2. Take profit on half the position & roll your stop to break even
Takeaways:
As you can now see, our proprietary Lucron Trend Accelerator Trading Tool allows for emotion free trading. It gently guides you by the hand, and shows you how to trade with a proven, calculated, and consistent strategy.
*Disclamer
Any information communicated by Lucron is solely for educational purposes. This is indicator is meant to be used with appropriate risk management and market analysis.
It is not intended to be and should not be interpreted as investment advice or a general recommendation on investment.
Bitcoin1% : High Leverage Indicator______________________________________________________________________________________________________________________
NOTE: Bitcoin1% is designed to work EXCLUSIVELY on BYBIT BTCUSD PERPETUAL CONTRACT chart on 1min TimeFrame on regular Candles
______________________________________________________________________________________________________________________
Bitcoin1% is a specialised indicator suite designed to catch 1% Bitcoin moves in either direction for High Leverage Trading.
Example: At 10x leverage catching 1% Bitcoin move will yield 10% profit
__________________________________________________________
Mechanism Of Action:
1. Identify trend: The script observers multiple parameters on higher timeframes to identify general trend & strength.
2. Take position: Once the trend is identified the script intends to take high probability positions for a 1% move in the direction of the trend. Currently there are 21 conditions that use bespoke datasets, along with conventional datasets like RSI , MA, VWAP to filter & identify high probability entries.
3. Take profits: There are total 4 conditions for exits. Partial Exit & Total Exit for both Longs & Shorts. Although we recommend you book profit at 1% change in price of BTCUSD these 4 conditions will offer high volatility exits along the way, should you choose to hold for longer.
4. Evolving: We learn from mistakes when they happen, bad trades are dissected & studied. New conditions get added & bad trades get filtered out through updates. This keeps the script in sync with the market.
__________________________________________________________
Insight: The script performs best in trending markets, so it avoids trading structureless or sideways movement & expects reasonable judgement on the user's part to avoid trading unusual & directionless market conditions.
Trading Mindset: When Bitcoin1% indicates a long trade, it basically says "BTC is more likely to move up 1% than go down 1% form here" : The script only indicates direction of the next 1% which is all you need for High Leverage Trading. You can set target & stop at 1% & try different variations with experience.
Have Questions? Feel free to PM me on TradingView

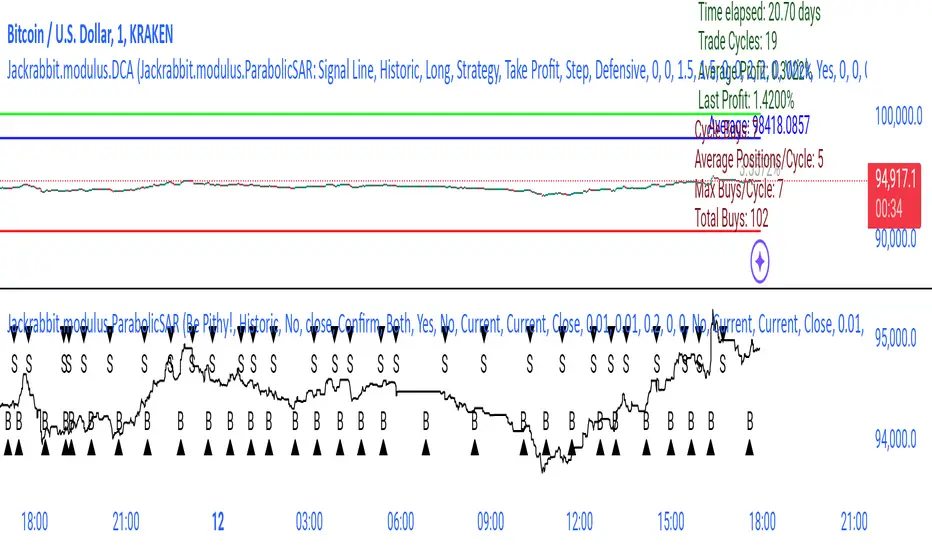
Jackrabbit.modulus.DCAThis is the Dollar Cost Averaging (DCA) for the Jackrabbit suite and modulus framework.
The blue line is the current average price of the asset.
The red line is the deviation boundary. Price action must be below this line for buys to be signaled.
The green line is the take profit. Price action must be above this line for a sell signal to be generated.
Here is a list of the settings:
Buy method: DCA or Strategy. DCA allows the module to decide buys based upon the methodology (step, price). Strategy added to the average on the basis of a buy signal from the strategy, but only when it is below the deviation and is the most organic of dollar cost averaging.
Sell Method. Take profit or Steategy. Take Profit sells the asset as soon as the price action crosses above the take profit line. Strategy sells on the basis of a sell signal, but only if it is above the take profit. Selling never occurs at a loss, with the only exception being the exit point.
Methodolgy: Step or Price. Stepping allows a fixed and uniform averaging ant percise intervals of deviation. Price is a very aggressive approach that will drive the average down on the basis of the difference between the average and the current price action. The price methodology is VERY high risk.
Take Profit, which describes the average profit percent of the combined positions.
Deviation, which describes the percent boundary for which price action must drop before additional assets are purchased.
Sideways Breaker: This algorithm breaks the sideways rut by forcing a purchase after X days, minimum 1 day.
Exit Position: Internal stop loss expressed in the number of buys.
It is important that when you establish your sell signal, ALL positions must be sold to ensure the average profit. If required, use a CLOSE ALL message provided by your platform. Also, any platform specific DCA or Safety Orders will cause losses as this script can not track their value. It is recommended that these features not be used.
The Jackrabbit modulus framework is a plug in play paradigm built to operate through TradingView's indicator on indicatior (IoI) functionality. As such, this script receives a signal line from the previous script in the IoI chain, and evaluates the buy/sell signals appropriate to the current analysis.
This script is by invitation only. To learn more about accessing this script, please see my signature or send me a PM. Thank you.
TradeChartist Plug and Trade™TradeChartist Plug and Trade is an extremely useful indicator that can be connected to almost any Study script (not a Strategy) on Trading View (with an Oscillatory or Non-Oscillatory Signal plot) to generate Trade Signals with Stop Loss plot, user set or automatic Target plots and create Alerts based on Past Performance, determined by Past Gains/Drawdowns for each Trade. The indicator is packed with a lot of features including TradeChartist's signature Dashboard and Real-time Gains Tracker, Automatic Targets Generator, Take Profit recommendation, option to paint price bars based on Trade/Price Trend, 3 types of Stop Loss plots to choose from, with option for user to set fixed Target to take profits.
1. How does ™TradeChartist Plug and Trade connect to another Study script/indicator signal?
Plug and Trade is elegantly designed with simplicity in mind, without compromising on functionality, so any trader - beginner to advanced, can just plug an external signal to the indicator with ease by just following these simple steps.
Add to price chart, the Indicator along with the signal plot to be tested and assessed for performance.
Plug the signal into ™TradeChartist Plug and Trade by choosing it from the Plug Signal Here drop-down.
Choose Signal type as Oscillatory if signal oscillates between set values or crosses a certain value periodically (Example: RSI, CCI, TRIX etc that are mostly not overlayed on Price chart and may be in a separate pane from price chart as it may not fit on Price scale), Choose Signal Type as Non Oscillatory if the signal can be plotted on price scale and Trades are normally generated when price crosses above or below it (Moving Averages, SAR indicators like SuperTrend, etc.).
For oscillators, default Oscillator value for Trade Signals is 0 as most Oscillators have 0 as their mid point. The value can be changed if the Signal doesn't oscillate with 0 as its mid point. For example, if the connected Signal is RSI, the values can be changed to Upper and Lower band values to generate Trade Signals.
Plot the Signal on chart if the signal is Non Oscillatory.
2. How can the plugged Signal's performance be assessed using ™TradeChartist Plug and Trade and subsequently used for generating Trade Entries and to create Alerts?
Once the Signal is plugged into the indicator based on steps above, Plug and Trade automatically plots the Trade entries based on the Signal type.
Plot Trade Entries after Bar Close from settings can be checked for signals that do not confirm until bar close. By doing this, repainting can be avoided for most signals and true performance can be assessed. Also, alerts can be created using Once Per Bar rather than Once Per Bar Close .
The real-time Gains Tracker and Dashboard are useful in tracking gains and other useful indicator values like RSI, Stoch, ATR and EMA in real-time with price movement.
Enabling Past Performance from settings will plot Maximum Gains achieved and Maximum Drawdown for each trade as labels . Trading View only plots finite number of labels and old labels are deleted automatically. But to access past performance beyond the last available label, bar replay can be used.
User can choose from 3 types of Stop Losses from the settings - Fixed %, Trailing % and ATR Stop Loss namely and a Fixed TP % to create plots on price chart and to create alerts.
If the user prefers automatic targets based on Trade entries, Recommend Targets can be enabled from the settings. The automatic targets are generated at the time of Trade Entry, along with Target prices and % which turn green when hit.
Each BUY and SELL Trade are tracked in its entirety and the highest high since BUY and lowest low since SELL are plotted on the price chart and also displayed on the Plug and Play Dashboard
Choppiness can be easily spotted if there are numerous Past Performance labels or several Trade Entries around a short timeframe on chart. This may mean that the signal needs smoothing or may not be suitable for the asset to trade on the chart timeframe. Suitability of a Study script for the asset can be determined in many ways using this indicator.
3. What other features are included in ™TradeChartist Plug and Trade?
Enabling Spot Price Bars to take Profit option from settings automatically plots $ sign above/below candles where Profit taking is recommended or Stop Loss moved to secure profits/reduce loss.
Enabling Paint Price Bars with Trade Trend paints price bars with colors that help picture Trade/Price trend. Trend spotting using this works best with (bars/hollow candles/candles with no border) on dark background.
Both features work on Price chart even without any Signal plugged in.
===================================================================================================================
Example Charts using different Signals plugged into ™TradeChartist Plug and Trade
1. RSI Signal (Oscillatory) plugged in with >60 for BUYs and <40 for SELLs - BTC-USDT on 1hr
2. PowerTracer Signal (Oscillatory) plugged in - GBP-USD 1hr
3. 55 period VWMA Signal (Non Oscillatory) plugged in - ADA-USDT 4hr
4. RSI Signal (Oscillatory) plugged in with >70 for BUYs and <30 for SELLs - SPX 1hr with Trailing SL - 3% and TP - 2%
===================================================================================================================
This is not a free to use indicator. Get in touch with me (PM me directly if you would like trial access to test the indicator)
Premium Scripts - Trial access and Information
Trial access offered on all Premium scripts.
PM me directly to request trial access to the scripts or for more information.
===================================================================================================================

Open Close Profit - [Alerts]This script comes with the following indicators and features:
Moving Average trend filter (Hull, ZLEMA, McGinley)
Pin Bar Filter
MACD indicator
Pump and Dump filter
Entry, Take Profit, and Stop Loss Alerts
And a few more indicators in the back-end to increase accuracy, optimize entries and filter out sideways PA
This script works really well as a scalper on lower Time Frames as well as on higher Time Frames. Besides that you can also use it on pretty much any coin or asset.
This script is not repainting. We advise to use alerts on “Once Per Bar Close”.
If you’d like to automate this script you can do that by using AutoView, ProfitView, ProfitTrailer, CryptoHopper etc.
Leave a message if you’d like to try it out.

Crypto Scalper Pro Study / Alerts===========
Crypto Scalper Pro Study Script with Alerts
===========
Our Crypto Scalper Pro Study with Alerts Script is a carbon copy of our tried and tested Crypto Scalper Pro Strategy , but now with the option of setting TradingView Alerts for your chosen trading plan. Making missing trades a thing of the past, and helping you to automate your own trading strategy using AutoView, 3Commas or similar 3rd party Auto Trading Software.
-----------
Crypto Scalper Pro is a scalping strategy developed to work alongside our Crypto Tipster Strategy, now you can trade the D markets with our Tipster, and Intra-Day markets with our Scalper!
This strategy works very well on shorter time frames across multiple crypto pairs, everything from 4H all the way down to a 5m chart, our Crypto Scalper will find the best Entry and Exit points for consistent and reliable returns.
We've added a few variables for you to play with to fine tune this scalper to suit your chosen trading plan - however, these will only adjust the strategy to a certain degree, as there are many algorithms and indicators doing their thing hidden in the background that take precedence.
-----------
What's Included?
Crypto Scalper Pro comes with a host of features and is being continually updated, these features include (but are not limited to):
- Date Range Settings
Setting custom Start/End dates can help hone your strategy to suit the current times, or get a general overview of the market over the years.
- Heikin Ashi Confirmation
We added HA confirmation for both Entry & Exit of trades. This started as a form of "Safe Mode", we have since adapted our safe mode far beyond Heikin Ashi; but kept this confirmation as an added extra.
- Variable Indicator Settings
As well as our Fixed Indicators and Price Action analysis going on in the background of the strategy, we've also included some Variable Indicators that you have access to edit.
Lookback Period will help establish how far back you'd want to be confirming price indications on the strategy - the higher the number the further back it will look, making the Scalping Strategy appear smoother with less trades during choppy times, the downside with a higher lookback is you might miss the start of a potentially epic trade, and only be shown an Entry after the event has already happened.
We find Lookback Lengths of between 5 and 100 could work depending on various other settings, the market being traded, and the timeframe being used.
MA Length (Length of Moving Average) - We use a few MA's to best determine various factors involved with successfully scalping a market, overall trend direction, current price movements and fake-out detection to name just a few. You've got the option of determining a good average length for a few of these variables.
Again, a short MA Length will catch every big move right at the start, but you're almost guaranteed a Negative Expected Value with that method, due to the vast quantity of losing trades in times of chop/ranging markets. A Higher MA Length will remove a lot of chop, reduce the quantity of trades, and therefore (should) result in a higher Percent of Trades Profitable; it will however add a certain lag to the strategy, meaning those highly profitable trades we're looking for may turn out to be not so highly profitable!
- Safe Mode
Enabling Safe Mode will add a couple more confirmation indicators to the strategy - the aim of Safe Mode is, in essence, to remove any trading signals that would end of being false/bad moves. Usually resulting in less Overall Trades, a higher Net Profit, higher % Profitable, higher Profit Factor AND a lower Drawdown. Use Safe Mode to help eliminate orders that would otherwise be placed in choppy markets.
- Stop Loss/Take Profit Settings
This is where Crypto Scalper Pro really proves itself, Money Management. We have an editable Fixed SL/TP, as well as Trailing Stops for Long or Short orders, all of which you can use on their own, or combined with each other. Playing with these settings can turn an un-profitable system into a very-profitable trading plan!
-----------
What's Included within Crypto Scalper Study / Alerts Script?
Our Study script will find Entry and Exit points exactly as our Pro Strategy would find them. The same indicators, methods and chart reading techniques are used, there are 2 big differences however...
The first difference is that our Pro Strategy has the ability to manage your money, Fixed Stops, Take Profit and Trailing Stops to name just a few. Our Study does not (yet) have these functions added due to the way TradingView's charting platform operates.
That's the bad news, the good news for our Crypto Scalper Study Script is that you can add Alerts to your trading plan! This is super handy if you decide to implement our methods into different time frames across various markets and are looking for Intra-day Alerts, or if you're looking to Automate your trading strategy using external software.
Help and Advice for setting up Alerts or to Automate your Strategy can be found on our website.
----------
For more information on the Crypto Scalper Pro Strategy visit the link in our signature.
Good Luck and Happy Trading!

Fabonacci Trailer - [Alerts]This script comes with the following indicators and features:
ADX indicator
Chop indicator
Super Trend indicator
Trailing Take Profit and Stop Loss
Entry, Take Profit, and Stop Loss Alerts
Renko chart support
And a few more indicators in the back-end to increase accuracy and optimize entries
This script works really well as a scalper on lower Time Frames as well as on higher Time Frames. Besides that you can also use it on pretty much any coin or asset.
This script is not repainting. We advise to use alerts on “Once Per Bar Close”.
If you’d like to automate this script you can do that by using AutoView, ProfitView, ProfitTrailer, CryptoHopper etc.
Please note that this script is based on invite only.

MA Crossover [Alerts]This is a Moving Average Crossover study .
The study comes with all alerts (Long, Short, Take Profit, and Stop Loss).
A few visuals like Exit Loss and Profit/Loss Boxes have been added as well.
The following Moving Averages are supported:
SMA
EMA
DEMA
TEMA
WMA
VWMA
SMMA
HullMA
LSMA
ALMA
SSMA
TMA
ZLEMA
If you’d like to automate this script you can do that by using AutoView, ProfitView, ProfitTrailer, CryptoHopper etc.
Feel free to leave a comment and share it with your friends. Enjoy!

Algorithm Builder - INDICESHello traders
I. 💎 SCRIPTS ACCESS AND TRIALS 💎
1. For the trial request access, they have to be done through my website .
2. My website URL is in this script signature at the very bottom (you'll have to scroll down a bit and going past the long description) and in my profile status available here : Daveatt
Due to the new scripts publishing house rules, I won't mention the URL here directly. As I value my partnership with TradingView very much, I prefer showing you the way for finding them :)
3. Many video tutorials explaining clearly how all our indicators work are available on your website > guides section.
4. You may also contact me directly for more information
II. 🔎 Algorithm Builder INDEX 🔎
2.1 INDEX trading
Let's start with a quick definition.
Index Trading is a type of trading of a group of stocks that make up the index. An Index is a measurement of the value of a section of the stock market. It is computed from the prices of selected stocks. It may also be referred to as a group of stock market publicly-listed uppermost businesses within a region. There are numerous Stock Market Indices within the world such as Dow Jones/SPX500 (USA), DAX (Germany), S&P/ASX 200 (Australia), FTSE100 (London), CAC 40 (France), AEX index (Amsterdam), IBEX 35 and more.
2.2 🔗 Which brokers are compatible? 🔗
⚠️⚠️Please note we mostly tested those signals with FXCM broker.
You may use a different broker but you have to make sure your broker has a similar price quote with at most 2/3 pips difference with FXCM.
We chose a broker where the spreads are among the lowest across the board.
Disclaimer : we're not affiliated in any way with them.
2.3 Concept
This indicator is born because we identified 2 types of traders :
1) Those who want to play with the indicators and discover a sound system by themselves.
That's why we made the Algorithm Builders (Singles/Multiples) + Backtest suites
2) Those who want to be guided way more and get signals that actually are very coherent AND without too much configuration on their end.
We're very aware that this point is a big claim and to prove how confident we are with our Algorithm Builder (INDEX), we're sharing on TradingView the signals given by the tool at the end of each day.
Our new PREMIUM customers automatically get a 3 weeks trial to try out all of our indicators and see themselves how they perform.
We could show you all the track records/backtests in the world (which could easily be faked with very optimistic setups or photoshop) - instead, we'd like YOU to try our products yourselves during your Trial - as this would be the best proof you could ever get that our indicators could help your trading.
III. 🔅 The INDEX Framework 🔅
ALL signals are displayed because they have to be taken (unless invalidated or risk too big) because we cannot know before what signal will lead to big profits versus get invalidated.
Those signals were made such as :
- in case of a risk of losing capital, we would lose a small amount thanks to the invalidations/hard exits.
- give only signals where the Risk-to-reward is decent enough and the risk is not disproportioned compared to the potential reward.
- NOT a guarantee at all but we made those signals such as they'll reward the traders with about 30/50 pips gains per trade.
Assuming the Algo INDEX gives 5 trades a day and you applied it on 3 indexes and 1 trade per index is a loss (= likely invalidated with a small loss - a Stop Loss could always happen but we designed it to prevent those from happening), then we're not aware of any other trading method/system beating that on index trading. Period.
And we're actively monitoring what the competition is doing on a daily basis always to stay ahead.
I'll explain below which market condition is riskier and how to act (which is better than usually reacting in trading or in life in general).
IV. 📜 The 10 Commandments 📜
1️⃣ You shall read our guide on our website and look at the video tutorial .
URL available on this script signature (you'll have to scroll down a bit and going past the long description) and in my profile status.
I give way more details there and won't give too much info here because it will make this script description way too long.
2️⃣ You shall follow the method religiously and trade like a “MACHINE” .
All graphical elements displayed on the chart by our indicator is useful (= to be used) and has been thought of, tested and traded with for years.
We know that adopting someone else's method is a huge leap of faith but it's required sometimes to ask our clients to trust us.
3️⃣ You must always consider the supports and resistances.
We know it could be surprising to see so many S/R displayed by the indicator but you'll have to trust us on the following claim: They're all important and must be considered before entering a trade or not
4️⃣ You must Not change the recommended chart timeframe.
Even if the chart timeframe is 1 minute, the sub-indicators used are very smoothed and based on indicators in 15/30/1h timeframes.
Entering in a 1 min chart allows to enter sooner and this combined with multi timeframes indicators allows to enter when a trend is confirmed.
5️⃣ You Must NOT trade anything else than indexes with this indicator.
As said before, we're working really hard on releasing a similar assisted trading framework for cryptocurrencies and other asset classes (FOREX, COMMODITIES, ...) and we aim to release the Algo Builder CRYPTO before the end of this year.
We started with the ALGO INDEX because it's our specialty, there is a ton of liquidity in that market and a lot of traders asked for it - we would say almost as close as the number of traders asking us for an ALGO CRYPTO framework.
6️⃣ You shall know the Leading Trend displayed on your chart
- Signal in the same direction of the leading trend: i.e. green signal on a green chart background and red signal on a red chart background.
- Signal given regardless of the leading trend direction.
In other words, green/red signal may be displayed on either background color (green/red)
In that scenario, we recommend waiting for a pullback near the EMA(20) and set your SL to breakeven quickly.
⚠️ To be clear; ALL signals should be taken but those against the trend could require a pullback as explained above.
7️⃣ You shall know your trading profile
Trend confirmation when entering against the leading trend: You'll also notice that the leading trend is real and strong.
Let's assume a trader enters in a LONG position/RED background and then the chart background turns GREEN at some point later on.
You'll often see that this "event" will confirm even more the trend direction and that's when the trend could very likely accelerate.
8️⃣ You will embrace the Hard Exits philosophy.
The framework won't work as well as expected without them.
It's even the most important "commandment" and it requires to be rigorous and throw away to the bin whatever we might think and feel.
Not exiting a signal when invalidated because you feel differently will not work.
9️⃣ You must know the Risk and Money Management basis.
Each market is unique and cannot possibly be traded the same way.
We're happy to provide a few guidelines for the INDEX market just below.
- Know your macro events with the daily economic calendar.
- Stay consistent with your position sizing
- Stay consistent with your trade management
🔟 You Shall Test and Make your Own Conclusions.
You have a FREE TRIAL period to test because we know that many traders aren't full-time traders and have a family/job/life outside trading.
So take your time to visually backtest the signals, trade with small positions, follow our rules and learn from your own experience.
While we keep saying "do this, do that", we're not dogmatic at all and we welcome any feedback you might have that could benefit the community and we'll likely integrate it if we see a good value in your idea.
You can submit an idea/feedback/comment by contacting me directly.
V. 🧰 Features 🧰
5.1 Supports and Resistances
The indicator displays the main algorithmic supports and resistances according to our trading method for INDEX.
5.2 Choose your favorite risk management algorithm
1/ Pre-defined and recommended mode for this INDEX framework - Algo S/R method using:
- the nearest algorithmic resistances for the take profit levels.
2/ Define your own Stop-loss and Take-profits level in real-time
Stop-Loss Management
For what's following, let's assume that 2 is the stop-loss value you inserted in the indicator, and the Algorithm Builder gives a BUY signal.
This is NOT a recommendation at all, only an example to explain how this feature works.
- %Trailing: The Stop-Loss starts 2% away from the entry price - and will move up (because we're on a BUY trade as per our example) every time your trade will gain 2% profit
- Percentage: The Stop-Loss stays static 2% away from the entry price. There is no trailing here
- TP Trailing: This is a very awesome feature. The stop-loss is set 2% away when the trades start.
When the TP1 is hit, the stop-loss will be moved to the Entry price (also called breakeven).
When the TP2 is hit, the SL is moved to the previous TP1 position
- Fixed: Set the Stop-Loss at a fixed position (value should be in currency/units)
Take Profits Management
You can manage up to 2 take profit levels defined as a percentage or price value.
The expected input is in percentage value (for instance, setting the % target of TP1 to 2% will set the TP1 level 2% away from the entry price
5.3 Built-in Trade Manager
This is very likely the most loved utility script that we shared on TradingView.
It's included in your Algorithm Builder - Single Trend+, and will certainly help you immensely to analyze your charts and your trades.
We made sure that all the graphical elements on the chart will be updated in real-time whenever our user change anything on the indicator configuration.
You'll also be able to change the Trade Manager labels positions as you wish :)
5.4 Built-in Risk-to-Reward Panel
The good stuff doesn't stop here.
You'll notice that this sometimes green (when in a LONG), sometimes red (when in a SHORT) panel at the right of your chart.
It displays for the selected trading algorithmic (see 2.3.2 above), a ton of useful real-time analytics.
- Entry Price: the price when the Algorithm Builder will give a signal.
- The Trade PnL in percentage.
- Entry Stop Loss: Distance (in currency/units) between the selected stop-loss algorithm (percent, trailing, TP trailing, etc.) and the entry price.
- Entry TP1: Distance (in currency/units) between the entry price and the first take profit
- Entry TP2: Distance (in currency/units) between the entry price and the second take profit
- Risk/Reward TP1: Using the Stop-loss distance at entry, and Take Profit 1 at entry to compute the risk-to-reward ratio.
- Risk/Reward TP2: Using the Stop-loss distance at entry, and Take Profit 2 at entry to compute the risk-to-reward ratio.
For more details, please check the guides section of my website. Links are in my signature and profile status.
5.5 Built-in PnL real-time calculations
YES!!!! you read it correctly
The panel displays the risk-to-reward ratios but also the PnL (Profit and Loss in percentage value) of the current and last trade
VI. 🔔 Alerts 🔔
We enabled the alerts on the:
1. Main BUY/SELL entries
3. Exit Signals such as stop-loss, take-profit, hard-exits
VII. 🧬 Compatible with trading bots?🧬
I'm very aware of all existing solutions out there allowing us to capture the TradingView alerts (Instabot, ProfitView, ...) and forwarding them to the brokers to automatize your trading.
You'll find a more detailed answer on our website.

Assisted framework with the Algorithm Builder - INDEXHello traders
I. 💎 SCRIPTS ACCESS AND TRIALS 💎
1. For the trial request access, they have to be done through my website .
2. My website URL is in this script signature at the very bottom (you'll have to scroll down a bit and going past the long description) and in my profile status available here : Daveatt
Due to the new scripts publishing house rules, I won't mention the URL here directly. As I value my partnership with TradingView very much, I prefer showing you the way for finding them :)
3. Many video tutorials explaining clearly how all our indicators work are available on your website > guides section.
4. You may also contact me directly for more information
II. 🔎 Algorithm Builder INDEX 🔎
2.1 INDEX trading
Let's start with a quick definition.
Index Trading is a type of trading of a group of stocks that make up the index. An Index is a measurement of the value of a section of the stock market. It is computed from the prices of selected stocks. It may also be referred to as a group of stock market publicly-listed uppermost businesses within a region. There are numerous Stock Market Indices within the world such as Dow Jones/SPX500 (USA), DAX (Germany), S&P/ASX 200 (Australia), FTSE100 (London), CAC 40 (France), AEX index (Amsterdam), IBEX 35 and more.
2.2 🔗 Which brokers are compatible? 🔗
⚠️⚠️Please note we mostly tested those signals with FXCM broker.
You may use a different broker but you have to make sure your broker has a similar price quote with at most 2/3 pips difference with FXCM.
We chose a broker where the spreads are among the lowest across the board.
Disclaimer : we're not affiliated in any way with them.
2.3 Concept
This indicator is born because we identified 2 types of traders :
1) Those who want to play with the indicators and discover a sound system by themselves.
That's why we made the Algorithm Builders (Singles/Multiples) + Backtest suites
2) Those who want to be guided way more and get signals that actually are very coherent AND without too much configuration on their end.
We're very aware that this point is a big claim and to prove how confident we are with our Algorithm Builder (INDEX), we're sharing on TradingView the signals given by the tool at the end of each day.
Our new PREMIUM customers automatically get a 3 weeks trial to try out all of our indicators and see themselves how they perform.
We could show you all the track records/backtests in the world (which could easily be faked with very optimistic setups or photoshop) - instead, we'd like YOU to try our products yourselves during your Trial - as this would be the best proof you could ever get that our indicators could help your trading.
III. 🔅 The INDEX Framework 🔅
ALL signals are displayed because they have to be taken (unless invalidated or risk too big) because we cannot know before what signal will lead to big profits versus get invalidated.
Those signals were made such as :
- in case of a risk of losing capital, we would lose a small amount thanks to the invalidations/hard exits.
- give only signals where the Risk-to-reward is decent enough and the risk is not disproportioned compared to the potential reward.
- NOT a guarantee at all but we made those signals such as they'll reward the traders with about 30/50 pips gains per trade.
Assuming the Algo INDEX gives 5 trades a day and you applied it on 3 indexes and 1 trade per index is a loss (= likely invalidated with a small loss - a Stop Loss could always happen but we designed it to prevent those from happening), then we're not aware of any other trading method/system beating that on index trading. Period.
And we're actively monitoring what the competition is doing on a daily basis always to stay ahead.
I'll explain below which market condition is riskier and how to act (which is better than usually reacting in trading or in life in general).
IV. 📜 The 10 Commandments 📜
1️⃣ You shall read our guide on our website and look at the video tutorial .
URL available on this script signature (you'll have to scroll down a bit and going past the long description) and in my profile status.
I give way more details there and won't give too much info here because it will make this script description way too long.
2️⃣ You shall follow the method religiously and trade like a “MACHINE” .
All graphical elements displayed on the chart by our indicator is useful (= to be used) and has been thought of, tested and traded with for years.
We know that adopting someone else's method is a huge leap of faith but it's required sometimes to ask our clients to trust us.
3️⃣ You must always consider the supports and resistances.
We know it could be surprising to see so many S/R displayed by the indicator but you'll have to trust us on the following claim: They're all important and must be considered before entering a trade or not
4️⃣ You must Not change the recommended chart timeframe.
Even if the chart timeframe is 1 minute, the sub-indicators used are very smoothed and based on indicators in 15/30/1h timeframes.
Entering in a 1 min chart allows to enter sooner and this combined with multi timeframes indicators allows to enter when a trend is confirmed.
5️⃣ You Must NOT trade anything else than indexes with this indicator.
As said before, we're working really hard on releasing a similar assisted trading framework for cryptocurrencies and other asset classes (FOREX, COMMODITIES, ...) and we aim to release the Algo Builder CRYPTO before the end of this year.
We started with the ALGO INDEX because it's our specialty, there is a ton of liquidity in that market and a lot of traders asked for it - we would say almost as close as the number of traders asking us for an ALGO CRYPTO framework.
6️⃣ You shall know the Leading Trend displayed on your chart
- Signal in the same direction of the leading trend: i.e. green signal on a green chart background and red signal on a red chart background.
- Signal given regardless of the leading trend direction.
In other words, green/red signal may be displayed on either background color (green/red)
In that scenario, we recommend waiting for a pullback near the EMA(20) and set your SL to breakeven quickly.
⚠️ To be clear; ALL signals should be taken but those against the trend could require a pullback as explained above.
7️⃣ You shall know your trading profile
Trend confirmation when entering against the leading trend: You'll also notice that the leading trend is real and strong.
Let's assume a trader enters in a LONG position/RED background and then the chart background turns GREEN at some point later on.
You'll often see that this "event" will confirm even more the trend direction and that's when the trend could very likely accelerate.
8️⃣ You will embrace the Hard Exits philosophy.
The framework won't work as well as expected without them.
It's even the most important "commandment" and it requires to be rigorous and throw away to the bin whatever we might think and feel.
Not exiting a signal when invalidated because you feel differently will not work.
9️⃣ You must know the Risk and Money Management basis.
Each market is unique and cannot possibly be traded the same way.
We're happy to provide a few guidelines for the INDEX market just below.
- Know your macro events with the daily economic calendar.
- Stay consistent with your position sizing
- Stay consistent with your trade management
🔟 You Shall Test and Make your Own Conclusions.
You have a FREE TRIAL period to test because we know that many traders aren't full-time traders and have a family/job/life outside trading.
So take your time to visually backtest the signals, trade with small positions, follow our rules and learn from your own experience.
While we keep saying "do this, do that", we're not dogmatic at all and we welcome any feedback you might have that could benefit the community and we'll likely integrate it if we see a good value in your idea.
You can submit an idea/feedback/comment by contacting me directly.
V. 🧰 Features 🧰
5.1 Supports and Resistances
The indicator displays the main algorithmic supports and resistances according to our trading method for INDEX.
5.2 Choose your favorite risk management algorithm
1/ Pre-defined and recommended mode for this INDEX framework - Algo S/R method using:
- the nearest algorithmic resistances for the take profit levels.
2/ Define your own Stop-loss and Take-profits level in real-time
Stop-Loss Management
For what's following, let's assume that 2 is the stop-loss value you inserted in the indicator, and the Algorithm Builder gives a BUY signal.
This is NOT a recommendation at all, only an example to explain how this feature works.
- %Trailing: The Stop-Loss starts 2% away from the entry price - and will move up (because we're on a BUY trade as per our example) every time your trade will gain 2% profit
- Percentage: The Stop-Loss stays static 2% away from the entry price. There is no trailing here
- TP Trailing: This is a very awesome feature. The stop-loss is set 2% away when the trades start.
When the TP1 is hit, the stop-loss will be moved to the Entry price (also called breakeven).
When the TP2 is hit, the SL is moved to the previous TP1 position
- Fixed: Set the Stop-Loss at a fixed position (value should be in currency/units)
Take Profits Management
You can manage up to 2 take profit levels defined as a percentage or price value.
The expected input is in percentage value (for instance, setting the % target of TP1 to 2% will set the TP1 level 2% away from the entry price
5.3 Built-in Trade Manager
This is very likely the most loved utility script that we shared on TradingView.
It's included in your Algorithm Builder - Single Trend+, and will certainly help you immensely to analyze your charts and your trades.
We made sure that all the graphical elements on the chart will be updated in real-time whenever our user change anything on the indicator configuration.
You'll also be able to change the Trade Manager labels positions as you wish :)
5.4 Built-in Risk-to-Reward Panel
The good stuff doesn't stop here.
You'll notice that this sometimes green (when in a LONG), sometimes red (when in a SHORT) panel at the right of your chart.
It displays for the selected trading algorithmic (see 2.3.2 above), a ton of useful real-time analytics.
- Entry Price: the price when the Algorithm Builder will give a signal.
- The Trade PnL in percentage.
- Entry Stop Loss: Distance (in currency/units) between the selected stop-loss algorithm (percent, trailing, TP trailing, etc.) and the entry price.
- Entry TP1: Distance (in currency/units) between the entry price and the first take profit
- Entry TP2: Distance (in currency/units) between the entry price and the second take profit
- Risk/Reward TP1: Using the Stop-loss distance at entry, and Take Profit 1 at entry to compute the risk-to-reward ratio.
- Risk/Reward TP2: Using the Stop-loss distance at entry, and Take Profit 2 at entry to compute the risk-to-reward ratio.
For more details, please check the guides section of my website. Links are in my signature and profile status.
5.5 Built-in PnL real-time calculations
YES!!!! you read it correctly
The panel displays the risk-to-reward ratios but also the PnL (Profit and Loss in percentage value) of the current and last trade
VI. 🔔 Alerts 🔔
We enabled the alerts on the:
1. Main BUY/SELL entries
3. Exit Signals such as stop-loss, take-profit, hard-exits
VII. 🤖 Compatible with trading bots? 🤖
I'm very aware of all existing solutions out there allowing us to capture the TradingView alerts (Instabot, ProfitView, ...) and forwarding them to the brokers to automatize your trading.
You'll find a more detailed answer on our website.
If you have any doubt or question, please hit me up directly or ask in the comments section of this script.
I'll never claim I have the best trading methodology or the best indicators.
You only will judge and I'll appreciate all the questions and feedback you're sending my way.
They help me a ton to develop indicators based on all the requests I received.
Kind regards,
Dave

Algorithm Builder - Multiple TrendsHello traders
I. SCRIPTS ACCESS AND TRIALS
1. For the trial request access, they have to be done through my website .
2. My website URL is in this script signature at the very bottom (you'll have to scroll down a bit and going past the long description) and in my profile status available here : Daveatt
Due to the new scripts publishing house rules, I won't mention the URL here directly. As I value my partnership with TradingView very much, I prefer showing you the way for finding them :)
3. You may also contact me directly for more information
II. Algorithm Builder - Multiple Trends
2.1 Forewords
This indicator is available only to our PREMIUM users. Our PREMIUM indicators offer more trading analysis capabilities and opportunities.
A few words of caution: the Algorithm Builders - Multiple Trends are more advanced and as such, would require slightly more time to be mastered.
They're not that much difficult, but we understand that designing a trading system with 2 trends might be slightly more complicated - however, there is nothing to be scared of :).
The time spent to learn how to use our PREMIUM tools might be rewarded handsomely.
2.2 Concept
The Algorithm Builder - Multiple Trends is made to detect the convergence of many unrelated indicators and give a BUY or SELL signal whenever all the selected sub-indicators are converging in the same direction.
This is an upgrade of the PRO package giving access to the Algorithm Builder - Single Trend - designed to show 1 unique entry per trend - whereas the Multiple Trends offers re-entries in the same direction of the trend if the indicator detects good convergences to accumulate more positions.
III. Multiple Trends versus Single Trend
3.1 Multiple Trends benefits
A friend asked us recently Why using the Multiple Trends if we can use the Single Trend in a smaller timeframe, and get more entries that way?
We thought this was an excellent question, but the answer is obvious.
Using a Single Trend on a smaller timeframe to solely getting more entries will reduce the security of the given trades.
We designed the Algorithm Builders to take a trade in an identified trend but reducing the timeframe too much will mostly increase your risk - and might lead to capital loss.
By the way, this is a universal rule valid also for a big majority of indicators.
We're absolutely not saying that the Single Trend won't work on small timeframes because actually it really does. But, if you find out a great configuration for your Single Trend, and want to get more signals without increasing your risk - then the Multiple Trends would be a very viable option.
3.2 Main signal versus secondary signals
For the main and secondary trends, the color green symbolizes any identified "BUY" trend. And the color red symbolizes any identified "SELL" trend.
-The MAIN trend symbol is unique and symbolized by a triangle.
- The SECONDARY (could also be called re-entries) trends are multiple and symbolized by a diamond.
In the Algorithm Builder indicator settings, they're identified with the Additional keyword.
3.3 How the convergences are calculated
Extremely important: The diamonds (or re-entries) are displayed, as long as a triangle (or main/primary signal) is displayed.
For a trend change (buy to sell or sell to buy), the system waits for ALL selected re-entries sub-indicators , to give a convergence/confluence in the opposite direction.
For example, let's assume a BUY/green convergence based on 3 indicators. One or Two of them going turning red, won't be enough for a trend change.
But, if all of them turn red, then we'll see a red triangle - signaling the beginning of a new downtrend.
3.4 Why multiple entries?
Here are a few use cases :
1. The main use case why we made those Multiple Trends indicators: A trader got invalidated or stopped out on a trade, but wants a system to let hin/her jump back in with a minimum of security. (security depending on the configuration of the Algorithm Builder as a whole).
This is very frustrating to get in a trade, being stopped out, and finally, see the trade going in the expected direction.
Even more frustrating to jump back in at the end of a trend, and get stopped out again - we all agree on this.
2. You want to add more positions on your main trade as your Algo Builder identified a solid trend - this is a nice way to possibly maximize your gains.
Once again, we don't/won't guarantee any performance result (not because we don't believe in our tools, but for legal reason), all depends on the time spent reading our documentation and playing with the Algo Builder - as explained on our Tutorials.
More info available on our website. URL available in this script signature and on my profile status.
IV. Why the Algorithm Builder Multiple Trends may help you
I worked with many traders during my career, and their feedback about trading is often pretty similar.
They all tried a lot of complicated indicators, losing their capital, and finally getting back to the basics (even to the basic indicators if I might say)
The art is finding a good combination of indicators and setting strict money/risk management rules.
Easy in concept, but more than 90+% of traders lose money on the markets... which teach us that trading is not only about drawing trendlines, or using cool indicators but finding ways to ease our psychology while trading.
4.1 The Algorithm Builder trading framework
The sub-indicators (full list on our website) weren't chosen randomly. They're based on a trading method we've developed over the last 6 years - while working with traders and other trading quants.
The Algo Builders are made to detect a convergence - and as such, will give a signal once a trend has been identified.
They're not made to detect reversal but have been designed to give a signal when all sub-indicators are either ALL bullish (green) or ALL bearish (red).
We provide a framework based on indicators we selected because they:
1. make sense to be used altogether
2. work on asset classes like INDEX, CRYPTO, STOCK OPTIONS, FOREX, COMMODITIES
3. it may expand your knowledge about what detecting a convergence with pre-selected indicator really means
4.2 Supports and Resistances
The indicator displays the main algorithmic supports and resistances according to our trading method.
I think they're relevant for all asset classes, but you're absolutely free to use any different supports/resistances logic if you want to.
I'm not against it because I know that pivots, Fibonacci levels, etc. may work very well also.
4.6 Hard Exits
Our trading method is known for the hard exits, also called invalidation.
The Single Trend+ includes a hard exit based on a MACD - settings are flexible and you may update them.
Having a stop-loss protecting your trade is a best practice - Protecting your stop-loss also from getting hit is incredible.
We prefer invalidate a few positions, even if sometimes we don't want to. Rather than the market hard exiting on us, and leaving with our hard-working money.
4.7 Alerts
Alerts are enabled for:
- BUY/SELL MAIN triangles signals
- BUY/SELL SECONDARY diamond signals
- Hard Exits
V. Pain points that we're trying to solve with our Algorithm Builders
Issue #1 There are many informations / indicators / strategies / backtests / noise. Finding the right ones is not a simple task.
Solution #1 A reliable system that removes the external noise is much needed in trading to stay "in the game".
Issue #2 Trading could be quite stressful - The majority doesn't lose in trading because technical analysis is hard, but because managing our psychology is one of the hardest things a human can do.
Solution #2 Some ways to reduce the "trading stress" could be: getting better quality signals and trading like a "machine". Forgetting about Twitter and trusting the system you designed.
Issue #3 Trading without strict rules and only based on what we feel, or what we think the market should do is the fastest way to kiss our money goodbye.
Only 1 indicator generally is not enough. Traders generally use a combination of several indicators but they're monitoring them individually.
It's normal then to feel exhausted at the end of the day ^^ (to say the least)... and exhaustion leads to mistakes which leads to..... (I'm sure you got it) ... capital loss.
Solution #3 As a trader, I needed a trading framework and a method. I offer our trading method but they're plenty others out there. We cannot claim obviously it's the best ever ....but let's say we're using those exact same
scripts ourselves for our trading. And this what we've been recommending our clients to trade with for the past years. Also, having a tool detecting the convergence of several indicators and giving 1 unique signal
for BUY/SELL position will save you a lot of time/energy, and perhaps might help you out getting better trading performance.
VI. Resolving a complex puzzle and having fun in the process
Trading has to stay a passion and not (only be) a source of intense stress.
The most successful traders I know are "trading geeks" - literally always looking for optimizing, searching for the best possible entries, setups, indicators, tools, etc.
For them, it's not even about the money anymore, but only about beating their previous performance.
Why are they doing this? Because it's fun
Might appears as a bold statement, but I guarantee that looking for setups is fun.
One of our users even told us, that it's like playing with "Legos" and we couldn't possibly agree more.
VII. Designing a system that "makes sense"
Another bold statement now. Brace yourselves ladies and gentlemen
The Algorithm Builders allow to design trading systems quickly. What could takes days/weeks/months to find out... might be now within your reach in less than a few hours.
With a bit of practice, less than an hour might be enough per asset/timeframe to find a system that makes sense to you and adapted to your trading capital and psychology.
Assuming our users read our guides and are fully committed to learning a new way of trading - then we do guarantee you'll be able to design kick-ass trading systems that make sense.
"Making sense" doesn't mean at all it's guaranteed to win, it means you're the one defining the convergence of indicators, using your Algorithm Builder, and observe that most of the time - whenever there is a BUY signal, the candlesticks are going upwards - whenever there is a SELL signal, it's going downwards.
This is a necessary step to make real progress from a trading analyst perspective - and hopefully could lead to profits.
VII. Algorithm Builder versus the main trader enemy(=psychology)
This indicator has the goal to help solving one of the MAIN issues encountered by traders.
Most of traders realize, they can't perform with only 1 indicator (or 1 price pattern or 1 price action) and need a combination of multiple indicators before getting in a trade.
Far from being a magic pill, if it could at least reduce the stress you have while trading, then we'll consider we made a great job - it's a technical "useless noise remover", and needs to be followed strictly.
Such trust in a trading system can only be built by testing your Algorithm Builder configuration on either:
1. a demo account
2. or a live account with small bids. And then, increasing progressively the bids if your capital increases progressively.
Though, you should still use your common sense. (for instance: if we get a BUY signal right on a big timeframe resistance we're hitting for the first time).
I'm aware this is a new way of trading but for many, and while we cannot foresee the future, neither predict performance, we believe it might save you a lot of time to find good signals.
My maximum level of happiness will be reached the day when our users will contact me and showing me setups being mine.
I'm sure that even I can learn from my users and, we can all learn from each other Algorithm Builder configuration
VIII. What is a wrong or bad configuration?
Simply put. If you see that most of your signals react such as described below:
1. a buy triangle predicts, most of the time an upwards move
2. a sell triangle predicts, most of the time a downwards move
3. you estimated yourself the stop-loss needed to give enough room for your trades.
4. take profits based on algorithmic support and resistances or your own take profit method.
So what's a good Algorithm Builder configuration? A configuration you're happy with and makes sense.
A better Algorithm Builder setup is one used in demo or a live account w/ small bids for a few weeks, and you're consistent in your trading performance.
If you have any doubt or question, please hit me up directly or ask in the comments section of this script.
I'll never claim I have the best trading methodology or the best indicators. You only will be the judge, and I'll appreciate all the questions and feedback you're sending my way.
They help me a ton to develop indicators based on all the requests I received.
Kind regards,
Dave

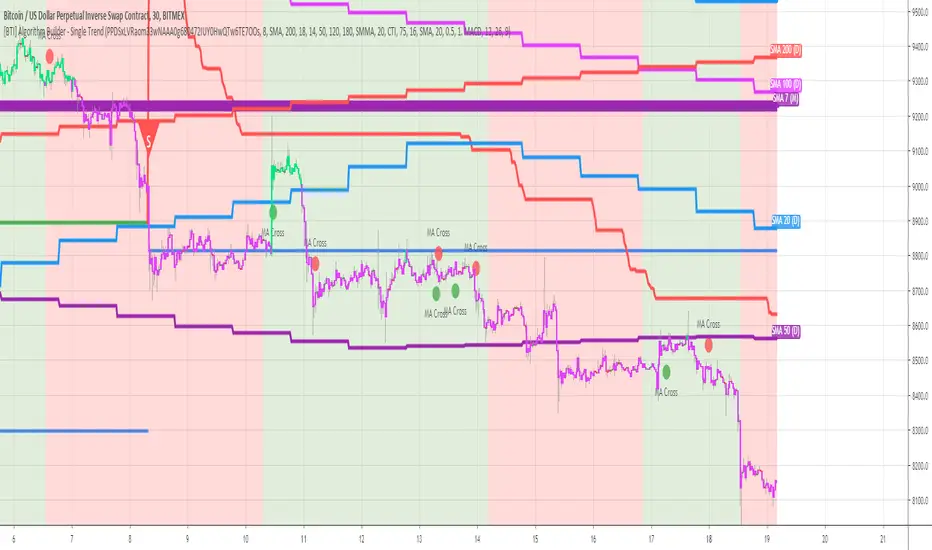
Algorithm Builder - Single TrendHello traders
I. SCRIPTS ACCESS AND TRIALS
1. For the trial request access, they have to be done through my website .
2. My website URL is in this script signature at the very bottom (you'll have to scroll down a bit and going past the long description) and in my profile status available here : Daveatt
Due to the new scripts publishing house rules, I won't mention the URL here directly. As I value my partnership with TradingView very much, I prefer showing you the way for finding them :)
3. You may also contact me directly for more information
II. Algorithm Builder - Single Trend
2.1 Concept
The Algorithm Builder - Single Trend was made to detect the convergence (also called confluence) of many unrelated indicators, giving a BUY or SELL signal whenever all the selected sub-indicators are converging in the same direction.
The Single Trend gives one single entry per identified trend - unlike the Multiple Trends editions (also available on my scripts page) which may give more than 1 entry per trend.
The traders select the sub-indicators they want, and see in real-time the BUY and SELL triangles being updated.
2.2 Why the Algorithm Builder Single Trend may help you
I worked with many traders during my career, and their feedback about trading is often pretty similar.
They all tried a lot of complicated indicators, losing their capital, and finally getting back to the basics (even to the basic indicators if I might say)
The art is finding a good combination of indicators and setting strict money/risk management rules.
Easy in concept, but more than 90+% of traders lose money on the markets... which teach us that trading is not only about drawing trendlines, or using cool indicators but finding ways to ease our psychology while trading.
2.3 The Algorithm Builder trading framework
The sub-indicators (full list on our website) weren't chosen randomly. They're based on a trading method we've developed over the last 6 years - while working with traders and other trading quants.
The Algo Builders are made to detect a convergence - and as such, will give a signal once a trend has been identified.
They're not made to detect reversal but have been designed to give a signal when all sub-indicators are either ALL bullish (green) or ALL bearish (red).
We provide a framework based on indicators we selected because they:
1. make sense to be used altogether
2. work on asset classes like INDEX, CRYPTO, STOCK OPTIONS, FOREX, COMMODITIES
3. it may expand your knowledge about what detecting a convergence with pre-selected indicator really means
2.3.1 Supports and Resistances
The indicator displays the main algorithmic supports and resistances according to our trading method.
I think they're relevant for all asset classes, but you're absolutely free to use any different supports/resistances logic if you want to.
I'm not against it because I know that pivots, Fibonacci levels, etc. may work very well also.
2.3.2 Alerts
Alerts are enabled obviously :)
III. Pain points that we're trying to solve with our Algorithm Builders
Issue #1 There are many informations / indicators / strategies / backtests / noise. Finding the right ones is not a simple task.
Solution #1 A reliable system that removes the external noise is much needed in trading to stay "in the game".
Issue #2 Trading could be quite stressful - The majority doesn't lose in trading because technical analysis is hard, but because managing our psychology is one of the hardest things a human can do.
Solution #2 Some ways to reduce the "trading stress" could be: getting better quality signals and trading like a "machine". Forgetting about Twitter and trusting the system you designed.
Issue #3 Trading without strict rules and only based on what we feel, or what we think the market should do is the fastest way to kiss our money goodbye.
Only 1 indicator generally is not enough. Traders generally use a combination of several indicators but they're monitoring them individually.
It's normal then to feel exhausted at the end of the day ^^ (to say the least)... and exhaustion leads to mistakes which leads to..... (I'm sure you got it) ... capital loss.
Solution #3 As a trader, I needed a trading framework and a method. I offer our trading method but they're plenty others out there. We cannot claim obviously it's the best ever ....but let's say we're using those exact same
scripts ourselves for our trading. And this what we've been recommending our clients to trade with for the past years. Also, having a tool detecting the convergence of several indicators and giving 1 unique signal
for BUY/SELL position will save you a lot of time/energy, and perhaps might help you out getting better trading performance.
IV. Resolving a complex puzzle and having fun in the process
Trading has to stay a passion and not (only be) a source of intense stress.
The most successful traders I know are "trading geeks" - literally always looking for optimizing, searching for the best possible entries, setups, indicators, tools, etc.
For them, it's not even about the money anymore, but only about beating their previous performance.
Why are they doing this? Because it's fun
Might appears as a bold statement, but I guarantee that looking for setups is fun.
One of our users even told us, that it's like playing with "Legos" and we couldn't possibly agree more.
V. Designing a system that "makes sense"
Another bold statement now. Brace yourselves ladies and gentlemen
The Algorithm Builders allow to design trading systems quickly. What could takes days/weeks/months to find out... might be now within your reach in less than a few hours.
With a bit of practice, less than an hour might be enough per asset/timeframe to fine a system that make sense to you and adapted to your trading capital and psychology.
Assuming our users read our guides and are fully committed to learning a new way of trading - then we do guarantee you'll be able to design kick-ass trading systems that make sense.
"Making sense" doesn't mean at all it's guaranteed to win, it means you're the one defining the convergence of indicators, using your Algorithm Builder, and observe that most of the time - whenever there is a BUY signal, the candlesticks are going upwards - whenever there is a SELL signal, it's going downwards.
This is a necessary step to make real progress from a trading analyst perspective - and hopefully could lead to profits.
VI. Algorithm Builder versus the main trader enemy(=psychology)
This indicator has the goal to help solving one of the MAIN issues encountered by traders.
Most of traders realize, they can't perform with only 1 indicator (or 1 price pattern or 1 price action) and need a combination of multiple indicators before getting in a trade.
Far from being a magic pill, if it could at least reduce the stress you have while trading, then we'll consider we made a great job - it's a technical "useless noise remover", and needs to be followed strictly.
Such trust in a trading system can only be built by testing your Algorithm Builder configuration on either:
1. a demo account
2. or a live account with small bids. And then, increasing progressively the bids if your capital increases progressively.
Though, you should still use your common sense. (for instance: if we get a BUY signal right on a big timeframe resistance we're hitting for the first time).
I'm aware this is a new way of trading but for many, and while we cannot foresee the future, neither predict performance, we believe it might save you a lot of time to find good signals.
My maximum level of happiness will be reached the day when our users will contact me and showing me setups being mine.
I'm sure that even I can learn from my users and, we can all learn from each other Algorithm Builder configuration
VII. What is a wrong or bad configuration?
Simply put. If you see that most of your signals react such as described below:
1. a buy triangle predicts, most of the time an upwards move
2. a sell triangle predicts, most of the time a downwards move
3. you estimated yourself the stop-loss needed to give enough room for your trades.
4. take profits based on algorithmic support and resistances or your own take profit method.
So what's a good Algorithm Builder configuration? A configuration you're happy with and makes sense.
A better Algorithm Builder setup is one used in demo or a live account w/ small bids for a few weeks, and you're consistent in your trading performance.
If you have any doubt or question, please hit me up directly or ask in the comments section of this script.
I'll never claim I have the best trading methodology or the best indicators. You only will be the judge, and I'll appreciate all the questions and feedback you're sending my way.
They help me a ton to develop indicators based on all the requests I received.
Kind regards,
Dave
Directional Movement Index with double exponential moving averagThe Directional system is a trend-following method developed by J. Welles Wilder,
in the mid-1970s. It identifies trends and shows
when a trend is moving fast enough to make it worth following. It helps traders to
profit by taking chunks out of the middle of important trends.
Trading Rules
1. Trade only from the long side when the positive Directional line is above the
negative one. Trade only from the short side when the negative Directional line
is above the positive one. The best time to trade is when the ADX is rising, show-
ing that the dominant group is getting stronger.
2. When ADX declines, it shows that the market is becoming less directional. There
are likely to be many whipsaws. When ADX points down, it is better not to use
a trend-following method.
3. When ADX falls below both Directional lines, it identifies a flat, sleepy mar-
ket. Do not use a trend-following system but get ready to trade, because major
trends emerge from such lulls.
4. The single best signal of the Directional system comes after ADX falls below
both Directional lines. The longer it stays there, the stronger the base for the
next move. When ADX rallies from below both Directional lines, it shows that
the market is waking up from a lull. When ADX rises by four steps
from its lowest point below both Directional lines, it “rings a bell” on a
new trend . It shows that a new bull market or bear market is being
born, depending on what Directional line is on top.
5. When ADX rallies above both Directional lines, it identifies an overheated mar-
ket. When ADX turns down from above both Directional lines, it shows that the
major trend has stumbled. It is a good time to take profits on a directional trade.
If you trade large positions, you definitely want to take partial profits.
This particular version uses DEMA (double exponential moving averages) in attempt to catch moves sooner.
Ultimate Risk Management System 📈With this tool you can run multiple instances for Stop Loss, Take Profit, Trailing Stop or Trailing Take Profit.
Why use it?
> Some trading platforms don't offer special tools like Trailing Stop;
> In case they do, they don't have to know where you put your stops;
> TradingView offers high performance, you can see the tool working in real-time.
Main Features:
- Real-time;
- Long Order;
- Short Order;
- Stop Loss;
- Take Profit;
- Trailing Stop Loss;
- *Trailing Take Profit.
Disclaimer: This system may help you cut out your losses or lock in your profit, but it does not guarantee profit. Always use at your own risk.

Cyatophilum Bands Pro Trader V2 [ALERTSETUP]An Original Automated Strategy that can be used for Manual or Bot Trading, on any timeframe and market.
Presentation page with video
How it works
The Cyatophilum Bands behave as either Trend Lines during a bear or bull market, or Support and Resistance during a Flat Market. Buy and Sell signals trigger upon Trend Reversal Breakouts.
Stop Loss System
An integrated Stop Loss System. Helps reducing risk by creating buy and sell signals when the price breaks through the red line.
Trailing Stop
Transform your Stop Loss into a Trailing Stop Loss. The red line will increase/decrease to secure profits.
Take Profit
Secure your profits using this new feature! When a flag appears, a buy/sell signal will trigger.
Re-Entries
A feature that can be helpful when using Take Profit or for manual trading in case you missed a trade.
Use it literally Anywhere
This indicator can be used on any timeframe and market (not only cryptocurrencies).
Backtest Below
Note: can be easily automated with Autoview
Get the indicator today!
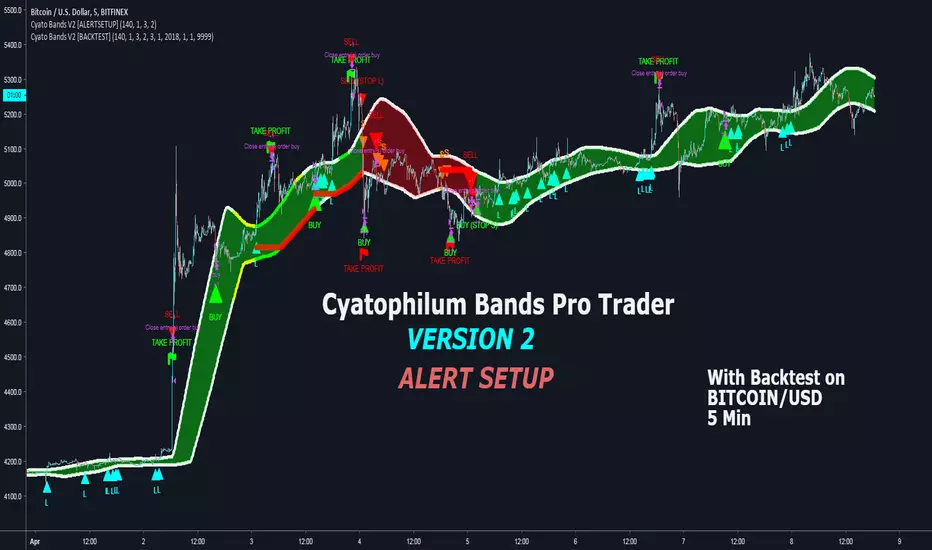
Penunjuk Arah CryRexIndikator ini sangat Berguna Untuk Scalping Dan menentukan Arah tinggal kalian mengganti timeframe saja Bagaimana indikator ini bekerja?jadi di indikator ini ada 3 line/garis Merah,Ungu,Putih Garis merah dan ungu berfungsi sebagai support and resistance dan garis putih adalah Trend bullish/naik atau Trend Bearish atau turun Ketika harga di atas garis putih dan di barengi Oleh garis merah dan ungu itu harga Bullish yang berarti ke 3 garis itu menjadi support kalau bearish maka ke 3 garis itu menjadi resistance untuk entrynya ketika harga melewati garis putih bullish kita buy lalu ketika sampai profit tertentu kita take profitnya lalu selain memanfaatkan menembus garis putih saat harga sedang bullish lalu harga drop ke garis ungu lalu mantul berarti itu menandakan trend akan berlanjut dan bisa masuk di situ garis ini bisa juga sebagai titik stop loss yaitu di bawah garis putih sebagai titik stop lossnya untuk take profitnya kalian bisa meraba raba sendiri silahkan di coba indikatornya dan di pelajari

CryptoScalper: NightMODE by BiO-618Hey guys!
It's me with a new version of the script.
Since a lot of people wanted to use it for scalping, I adjusted it for that.
More buy signals, more sell signals, 90% accuracy (at least ;) )
Remember to use the pivots to set Take Profits and Stop Losses, no software is 100% accurate, otherwise the market would trash it.
SELL SIGNALS
Red "S": Sell signal
Yellow "Sell": Strong+ sell signal
Orange "SELL": Strong++ sell signal. Shortable signal.
Red triangledown "SELL!": Strongest+++ sell signal, bearish divergences from MACD . Shortable signal.
BUY SIGNALS
Yellow triangleup "Weakening": Bear trend is getting weak, as the asset is getting oversold.
Green "BUY!": Strong buy, bullish divergence from MACD . Strongest buy signal.
Remember, again, to ALWAYS set your TP and SL beforehand. The key to be profitable is to act before the market acts.
It's better 3% in hand than 1% below your initial balance.
From a manual backtesting, I got a 53% profit on 2 weeks, trust my advice to manage the risk and you will be profitable aswell ;)
Check my other scripts to get more options :)
I also made a 4Hours and 12Hours optimized scripts, you might found that which one works better for your strategy, asset, and timeframe.

MACs EasyMoney - Advanced BOT VersionHi All,
Publishing the new version of "Advanced BOT Indicator", with some major code changes/updates to Take Profits signals.
(Implementing this Take Profits part is highly competitive and challenging code architecture)
BITMEX:XBTUSD
BITFINEX:BTCUSD
=============================================================================================
Indicator Symbols:
1) "Sell" --> refers to Sell/Short signal.
2) "Buy" --> refers to Buy/Long signal.
3) "⬆" (symbol in lime color) --> refers the Take Profits point with respect to last recent "Buy" signal.
4) "⬇" (symbol in lime color) --> refers the Take Profits point with respect to last recent "Sell" signal.
=============================================================================================
It has 6 Alert Systems:
1) Enter Buy
2) Enter Sell
3) Exit Sell
4) Exit Buy
5) Close Sell
6) Close Buy
Difference between Exit and Close options that mentioned under alerts are,
"Exit" option --> helps to stop the order at safer position - in case if market flips unexpectedly.
"Close" option --> helps to close the orders at local Top/Bottom to come out with very good profits.
==============================================================================================
Happy Trading :)
Thanks,
Mac

NGRN MACD-X & RSI v4MACD-X, RSI & Volume Indicator & Alerts Study - Version 4
Overview
This study and it's associated strategy were modeled after the famous Philakone described algorithms on his now defunct instructional video series.
This indicator allows for full customisation of parameters and interaction between three indicators that allow users to shape their trading methods to their desired goals.
This associated strategy also allows users to backtest the study alerts script and find the best settings towards that end.
MACD + RSI + VOLUME - are of the most powerful and widely usded indicators, MACD/Histogram crosses, coupled with RSI & Volume increases/decreases will detects areas of deeply oversold / overbought and buys/sells on the reversal
Features
Full customisation - All parameters are open for customising to allow the trader to build their own strategy and adapt from market to market.
Clean/Simple UI - Facilitating ease of use.
Enable Buying OR Selling, - or have them both active at the same time.
Toggle off and on ALTERNATING Buy and Sell feature (pyramiding) - to allow for consecutive DCA style buys or SCALING out of an entry (partial sell).
Customizable Stop-Loss plot - to enable users to create a STOP-LOSS alert option or other alert(s) based on the plot location. See settings screenshot.
Toggle Auto Stop-Loss sell option - to enable users choose whether or not to automatically issue a sell signal when close crosses stop loss plot, or choose to toggle off if not profitable.
Customizable Take-Profit plot - to enable users to create a TAKE-PROFIT alert option or other alert(s) based on the plot location.
Study and associated Strategy - to use the TradingView ‘Strategy Tester’ back-testing features to find the best alert settings for specific coins in bear, bull and sideways markets.
Changes Version 4
Improved STOP-LOSS plot draw (red line).
Added the option to automatically sell when stop-loss cross triggered or have the option disabled, in the event a better profit can be achieved.
Added new TAKE-PROFIT plot (aqua line) to visually guide users where to place the TAKE-PROFIT parameter as well as give users options to create alerts based on the TAKE-PROFIT plot.
Access
Full Access is 0.1 ETH , one time fee for LIFETIME access to the STUDY indicator, STRATEGY and future updates as well as support and SETTINGS for various markets on the Binance Exchange.
Settings
SCREENSHOT LINKS:
BUY SETTINGS: prntscr.com
SELL SETTINGS: prntscr.com

Strategy Validator - Backtest & Live TradeStrategy Validator is an analytical indicator for TradingView designed to evaluate trade setups, risk structure, and price behavior in real time.
The indicator builds trade scenarios, visualizes key trade levels, and provides statistical context based on historical data.
Its purpose is to help traders better understand current trade conditions and make decisions based on market structure rather than isolated signals.
🔶 Conceptual Approach
Many tools focus on a single question:
“Is there a signal right now?”
Strategy Validator approaches the market differently by analyzing a trade as a structured scenario that includes:
• current market state
• price position relative to key levels
• acceptable risk boundaries
• potential price expansion range
The indicator evaluates how well the active trade configuration aligns with historically observed market conditions and visualizes its boundaries directly on the chart.
🔶 Trade Condition Analysis
For each active configuration, the indicator evaluates:
• alignment of the entry with market structure
• market phase (directional movement, range, or elevated activity)
• risk-to-outcome relationship
• historical behavior of similar setups
The goal is to highlight trades with a clear structure and controlled risk , while filtering out weak or unstable conditions.
🎯 Trade Structure on Chart
Each trade is displayed directly on the chart with clearly defined elements:
• Entry — trade entry level
• Take Profit — projected target level
• Stop Loss — risk limitation level based on market structure and volatility
This allows immediate understanding of trade boundaries without manual calculations.
🧪 Statistical Context & Backtest
The indicator includes an integrated statistical panel showing:
• Win Rate
• Profit Factor
• Maximum Drawdown
• Net Result
• Total Trades
Two information blocks are available:
• BACKTEST — historical behavior of similar trade conditions
• POSITION — parameters and real-time state of the current trade
Historical data is used to provide analytical context, not to predict future performance.
🔶 Markets & Timeframes
🌍 Compatible with all TradingView markets:
• Crypto
• Forex
• Stocks & ETFs
• Indices
• Commodities
• Futures
⏱ Works on all timeframes — from intraday analysis to long-term charts.
🔶 Intended Use
Strategy Validator is designed for traders who:
• focus on risk-aware decision making
• prefer structured market analysis
• evaluate trades in context rather than isolation
• use statistics as a supporting decision layer
Important Notice
This indicator is an analytical tool and does not guarantee profitability.
It is not a trading robot or an automated execution system.
Past results do not guarantee future outcomes.
Always apply proper risk management.

Strategy Validator PRO - Backtest & Alerts📊 Strategy Validator PRO is a professional analytical indicator for TradingView designed to evaluate trade configurations, risk structure, and potential outcomes under current market conditions.
The indicator generates trade signals, visualizes entry and exit levels, and provides statistical context to support data-driven trading decisions rather than assumptions.
⚠️ PRO version is available by invitation only.
A simplified FREE version is publicly available for concept evaluation.
🔶 Core Concept
Most indicators answer the question:
“Where to enter?”
Strategy Validator PRO focuses on a more important one:
“How justified is this trade under current market conditions?”
The indicator applies a predefined analytical logic and evaluates how well the current trade setup aligns with statistically stable market conditions identified on an extended historical dataset.
🔶 Key Features
📈 Trade Configuration Analysis
The indicator evaluates:
• signal quality
• current market regime (trend, consolidation, volatility)
• risk-to-outcome structure
• historical behavior of similar setups
🎯 The goal is to filter weak or unfavorable trade conditions rather than simply generate signals.
🎯 Trade Structure on Chart
Each trade is displayed directly on the chart with a clear structure:
• Entry — trade entry level
• Take Profit — projected target level
• Stop Loss — risk limitation level based on market structure and volatility
This allows immediate understanding of trade boundaries without manual calculations.
🧪 Integrated Backtest Dashboard
The indicator displays performance statistics for the active logic:
• Win Rate
• Profit Factor
• Maximum Drawdown
• Net Profit
• Total Trades
Two panels are available:
• BACKTEST — historical performance overview
• POSITION — details of the current open trade
📌 Historical data is used to provide statistical context, not to predict future performance.
🔔 TradingView Alerts (PRO)
In the PRO version, alerts can be configured using TradingView’s native alert system.
Alerts may be created for:
• trade configuration formation
• target level reached
• risk limitation triggered
Available alert formats:
• Simple — plain text
• With levels — including price levels
• JSON — structured format for external analysis
🔶 PRO vs FREE
🟢 FREE
• Base analytical logic
• Limited historical depth
• Core trade structure
• Backtest dashboard
• Trade history
🔵 PRO
• Extended historical analysis
• Higher statistical sampling depth
• Trade condition filtering
• TradingView alerts
FREE version is intended for concept evaluation.
PRO version is designed for systematic and disciplined trading.
🔶 Markets & Timeframes
🌍 Compatible with all TradingView markets:
• Crypto
• Forex
• Stocks & ETFs
• Indices
• Commodities
• Futures
⏱ Works on all timeframes — from intraday to long-term.
🔶 Access
🔓 FREE version
Publicly available.
🔐 PRO version
Available by invitation.
Access can be requested via the author’s profile links or by contacting the author directly.
⚠️ Important Notice
This indicator is an analytical tool and does not guarantee profitability.
It is not a trading robot or automated execution system.
Past performance does not guarantee future results.
Always apply proper risk management.

FVG BOS SMC Liquidity Analyzer - Ambrosia-Prime - Basic v1.0# 📘 USER GUIDE
# FVG BOS Volume Volatility Entry/TP/SL Liquidity Analyzer
## 🆓 FREE Basic v1.0 | by Ambrosia-Prime
---
## 📋 TABLE OF CONTENTS
1. (#what-is-this-indicator)
2. (#settings-explained)
3. (#understanding-the-tables)
4. (#your-first-trade)
5. (#free-vs-premium)
6. (#faq)
---
## 🎯 WHAT IS THIS INDICATOR?
The **FVG Analyzer** is a professional trading tool based on **Smart Money Concepts (SMC)** and **ICT strategies**. It automatically detects:
✅ **Fair Value Gaps (FVG)** - Market imbalances
✅ **Break of Structure (BOS)** - Trend confirmations
✅ **Multi-Timeframe Analysis** - 4H, 1H, 15m, 5m, 1m
✅ **Entry, Stop-Loss & Take-Profit** - Automatic level calculation
### The Debug Table shows you everything:
| TF | FVG | Touch | Exit | READY | Signal |
|-----|------|-------|------|-------|--------|
| ► 4H| BULL | ✓ | ↑ | ✓ | LONG |
| 1H | BULL | ✓ | ↑ | ✓ | LONG |
| 15m | BULL | ✓ | ↑ | ✓ | LONG |
When all timeframes show **READY** → **ENTRY SIGNAL!**
---
## ⚙️ SETTINGS EXPLAINED
### 👁 DISPLAY SETTINGS
| Setting | Description |
|---------|-------------|
| Show Bullish FVG | Display yellow FVG boxes |
| Show Bearish FVG | Display blue FVG boxes |
| Show BOS lines | Break of Structure lines |
| Show Session Stats | Statistics table (top right) |
| Show Debug Table | Cascade status (bottom left) |
| Show Entry/SL/TP | Entry lines on signals |
### 🎯 BASIC FILTER (Choose ONE)
In the **FREE Version** you can only activate **1 filter** at a time:
| Filter | What it does |
|--------|--------------|
| **None** | No filter active |
| **FVG Size** | Only FVGs larger than X × ATR |
| **Volume** | Only on above-average volume |
| **Volatility** | Only on normal volatility (not too wild) |
| **BOS only with FVG** | BOS only when open FVG exists |
| **Fill Delete** | FVG disappears when completely filled |
> 💎 **PREMIUM:** Use all 15+ filters simultaneously!
### 🔄 TOUCH + EXIT CASCADE
| Setting | Options | Recommendation |
|---------|---------|----------------|
| Cascade Parent TF | 4H, 1H, 15m | **4H** for Swing |
| Confirm EXIT by WICK | ON/OFF | **ON** for more signals |
| Entry Trigger Level | Lowest/Middle/Parent | **Parent TF** |
| Require ALL TFs | ON/OFF | **ON** for quality |
### 📊 TP SETTINGS
| Setting | Description |
|---------|-------------|
| TP Mode | TP1 only / TP1+TP2 / TP1+TP2+TP3 |
| TP1 Risk:Reward | e.g. 1.5 = 1.5× your risk |
| TP2 Multiplier | e.g. 2.0 = 2× TP1 |
| TP3 Multiplier | e.g. 3.0 = 3× TP1 |
---
## 📈 UNDERSTANDING THE TABLES
### 📍 Filter Status (Top Left)
```
┌─────────────────────────────────────┐
│ 💎 │ ALL FILTERS │ = PREMIUM │
├─────────────────────────────────────┤
│ Active Filter │ FVG Size │ ✅ │
│ Session │ EU 🔒 │ 💎 │
│ Status │ ⏳ WAIT │FREE v1.0│
└─────────────────────────────────────┘
```
- **Active Filter:** Your selected filter
- **Session:** Current trading session
- 🔒 = Locked (PREMIUM only)
- ✅ = Unlocked (No Market 22-01 CET)
- **Status:** WAIT / 🟢 LONG / 🔴 SHORT
### 📊 Session Stats (Top Right)
```
┌──────────────────────────────────────────────────────────┐
│ Session │Bull│Bear│Total│Entries│TP│SL│Win%│Profit│
├──────────────────────────────────────────────────────────┤
│ Asia 01-09 │173 │161 │ 334 │ 💎 │💎│💎│ 💎 │PREMIUM│
│ EU 09-15:30 │131 │146 │ 277 │ 💎 │💎│💎│ 💎 │PREMIUM│
│ EU+US 15:30-17:30│ 37 │ 42 │ 79 │ 💎 │💎│💎│ 💎 │PREMIUM│
│ US 17:30-22 │ 95 │106 │ 201 │ 💎 │💎│💎│ 💎 │PREMIUM│
│ No Mkt 22-01 ✅ │ 42 │ 52 │ 94 │ 14 │14│ 0│100%│ 9.8R │
└──────────────────────────────────────────────────────────┘
```
**In FREE you see:**
- ✅ Bull/Bear/Total FVGs for **ALL** sessions
- ✅ Complete stats only for **No Market (22-01 CET)**
- 💎 Other sessions = **PREMIUM**
### 🔍 Debug Table (Bottom Left)
Shows the **live status** of the cascade:
| Symbol | Meaning |
|--------|---------|
| ► | Parent timeframe (selected) |
| BULL/BEAR | FVG direction |
| ✓ (Touch) | Price touched the zone |
| ↑/↓ (Exit) | Price exited the zone |
| ✓ (READY) | Timeframe is ready |
| LONG/SHORT | Signal direction |
---
## 🚀 YOUR FIRST TRADE
### Preface - Why this Indicator is Different
This indicator can filter so **aggressively** that you receive few or almost no signals. **That was exactly my goal!**
I don't need 500 entries per day staring at a chart all day long.
**I only need 1-3 signals per day - and they should work.**
That was the goal. Quality over quantity.
---
### Step-by-Step Guide:
**1. Create a Watchlist**
- Create a watchlist in TradingView
- Add as many charts as your account allows
- Add the indicator to all charts
**2. Set up Alerts**
- Go to the **4H chart**
- Set up the alert:
- **FREE:** Only "No Market" session (22-01 CET)
- **PREMIUM:** All sessions available
- Select "Any Entry Signal"
**3. React to Alert Signal**
- When an alert comes → Switch to the chart
- Check the **Session Stats Table** (top right)
- There you see: Entry, TP, SL, Win%, Profit
**4. Optimize Entry**
- Open the **Settings** (gear icon)
- Adjust the **TP** until you win all trades
- *(Sometimes profit is higher when you lose one trade but have a higher TP)*
- When you've found the best profit result:
- **Take the set TP minus 10-20%**
- *(We don't want to be greedy, but we want to win!)*
**5. Manage Trade**
- The **SL price** is already provided
- The **TP price** adjusts to your settings
- Set your trade accordingly
**6. Done!**
- Start the trade
- Wait for the next signal on another chart
- Repeat!
---
### ⚠️ Important Note
> Remember: A trade can always hit SL!
> Only trade with money you can afford to lose.
>
> I wish you great success and let me know how successful you were.
> **I will read every comment and answer to the best of my ability.**
---
## 💎 FREE vs PREMIUM
### *Coming soon - Currently in Release Testing*
### What you get with FREE:
| Feature | FREE 🆓 |
|---------|---------|
| FVG Detection (all TFs) | ✅ |
| BOS Detection | ✅ |
| Cascade Logic | ✅ |
| Debug Table | ✅ |
| Session Stats Table | ✅ |
| Entry/SL/TP Lines | ✅ |
| Filters | **1 at a time** |
| Trading Sessions | **Only No Market (22-01)** |
| Alerts | **Only No Market** |
### What you get with PREMIUM:
| Feature | PREMIUM 💎 |
|---------|------------|
| Everything from FREE | ✅ |
| **15+ filters simultaneously** | ✅ |
| **All sessions unlocked** | ✅ |
| → Asia (01-09) | ✅ |
| → EU (09-15:30) | ✅ |
| → EU+US Overlap (15:30-17:30) | ✅ |
| → US (17:30-22) | ✅ |
| **Alerts for all sessions** | ✅ |
| **Session-based TP optimization** | ✅ |
| **HTF Zone Confluence Filter** | ✅ |
| **Structure Filter (HH/HL/LH/LL)** | ✅ |
| **RR Filter** | ✅ |
| **Trend EMA Filter** | ✅ |
| **Candle Quality Filter** | ✅ |
| **Cooldown Filter** | ✅ |
| **FVG Age Filter** | ✅ |
### 🚀 PREMIUM EDITION (Exclusive!)
The Premium version has **two different entry logics** - that's why the testing phase is still ongoing.
Finds setups with **10-100% potential!**
---
## ❓ FAQ
### "Why don't I see any entries?"
**Possible reasons:**
1. **Wrong session:** FREE only works 22:00 - 01:00 CET
2. **Cascade not READY:** All TFs must show ✓
3. **Filter blocking:** Check your active filter
4. **Already in trade:** "Single Trade" allows only 1 trade
### "What do the colors mean?"
| Color | Meaning |
|-------|---------|
| 🟡 Yellow | Bullish FVG / Entry line |
| 🔵 Blue | Bearish FVG |
| 🟢 Green | TP line / Positive |
| 🔴 Red | SL line / Negative |
| 🟣 Purple | EU+US Overlap Session |
### "Which timeframe should I use?"
| Your Style | Chart TF | Cascade Parent |
|------------|----------|----------------|
| Scalping | 1m - 5m | 15m |
| Daytrading | 5m - 15m | 1H |
| Swing | 15m - 1H | 4H |
### "Can I change the sessions?"
- **FREE:** No, only No Market (22-01) is available.
- **PREMIUM:** Yes, all sessions + session-based TP values!
---
## 📞 WANT MORE?
### Unlock PREMIUM:
- ✅ All Sessions
- ✅ All Filters
- ✅ 2 Entry Logics
- ✅ Priority Support
### Contact & Support:
📊 **TradingView:** (www.tradingview.com)
---
## 📜 CHANGELOG
### v1.0 FREE (December 2024)
- Initial Release
- Multi-TF FVG Detection
- BOS Detection
- Cascade Logic
- 1 Filter (Dropdown)
- No Market Session (22-01)
- Session Statistics
- Debug Table
---
## ⚠️ DISCLAIMER
This indicator is an **analysis tool** and not financial advice.
Trading involves risks. Past results do not guarantee future profits.
Only trade with capital you can afford to lose.
---
**Good luck with your trading! 🚀**
*Your Ambrosia-Prime*
---
*© 2024 Ambrosia-Prime. All rights reserved.*