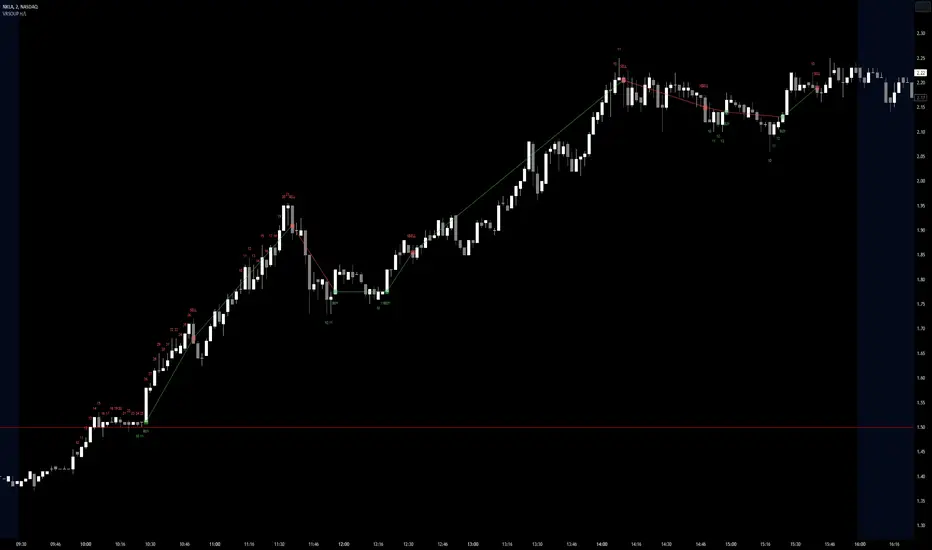
Visible Range Streaks of Unbroken Prior Highs/Lows [vnhilton](OVERVIEW)
This indicator keeps track of the number of unbroken prior highs/lows (unbroken being no price closes above/below the prior high/low). Great for entries and take profits. The indicator calculates on visible bars for convenience when looking back into the history without having to use bar replay, which those on the TradingView free plan cannot use intraday bar replay, so the visible range is a perfect work-around. The 2 minute chart above shows NASDAQ:NKLA on Thursday 13th July, 2023, with a significant level of $1.5 leading to a breakout. Streaks lower than 10 were hidden in the chart.
(FEATURES)
- Custom minimum streak size to start displaying plots (the smaller the size the more signals)
- Ability to show/hide numbers (that keep count of unbroken streaks), text signals (for when a streak is broken), break shapes (where the prior high/low was broken), and Zig Zag (lines between break shapes)
- Customisable Zig Zag line width, style, and colours (1 colour for a positive gradient line, and another for a negative gradient line)
- Customisable text signal text
- Customisable numbers, text signal, break shape, number label & text signal label colours
- Customisable number label, text signal label and break shape styles and sizes (number and text signal label share the same size)
在脚本中搜索"text"
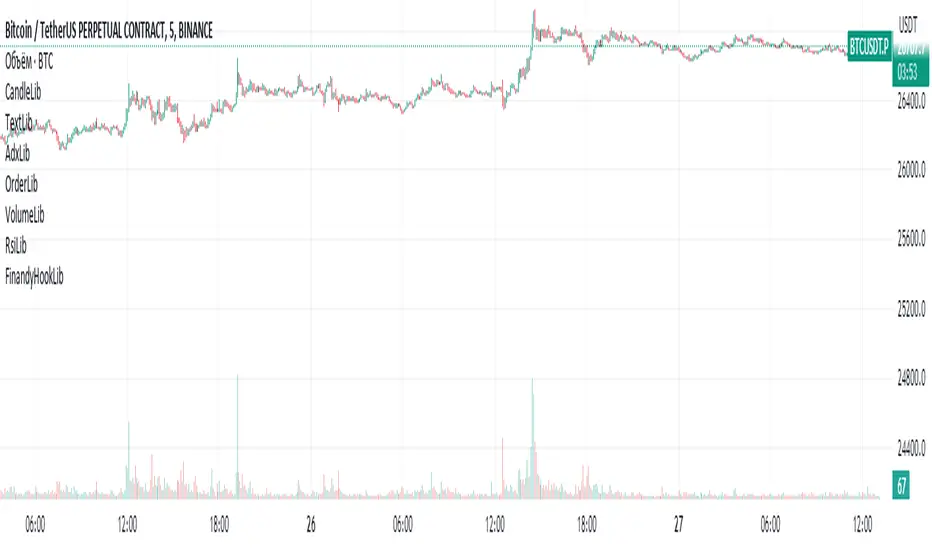
FinandyHookLibLibrary "FinandyHookLib"
TODO: add library description here
createOrderJson(model, hook_secret, options)
Parameters:
model (orderModel type from Hamster-Coder/OrderLib/7)
hook_secret (string)
options (textFormatOptions)
textFormatOptions
Fields:
price_format (series__string)
percent_format (series__string)
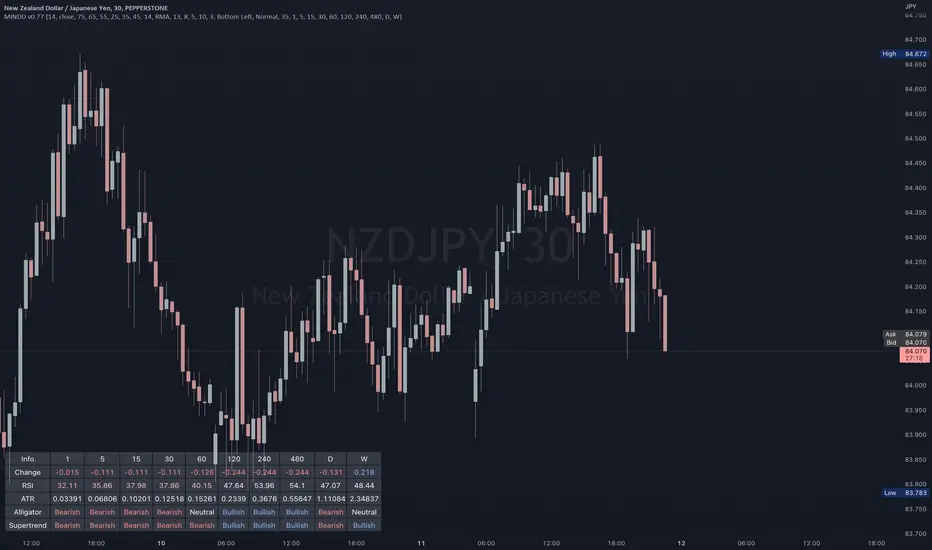
Multi IND Dashboard [Skiploss]Multi IND Dashboard is dashboard combine with price change, RSI, ATR, Alligator and Supertrend. With a maximum of 10 timeframes, I think it's going to make your life easier. In looking at the momentum of each chart.
How it work??
Change :
It is the distance from the close price of previous candlestick and shows the movement value of the candlestick in that timeframe.
RSI :
Default setting are 14 and source close
Value >= 75 : Fill text color maximum overbought
Value >= 65 : Fill text color medium overbought
Value >= 55 : Fill text color minimum overbought
Value >= 45 : Fill text color minimum overbought
Value >= 35 : Fill text color medium overbought
Value >= 25 : Fill text color maximum overbought
ATR :
Default setting are 14 length and RMA smoothing, It like the average swing of the candlesticks.
Alligator :
Default setting are 13, 8 and 5
Bullish status is value lips > teeth and teeth > jaw
Bearish status is value lips < teeth and teeth < jaw
Neutral status status is value lips > teeth and teeth < jaw or lips < teeth and teeth > jaw
Supertrend :
Default setting are 8 and 3.0
Bullish status is uptrend
Bearish status is downtrend
Traders_Reality_LibLibrary "Traders_Reality_Lib"
This library contains common elements used in Traders Reality scripts
calcPvsra(pvsraVolume, pvsraHigh, pvsraLow, pvsraClose, pvsraOpen, redVectorColor, greenVectorColor, violetVectorColor, blueVectorColor, darkGreyCandleColor, lightGrayCandleColor)
calculate the pvsra candle color and return the color as well as an alert if a vector candle has apperared.
Situation "Climax"
Bars with volume >= 200% of the average volume of the 10 previous chart TFs, or bars
where the product of candle spread x candle volume is >= the highest for the 10 previous
chart time TFs.
Default Colors: Bull bars are green and bear bars are red.
Situation "Volume Rising Above Average"
Bars with volume >= 150% of the average volume of the 10 previous chart TFs.
Default Colors: Bull bars are blue and bear are violet.
Parameters:
pvsraVolume : the instrument volume series (obtained from request.sequrity)
pvsraHigh : the instrument high series (obtained from request.sequrity)
pvsraLow : the instrument low series (obtained from request.sequrity)
pvsraClose : the instrument close series (obtained from request.sequrity)
pvsraOpen : the instrument open series (obtained from request.sequrity)
redVectorColor : red vector candle color
greenVectorColor : green vector candle color
violetVectorColor : violet/pink vector candle color
blueVectorColor : blue vector candle color
darkGreyCandleColor : regular volume candle down candle color - not a vector
lightGrayCandleColor : regular volume candle up candle color - not a vector
@return
adr(length, barsBack)
Parameters:
length : how many elements of the series to calculate on
barsBack : starting possition for the length calculation - current bar or some other value eg last bar
@return adr the adr for the specified lenght
adrHigh(adr, fromDo)
Calculate the ADR high given an ADR
Parameters:
adr : the adr
fromDo : boolean flag, if false calculate traditional adr from high low of today, if true calcualte from exchange midnight
@return adrHigh the position of the adr high in price
adrLow(adr, fromDo)
Parameters:
adr : the adr
fromDo : boolean flag, if false calculate traditional adr from high low of today, if true calcualte from exchange midnight
@return adrLow the position of the adr low in price
splitSessionString(sessXTime)
given a session in the format 0000-0100:23456 split out the hours and minutes
Parameters:
sessXTime : the session time string usually in the format 0000-0100:23456
@return
calcSessionStartEnd(sessXTime, gmt)
calculate the start and end timestamps of the session
Parameters:
sessXTime : the session time string usually in the format 0000-0100:23456
gmt : the gmt offset string usually in the format GMT+1 or GMT+2 etc
@return
drawOpenRange(sessXTime, sessXcol, showOrX, gmt)
draw open range for a session
Parameters:
sessXTime : session string in the format 0000-0100:23456
sessXcol : the color to be used for the opening range box shading
showOrX : boolean flag to toggle displaying the opening range
gmt : the gmt offset string usually in the format GMT+1 or GMT+2 etc
@return void
drawSessionHiLo(sessXTime, show_rectangleX, show_labelX, sessXcolLabel, sessXLabel, gmt, sessionLineStyle)
Parameters:
sessXTime : session string in the format 0000-0100:23456
show_rectangleX : show the session high and low lines
show_labelX : show the session label
sessXcolLabel : the color to be used for the hi/low lines and label
sessXLabel : the session label text
gmt : the gmt offset string usually in the format GMT+1 or GMT+2 etc
sessionLineStyle : the line stile for the session high low lines
@return void
calcDst()
calculate market session dst on/off flags
@return indicating if DST is on or off for a particular region
timestampPreviousDayOfWeek(previousDayOfWeek, hourOfDay, gmtOffset, oneWeekMillis)
Timestamp any of the 6 previous days in the week (such as last Wednesday at 21 hours GMT)
Parameters:
previousDayOfWeek : Monday or Satruday
hourOfDay : the hour of the day when psy calc is to start
gmtOffset : the gmt offset string usually in the format GMT+1 or GMT+2 etc
oneWeekMillis : the amount if time for a week in milliseconds
@return the timestamp of the psy level calculation start time
getdayOpen()
get the daily open - basically exchange midnight
@return the daily open value which is float price
newBar(res)
new_bar: check if we're on a new bar within the session in a given resolution
Parameters:
res : the desired resolution
@return true/false is a new bar for the session has started
toPips(val)
to_pips Convert value to pips
Parameters:
val : the value to convert to pips
@return the value in pips
rLabel(ry, rtext, rstyle, rcolor, valid, labelXOffset)
a function that draws a right aligned lable for a series during the current bar
Parameters:
ry : series float the y coordinate of the lable
rtext : the text of the label
rstyle : the style for the lable
rcolor : the color for the label
valid : a boolean flag that allows for turning on or off a lable
labelXOffset : how much to offset the label from the current position
rLabelOffset(ry, rtext, rstyle, rcolor, valid, labelXOffset)
a function that draws a right aligned lable for a series during the current bar
Parameters:
ry : series float the y coordinate of the lable
rtext : the text of the label
rstyle : the style for the lable
rcolor : the color for the label
valid : a boolean flag that allows for turning on or off a lable
labelXOffset : how much to offset the label from the current position
rLabelLastBar(ry, rtext, rstyle, rcolor, valid, labelXOffset)
a function that draws a right aligned lable for a series only on the last bar
Parameters:
ry : series float the y coordinate of the lable
rtext : the text of the label
rstyle : the style for the lable
rcolor : the color for the label
valid : a boolean flag that allows for turning on or off a lable
labelXOffset : how much to offset the label from the current position
drawLine(xSeries, res, tag, xColor, xStyle, xWidth, xExtend, isLabelValid, labelXOffset, validTimeFrame)
a function that draws a line and a label for a series
Parameters:
xSeries : series float the y coordinate of the line/label
res : the desired resolution controlling when a new line will start
tag : the text for the lable
xColor : the color for the label
xStyle : the style for the line
xWidth : the width of the line
xExtend : extend the line
isLabelValid : a boolean flag that allows for turning on or off a label
labelXOffset : how much to offset the label from the current position
validTimeFrame : a boolean flag that allows for turning on or off a line drawn
drawLineDO(xSeries, res, tag, xColor, xStyle, xWidth, xExtend, isLabelValid, labelXOffset, validTimeFrame)
a function that draws a line and a label for the daily open series
Parameters:
xSeries : series float the y coordinate of the line/label
res : the desired resolution controlling when a new line will start
tag : the text for the lable
xColor : the color for the label
xStyle : the style for the line
xWidth : the width of the line
xExtend : extend the line
isLabelValid : a boolean flag that allows for turning on or off a label
labelXOffset : how much to offset the label from the current position
validTimeFrame : a boolean flag that allows for turning on or off a line drawn
drawPivot(pivotLevel, res, tag, pivotColor, pivotLabelColor, pivotStyle, pivotWidth, pivotExtend, isLabelValid, validTimeFrame, levelStart, pivotLabelXOffset)
draw a pivot line - the line starts one day into the past
Parameters:
pivotLevel : series of the pivot point
res : the desired resolution
tag : the text to appear
pivotColor : the color of the line
pivotLabelColor : the color of the label
pivotStyle : the line style
pivotWidth : the line width
pivotExtend : extend the line
isLabelValid : boolean param allows to turn label on and off
validTimeFrame : only draw the line and label at a valid timeframe
levelStart : basically when to start drawing the levels
pivotLabelXOffset : how much to offset the label from its current postion
@return the pivot line series
getPvsraFlagByColor(pvsraColor, redVectorColor, greenVectorColor, violetVectorColor, blueVectorColor, lightGrayCandleColor)
convert the pvsra color to an internal code
Parameters:
pvsraColor : the calculated pvsra color
redVectorColor : the user defined red vector color
greenVectorColor : the user defined green vector color
violetVectorColor : the user defined violet vector color
blueVectorColor : the user defined blue vector color
lightGrayCandleColor : the user defined regular up candle color
@return pvsra internal code
updateZones(pvsra, direction, boxArr, maxlevels, pvsraHigh, pvsraLow, pvsraOpen, pvsraClose, transperancy, zoneupdatetype, zonecolor, zonetype, borderwidth, coloroverride, redVectorColor, greenVectorColor, violetVectorColor, blueVectorColor, lightGrayCandleColor)
a function that draws the unrecovered vector candle zones
Parameters:
pvsra : internal code
direction : above or below the current pa
boxArr : the array containing the boxes that need to be updated
maxlevels : the maximum number of boxes to draw
pvsraHigh : the pvsra high value series
pvsraLow : the pvsra low value series
pvsraOpen : the pvsra open value series
pvsraClose : the pvsra close value series
transperancy : the transparencfy of the vecor candle zones
zoneupdatetype : the zone update type
zonecolor : the zone color if overriden
zonetype : the zone type
borderwidth : the width of the border
coloroverride : if the color overriden
redVectorColor : the user defined red vector color
greenVectorColor : the user defined green vector color
violetVectorColor : the user defined violet vector color
blueVectorColor : the user defined blue vector color
lightGrayCandleColor : the user defined regular up candle color
cleanarr(arr)
clean an array from na values
Parameters:
arr : the array to clean
@return if the array was cleaned
calcPsyLevels(oneWeekMillis, showPsylevels, psyType, sydDST)
calculate the psy levels
4 hour res based on how mt4 does it
mt4 code
int Li_4 = iBarShift(NULL, PERIOD_H4, iTime(NULL, PERIOD_W1, Li_0)) - 2 - Offset;
ObjectCreate("PsychHi", OBJ_TREND, 0, Time , iHigh(NULL, PERIOD_H4, iHighest(NULL, PERIOD_H4, MODE_HIGH, 2, Li_4)), iTime(NULL, PERIOD_W1, 0), iHigh(NULL, PERIOD_H4,
iHighest(NULL, PERIOD_H4, MODE_HIGH, 2, Li_4)));
so basically because the session is 8 hours and we are looking at a 4 hour resolution we only need to take the highest high an lowest low of 2 bars
we use the gmt offset to adjust the 0000-0800 session to Sydney open which is at 2100 during dst and at 2200 otherwize. (dst - spring foward, fall back)
keep in mind sydney is in the souther hemisphere so dst is oposite of when london and new york go into dst
Parameters:
oneWeekMillis : a constant value
showPsylevels : should psy levels be calculated
psyType : the type of Psylevels - crypto or forex
sydDST : is Sydney in DST
@return

Simple Moving Averge StrategySimple Vs. Exponential Moving Averages
Formula for Exponential Moving Average (EMA)
\begin{aligned} &\begin{aligned} EMA_{\text{Today}}=&\left(\text{Value}_{\text{Today}}\ast\left(\frac{\text{Smoothing}}{1+\text{Days}}\right)\right)\\ &+EMA_{\text{Yesterday}}\ast\left(1-\left(\frac{\text{Smoothing}}{1+\text{Days}}\right)\right)\end{aligned}\\ &\textbf{where:}\\ &EMA=\text{Exponential moving average} \end{aligned}
EMA
Today
=
(Value
Today
∗(
1+Days
Smoothing
))
+EMA
Yesterday
∗(1−(
1+Days
Smoothing
))
where:
EMA=Exponential moving average
While there are many possible choices for the smoothing factor, the most common choice is:

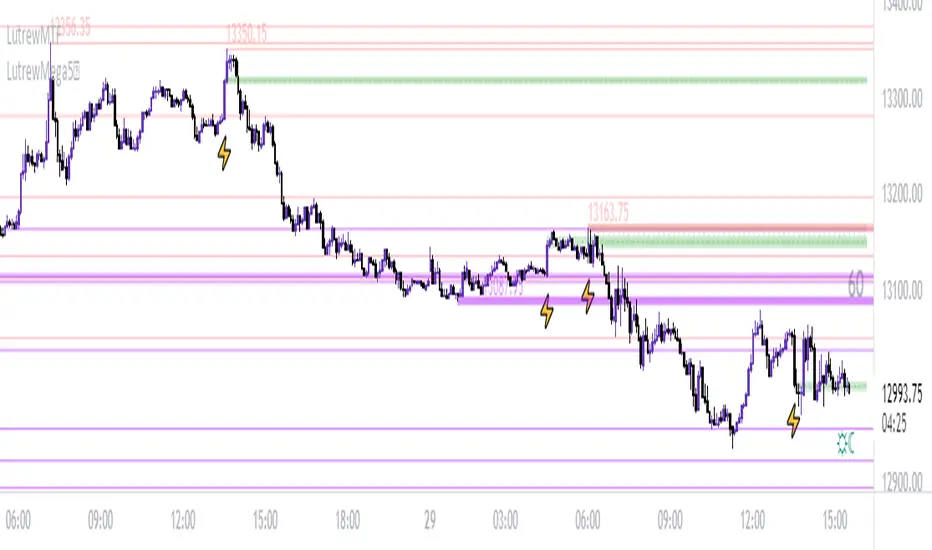
LutrewMTF// ————— Plots
var cMarkerUp = color.new(color.lime, 0)
var cMarkerDn = color.new(color.red, 0)
plotshape(A1U, "Marker 1 Up", shape.triangleup, location.belowbar, cMarkerUp, size = size.tiny, text = "1")
plotshape(A2D, "Marker 2 Dn", shape.triangledown, location.abovebar, cMarkerDn, size = size.tiny, text = "2")
plotshape(A3U, "Marker 3 Up", shape.triangleup, location.belowbar, cMarkerUp, size = size.tiny, text = "\n3")
plotshape(A4D, "Marker 4 Dn", shape.triangledown, location.abovebar, cMarkerDn, size = size.tiny, text = "4\n")
plotshape(A5U, "Marker 5 Up", shape.triangleup, location.belowbar, cMarkerUp, size = size.tiny, text = "\n\n5")
plotshape(A6D, "Marker 6 Dn", shape.triangledown, location.abovebar, cMarkerDn, size = size.tiny, text = "6\n\n")
plotshape(A7U, "Marker 7 Up", shape.triangleup, location.belowbar, cMarkerUp, size = size.tiny, text = "\n\n7")
plotshape(A8D, "Marker 8 Dn", shape.triangledown, location.abovebar, cMarkerDn, size = size.tiny, text = "8\n\n")
// ————— Alert
alertcondition( A1U or A2D or A3U or A4D or A5U or A6D or A7U or A8D, "Pivots MTF: Configured Markers", "Pivots MTF Alert")
// }
TPCLines_PublicLibrary "TPCLines_Public"
Helpers for lines
lineVA(start, lines, labels, lineColor, labelBgColor, labelTextColor, highPrice, lowPrice, extend, style, width, labelText, labelSize, labelStyle, labelTextAlign, bi) Draws a vertical line and optional label on the chart.
Parameters:
start : The start bar index or time.
lines : Line array to which the created line will be pushed.
labels : Label array to which the created label will be pushed.
lineColor : The color for the line and label.
labelBgColor : The background color for the label.
labelTextColor : The text color for the label.
highPrice : The upper price for the line.
lowPrice : The lower price for the line.
extend : Options for toggline line extend (extend.right, extend.left, extend.both, or extend.none). If none is provided, provides a best guess.
style : The line's style. Defaults to line.style_dotted.
width : The line's width. Defaults to 1.
labelText : Optional text to display next to the line.
labelSize : The label's size. Defaults to size.tiny.
labelStyle : The label's style. Defaults to label.style_label_left.
labelTextAlign : The label's text alignment. Defaults to text.align_center.
bi : Set true to use bar indices, set false to use time. Defaults to true (use bar indices).
Returns: Nothing. Draws a line and optional label on the chart.
lineHA(price, lines, labels, lineColor, labelBgColor, extend, labelTextColor, labelText, end, start, bi, showPrice, pips, style, width, labelAlign, labelSize, labelStyle, labelTextAlign) Draws a horizontal line and optional label on the chart.
Parameters:
price : The price at which to draw the lie.
lines : Line array to which the created line will be pushed.
labels : Label array to which the created label will be pushed.
lineColor : The color for the line and label.
labelBgColor : The background color for the label.
extend : Options for toggline line extend (extend.right, extend.left, extend.both, or extend.none). Defaults to extend.none.
labelTextColor : The text color for the label.
labelText : Optional text to display next to the line.
end : The time or bar index to end the line at.
start : The time or bar index to start the line at.
bi : Set true to use bar indices, set false to use time. Defaults to true (use bar indices).
showPrice : Option to show the price on the label.
pips : If a value is provided, will be displayed on the label.
style : The line's style. Defaults to line.style_solid.
width : The line's width. Defaults to 1.
labelAlign : Which side of the line to align the label on. Can be r for right, l for left, c for center, or t for the current time.
labelSize : The label's size. Defaults to size.tiny.
labelStyle : The label's style. Defaults to label.style_none.
labelTextAlign : The label's text alignment. Defaults to text.align_center.
Returns: Nothing. Draws a line and optional label on the chart.
lineH()
lineV()
Opening LevelsOpening Levels is an indicator to draw lines on the opening prices of the current day, week, and month.
Inputs:
1. Line Width :- Opening Levels Line width, from 1 to 10
2. Right Offset :- Right offset from current bar, from 0 to 50
3. Line Style :- Select line styles from
4. Show Label :- Show or hide price labels
5. Day Level Color :- Current day opening level color
6. Week Level Color :- Current week opening level color
7. Month Level Color :- Current month opening level color
8. Day Label Text Color :- Current day label text color
9. Week Label Text Color :- Current Week label text color
10. Month Label Text Color :- Current month label text color
Happy trading.
BB Breakout-Momentum + Reversion Strategies# BB Breakout-Momentum + Reversion Strategies
## Overview
This indicator combines two complementary Bollinger Band trading strategies that automatically adapt to market conditions. Strategy 1 capitalizes on trending markets with breakout-pullback-momentum setups, while Strategy 2 exploits mean reversion in ranging markets. Advanced filtering using ADX and BB Width ensures each strategy only fires in its optimal market environment.
---
## Strategy 1: Breakout → Pullback → Renewed Momentum (Long B / Short B)
### Best Market Conditions
- **Trending Markets**: ADX ≥ 25
- **High Volatility**: BB Width ≥ 1.0× average
- Directional price action with sustained momentum
### Entry Logic
**Long B (Bullish Breakout):**
1. **Initial Breakout**: Price breaks above upper Bollinger Band with strong momentum
2. **Controlled Pullback**: Price pulls back 1-12 bars but holds above lower band (stays in trend)
3. **Defended Zone**: Pullback creates a support zone based on swing lows (validated by multiple touches)
4. **Renewed Momentum**: Price reclaims with green candle, volume confirmation, bullish MACD
5. **Position Check**: Entry must have cushion below upper band and room to reach targets
**Short B (Bearish Breakdown):**
- Mirror logic for downtrends: breakdown below lower band, pullback stays below upper band, renewed selling pressure
### Risk Management
- **Stop Loss**: Lower of (zone floor/previous low) OR (1.5 × ATR from entry)
- **Targets**:
- T1: Entry + 0.85R (0.85 × 1.5 ATR)
- T2: Entry + 1.40R (1.40 × 1.5 ATR)
- T3: Entry + 2.50R (2.50 × 1.5 ATR)
- T4: Entry + 4.50R (4.50 × 1.5 ATR)
- Risk is calculated using ATR (ATRX = 1.5 ATR), stop uses tighter of structural level (ATRL) or ATRX
---
## Strategy 2: Bollinger Band Mean Reversion (Long R / Short R)
### Best Market Conditions
- **Ranging Markets**: ADX ≤ 20
- **Low Volatility**: BB Width ≤ 0.8× average
- Price oscillating around the mean without sustained trend
### Entry Logic
**Long R (Long Reversion):**
1. **Overextension**: Price breaks below lower Bollinger Band (2 consecutive closes)
2. **Snap Back**: Price crosses back above lower band (re-enters the range)
3. **Entry Window**: Within 2 candles of re-entry, look for:
- **Green candle** (close > open) confirming bullish strength
- Close above previous candle (close > close )
4. **Trigger**: First qualifying candle within 2-bar window executes the trade
**Short R (Short Reversion):**
1. **Overextension**: Price breaks above upper Bollinger Band (2 consecutive closes)
2. **Snap Back**: Price crosses back below upper band (re-enters the range)
3. **Entry Window**: Within 2 candles of re-entry, look for:
- **Red candle** (close < open) confirming bearish pressure
- Close below previous candle (close < close )
4. **Trigger**: First qualifying candle within 2-bar window executes the trade
### Risk Management
- **Stop Loss**: Lower of (previous high/low) OR (1.5 × ATR from entry)
- **Targets**: Same as Strategy 1 (0.85R, 1.4R, 2.5R, 4.5R based on 1.5 ATR)
- Betting on return to Bollinger Band basis (mean)
---
## Advanced Filtering System
### ADX Filter (Average Directional Index)
- **Purpose**: Measures trend strength vs choppy/ranging conditions
- **Trending**: ADX ≥ 25 → Enables Strategy 1 (Breakout)
- **Ranging**: ADX ≤ 20 → Enables Strategy 2 (Reversion)
- **Neutral**: ADX 20-25 → No signals (indecisive market)
### BB Width Filter
- **Purpose**: Confirms volatility expansion/contraction
- **Wide Bands**: Current width ≥ 1.0× 50-bar average → Trending environment
- **Narrow Bands**: Current width ≤ 0.8× 50-bar average → Ranging environment
- **Logic**: Both ADX and BB Width must agree on market state before signaling
### Combined Logic
- **Strategy 1 fires**: When BOTH ADX shows trending AND bands are wide
- **Strategy 2 fires**: When BOTH ADX shows ranging AND bands are narrow
- **Visual Display**: Table at bottom-right shows ADX value, BB Width ratio, and current market state
---
## Visual Elements
### Bollinger Bands
- **Gray line**: 20-period SMA (basis/mean)
- **Green line**: Upper band (basis + 2 standard deviations)
- **Red line**: Lower band (basis - 2 standard deviations)
### Strategy 1 Markers
- **Long B**: Green triangle below bar with "Long B" text
- **Short B**: Orange triangle above bar with "Short B" text
- **Defended Zones**: Green/red boxes showing pullback support/resistance areas
- **Targets**: Green/orange crosses showing T1-T4 and stop loss levels
### Strategy 2 Markers
- **Long R**: Blue label below bar with "Long R" text
- **Short R**: Purple label above bar with "Short R" text
- **Trade Levels**: Horizontal lines extending 50 bars forward
- Blue solid = Entry price
- Red dashed = Stop loss
- Green/Orange dotted = Targets (T1-T4)
### Market State Table
- **ADX**: Current value with color coding (green=trending, orange=ranging, gray=neutral)
- **BB Width**: Ratio vs 50-bar average (e.g., "1.15x" = 15% wider than average)
- **State**: TREND / RANGE / NEUTRAL classification
---
## Settings & Customization
### Bollinger Bands
- **BB Length**: 20 (default) - period for moving average
- **BB Std Dev**: 2.0 (default) - standard deviation multiplier
### ATR & Risk
- **ATR Length**: 14 (default) - period for Average True Range calculation
- All stop losses and targets are derived from 1.5 × ATR
### Trend/Range Filters
- **ADX Length**: 14 (default)
- **ADX Trending Threshold**: 25 (higher = stronger trend required)
- **ADX Ranging Threshold**: 20 (lower = tighter ranging condition)
- **BB Width Average Length**: 50 (period for comparing current width)
- **BB Width Trend Multiplier**: 1.0 (width must be ≥ this × average)
- **BB Width Range Multiplier**: 0.8 (width must be ≤ this × average)
- **Use ADX Filter**: Toggle on/off
- **Use BB Width Filter**: Toggle on/off
### Strategy 1 (Breakout-Momentum)
- **Breakout Lookback**: 15 bars (how far back to search for initial breakout)
- **Min Pullback Bars**: 1 (minimum consolidation period)
- **Max Pullback Bars**: 12 (maximum consolidation period)
- **Show Defended Zone**: Display support/resistance boxes
- **Show Signals**: Display Long B / Short B markers
- **Show Targets**: Display stop loss and target levels
### Strategy 2 (Reversion)
- **Show Signals**: Display Long R / Short R markers
- **Show Trade Levels**: Display entry, stop, and target lines
---
## How to Use This Indicator
### Step 1: Identify Market State
- Check the table in bottom-right corner
- **TREND**: Look for Strategy 1 signals (Long B / Short B)
- **RANGE**: Look for Strategy 2 signals (Long R / Short R)
- **NEUTRAL**: Wait for clearer conditions
### Step 2: Wait for Signal
- Signals only fire when ALL conditions are met (structural + momentum + filters + room-to-target)
- Signals are relatively rare but high-probability
### Step 3: Execute Trade
- **Entry**: Close of signal candle
- **Stop Loss**: Shown as red cross (Strategy 1) or red dashed line (Strategy 2)
- **Targets**: Scale out at T1, T2, T3, T4 or hold for maximum R:R
### Step 4: Management
- Consider moving stop to breakeven after T1
- Trail stop using swing lows/highs in Strategy 1
- Exit full position at T2-T3 in Strategy 2 (mean reversion has limited upside)
---
## Key Principles
### Why This Works
1. **Market Adaptation**: Uses right strategy for right conditions (trend vs range)
2. **Confluence**: Multiple confirmations required (structure + momentum + volatility + room)
3. **Risk-Defined**: Every trade has pre-calculated stop and targets based on ATR
4. **Probability**: Filters reduce noise and increase win rate by waiting for ideal setups
### Common Pitfalls to Avoid
- ❌ Taking signals in NEUTRAL market state (indicators disagree)
- ❌ Overriding the stop loss (it's calculated for a reason)
- ❌ Expecting signals on every swing (quality over quantity)
- ❌ Using Strategy 1 in ranging markets or Strategy 2 in trending markets
- ❌ Ignoring the room-to-target check (signal won't fire if targets are blocked)
### Complementary Analysis
This indicator works best when combined with:
- Higher timeframe trend analysis
- Key support/resistance levels
- Volume analysis
- Market structure (swing highs/lows)
- Risk management rules (position sizing, max daily loss, etc.)
---
## Technical Details
### Indicators Used
- **Bollinger Bands**: 20-period SMA ± 2 standard deviations
- **ATR**: 14-period Average True Range for volatility measurement
- **ADX**: 14-period Average Directional Index for trend strength
- **EMA**: 10 and 20-period exponential moving averages (Strategy 1 filter)
- **MACD**: 12/26/9 settings (Strategy 1 momentum confirmation)
- **Volume**: Compared to 15-bar average (Strategy 1 confirmation)
### Calculation Methodology
- **ATRL** (Structural Risk): Previous swing high/low or defended zone boundary
- **ATRX** (ATR Risk): 1.5 × 14-period ATR from entry price
- **Stop Loss**: Minimum of ATRL and ATRX (tightest protection)
- **Targets**: Always calculated from ATRX (consistent R-multiples)
- **BB Width Ratio**: Current BB width ÷ 50-period SMA of BB width
---
## Performance Notes
### Strengths
- Adapts to changing market conditions automatically
- Clear, objective entry and exit criteria
- Pre-defined risk on every trade
- Filters reduce false signals significantly
- Works across multiple timeframes and instruments
### Limitations
- Signals are infrequent (by design - quality over quantity)
- Requires patience to wait for all conditions to align
- May miss explosive moves if pullback doesn't form properly (Strategy 1)
- Ranging markets can transition to trending (Strategy 2 risk)
- Filters may delay entry in fast-moving markets
### Best Timeframes
- **Strategy 1**: 1H, 4H, Daily (needs time for proper pullback structure)
- **Strategy 2**: 15M, 30M, 1H (mean reversion works best intraday)
- Both strategies can work on any timeframe if market conditions are right
### Best Instruments
- **Liquid markets**: Major stocks, indices, forex pairs, liquid crypto
- **Sufficient volatility**: ATR should be meaningful relative to price
- **Clear trend/range cycles**: Markets that respect technical levels
---
## IMPORTANT DISCLAIMER
### Risk Warning
**TRADING INVOLVES SUBSTANTIAL RISK OF LOSS AND IS NOT SUITABLE FOR ALL INVESTORS.**
This indicator is provided for **educational and informational purposes only**. It does not constitute financial advice, investment advice, trading advice, or any other sort of advice. You should not treat any of the indicator's content as such.
### No Guarantee of Profit
Past performance is not indicative of future results. No trading strategy, including this indicator, can guarantee profits or protect against losses. The market is inherently unpredictable and all trading involves risk.
### User Responsibility
- **Do Your Own Research**: Always conduct your own analysis before making trading decisions
- **Test First**: Backtest and paper trade this strategy before risking real capital
- **Risk Management**: Never risk more than you can afford to lose
- **Position Sizing**: Use appropriate position sizes relative to your account
- **Stop Losses**: Always use stop losses and respect them
- **Market Conditions**: Understand that market conditions change and past behavior may not repeat
### No Liability
The creator of this indicator accepts no liability for any financial losses incurred through the use of this tool. All trading decisions are made at your own risk. You are solely responsible for evaluating the merits and risks associated with the use of any trading systems, signals, or content provided.
### Not Financial Advice
This indicator does not take into account your personal financial situation, investment objectives, risk tolerance, or specific needs. You should consult with a licensed financial advisor before making any investment decisions.
### Technical Limitations
- Indicators can repaint or lag in real-time
- Past signals may look different than real-time signals
- Code bugs or errors may exist despite testing
- TradingView platform limitations may affect functionality
### Market Risks
- Markets can gap, causing stops to be executed at worse prices
- Slippage and commissions can significantly impact results
- High volatility can cause unexpected losses
- Counterparty risk exists in all leveraged products
---
## Version History
- **v1.0**: Initial release combining breakout-momentum and mean reversion strategies
- Includes ADX and BB Width filtering
- ATRL/ATRX risk calculation system
- 2-candle entry window for reversion trades
---
## Credits & License
This indicator combines concepts from classical technical analysis including Bollinger Bands (John Bollinger), ATR (Welles Wilder), and ADX (Welles Wilder). The specific implementation and combination of filters is original work.
**Use at your own risk. Trade responsibly.**
---
*For questions, suggestions, or to report bugs, please comment below or contact the author.*
**Remember: The best indicator is the one between your ears. Use this tool as part of a comprehensive trading plan, not as a standalone solution.**

TMT Supply and Demand Zones - Hitesh Nimje📊 TMT Supply and Demand Zones - Hitesh Nimje
🎯 Overview
A professional-grade Supply & Demand zone indicator that automatically identifies and plots high-probability reversal zones across multiple timeframes. Perfect for institutional trading, smart money concepts, and price action analysis.
🔥 Key Features
✅ Multi-Timeframe Zone Detection
* 30m, 45m, 1H, 2H, 3H, 4H, Daily, Weekly zones (customizable)
* Lower timeframe zones (1m, 5m, 15m) available
* Forming zones (real-time detection of potential zones)
🎨 Full Customization
📦 Zone Settings
├── Zone Difference Scale (1.8 default) - Controls zone strength
└── Zone Extension (15 bars default)
🎭 Display Settings
├── Enable/Disable Supply & Demand independently
├── Background & Border colors for each zone type
└── Lower timeframe zone display
✍️ Text Settings
├── Separate Supply/Demand text colors
├── Text size (Auto/Tiny/Small/Normal/Large/Huge)
├── Horizontal & Vertical alignment options
└── High/Low price display option
⏰ Timeframe Options
├── Individual toggle for each timeframe
└── Smart filtering (prevents higher TF from showing lower TF zones)
🧠 Smart Zone Logic
Supply Zones form when:
* Red candle follows green/neutral candle
* Current candle is ≥1.8x larger than previous
* Price respects previous candle levels
Demand Zones form when:
* Green candle follows red/neutral candle
* Current candle is ≥1.8x larger than previous
* Price respects previous candle levels
⚡ Dynamic Zone Management
* Auto-extension to right (15 bars default)
* Auto-deletion when price breaks through
* Max 500 boxes for optimal performance
* Real-time updates on every bar
📈 How to Use
1. Basic Setup
✅ Enable desired timeframes (recommended: 30m/1H/4H/D)
✅ Keep "Zone Difference Scale" at 1.8
✅ Set Zone Extension to 15-20 bars
✅ Use white text on dark zones
2. Trading Strategy
🔴 SUPPLY ZONES (Sell Zones)
├── Price approaches from below
├── Rejection/wick at zone top
├── Sell on confirmation
🟢 DEMAND ZONES (Buy Zones)
├── Price approaches from above
├── Rejection/wick at zone bottom
├── Buy on confirmation
3. Best Combinations
💎 Pro Setup:
├── 4H + 1H zones (primary structure)
├── 30m zones (entries)
├── Daily zones (bias)
🎯 Scalping Setup:
├── 30m + 15m + 5m zones
⚙️ Input Recommendations
SettingRecommendedPurposeZone Scale1.8Strong zones onlyZone Extension15-25Good visibilitySupply ColorBlack (94% transparency)Clean lookDemand ColorBlue (94% transparency)Clear distinctionText SizeSmallReadableText ColorWhiteHigh contrast
🚀 Why This Indicator?
✅ Institutional-grade zone detection
✅ No repainting (confirmed bars only)
✅ Multi-timeframe confluence
✅ Full customization
✅ Performance optimized (500 max boxes)
✅ Clean, professional appearance
📱 Contact
Author: Hitesh Nimje
Phone: 8087192915
Source: Thought Magic Trading
"Trade the zones where smart money accumulates and distributes" 💰
TRADING DISCLAIMER
RISK WARNING
Trading involves substantial risk of loss and is not suitable for all investors. Past performance is not indicative of future results. You should carefully consider whether trading is suitable for you in light of your circumstances, knowledge, and financial resources.
NO FINANCIAL ADVICE
This indicator is provided for educational and informational purposes only. It does not constitute:
* Financial advice or investment recommendations
* Buy/sell signals or trading signals
* Professional investment advice
* Legal, tax, or accounting guidance
LIMITATIONS AND DISCLAIMERS
Technical Analysis Limitations
* Pivot points are mathematical calculations based on historical price data
* No guarantee of accuracy of price levels or calculations
* Markets can and do behave irrationally for extended periods
* Past performance does not guarantee future results
* Technical analysis should be used in conjunction with fundamental analysis
Data and Calculation Disclaimers
* Calculations are based on available price data at the time of calculation
* Data quality and availability may affect accuracy
* Pivot levels may differ when calculated on different timeframes
* Gaps and irregular market conditions may cause level failures
* Extended hours trading may affect intraday pivot calculations
Market Risks
* Extreme market volatility can invalidate all technical levels
* News events, economic announcements, and market manipulation can cause gaps
* Liquidity issues may prevent execution at calculated levels
* Currency fluctuations, inflation, and interest rate changes affect all levels
* Black swan events and market crashes cannot be predicted by technical analysis
USER RESPONSIBILITIES
Due Diligence
* You are solely responsible for your trading decisions
* Conduct your own research before using this indicator
* Verify calculations with multiple sources before trading
* Consider multiple timeframes and confirm levels with other technical tools
* Never rely solely on one indicator for trading decisions
Risk Management
* Always use proper risk management and position sizing
* Set appropriate stop-losses for all positions
* Never risk more than you can afford to lose
* Consider the inherent risks of leverage and margin trading
* Diversify your portfolio and trading strategies
Professional Consultation
* Consult with qualified financial advisors before trading
* Consider your tax obligations and legal requirements
* Understand the regulations in your jurisdiction
* Seek professional advice for complex trading strategies
LIMITATION OF LIABILITY
Indemnification
The creator and distributor of this indicator shall not be liable for:
* Any trading losses, whether direct or indirect
* Inaccurate or delayed price data
* System failures or technical malfunctions
* Loss of data or profits
* Interruption of service or connectivity issues
No Warranty
This indicator is provided "as is" without warranties of any kind:
* No guarantee of accuracy or completeness
* No warranty of uninterrupted or error-free operation
* No warranty of merchantability or fitness for a particular purpose
* The software may contain bugs or errors
Maximum Liability
In no event shall the liability exceed the purchase price (if any) paid for this indicator. This limitation applies regardless of the theory of liability, whether contract, tort, negligence, or otherwise.
REGULATORY COMPLIANCE
Jurisdiction-Specific Risks
* Regulations vary by country and region
* Some jurisdictions prohibit or restrict certain trading strategies
* Tax implications differ based on your location and trading frequency
* Commodity futures and options trading may have additional requirements
* Currency trading may be regulated differently than stock trading
Professional Trading
* If you are a professional trader, ensure compliance with all applicable regulations
* Adhere to fiduciary duties and best execution requirements
* Maintain required records and reporting
* Follow market abuse regulations and insider trading laws
TECHNICAL SPECIFICATIONS
Data Sources
* Calculations based on TradingView data feeds
* Data accuracy depends on broker and exchange reporting
* Historical data may be subject to adjustments and corrections
* Real-time data may have delays depending on data providers
Software Limitations
* Internet connectivity required for proper operation
* Software updates may change calculations or functionality
* TradingView platform dependencies may affect performance
* Third-party integrations may introduce additional risks
MONEY MANAGEMENT RECOMMENDATIONS
Conservative Approach
* Risk only 1-2% of capital per trade
* Use position sizing based on volatility
* Maintain adequate cash reserves
* Avoid over-leveraging accounts
Portfolio Management
* Diversify across multiple strategies
* Don't put all capital into one approach
* Regularly review and adjust trading strategies
* Maintain detailed trading records
FINAL LEGAL NOTICES
Acceptance of Terms
* By using this indicator, you acknowledge that you have read and understood this disclaimer
* You agree to assume all risks associated with trading
* You confirm that you are legally permitted to trade in your jurisdiction
Updates and Changes
* This disclaimer may be updated without notice
* Continued use constitutes acceptance of any changes
* It is your responsibility to stay informed of updates
Governing Law
* This disclaimer shall be governed by the laws of the jurisdiction where the indicator was created
* Any disputes shall be resolved in the appropriate courts
* Severability clause: If any part of this disclaimer is invalid, the remainder remains enforceable
REMEMBER: THERE ARE NO GUARANTEES IN TRADING. THE MAJORITY OF RETAIL TRADERS LOSE MONEY. TRADE AT YOUR OWN RISK.
Contact Information:
* Creator: Hitesh_Nimje
* Phone: Contact@8087192915
* Source: Thought Magic Trading
© HiteshNimje - All Rights Reserved
This disclaimer should be prominently displayed whenever the indicator is shared, sold, or distributed to ensure users are fully aware of the risks and limitations involved in trading.

RSI + MACD Day Trading Toolkit//@version=6
indicator("RSI + MACD Day Trading Toolkit", overlay = true)
//──────────────────────────────────────────────────────────────────────────────
// 1. INPUTS
//──────────────────────────────────────────────────────────────────────────────
// RSI settings
rsiLength = input.int(14, "RSI Length")
rsiOverbought = input.float(70, "RSI Overbought Level", minval = 50, maxval = 100)
rsiOversold = input.float(30, "RSI Oversold Level", minval = 0, maxval = 50)
// MACD settings (classic 12 / 26 / 9)
macdFastLength = input.int(12, "MACD Fast Length")
macdSlowLength = input.int(26, "MACD Slow Length")
macdSignalLength = input.int(9, "MACD Signal Length")
// Risk model selection
riskModel = input.string("ATR", "Risk Model", options = )
// ATR-based SL/TP
atrLength = input.int(14, "ATR Length")
atrSLMult = input.float(1.5, "SL ATR Multiplier", minval = 0.1, step = 0.1)
atrTPMult = input.float(2.5, "TP ATR Multiplier", minval = 0.1, step = 0.1)
// Percent-based SL/TP (for scalping on very tight spreads)
slPercent = input.float(0.5, "SL % (when Risk Model = Percent)", minval = 0.05, step = 0.05)
tpPercent = input.float(1.0, "TP % (when Risk Model = Percent)", minval = 0.05, step = 0.05)
// Visual / styling
showSLTPLines = input.bool(true, "Plot Stop Loss / Take Profit Lines")
//──────────────────────────────────────────────────────────────────────────────
// 2. CORE INDICATORS: RSI & MACD
//──────────────────────────────────────────────────────────────────────────────
rsiValue = ta.rsi(close, rsiLength)
// Manual MACD calculation (avoids tuple unpacking issues)
macdFastEMA = ta.ema(close, macdFastLength)
macdSlowEMA = ta.ema(close, macdSlowLength)
macdValue = macdFastEMA - macdSlowEMA
macdSignal = ta.ema(macdValue, macdSignalLength)
macdHist = macdValue - macdSignal
atrValue = ta.atr(atrLength)
// Hide internal plots from price scale (still accessible if you change display)
plot(rsiValue, "RSI", display = display.none)
plot(macdValue, "MACD", display = display.none)
plot(macdSignal, "MACD Sig", display = display.none)
plot(macdHist, "MACD Hist", display = display.none)
//──────────────────────────────────────────────────────────────────────────────
// 3. SIGNAL LOGIC (ENTRY CONDITIONS)
//──────────────────────────────────────────────────────────────────────────────
//
// Idea:
// - LONG bias: RSI emerges from oversold AND MACD crosses above signal below zero
// - SHORT bias: RSI falls from overbought AND MACD crosses below signal above zero
//
// Combines momentum (RSI) with trend confirmation (MACD).
//──────────────────────────────────────────────────────────────────────────────
// RSI events
rsiBullCross = ta.crossover(rsiValue, rsiOversold) // RSI crosses UP out of oversold
rsiBearCross = ta.crossunder(rsiValue, rsiOverbought) // RSI crosses DOWN from overbought
// MACD crossover with trend filter
macdBullCross = ta.crossover(macdValue, macdSignal) and macdValue < 0 // Bullish cross below zero-line
macdBearCross = ta.crossunder(macdValue, macdSignal) and macdValue > 0 // Bearish cross above zero-line
// Raw (ungated) entry signals
rawLongSignal = rsiBullCross and macdBullCross
rawShortSignal = rsiBearCross and macdBearCross
//──────────────────────────────────────────────────────────────────────────────
// 4. STATE MANAGEMENT (SIMULATED POSITION TRACKING)
//──────────────────────────────────────────────────────────────────────────────
//
// position: 1 = long
// -1 = short
// 0 = flat
//
// We track entry price and SL/TP levels as if this were a strategy.
// This is still an indicator – it just computes and plots the logic.
//──────────────────────────────────────────────────────────────────────────────
var int position = 0
var float longEntryPrice = na
var float shortEntryPrice = na
var float longSL = na
var float longTP = na
var float shortSL = na
var float shortTP = na
// Per-bar flags (for plotting / alerts)
var bool longEntrySignal = false
var bool shortEntrySignal = false
var bool longExitSignal = false
var bool shortExitSignal = false
// Reset per-bar flags each bar
longEntrySignal := false
shortEntrySignal := false
longExitSignal := false
shortExitSignal := false
//──────────────────────────────────────────────────────────────────────────────
// 5. EXIT LOGIC (STOP LOSS / TAKE PROFIT / OPPOSITE SIGNAL)
//──────────────────────────────────────────────────────────────────────────────
//
// Exits are evaluated BEFORE new entries on each bar.
//──────────────────────────────────────────────────────────────────────────────
// Stop-loss / take-profit hits for existing positions
longStopHit = position == 1 and not na(longSL) and low <= longSL
longTakeHit = position == 1 and not na(longTP) and high >= longTP
shortStopHit = position == -1 and not na(shortSL) and high >= shortSL
shortTakeHit = position == -1 and not na(shortTP) and low <= shortTP
// Opposite signals can also close positions
reverseToShort = position == 1 and rawShortSignal
reverseToLong = position == -1 and rawLongSignal
// Combine exit conditions
longExitNow = longStopHit or longTakeHit or reverseToShort
shortExitNow = shortStopHit or shortTakeHit or reverseToLong
// Register exits and flatten position
if longExitNow and position == 1
longExitSignal := true
position := 0
longEntryPrice := na
longSL := na
longTP := na
if shortExitNow and position == -1
shortExitSignal := true
position := 0
shortEntryPrice := na
shortSL := na
shortTP := na
//──────────────────────────────────────────────────────────────────────────────
// 6. ENTRY LOGIC WITH RISK MODEL (SL/TP CALCULATION)
//──────────────────────────────────────────────────────────────────────────────
//
// Only take a new trade when flat.
// SL/TP are calculated relative to entry price using either ATR or Percent.
//──────────────────────────────────────────────────────────────────────────────
if position == 0
// Long entry
if rawLongSignal
position := 1
longEntryPrice := close
if riskModel == "ATR"
longSL := longEntryPrice - atrValue * atrSLMult
longTP := longEntryPrice + atrValue * atrTPMult
else // Percent model
longSL := longEntryPrice * (1.0 - slPercent / 100.0)
longTP := longEntryPrice * (1.0 + tpPercent / 100.0)
longEntrySignal := true
// Short entry
else if rawShortSignal
position := -1
shortEntryPrice := close
if riskModel == "ATR"
shortSL := shortEntryPrice + atrValue * atrSLMult
shortTP := shortEntryPrice - atrValue * atrTPMult
else // Percent model
shortSL := shortEntryPrice * (1.0 + slPercent / 100.0)
shortTP := shortEntryPrice * (1.0 - tpPercent / 100.0)
shortEntrySignal := true
//──────────────────────────────────────────────────────────────────────────────
// 7. PLOTTING: ENTRIES, EXITS, STOPS & TARGETS
//──────────────────────────────────────────────────────────────────────────────
// Entry markers
plotshape(longEntrySignal, title = "Long Entry", style = shape.triangleup, location = location.belowbar, color = color.new(color.lime, 0), size = size.small, text = "LONG")
plotshape(shortEntrySignal, title = "Short Entry", style = shape.triangledown, location = location.abovebar, color = color.new(color.red, 0), size = size.small, text = "SHORT")
// Exit markers (generic exits: SL, TP or reversal)
plotshape(longExitSignal, title = "Long Exit", style = shape.xcross, location = location.abovebar, color = color.new(color.orange, 0), size = size.tiny, text = "LX")
plotshape(shortExitSignal, title = "Short Exit", style = shape.xcross, location = location.belowbar, color = color.new(color.orange, 0), size = size.tiny, text = "SX")
// Optional: show SL/TP levels on chart while in position
plot(showSLTPLines and position == 1 ? longSL : na, title = "Long Stop Loss", style = plot.style_linebr, color = color.new(color.red, 0), linewidth = 1)
plot(showSLTPLines and position == 1 ? longTP : na, title = "Long Take Profit", style = plot.style_linebr, color = color.new(color.lime, 0), linewidth = 1)
plot(showSLTPLines and position == -1 ? shortSL : na, title = "Short Stop Loss", style = plot.style_linebr, color = color.new(color.red, 0), linewidth = 1)
plot(showSLTPLines and position == -1 ? shortTP : na, title = "Short Take Profit", style = plot.style_linebr, color = color.new(color.lime, 0), linewidth = 1)
//──────────────────────────────────────────────────────────────────────────────
// 8. ALERT CONDITIONS
//──────────────────────────────────────────────────────────────────────────────
//
// Configure TradingView alerts using these conditions.
//──────────────────────────────────────────────────────────────────────────────
// Entry alerts
alertcondition(longEntrySignal, title = "Long Entry (RSI+MACD)", message = "RSI+MACD: Long entry signal")
alertcondition(shortEntrySignal, title = "Short Entry (RSI+MACD)", message = "RSI+MACD: Short entry signal")
// Exit alerts (by type: SL vs TP vs reversal)
alertcondition(longStopHit, title = "Long Stop Loss Hit", message = "RSI+MACD: Long STOP LOSS hit")
alertcondition(longTakeHit, title = "Long Take Profit Hit", message = "RSI+MACD: Long TAKE PROFIT hit")
alertcondition(shortStopHit, title = "Short Stop Loss Hit", message = "RSI+MACD: Short STOP LOSS hit")
alertcondition(shortTakeHit, title = "Short Take Profit Hit", message = "RSI+MACD: Short TAKE PROFIT hit")
alertcondition(reverseToShort, title = "Long Exit by Reverse Signal", message = "RSI+MACD: Long exit by SHORT reverse signal")
alertcondition(reverseToLong, title = "Short Exit by Reverse Signal", message = "RSI+MACD: Short exit by LONG reverse signal")
//──────────────────────────────────────────────────────────────────────────────
// 9. QUICK USAGE NOTES
//──────────────────────────────────────────────────────────────────────────────
//
// - Indicador, não estratégia: ele simula posição, SL/TP e sinais de saída.
// - Para backtest/auto, basta portar a mesma lógica para um script `strategy()`
// usando `strategy.entry` e `strategy.exit`.
// - Em day trade, teste ATR vs Percent e ajuste os multiplicadores ao ativo.
//──────────────────────────────────────────────────────────────────────────────

Momentum Structural AnalysisMomentum Structural Analysis (MSA‑style Oscillator)
This indicator implements a simple, MSA‑style momentum oscillator that measures how far price has moved above or below its own long‑term trend on the active timeframe, expressed in percentage terms. Instead of looking at raw price, it "oscillates" price around a timeframe‑appropriate simple moving average (SMA) and plots the percentage distance from that SMA as an orange line around a zero baseline. Zero means price is exactly at its structural trend; positive values mean price is extended above trend; negative values mean it is trading below trend.
The script automatically selects the SMA length based on the chart timeframe:
On daily charts it uses the configurable Daily SMA Length (default 252 trading days, roughly 1 year).
On weekly charts it uses Weekly SMA Length (default 208 weeks).
On monthly charts it uses Monthly SMA Length (default 120 months).
This approach is inspired by the ideas behind Momentum Structural Analysis (MSA), which studies where a market trades relative to long‑term moving averages and then treats the momentum line (the oscillator) as the primary object of analysis. The goal is to highlight structural overbought/oversold conditions and regime changes that are often clearer on momentum than on the raw price chart.
--------------------------------------------------
What the script computes and how it works
For each bar, the indicator:
Chooses an SMA length based on the current timeframe (daily/weekly/monthly).
Calculates the SMA of the close.
Computes the percentage distance:
\text{Diff %} = \frac{\text{Close} - \text{SMA}}{\text{SMA}} \times 100
Plots this Diff % as an orange line, with a dashed horizontal zero line as the base.
This produces a momentum oscillator that oscillates around zero and reflects the "structural" position of price versus its own long‑term mean.
--------------------------------------------------
How to use it on index charts (e.g., NIFTY50)
On indices like NIFTY50, use the indicator to see how stretched the index is versus its structural trend.
Typical uses:
Identify extremes: a). Historically high positive readings can signal euphoric, late‑stage conditions where risk is elevated. b). Deep negative readings can highlight panic/capitulation zones where downside may be exhausted.
Draw structural levels: a). Mark horizontal bands on the oscillator where past turns have occurred (e.g., +15%, −10%, etc. specific to NIFTY50). b). Watch how price behaves when the oscillator revisits these zones: repeated rejections can validate them as structural bounds; clean breaks can indicate a change of regime.
This is not a buy/sell signal generator by itself; it is a framework to understand where the index sits within its long‑term momentum structure and to support risk‑management decisions.
--------------------------------------------------
How to use it on ratio charts
Apply the same indicator to ratio symbols such as NIFTY50/GOLD, BANKNIFTY/NIFTY50, sector vs index, or any spread you plot as a ratio.
On a ratio chart:
The oscillator now measures relative momentum: how far that ratio is above or below its own long‑term mean.
High positive readings = strong outperformance of the numerator vs the denominator (e.g., equities strongly outperforming gold).
Deep negative readings = strong underperformance (e.g., equities structurally lagging gold).
This is very much in the spirit of MSA’s work on spreads between asset classes: it helps visualize major rotations (equities → gold, financials → commodities, etc.) and whether a relative‑performance trend is stretched, reverting, or breaking into a new phase.
--------------------------------------------------
Using multiple timeframes for better decisions
You can stack information across timeframes to get a more robust view:
Monthly : a). Use monthly charts to see secular/structural phases. b). Long multi‑year stretches above or below zero, and large bases or trendline breaks on the monthly oscillator, can mark major bull or bear cycles and big rotations between asset classes.
Weekly : a). Use weekly charts for the primary trend. b). Weekly structures (multi‑month highs/lows, channels, or trendlines on the oscillator) are useful for medium‑term positioning and for confirming or rejecting signals seen on the monthly view.
Daily : a). Use daily charts mainly for timing entries/exits once the higher‑timeframe direction is clear. b). Short‑term extremes on the daily oscillator that align with the larger weekly/monthly structure can offer better‑timed opportunities, while signals that contradict higher‑timeframe momentum are more likely to be noise.
--------------------------------------------------

PoC Migration Map [BackQuant]PoC Migration Map
A volume structure tool that builds a side volume profile, extracts rolling Points of Control (PoCs), and maps how those PoCs migrate through time so you can see where value is moving, how volume clusters shift, and how that aligns with trend regime.
What this is
This indicator combines a classic volume profile with a segmented PoC trail. It looks back over a configurable window, splits that window into bins by price, and shows you where volume has concentrated. On top of that, it slices the lookback into fixed bar segments, finds the local PoC in each segment, and plots those PoCs as a chain of nodes across the chart.
The result is a "migration map" of value:
A side volume profile that shows how volume is distributed over the recent price range.
A sequence of PoC nodes that show where local value has been accepted over time.
Lines that connect those PoCs to reveal the path of value migration.
Optional trend coloring based on EMA 12 and EMA 21, so each PoC also encodes trend regime.
Used together, this gives you a structural read on where the market has actually traded size, how "value" is moving, and whether that movement is aligned or fighting the current trend.
Core components
Lookback volume profile - a side histogram built from all closes and volumes in the chosen lookback window.
Segmented PoC trail - rolling PoCs computed over fixed bar segments, plotted as nodes in time.
Trend heatmap - optional color mapping of PoC nodes using EMA 12 versus EMA 21.
PoC labels - optional labels on every Nth PoC for easier reading and referencing.
How it works
1) Global lookback and binning
You choose:
Lookback Bars - how far back to collect data.
Number of Bins - how finely to split the price range.
The script:
Finds the highest high and lowest low in the lookback.
Computes the total price range and divides it into equal binCount slices.
Assigns each bar's close and volume into the appropriate price bin.
This creates a discretized volume distribution across the entire lookback.
2) Side volume profile
If "Show Side Profile" is enabled, a right-hand volume profile is drawn:
Each bin becomes a horizontal bar anchored at a configurable "Right Offset" from the current bar.
The horizontal width of each bar is proportional to that bin's volume relative to the maximum volume bin.
Optionally, volume values and percentages are printed inside the profile bars.
Color and transparency are controlled by:
Base Profile Color and its transparency.
A gradient that uses relative volume to modulate opacity between lower volume and higher volume bins.
Profile Width (%) - how wide the maximum bin can extend in bars.
This gives you an at-a-glance view of the volume landscape for the chosen lookback window.
3) Segmenting for PoC migration
To build the PoC trail, the lookback is divided into segments:
Bars per Segment - bars in each local cluster.
Number of Segments - how many segments you want to see back in time.
For each segment:
The script uses the same price bins and accumulates volume only from bars in that segment.
It finds the bin with the highest volume in that segment, which is the local PoC for that segment.
It sets the PoC price to the center of that bin.
It finds the "mid bar" of the segment and places the PoC node at that time on the chart.
This is repeated for each segment from older to newer, so you get a chain of PoCs that shows how local value has migrated over time.
4) Trend regime and color coding
The indicator precomputes:
EMA 12 (Fast).
EMA 21 (Slow).
For each PoC:
It samples EMA 12 and EMA 21 at the mid bar of that segment.
It computes a simple trend score as fast EMA minus slow EMA.
If trend heatmap is enabled, PoC nodes (and the lines between them) are colored by:
Trend Up Color if EMA 12 is above EMA 21.
Trend Down Color if EMA 12 is below EMA 21.
Trend Flat Color if they are roughly equal.
If the trend heatmap is disabled, PoC color is instead based on PoC migration:
If the current PoC is above the previous PoC, use the Up PoC Color.
If the current PoC is below the previous PoC, use the Down PoC Color.
If unchanged, use the Flat PoC Color.
5) Connecting PoCs and labels
Once PoC prices and times are known:
Each PoC is connected to the previous one with a dotted line, using the PoC's color.
Optional labels are placed next to every Nth PoC:
Label text uses a simple "PoC N" scheme.
Label background uses a configurable label background color.
Label border is colored by the PoC's own color for visual consistency.
This turns the PoCs into a visual path that can be read like a "value trajectory" across the chart.
What it plots
When fully enabled, you will see:
A right-sided volume profile for the chosen lookback window, built from volume by price.
Colored horizontal bars representing each price bin's relative volume.
Optional volume text showing each bin's volume and its percentage of the profile maximum.
A series of PoC nodes spaced across the chart at the mid point of each segment.
Dotted lines connecting those PoCs to show the migration path of value.
Optional PoC labels at each Nth node for easier reference.
Color-coding of PoCs and lines either by EMA 12 / 21 trend regime or by up/down PoC drift.
Reading PoC migration and market pressure
Side profile as a pressure map
The side profile shows where trading has been most active:
Thick, opaque bars represent high volume zones and possible high interest or acceptance areas.
Thin, faint bars represent low volume zones, potential rejection or transition areas.
When price trades near a high volume bin, the market is sitting on an area of prior acceptance and size.
When price moves quickly through low volume bins, it often does so with less friction.
This gives you a static map of where the market has been willing to do business within your lookback.
PoC trail as a value migration map
The PoC chain represents "where value has lived" over time:
An upward sloping PoC trail indicates value migrating higher. Buyers have been willing to transact at increasingly higher prices.
A downward sloping trail indicates value migrating lower and sellers pushing the center of mass down.
A flat or oscillating trail indicates balance or rotational behaviour, with no clear directional acceptance.
Taken together, you can interpret:
Side profile as "where the volume mass sits", a static pressure field.
PoC trail as "how that mass has moved", the dynamic path of value.
Trend heatmap as a regime overlay
When PoCs are colored by the EMA 12 / 21 spread:
Green PoCs mark segments where the faster EMA is above the slower EMA, that is, a local uptrend regime.
Red PoCs mark segments where the faster EMA is below the slower EMA, that is, a local downtrend regime.
Gray PoCs mark flat or ambiguous trend segments.
This lets you answer questions like:
"Is value migrating higher while the trend regime is also up?" (trend confirming value).
"Is value migrating higher but most PoCs are red?" (value against the prevailing trend).
"Has value started to roll over just as PoCs flip from green to red?" (early regime transition).
Key settings
General Settings
Lookback Bars - how many bars back to use for both the global volume profile and segment profiles.
Number of Bins - how many price bins to split the high to low range into.
Profile Settings
Show Side Profile - toggle the right-hand volume profile on or off.
Profile Width (%) - how wide the largest volume bar is allowed to be in terms of bars.
Base Profile Color - the starting color for profile bars, with transparency.
Show Volume Values - if enabled, print volume and percent for each non-zero bin.
Profile Text Color - color for volume text inside the profile.
PoC Migration Settings
Show PoC Migration - toggle the PoC trail plotting.
Bars per Segment - the number of bars contained in each segment.
Number of Segments - how many segments to build backwards from the current bar.
Horizontal Spacing (bars) - spacing between PoC nodes when drawn. (Used to separate PoCs horizontally.)
Label Every Nth PoC - draw labels at every Nth PoC (0 or 1 to suppress labels).
Right Offset (bars) - horizontal offset to anchor the side profile on the right.
Up PoC Color - color used when a PoC is higher than the previous one, if trend heatmap is off.
Down PoC Color - color used when a PoC is lower than the previous one, if trend heatmap is off.
Flat PoC Color - color used when the PoC is unchanged, if trend heatmap is off.
PoC Label Background - background color for PoC labels.
Trend Heatmap Settings
Color PoCs By Trend (EMA 12 / 21) - when enabled, overrides simple up/down coloring and uses EMA-based trend colors.
Fast EMA - length for the fast EMA.
Slow EMA - length for the slow EMA.
Trend Up Color - color for PoCs in a bullish EMA regime.
Trend Down Color - color for PoCs in a bearish EMA regime.
Trend Flat Color - color for neutral or flat EMA regimes.
Trading applications
1) Value migration and trend confirmation
Use the PoC path to see if value is following price or lagging it:
In a healthy uptrend, price, PoCs, and trend regime should all lean higher.
In a weakening trend, price may still move up, but PoCs flatten or start drifting lower, suggesting fewer participants are accepting the new highs.
In a downtrend, persistent downward PoC migration confirms that sellers are winning the value battle.
2) Identifying acceptance and rejection zones
Combine the side profile with PoC locations:
High volume bins near clustered PoCs mark strong acceptance zones, good areas to watch for re-tests and decision points.
PoCs that quickly jump across low volume areas can indicate rejection and fast repricing between value zones.
High volume zones with mixed PoC colors may signal balance or prolonged negotiation.
3) Structuring entries and exits
Use the map to refine trade location:
Fade trades against value migration are higher risk unless you see clear signs of exhaustion or regime change.
Pullbacks into prior PoC zones in the direction of the current PoC slope can offer higher quality entries.
Stops placed beyond major accepted zones (clusters of PoCs and high volume bins) are less likely to be hit by random noise.
4) Regime transitions
Watch how PoCs behave as the EMA regime changes:
A flip in EMA 12 versus EMA 21, coupled with a turn in PoC slope, is a strong signal that value is beginning to move with the new trend.
If EMAs flip but PoC migration does not follow, the trend signal may be early or false.
A weakening PoC path (lower highs in PoCs) while trend colors are still green can warn of a late-stage trend.
Best practices
Start with a moderate lookback such as 200 to 300 bars and a moderate bin count such as 20 to 40. Too many bins can make the profile overly granular and sparse.
Align "Bars per Segment" with your trading horizon. For example, 5 to 10 bars for intraday, 10 to 20 bars for swing.
Use the profile and PoC trail as structural context rather than as a direct buy or sell signal. Combine with your existing setups for timing.
Pay attention to clusters of PoCs at similar prices. Those are areas where the market has repeatedly accepted value, and they often matter on future tests.
Notes
This is a structural volume tool, not a complete trading system. It does not manage execution, position sizing or risk management. Use it to understand:
Where the bulk of trading has occurred in your chosen window.
How the center of volume has migrated over time.
Whether that migration is aligned with or fighting the current trend regime.
By turning PoC evolution into a visible path and adding a trend-aware heatmap, the PoC Migration Map makes it easier to see how value has been moving, where the market is likely to feel "heavy" or "light", and how that structure fits into your trading decisions.

Macros+AMD [NW]Macros + AMD - Daily & Weekly Time-Based Analysis
Multi-timeframe AMD (Accumulation, Manipulation, Distribution) visualization with ICT Macro timing windows for time-based market analysis.
Overview
This indicator visualizes the AMD (Accumulation, Manipulation, Distribution) framework on both daily and weekly timeframes, combined with ICT Macro timing windows. It is designed as an educational tool to help traders study time-based market structure and algorithmic price delivery concepts.
The AMD model is based on the idea that markets move through distinct phases within each trading period:
Accumulation (A) - Initial range formation, liquidity building
Manipulation (M) - False moves to trap traders, liquidity sweeps
Distribution (D) - True directional move, price delivery to targets
What This Indicator Displays
Daily AMD Phases
Displays the intraday AMD cycle based on New York trading hours:
A Phase (Blue): 4:00 AM - 8:35 AM EST — Morning accumulation, Asian/London overlap
M Phase (Red): 8:35 AM - 11:25 AM EST — NY session manipulation, news events
D Phase (Green): 11:25 AM - 4:00 PM EST — Afternoon distribution and price delivery
Weekly AMD Phases
Displays the weekly AMD cycle from Monday to Monday:
A Phase: Monday 00:00 - Tuesday 21:56 EST — Weekly high/low formation begins
M Phase: Tuesday 21:56 - Thursday 02:04 EST — Mid-week reversal zone
D Phase: Thursday 02:04 - Monday 00:00 EST — Weekly price delivery
Inner M Phase Fibs
When enabled, subdivides the M (Manipulation) phase using Fibonacci levels:
0.382 level — Inner accumulation ends
0.500 level — Mid-point of manipulation
0.618 level — Inner distribution begins
This helps identify potential reversal points within the manipulation phase.
ICT Macro Windows
Horizontal lines marking the XX:42 to XX:15 macro periods (33-minute windows):
2:42 - 3:15 AM
3:42 - 4:15 AM (London)
7:42 - 8:15 AM
8:42 - 9:15 AM
9:42 - 10:15 AM (Prime AM session)
10:42 - 11:15 AM
11:42 - 12:15 PM
12:42 - 1:15 PM
1:42 - 2:15 PM
2:42 - 3:15 PM
These windows represent times when algorithmic price delivery is more likely to occur.
How To Use
Understanding the AMD Framework
During the A Phase:
Observe range formation and initial liquidity pools
Note the high and low established during this phase
Wait for manipulation before committing to direction
During the M Phase:
Watch for false breakouts and stop hunts
Look for reversal patterns after liquidity sweeps
The inner fibs (0.382, 0.5, 0.618) can help time entries within this phase
Mid-week (Wednesday) often sees key reversals on weekly AMD
During the D Phase:
This is typically when the true move occurs
Price tends to deliver toward draw on liquidity targets
The direction is often opposite to the manipulation move
Using the Macro Windows
The XX:42 to XX:15 windows are times to pay attention to price action:
These 33-minute periods often see increased algorithmic activity
Look for displacement, fair value gaps, or order blocks forming
The 9:42-10:15 AM window is considered particularly significant for NY session
Weekly Day Labels
Monday/Tuesday: "H/L of Week" — Watch for weekly high or low formation
Wednesday: "Reversal Day" — Mid-week reversal probability increases
Thursday/Friday: "Reversal Day" — Continuation or secondary reversal
Settings Guide
Main Settings
Timezone: Set to your broker's timezone or preferred timezone
Macros On Top: Toggle macro lines above or below AMD boxes
Show All Text Labels: Master toggle for all text (turn off for clean charts on HTF)
Daily/Weekly AMD
Show: Enable/disable the AMD visualization
Opacity: Adjust transparency of the phase boxes (higher = more transparent)
AMD Colors
Customize colors for each phase (A, M, D)
Default: Blue (A), Red (M), Green (D)
Inner M Style
Customize the inner M phase fib lines and text colors
Default: Black lines for clean visibility
Macro Settings
Adjust macro line color and thickness
Toggle individual macro windows on/off
Important Notes
This indicator is for educational purposes and time-based analysis
It does not provide buy/sell signals
Always use in conjunction with proper price action analysis
Past price behavior during these time windows does not guarantee future results
The AMD framework is one lens for viewing market structure — use it as part of a complete methodology
Credits
This indicator is based on concepts taught by ICT (Inner Circle Trader) and the broader Smart Money Concepts community. The AMD framework, macro timing windows, and weekly profile concepts are derived from this educational methodology.
Timeframe Recommendations
Best viewed on 1-minute to 15-minute charts
Text labels automatically hide on 9-minute and higher timeframes for cleaner visualization
Indicator hides completely on 1-hour and higher timeframes
Changelog
v1.0 - Initial release
Daily AMD phases (4am-4pm EST)
Weekly AMD phases (Monday-Monday)
Inner M phase Fibonacci subdivisions
10 ICT Macro timing windows
Full customization options
Automatic 9-day cleanup

Bollinger Bands Delta Matrix Analytics [BDMA] Bollinger Bands Delta Matrix Analytics (BDMA) v7.0
Deep Kinetic Engine – 5x8 Volatility & Delta Decision Matrix
1. Introduction & Concept
Bollinger Bands Delta Matrix Analytics (BDMA) v7.0 is an analytical framework that merges:
- Spatial analysis via Bollinger Bands (%B location),
- with a 4-factor Deep Kinetic Engine based on:
• Total Volume
• Buy Volume
• Sell Volume
• Delta (Buy – Sell) Z-Scores
and converts them into an expanded 5×8 decision matrix that continuously tracks where price is trading and how the underlying orderflow is behaving.
BDMA is not a trading system or strategy. It does not generate entry/exit signals.
Instead, it provides a structured contextual map of volatility, volume, and delta so traders can:
- identify climactic extensions vs. fakeouts,
- distinguish strong initiative moves vs. passive absorption,
- and detect squeezes, traps, and liquidity voids with a unified visual dashboard.
2. Spatial Engine – Bollinger S-States (S1–S5)
The spatial dimension of BDMA comes from classic Bollinger Bands.
Price location is expressed as Percent B (%B) and mapped into 5 spatial states (S-States):
S1 – Hyper Extension (Above Upper Band)
Price has pushed beyond the upper Bollinger Band.
Often associated with parabolic or blow-off behavior, late-stage momentum, and elevated reversal risk.
S2 – Resistance Test (Upper Zone)
Price trades in the upper Bollinger region but remains inside the bands.
Represents a sustained test of resistance, typically within an established or emerging uptrend.
S3 – Neutral Zone (Middle)
Price hovers around the mid-band.
This is the mean reversion gravity field where the market often consolidates or transitions between regimes.
S4 – Support Test (Lower Zone)
Price trades in the lower Bollinger region but inside the bands.
Represents a sustained test of support within range or downtrend structures.
S5 – Hyper Drop (Below Lower Band)
Price extends below the lower Bollinger Band.
Often aligned with panic, forced liquidations, or capitulation-type behavior, with increased snap-back risk.
These 5 S-States define the vertical axis (rows) of the BDMA matrix.
3. Deep Kinetic Engine – 4-Factor Z-Score & D-States (D1–D8)
The Deep Kinetic Engine transforms raw volume and delta into standardized Z-Scores to measure how abnormal current activity is relative to its recent history.
For each bar:
- Raw Buy Volume is estimated from the candle’s position within its range
- Raw Sell Volume is complementary to buy volume
- Raw Delta = Buy Volume – Sell Volume
- Total Volume = Buy Volume + Sell Volume
These 4 series are then normalized using a unified Z-Score lookback to produce:
1. Z_Vol_Total – overall activity and liquidity intensity
2. Z_Vol_Buy – aggression from buyers (attack)
3. Z_Vol_Sell – aggression from sellers (defense or attack)
4. Z_Delta – net victory of one side over the other
Thresholds for Extreme, Significant, and Neutral Z-Score levels are fully configurable, allowing you to tune the sensitivity of the kinetic states.
Using Z_Vol_Total and Z_Delta (plus threshold logic), BDMA assigns one of 8 Deep Kinetic states (D-States):
D1 – Climax Buy
Extreme Total Volume + Extreme Positive Delta → Buying climax or blow-off behavior.
D2 – Strong Buy
High Volume + High Positive Delta → Confirmed bullish initiative activity.
D3 – Weak Buy / Fakeout
Low Volume + High Positive Delta → Bullish delta without commitment, low-liquidity breakout risk.
D4 – Absorption / Conflict
High Volume + Neutral Delta → Aggressive two-way trade, strong absorption, war zone behavior.
D5 – Neutral
Low Volume + Neutral Delta → Low-energy environment with low conviction.
D6 – Weak Sell / Fakeout
Low Volume + High Negative Delta → Bearish delta without commitment, low-liquidity breakdown risk.
D7 – Strong Sell
High Volume + High Negative Delta → Confirmed bearish initiative activity.
D8 – Capitulation
Extreme Volume + Extreme Negative Delta → Panic selling or capitulation regime.
These 8 D-States define the horizontal axis (columns) of the BDMA matrix.
4. The 5×8 BDMA Decision Matrix
The core of BDMA is a 5×8 matrix where:
- Rows (1–5) = Spatial S-States (S1…S5)
- Columns (1–8) = Kinetic D-States (D1…D8)
Each of the 40 possible combinations (SxDy) is pre-computed and mapped to:
- a Status or Regime Title (for example: Climax Breakout, Bear Trap Spring, Capitulation Breakdown),
- a Bias (Climactic Bull, Neutral, Strong Bear, Conflict or Reversal Risk, and similar labels),
- and a Strategic Signal or Consideration (for example: High reversal risk, Wait for confirmation, Low probability zone – avoid).
Internally, BDMA resolves all 40 regimes so the current state can be displayed on the dashboard without performance overhead.
5. Key Regime Families (How to Read the Matrix)
5.1. Breakouts and Breakdowns
Climax Breakout (Top-side)
Spatial S1 with Kinetic D1 or D2
Bias: Explosive or Extreme Bull
Signal:
- Strong or climactic upside extension with abnormal bullish orderflow.
- Trend continuation is possible, but reversal risk is extremely high after blow-off phases.
Low-Conviction Breakout (Fakeout Risk)
S1 with D3 (Weak Buy, low liquidity)
Bias: Weak Bull – Caution
Signal:
- Breakout not supported by volume.
- Elevated risk of failed auction or bull trap.
Capitulation Breakdown (Bottom-side)
Spatial S5 with Kinetic D8
Bias: Climactic Bear (panic)
Signal:
- Capitulation-type selling or forced liquidations.
- Trend can still proceed, but snap-back or violent short-covering risk is high.
Initiative Breakdown vs. Weak Breakdown
- Strong, high-volume breakdown typically corresponds to D7 (Strong Sell).
- Low-volume breakdown often corresponds to D6 (Weak Sell or Fakeout) with potential for failure.
5.2. Absorption, Traps and Springs
Absorption at Resistance (Top-side conflict)
S1 or S2 with D4 (Absorption or Conflict)
Bias: Conflict – Extreme Tension
Signal:
- Heavy two-way trade near resistance.
- Potential distribution or reversal if sellers begin to dominate.
Bull Trap or Failed Auction
Typically S1 with D6 (Weak Sell breakdown behavior after a top-side attempt)
Indicates a breakout attempt that fails and reverses, often after poor liquidity structure.
Absorption at Support and Bear Trap (Spring)
S4 or S5 with D4 or D3
Bias: Conflict or Weak Bear – Reversal Risk
Signal:
- Aggressive buying into lows (spring or shakeout behavior).
- Potential bear trap if price reclaims lost territory.
5.3. Trend Phases
Strong Uptrend Phases
Typically seen when S2–S3 combine with strong bullish kinetic behavior.
Bias: Strong or Extreme Bull
Signal:
- Pullbacks into S3 or S4 with supportive kinetic states often act as trend continuation zones.
Strong Downtrend Phases
Typically seen when S3–S4 combine with strong bearish kinetic behavior.
Bias: Strong or Extreme Bear
Signal:
- Rallies into resistance with strong bearish kinetic backing may act as continuation sell zones.
5.4. Neutral, Exhaustion and Squeeze
Exhaustion or Liquidity Void
S1 or S5 with D5 (Neutral kinetics)
Bias: Neutral or Exhaustion
Signal:
- Spatial extremes without kinetic confirmation.
- Often marks the end of a move, with poor follow-through.
Choppy, Low-Activity Range
S3 with D5
Bias: Neutral
Signal:
- Low volume, low conviction market.
- Typically a low-probability environment where standing aside can be logical.
Squeeze or High-Tension Zone
S3 with D4 or tightly clustered kinetic values
Bias: Conflict or High Tension
Signal:
- Hidden battle inside a volatility contraction.
- Often precedes large directionally-biased moves.
6. Dashboard Layout & Reading Guide
When Show Dashboard is enabled, BDMA displays:
1. Title and Status Line
Name of the current regime (for example: Climax Breakout, Bear Trap Spring, Mean Reversion).
2. Bias Line
Plain-language summary of directional context such as Climactic Bull, Strong Bear, Neutral, or Conflict and Reversal Risk.
3. Signal or Strategic Notes
Concise guidance focused on risk and context, not entries. For example:
- High reversal risk – aggressive traders only
- Wait for confirmation (break or rejection)
- Low probability zone – avoid taking new positions
4. Kinetic Profile (4-Factor Z-Score)
Shows the current Z-Scores for Total Volume (Activity), Buy Volume (Attack), Sell Volume (Defense), and Delta (Net Result).
5. Matrix Heatmap (5×8)
Visual representation of S-State vs. D-State with color coding:
- Bullish clusters in a green spectrum
- Bearish clusters in a red spectrum
- Conflict or exhaustion zones in yellow, amber, or neutral tones
The dashboard can be repositioned (top right, middle right, or bottom right) and its size can be adjusted (Tiny, Small, Normal, or Large) to fit different layouts.
7. Inputs & Customization
7.1. Core Parameters (Bollinger and Z-Score)
- Bollinger Length and Standard Deviation define the spatial engine.
- Z-Score Lookback (All Factors) defines how many bars are used to normalize volume and delta.
7.2. Deep Kinetic Thresholds
- Extreme Threshold defines what is considered climactic (D1 or D8).
- Significant Threshold distinguishes strong initiative vs. weak or fakeout behavior.
- Neutral Threshold is the band within which delta is treated as neutral.
These thresholds allow you to tune the sensitivity of the kinetic classification to fit different timeframes or instruments.
7.3. Calculation Method (Volume Delta)
Geometry (Approx)
- Fast, non-repainting approach based on candle geometry.
- Suitable for most users and real-time decision-making.
Intrabar (Precise)
- Uses lower-timeframe data for more precise volume delta estimation.
- Intrabar mode can repaint and requires compatible data and plan support on the platform.
- Best used for post-analysis or research, not blind automation.
7.4. Visuals and Interface
- Toggle Bollinger Bands visibility on or off.
- Switch between Dark and Light color themes.
- Configure dashboard visibility, matrix heatmap display, position, and size.
8. Multi-Language Semantic Engine (Asia and Middle East Focus)
BDMA v7.0 includes a fully integrated multi-language layer, targeting a wide geographic user base.
Supported Languages:
English, Türkçe, Русский, 简体中文, हिन्दी, العربية, فارسی, עברית
All dashboard labels, regime titles, bias descriptions, and signal texts are dynamically translated via an internal dictionary, while semantic meaning is kept consistent across languages.
This makes BDMA suitable for multi-language communities, study groups, and educational content across different regions.
However, due to the heavy computational load of the Deep Kinetic Engine and TradingView’s strict Pine Script execution limits, it was not possible to expand support to additional languages. Adding more translation layers would significantly increase memory usage and exceed runtime constraints. For this reason, the current language set represents the maximum optimized configuration achievable without compromising performance or stability.
9. Practical Usage Notes
BDMA is most powerful when used as a contextual overlay on top of market structure (HH, HL, LH, LL), higher-timeframe trend, key levels, and your own execution framework.
Recommended usage:
- Identify the current regime (Status and Bias).
- Check whether price location (S-State) and kinetic behavior (D-State) agree with your trade idea.
- Be especially cautious in climactic and absorption or conflict zones, where volatility and risk can be elevated.
Avoid treating BDMA as an automatic green equals buy, red equals sell tool.
The real edge comes from understanding where you are in the volatility or kinetic spectrum, not from forcing signals out of the matrix.
10. Limitations & Important Warnings
BDMA does not predict the future.
It organizes current and recent data into a structured context.
Volume data quality depends on the underlying symbol, exchange, and broker feed.
Forex, crypto, indices, and stocks may all behave differently.
Intrabar mode can repaint and is sensitive to lower-timeframe data availability and your plan type.
Use it with extra caution and primarily for research.
No indicator can remove the need for clear trading rules, disciplined risk management, and psychological control.
11. Disclaimer
This script is provided strictly for educational and analytical purposes.
It is not a trading system, signal service, financial product, or investment advice.
Nothing in this indicator or its description should be interpreted as a recommendation to buy or sell any asset.
Past behavior of any indicator or market pattern does not guarantee future results.
Trading and investing involve significant risk, including the risk of losing more than your initial capital in leveraged products.
You are solely responsible for your own decisions, risk management, and results.
By using this script, you acknowledge that you understand these risks and agree that the author or authors and publisher or publishers are not liable for any loss or damage arising from its use.

HL/LH Confirmation Strategy (Clean Market Structure)🚦 HL/LH Confirmation Strategy (Clean Market Structure)
This indicator is specifically designed to help traders identify a clean market structure by tracking the formation of Higher Lows (HL) and Lower Highs (LH). Rather than chasing new price extremes (new Highs or new Lows), the focus is on waiting for trend strength confirmation before considering an entry.
Key Strategy: Waiting for Trend Confirmation 💡
The core advantage of this indicator lies in its confirmation strategy:
For Uptrends (Bullish): The indicator doesn't signal just any low, but only when it detects a Higher Low (HL)—a low that is higher than the previous low. This is a crucial sign that the market has defended a level and is ready to continue moving up. This approach helps avoid chasing new lows and encourages entering trades after confirmation.
For Downtrends (Bearish): Similarly, the indicator looks for the formation of a Lower High (LH)—a high that is lower than the previous high. This suggests that buyers failed to breach the last resistance, signaling a potential continuation of the downside movement.
The indicator alternates between looking for an HL, then an LH, then an HL, visually mapping the Pivot swings and highlighting the moment of trend confirmation for potential trade entries.
Indicator Features ✨
Clear Structure Display: By drawing connecting lines between valid HL and LH points, the indicator visually maps the current market structure.
Pivot Detection: It uses an effective method for Pivot detection, with the sensitivity adjustable via the "Pivot Left" and "Pivot Right" parameters.
Custom Label Placement (Crucial Detail):
HL Label: Placed below the candle for better visual clarity of the bullish support area.
LH Label: Placed above the candle for better visual clarity of the bearish resistance area.
Customizable Colors: Full control over the background and text colors for HL and LH signals, as well as the thickness and color of the connecting lines between Pivot points.
⚙️ Input Parameters
Pivot Settings
Pivot Left / Pivot Right: Determine the number of bars to the left and right that must have lower/higher prices for a point to be declared a valid Pivot (Pivot High or Pivot Low). Increase these values to detect more significant, longer-term swings.
Signal Colors
HL Background/Text Color: Colors for the background and text of the Higher Low (HL) labels.
LH Background/Text Color: Colors for the background and text of the Lower High (LH) labels.
Line Settings
Line Color / Line Width: Allows customization of the appearance of the line connecting the detected HL and LH points.
Recommended Use
This indicator is ideal for traders practicing Price Action and strategies based on Market Structure. Use the HL signals as potential zones for long entries (buying) in an uptrend, and LH signals as zones for short entries (selling) in a downtrend, always after the point formation is confirmed.

FRAN CRASH PLAY RULESPurpose
It creates a fixed information panel in the top right corner of your chart that shows the "FRAN CRASH PLAY RULES" - a checklist of criteria for identifying potential crash play setups.
Key Features
Display Panel:
Shows 5 trading rules as bullet points
Permanently visible in the top right corner
Stays fixed while you scroll or zoom the chart
Current Rules Displayed:
DYNAMIC 3 TO 5 LEG RUN
NEAR VERTICAL ACCELERATION
FINAL BAR OF THE RUN UP MUST BE THE BIGGEST
3 FINGER SPREAD / DUAL SPACE
ATLEAST 2 OF 5 CRITERIA NEEDS TO HIT
Customization Options:
Editable Text - Change any of the 5 rules through the settings
Text Color - Adjust the color of the text
Text Size - Choose from tiny, small, normal, large, or huge
Background Color - Customize the panel background and transparency
Frame Color - Change the border color
Show/Hide Frame - Toggle the border on or off
Use Case
This indicator serves as a constant visual reminder of your trading strategy criteria, helping you stay disciplined and only take trades that meet your specific crash play requirements. It's essentially a "cheat sheet" that lives on your chart so you don't have to memorize or look elsewhere for your trading rules.

IBIT premium(vs NAV)This Pine Script calculates and plots the real-time trading premium or discount of the IBIT ETF relative to its official Net Asset Value (NAV).
It shows whether IBIT is trading above NAV (premium) or below NAV (discount) in percentage terms.
This version is accurate because it uses TradingView’s built-in ETF NAV financial data, rather than estimating BTC per share.
⸻
Key Data Sources Used
• Market Price:
The script pulls the live IBIT market price from NASDAQ:IBIT.
• Official NAV:
It retrieves the daily Net Asset Value (NAV) using TradingView’s financial data function and expands it across all intraday timeframes so it can be compared with real-time prices.
• Platform used: TradingView
⸻
How the Premium Is Calculated
The script uses the standard ETF premium formula:
\text{Premium (\%)} = \frac{\text{Market Price} - \text{NAV}}{\text{NAV}} \times 100
• Positive value → IBIT is trading at a premium
• Negative value → IBIT is trading at a discount
• Zero → IBIT is trading exactly at NAV
⸻
What the Chart Displays
• A real-time premium (%) line in a separate indicator panel
• A 0% reference line showing fair value
• ±1% and ±2% guide lines for abnormal deviation detection
• A live value label on the latest bar showing the exact current premium
⸻
Why This Script Is Accurate
• Uses official ETF NAV, not a BTC-per-share estimate
• NAV updates once per day, exactly as reported by the issuer
• Works on all timeframes (1-minute to daily)
• Shows true market mispricing, not synthetic BTC tracking error
⸻
How Traders Typically Use It
• Detect temporary dislocations between IBIT price and NAV
• Monitor liquidity stress during high volatility
• Validate whether IBIT is trading efficiently versus BTC
• Support ETF–BTC–Futures arbitrage analysis
⸻
Important Limitation
• NAV is only updated once per trading day
• During fast BTC moves, the premium may widen temporarily and normalize later via authorized participant (AP) arbitrage

CriptoAlert AutoPlot (parser robusto)CriptoAlert AutoPlot is a utility indicator designed for traders who receive structured trading signals and want to automatically plot entry zones, targets, and stop levels on their TradingView chart — without manually drawing horizontal lines.
This tool is ideal for users of Cripto.Alert or any trading methodology that outputs price levels in text format.
How It Works
Paste your full text-based trading signal into the input box, and the indicator automatically:
Parses the text
Extracts the following price levels:
Entry Min
Entry Max
Target 1
Target 2
Target 3
Stop
Draws horizontal dotted lines corresponding to each level
Adjusts dynamically whenever you replace the signal text
Allows you to hide all lines instantly using the “Clear values” toggle
Lines behave exactly like native TradingView horizontal lines — they stay fixed to price regardless of zoom level or time frame.
Supported Input Format
Paste the full signal in a single line or multi-line format.
The parser is flexible and recognizes the standard Cripto.Alert structure:
Entrada: 0.882438 até 1.029428
Alvos:
1- 0.560266 (41.39%)
2- 0.362432 (62.09%)
3- 0.164599 (82.78%)
Stop: 1.100001 (15.07%)
You may also place everything on one line:
Entrada: 0.882438 até 1.029428 Alvos: 1- 0.560266 | 2- 0.362432 | 3- 0.164599 Stop: 1.100001
Example of Extracted Values
After parsing, the indicator internally produces:
Entry Min: 0.882438
Entry Max: 1.029428
Target 1: 0.560266
Target 2: 0.362432
Target 3: 0.164599
Stop: 1.100001
These values are plotted automatically.
Features
Automatic parsing of trading signal text
Horizontal dotted lines with adjustable opacity
Layout-friendly design
Clear-all option for quick chart cleanup
Works on any market and any timeframe
Reliable even when zooming or scaling the chart
Ideal For
Cripto.Alert users
Professional and retail traders
Swing traders and scalpers using multiple price levels
Educators who want clean chart templates for teaching
Anyone who frequently plots multiple horizontal levels manually
Limitations
Only parses numbers in the standard Cripto.Alert signal format
Does not calculate risk/reward or validate signal quality
Does not provide buy/sell recommendations
This indicator is purely a visual aid to speed up your charting workflow.

Green13 - Watermark with Daily ATRWatermark with custom texts and with Daily ATR and the name of the week

Systemic Net Liquidity (Macro Fuel for Crypto & Stocks)This indicator tracks Systemic Net Liquidity, the single most important macro factor for determining the long-term trend of risk assets like Bitcoin (BTC) and major indices (S&P 500). It measures the amount of actual cash available in the financial system to chase speculative assets, distinguishing between money that is circulating and money that is locked up at the Federal Reserve.
Mechanism (What It Measures)
The script uses direct data from the FRED (Federal Reserve Economic Data) to calculate the true state of market funding:
\text{Net Liquidity} = \text{Fed Assets (WALCL)} - \text{Treasury General Account (TGA)} - \text{Reverse Repo (RRP)}
1. Fed Assets (WALCL): The total balance sheet of the Fed (The overall supply of money).
2. Treasury General Account (TGA): Funds the US Treasury collects via bond issuance. When the TGA rises, liquidity is actively drained from the banking system (A major bearish pressure).
3. Overnight Reverse Repo (RRP): Cash parked by banks and money market funds at the Fed, effectively frozen and not contributing to market activity.
How to Interpret Signals
Treat the Net Liquidity line as the market's "Fuel Gauge":
📈 BULLISH SIGNAL (Liquidity Injection): When the Net Liquidity line is rising, money is flowing back into the system, signalling a tailwind for risk assets.
📉 BEARISH SIGNAL (Liquidity Drain): When the line is falling (often due to high TGA balances), cash is being removed. This signals major friction and pressure on price action.
⚠️ DIVERGENCE WARNING: A strong signal is generated when Price (e.g., BTC) rises, but Net Liquidity falls. This macro divergence strongly suggests a major trend reversal or correction is imminent.
Important Notes
Data Source: Data is directly sourced from FRED and updates daily/weekly. This tool is best used for macro analysis and identifying high-level cycles, not short-term scalping.
Disclaimer: Use this indicator as a confirmation tool within your broader strategy. It is not a standalone trading signal.

Institutional Volume Flow (IVF) with VWAP & Zones. Accumulation Zone (Green Background)Logic: Signals potential institutional buying at the low.Conditions: The current close price is below VWAP $\text{(close} < \text{VWAP)}$, AND there has been at least one Aggressive Buy (IVF) bar within the last $\text{N}$ bars.2. Manipulation Zone (Red Background)Logic: Signals a Stop Hunt or False Breakout where the market briefly takes out a previous extreme before reversing with institutional conviction.Conditions:False Break High: Current high is a new 2-bar high, immediately followed by an Aggressive Sell (IVF) bar.False Break Low: Current low is a new 2-bar low, immediately followed by an Aggressive Buy (IVF) bar.3. Compression Zone (Purple Background)Logic: Signals a period of low volatility where price is "coiling up" for a large move.Conditions: The bar's range $\text{(high} - \text{low)}$ is consistently small (less than a multiplier of the Average True Range (ATR)) for a specific number of bars.The zones are plotted using bgcolor() for a visual area on the chart and plotshape() to mark the specific bar where the condition is met. Manipulation is given the highest plotting priority to ensure it's visible over other zones if conditions overlap.Would you like me to elaborate on the typical trading strategy associated with any of these three zones (Accumulation, Manipulation, or Compression)?
