Weekly price boxWeekend Trap / Custom Timebox Analyzer
This indicator allows traders to define a specific time window (e.g., the "Weekend Trap" period from Friday to Sunday, or a full weekly range) and automatically draws a box highlighting the price action during that session. It is designed to help visualize gaps, ranges, and trend direction over specific timeframes.
Key Features
Dynamic Range Detection: automatically draws a box connecting the Highest High and Lowest Low occurring between your start and end times.
Trend Visualization: The box changes color dynamically based on price performance:
Bullish (Blue): Close is higher than the Open of the defined period.
Bearish (Red): Close is lower than the Open of the defined period.
Smart Labeling: Displays a customizable label (default: "Box") along with the real-time Percentage Change of the period. The label is positioned intelligently outside the box to avoid cluttering the price action.
Flexible Timing:
Supports standard intraday sessions (e.g., Mon 09:00 to Mon 17:00).
Supports "wrap-around" sessions (e.g., Friday 23:00 to Sunday 17:00).
New: Supports full-week monitoring (e.g., Friday to Friday) by handling start times that are later than end times on the same day.
Fully Customizable:
Configure specific Bullish and Bearish colors (Border, Background, Text).
Adjust line styles (Solid, Dashed, Dotted) and widths.
Select days via easy-to-use dropdown menus.
How to Use
Time Settings:
Select your Start Day and Time (e.g., Friday 23:00).
Select your End Day and Time (e.g., Sunday 17:00).
Note: Times are based on the Chart/Exchange time.
Visual Settings:
Go to the settings menu to define your preferred colors for Bullish and Bearish scenarios.
Toggle the Label on/off and adjust text size.
Use Cases
Weekend Gaps: Monitor price action that occurs during off-hours or between market close and open.
Opening Range Breakouts: Define the first hour of trading to see the initial range.
Weekly Profiles: Set the start and end day to the same day (e.g., Friday to Friday) to visualize the entire week's range and net performance.
Built with Pine Script™ v6
在脚本中搜索"text"

Etherium CME gaps multi-timeframe auto finderThis indicator is a powerful tool that automatically detects and visualizes price gaps (Gaps) in the Ethereum CME futures market across multiple timeframes and also provides alert functionality. Price gaps occur when the futures market is inactive for a certain period, often acting as potential support or resistance zones.
What is an Ethereum CME Gap?
CME (Chicago Mercantile Exchange) is one of the largest derivatives exchanges globally. The Ethereum CME futures market is closed on weekends and certain holidays. When the market reopens, a price difference may occur between the previous closing price and the new opening price, referred to as a "CME Gap."
Key Features of the Indicator
Multi-timeframe gap detection: Detects and displays gaps across 5m, 15m, 30m, 1h, 4h, 1d timeframes simultaneously.
Customizable CME Symbol: You can specify Ethereum CME futures symbols, such as ETH1!.
Two gap price display methods:
CME_price: Displays the gap based on the actual price levels in the CME futures market.
Chart_price: Adjusts the gap to match the price levels on the chart being viewed (e.g., spot market). This helps visualize the impact of futures gaps on the spot market.
Visual customization:
Individual color settings for bullish/bearish gap boxes for each timeframe.
Adjust the extension (display length) of gap boxes in bars.
Configure label display, position, text size, background, and text color.
Highlight significant gaps: Emphasize gaps above a specified percentage with a unique color and border thickness.
Alert functionality: Receive notifications when a gap is detected, with options to enable alerts only for specific timeframes.
Why CME Gaps Matter
Traders often consider CME gaps as significant price zones.
Gap Fill: Historical data shows that many gaps tend to get "filled" over time, meaning the price returns to the gap area, reaching the start or end point of the gap.
Support/Resistance: Unfilled gaps can serve as potential support (Bullish Gap) or resistance (Bearish Gap) zones.
Bullish Gap: Occurs when the current opening price is higher than the previous closing price. Typically leaves an unfilled gap below (previous high), which can act as potential support.
Bearish Gap: Occurs when the current opening price is lower than the previous closing price. Typically leaves an unfilled gap above (previous low), which can act as potential resistance.
How to Use the Indicator
Add Indicator on TradingView: Click the "Indicators" button on the TradingView chart.
Find the indicator in "My Scripts" or "Invite-Only Scripts" and add it to the chart.
Adjust Settings: Once the indicator is added, click the settings (gear) icon to adjust inputs.
CME Symbol (ETH): ETH1! is typically the default symbol for Ethereum CME futures. Confirm based on your broker or data feed.
Min gap %: Set the minimum gap size in percentage; smaller gaps will not be displayed.
Select Exchanges to Display gap price: Choose between "CME_price" or "Chart_price." For viewing futures gaps on a spot chart, "Chart_price" is recommended.
Show Xm/h/d gap boxes: Select which timeframe gap boxes to display.
Color, Extension, Label settings: Customize the visual aspects of gap boxes and labels.
Highlight gap % (>=): Set the minimum percentage for highlighting significant gaps.
Enable Alerts: Choose whether to receive alerts when a gap is detected.
Alert Timeframe: Select whether alerts apply to all timeframes or specific ones only.
Chart Analysis
Once the indicator is applied, gap boxes for the selected timeframes appear on the chart.
Green shades indicate Bullish Gaps, and red shades indicate Bearish Gaps (default green can be customized, and bearish gap color can be set separately).
Highlighted gaps may carry higher significance and should be monitored carefully.
Potential trading opportunities can be explored when the price approaches or attempts to fill a gap.
Usage Strategies (Examples)
Support/Resistance Confirmation: The lower boundary of a bullish gap can act as potential support, while the upper boundary of a bearish gap can act as potential resistance. Observe for reversals or breakouts when price reaches these areas.
Retracement Trading: Trade when the price returns to fill a gap after leaving it through a sharp move up or down.
Multi-timeframe Analysis: Gaps overlapping across multiple timeframes can form stronger support/resistance zones.
Considerations
* "Gap Filled" Condition: The indicator does not draw a gap if it determines that the gap has already been filled by the current bar’s low (bullish gap) or high (bearish gap).
* Tool Only: This indicator is a gap detection tool and should not be used alone for trading decisions. Always combine with other technical analysis tools and your trading strategy.
* Past Data ≠ Future Guarantee: Historical gap fill trends do not guarantee future occurrences.
This indicator allows effective tracking of Ethereum CME futures gaps and provides valuable insights for enhancing your trading strategy.

Previous Session Lines — High, Low, and 50% LevelsThis indicator automatically marks the previous completed session’s price range on your chart. You select a daily session window (for example: 09:30–16:00) and the script calculates:
* Previous Session High
* Previous Session Low
* Previous Session 50% (Midpoint)
When a session closes, the indicator draws all three levels on the chart and extends them forward for 24 hours, giving you clean, stable reference levels for the current trading day. Only the most recent session is shown; older sessions are automatically removed.
These levels are commonly used by day traders and swing traders to identify:
* Key support and resistance zones
* Breakout or rejection levels
* Market bias for the new session
* Areas where liquidity tends to accumulate
* Price reaction levels during overnight or intraday trading
Because the lines do not update in real time during the session, the levels remain static, accurate, and truly represent the completed session.
Settings users can adjust:
Session Settings:
* Start and end time of the session (repeats daily)
* Custom session name, which appears on the line labels
Line Appearance:
* Color
* Line thickness
* Line style (solid, dashed, dotted)
Label Appearance:
* Text size (tiny to huge)
* Text color automatically adjusts to contrast with the selected line color
Why this indicator is useful:
* Makes prior session structure immediately visible
* Helps identify high-probability reaction areas
* Shows only one session to reduce clutter
* Lines stay stable regardless of chart zoom or scaling
* Labels stay aligned at the right side of the chart
* Works on all timeframes, including extended hours and crypto charts
This tool is ideal for traders who rely on structured session analysis, including day traders, futures traders, forex traders, crypto traders, and anyone using session highs and lows to guide trading decisions.
This was developed to create an auto-mapping tool to comply with MrZinc's "London 50" strategy. You can learn more about that on his YouTube channel www.youtube.com
You can follow my YouTube trading channel here
www.youtube.com

ATR EMA Bands (Kerry Lovvorn Style) - Fixed Scale//@version=5
indicator("ATR EMA Bands (Kerry Lovvorn Style) - Fixed Scale",
overlay = true,
scale = scale.right, // ⭐ 强制使用右侧价格刻度
precision = 2)
// ——— 参数 ———
src = input.source(close, "Source")
emaLength = input.int(34, "EMA Length")
atrLength = input.int(13, "ATR Length")
atrMult1 = input.float(1.0, "ATR ×1")
atrMult2 = input.float(2.0, "ATR ×2")
atrMult3 = input.float(3.0, "ATR ×3")
// ——— 计算 ———
ema = ta.ema(src, emaLength)
atr = ta.atr(atrLength)
// 上下轨
upper1 = ema + atr * atrMult1
upper2 = ema + atr * atrMult2
upper3 = ema + atr * atrMult3
lower1 = ema - atr * atrMult1
lower2 = ema - atr * atrMult2
lower3 = ema - atr * atrMult3
// ——— 绘图 ———
plot(ema, "EMA", color = color.white, linewidth = 2)
plot(upper1, "Upper 1×ATR", color = color.new(color.green, 0))
plot(upper2, "Upper 2×ATR", color = color.new(color.green, 30))
plot(upper3, "Upper 3×ATR", color = color.new(color.green, 60))
plot(lower1, "Lower 1×ATR", color = color.new(color.red, 0))
plot(lower2, "Lower 2×ATR", color = color.new(color.red, 30))
plot(lower3, "Lower 3×ATR", color = color.new(color.red, 60))
// ——— 可选:在当前 K 线上标记数值,方便你肉眼对比 ———
showDebug = input.bool(false, "Show Debug Labels (for checking value vs position)")
if showDebug
var label lb = na
if barstate.islast
label.delete(lb)
txt = "EMA: " + str.tostring(ema, format.mintick) + "\n" +
"U1: " + str.tostring(upper1, format.mintick) + "\n" +
"U2: " + str.tostring(upper2, format.mintick) + "\n" +
"U3: " + str.tostring(upper3, format.mintick)
lb := label.new(bar_index, upper1, txt, style = label.style_label_right, textcolor = color.white, color = color.new(color.black, 40))

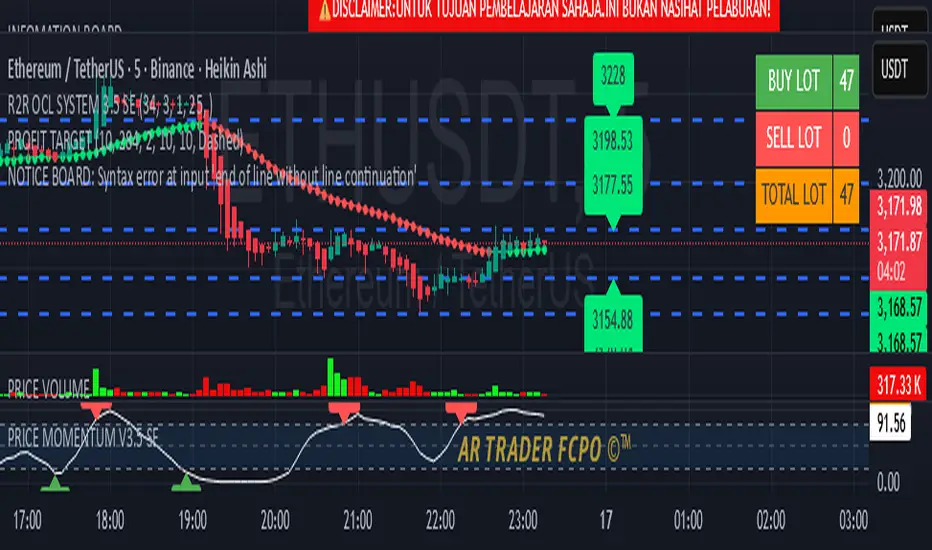
INFOMATION BOARD5-Line Indicator Description (English)This indicator displays a dynamic information board directly on the chart.It features a bright red background with bold white text for maximum visibility.The message can blink at adjustable speeds to attract user attention.Users may customize text size and vertical screen placement.Designed for alerts, warnings, or educational disclaimers without cluttering the chart
RSI MTF 15m + 1h (Oriol)//@version=5
indicator("RSI MTF 15m + 1h (Oriol)", overlay = false, timeframe = "", timeframe_gaps = true)
// ─── PARÀMETRES ─────────────────────────────────────────────
rsiLength = input.int(14, "Període RSI")
src = input.source(close, "Font de preu")
tfFast = input.timeframe("15", "Timeframe ràpid (RSI 15m)")
tfSlow = input.timeframe("60", "Timeframe lent (RSI 1h)")
showSignals = input.bool(true, "Mostrar senyals LONG/SHORT")
// ─── RSI MULTITIMEFRAME ────────────────────────────────────
// RSI del timeframe ràpid (per defecte 15m)
src_fast = request.security(syminfo.tickerid, tfFast, src)
rsi_fast = ta.rsi(src_fast, rsiLength)
// RSI del timeframe lent (per defecte 1h)
src_slow = request.security(syminfo.tickerid, tfSlow, src)
rsi_slow = ta.rsi(src_slow, rsiLength)
// ─── DIBUIX RSI ─────────────────────────────────────────────
plot(rsi_fast, title = "RSI ràpid (15m)", color = color.new(color.aqua, 0), linewidth = 2)
plot(rsi_slow, title = "RSI lent (1h)", color = color.new(color.orange, 0), linewidth = 2)
hline(70, "Sobrecomprat", color = color.new(color.red, 70), linestyle = hline.style_dashed)
hline(30, "Sobrevenut", color = color.new(color.lime, 70), linestyle = hline.style_dashed)
hline(50, "Mitja", color = color.new(color.gray, 80))
// ─── CONDICIONS D’EXEMPLE ───────────────────────────────────
// LONG: RSI 1h < 40 i RSI 15m creua cap amunt 30
// SHORT: RSI 1h > 60 i RSI 15m creua cap avall 70
longCond = (rsi_slow < 40) and ta.crossover(rsi_fast, 30)
shortCond = (rsi_slow > 60) and ta.crossunder(rsi_fast, 70)
// ─── SENYALS (SENSE SCOPE LOCAL) ────────────────────────────
plotshape(showSignals and longCond,
title = "Possible LONG",
style = shape.triangleup,
location = location.bottom,
color = color.new(color.lime, 0),
size = size.small,
text = "LONG")
plotshape(showSignals and shortCond,
title = "Possible SHORT",
style = shape.triangledown,
location = location.top,
color = color.new(color.red, 0),
size = size.small,
text = "SHORT")
// ─── ALERTES ────────────────────────────────────────────────
alertcondition(longCond, title = "Senyals LONG RSI 15m+1h",
message = "Condició LONG RSI 15m + 1h complerta")
alertcondition(shortCond, title = "Senyals SHORT RSI 15m+1h",
message = "Condició SHORT RSI 15m + 1h complerta")

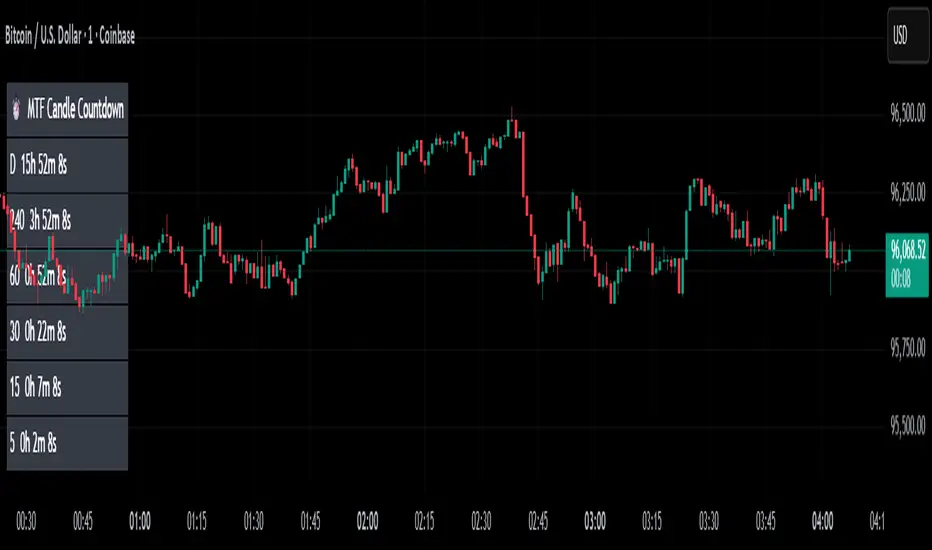
MTF Candle Countdown — HUD V1 (By Price-Action-Art)
MTF Candle Countdown — HUD V1 (By Price-Action-Art)
A clean, lightweight HUD that shows you exactly how much time is left in multiple higher-timeframe candles — all in one place.
This tool is designed for traders who rely on multi-timeframe precision.
Instead of constantly switching charts or checking timers, the HUD gives you a real-time countdown for up to six timeframes (Daily, 4H, 1H, 30m, 15m, 5m by default).
You can fully customize the timeframes, text size, and HUD position on your chart.
Perfect for:
Intraday and scalping timing
Swing traders waiting for HTF candle closes
ICT / SMC structure-based traders
Anyone who needs exact candle close timing without distractions
Features:
Real-time multi-timeframe candle countdown
Fully adjustable HUD placement (all corners)
Customizable timeframes and text size
Clean, minimal, and non-intrusive design
Updates only on the last bar for performance efficiency
Optional border for a sharper HUD look
Whether you’re waiting for a Daily close to confirm structure or timing your entries around 5m/15m candles, this HUD keeps everything visible and precise at a glance.
If you find this tool helpful, feel free to like, comment, and follow — it motivates me to keep releasing more tools for the community.
5m FVGs Lorem Ipsum is simply dummy text of the printing and typesetting industry. Lorem Ipsum has been the industry's standard dummy text ever since the 1500s, when an unknown printer took a galley of type and scrambled it to make a type specimen book. It has survived not only five centuries, but also the leap into electronic typesetting, remaining essentially unchanged. It was popularised in the 1960s with the release of Letraset sheets containing Lorem Ipsum passages, and more recently with desktop publishing software like Aldus PageMaker including versions of Lorem Ipsum.

[Statistics] killzone SFPSFP Statistics (ICT Sessions)
This indicator automatically finds and draws the high and low of the Asia, London, and New York trading sessions. It then hunts for Swing Failure Patterns (SFPs) that sweep these key session levels.
The main purpose of this script is to gather statistics on when these high-probability SFPs occur, allowing you to map out and identify the times of day when they are most frequent.
How to Use This Indicator
Set Your SFP Timeframe: In the settings, choose the timeframe you want to hunt for SFPs on (e.g., 1H, 15m). Important: You must also set your main chart to this exact same timeframe for the statistics to be collected correctly.
Define Your Sessions: Go to the "Session Definitions" tab.
Set the Global Timezone to your preferred trading timezone (e.g., "America/New_York"). This controls all session times and table times.
Adjust the start and end times for Asia, London, and NY AM sessions.
You can turn off sessions you don't want to track (like NY Lunch or NY PM).
You can also change the colors and text style for the session boxes here.
Set Confirmation Bars: In "SFP Engine Settings," the "Confirmation Bars" (default is 2) defines how many bars must close after the SFP bar without invalidating the level. An SFP is only "confirmed" and drawn after this period.
0 = Confirms immediately on the SFP candle's close.
2 = Confirms 2 bars after the SFP candle's close.
Read the Statistics: The "Custom SFP Statistics" table will appear on your chart. This table logs every confirmed SFP and tells you:
Which time of day they happen most.
How many were Bearish (swept a high) vs. Bullish (swept a low).
It's set by default to show the "Top 20" most frequent times, sorted chronologically.
Filter Your Chart (Optional): If your chart feels cluttered, go to "Visual Time Filter" and turn it ON.
Set a time window (e.g., "09:30-11:00").
The indicator will now only draw SFP signals that occurred within that specific time window. This is perfect for focusing on a single killzone.
How to Set Up Alerts
You can set up server-side alerts to be notified every time a new SFP is confirmed.
Check the "Enable SFP Alerts" box at the top of the indicator's settings.
Click the "Alert" button (alarm clock icon) on the TradingView toolbar.
In the "Condition" dropdown, select "SFP Statistics (ICT Sessions)".
In the second dropdown, choose "Any alert() function call".
Most Important Step: In the "Message" box, delete any default text and type in this exact placeholder:
{{alert_message}}
Set the trigger to "Once Per Bar Close".
Click "Create".
How Alerts Work (Triggers & Filtering)
Trigger: Alerts are tied to the confirmed signal. An alert will only fire after your "Confirmation Bars" have passed and the SFP is locked in. This prevents you from getting alerts on fake-outs.
Alert Filtering: The alerts are linked to the "Visual Time Filter". If you turn on the Visual Time Filter (e.g., to 09:30-11:00), you will only receive alerts for SFPs that are confirmed within that time window. If an SFP happens at 14:00, the script will ignore it, it will not be drawn, and it will not send you an alert. This allows you to get alerts only for the session you are actively trading.
Note: This is a first draft of this indicator. I will continue to work on it and improve it over time, as it may still contain small bugs.
Acknowledgements:
A big thank you to TFO (tradeforopp). The session detection logic and the visual style for the session boxes were adapted from his excellent "ICT Killzones & Pivots " indicator.

Current State: Overbought/Oversold + Trend KAPIL GOYALThis Pine Script calculates the RSI (Relative Strength Index) and compares it against preset thresholds to classify the market as Deep/Moderate/Mild Oversold or Deep/Moderate/Mild Overbought. It also checks whether the current price is above or below the 50-day moving average to define the trend as Uptrend or Downtrend. The script then combines both signals into one clean, real-time text output—like “Moderate Oversold + Uptrend”—displayed in a small table at the chart corner. It’s designed to give a quick, clutter-free snapshot of the current market state without plotting multiple indicators.
How to use:
Apply this indicator to any chart (e.g., Tesla on TradingView). It will show one line of text describing the current condition based on RSI and trend. Use it for quick decision cues:
“Oversold + Uptrend” suggests potential accumulation or rebound zones.
“Overbought + Downtrend” warns of exhaustion or profit-taking zones.
Combine it with your entry/exit strategy—like your 30DMA/50DMA rule or momentum filters—to confirm timing rather than act alone.

Anchored ATH Drawdown LevelsThe Anchored ATH Drawdown Levels plots horizontal lines from a chosen anchor price (ATH), showing potential pullback zones at set percentage drops below it.
This indicator's use lies in its anchored ATH framework, which rapidly visualizes precise drawdown levels as dynamic levels of interest or price targets enabling traders to anticipate pullback depths and potential reversal levels without manual calculations.
Pick "True ATH" for the all-time high or "Period ATH" for anchored highs reset weekly, monthly, or quarterly. Lines stretch right for a cleaner visual.
Key Features
Anchoring: True ATH (lifetime max) or Period ATH (resets on 1W/1M/3M intervals).
Drawdown Levels: 8 adjustable levels (defaults: -5%, -10%, -15%, -20% on; -25% to -50% off). Toggle each, set drop % (0.1-99.9), pick color, style (solid/dashed/dotted), width (1-3).
ATH Line: Optional ATH line with custom color, style, width.
Unified Look: Global overrides for all levels' color, style, width.
Labels: Show % drops (with/without prices) via text boxes or full tags; sizes from tiny to large.
Projection: Lines extend 5-100 bars right (default 20).
Settings
Anchor: Mode and timeframe.
Display: Toggle levels/ATH, set extension.
Labels: Style (text/full/none), size, price display.
Global/ATH/Levels: Colors, styles, widths (per-level or shared).
How to Use
Load on chart (overlays prices; handles up to 500 lines).
Choose anchor for your high.
Tune levels for key pullbacks (e.g., -5% minor, -20% major).
Customize visuals where the lines update on new peaks.

SevenDayHighLowTableWithBoxes [CHE]SevenDayHighLowTableWithBoxes — Seven-day day-range boxes with a weekday-aware “ghost” projection and a compact table that tracks recent extremes and per-weekday hit rates.
Summary
This indicator visualizes each trading day as a colored box and annotates the final high and low with compact markers. It maintains a rolling seven-day view and a five-column table showing day name, high, low, range, and a per-weekday projection hit statistic. A dashed “ghost” box projects a typical range for the current weekday using a running average and an adjustable scaling factor. The script is written in Pine v6, runs on the main chart (overlay true), and emphasizes stable object handling and closed-bar finalization at day boundaries.
Motivation: Why this design?
Intraday traders often need fast context for where today’s price sits relative to recent daily extremes, without switching timeframes. A simple daily high/low overlay is informative but lacks structure, sizing context, and continuity. By grouping bars into local days (configurable UTC offset), drawing explicit boxes, and projecting a weekday-typical range, the chart becomes easier to scan. The compact table gives a quick audit trail of the latest seven days while tracking how often the weekday projection would have covered the realized range.
What’s different vs. standard approaches?
Reference baseline: Plain daily high/low lines or session boxes without context.
Architecture differences:
Weekday-tinted boxes and labels for today plus up to six prior days.
Weekday average range drives a dashed projection (“ghost”) sized by a user-defined percentage.
Per-weekday hit statistics recorded as hits over totals and displayed in the table.
ATR-based vertical offsets keep labels readable.
Live updates intraday; state is finalized at the local day switch.
Practical effect: The chart shows where current price sits inside a known daily envelope, plus how “typical” the day’s movement is for this weekday, aiding expectations and planning.
How it works (technical)
The script computes a local daily timestamp using the user’s UTC offset. A day change finalizes the prior day, writes its high, low, start and end indices, and records the bar indices of the terminal high and low.
For each weekday, it maintains a running average of realized ranges with a cap on the lookback count. The ghost projection length is the weekday average scaled by the user’s percentage setting.
Anchor selection for the ghost uses the most recent extreme and the close relative to the intraday midpoint to choose a low-anchored or high-anchored box.
A five-column table (Day, High, Low, Range, Ghost OK) is refreshed on the last bar. The “Ghost OK” column shows per-weekday cumulative hits over totals with a percentage, calculated before including the just-finished day.
Object counts are bounded to seven days by pruning arrays and deleting old boxes and labels. Visual updates for historical objects occur on the last bar to minimize overhead. No `security()` calls are used.
Parameter Guide
UTC (+/−) — Controls local day boundaries — Default: minus five hours — Set to your venue’s local time.
Session (for Time gate) — Session string — Default: full week — (Optional) computed internally; not applied to gating.
Show 7-Day High/Low Table — Toggles the table — Default: true — Disable to reduce UI load.
Show Day Boxes in Chart — Toggles day boxes — Default: true — Disable for a cleaner chart.
Table Position — Nine-point anchor — Default: Middle Right — Move to avoid overlap.
Table Background / Text Color / Min Cell Width — Styling controls — Defaults: gray background, white text, width twelve characters.
Weekday Colors (Sun…Sat) — Row and box tints — Defaults: semi-transparent hues — Adjust for your theme.
Triangle Transparency — Marker opacity — Default: zero — Increase to fade high/low dots.
Day Label Transparency — Day name opacity — Default: zero — Increase to reduce emphasis.
Box Border Width — Box stroke width — Default: one — Increase for stronger edges.
Extend Boxes Right — Extend current box — Default: false — Useful for forward planning.
Show Average Range Ghost Box — Dashed projection — Default: true — Disable if distracting.
Ghost Border Color / Width — Ghost styling — Defaults: gray, width one.
Ghost Length percent of AvgRange — Projection scale — Default: one hundred; bounds zero to five hundred — Lower to be conservative.
Max History Days for Average — Cap per-weekday averaging — Default: two hundred fifty-two; bounds thirty to five hundred.
ATR Length / Day Label ATR Multiplier / Triangle Up ATR Multiplier / Triangle Down ATR Multiplier — Offsets for label placement — Defaults: length one hundred; multipliers zero — Increase on dense instruments to prevent overlap.
Reading & Interpretation
Day boxes: The filled rectangle marks each day’s full high-low span; color encodes the weekday.
Markers: Small dots near the terminal high and low highlight where the final extremes occurred.
Ghost box: A dashed box sized by the weekday average range, anchored based on recent behavior. It is a typical span, not a target.
Table: Row one shows “Today”. Rows below list up to six prior days. “Ghost OK” shows per-weekday cumulative hits over totals with a percentage, which reflects historical coverage quality for that weekday.
Practical Workflows & Combinations
Trend following: Use the current box plus recent boxes to read expansion or compression days; combine with basic structure such as higher-highs and higher-lows or lower-lows and lower-highs for confirmation.
Exits and risk: When price nears the ghost boundary late in the session, consider managing exposure more conservatively.
Multi-asset and multi-timeframe: Works on minute charts. As a starting point, use five to less than sixty minutes. For cross-checks, pair with a higher timeframe bias filter.
Behavior, Constraints & Performance
Repaint/confirmation: The indicator updates intraday; extremes and ghost position can move while the day is open. Values are finalized on the next local day start.
HTF/security: None used; repaint risk is limited to live-bar movement.
Resources: `max_bars_back` five thousand; arrays are pruned to seven days; the table and color sync run on the last bar; the live ghost updates only in real time.
Known limits: Weekday averages can be unrepresentative during regime shifts, events, or gaps. Day boundaries depend on the UTC offset being set correctly. No alerts are included. The script displays warning labels when the timeframe is below five minutes or at sixty minutes and above.
Sensible Defaults & Quick Tuning
Start with the defaults.
Ghost too aggressive: Lower the percent scale.
Labels overlap: Increase ATR multipliers.
Clutter or performance issues: Hide the table or boxes, or disable the ghost.
Day boundary misaligned: Adjust the UTC offset to your market.
What this indicator is—and isn’t
This is a visualization and context layer for daily extremes and a weekday-based typical span. It does not predict direction, does not manage orders, and is not a complete trading system. Use it alongside market structure, risk controls, and position management.
Disclaimer
The content provided, including all code and materials, is strictly for educational and informational purposes only. It is not intended as, and should not be interpreted as, financial advice, a recommendation to buy or sell any financial instrument, or an offer of any financial product or service. All strategies, tools, and examples discussed are provided for illustrative purposes to demonstrate coding techniques and the functionality of Pine Script within a trading context.
Any results from strategies or tools provided are hypothetical, and past performance is not indicative of future results. Trading and investing involve high risk, including the potential loss of principal, and may not be suitable for all individuals. Before making any trading decisions, please consult with a qualified financial professional to understand the risks involved.
By using this script, you acknowledge and agree that any trading decisions are made solely at your discretion and risk.
Do not use this indicator on Heikin-Ashi, Renko, Kagi, Point-and-Figure, or Range charts, as these chart types can produce unrealistic results for signal markers and alerts.
Best regards and happy trading
Chervolino

Smart Money Flow Index (SMFI) - Advanced SMC [PhenLabs]📊Smart Money Flow Index (SMFI)
Version: PineScript™v6
📌Description
The Smart Money Flow Index (SMFI) is an advanced Smart Money Concepts implementation that tracks institutional trading behavior through multi-dimensional analysis. This comprehensive indicator combines volume-validated Order Block detection, Fair Value Gap identification with auto-mitigation tracking, dynamic Liquidity Zone mapping, and Break of Structure/Change of Character detection into a unified system.
Unlike basic SMC indicators, SMFI employs a proprietary scoring algorithm that weighs five critical factors: Order Block strength (validated by volume), Fair Value Gap size and recency, proximity to Liquidity Zones, market structure alignment (BOS/CHoCH), and multi-timeframe confluence. This produces a Smart Money Score (0-100) where readings above 70 represent optimal institutional setup conditions.
🚀Points of Innovation
Volume-Validated Order Block Detection – Only displays Order Blocks when formation candle exceeds customizable volume multiplier (default 1.5x average), filtering weak zones and highlighting true institutional accumulation/distribution
Auto-Mitigation Tracking System – Fair Value Gaps and Order Blocks automatically update status when price mitigates them, with visual distinction between active and filled zones preventing trades on dead levels
Proprietary Smart Money Score Algorithm – Combines weighted factors (OB strength 25%, FVG proximity 20%, Liquidity 20%, Structure 20%, MTF 15%) into single 0-100 confidence rating updating in real-time
ATR-Based Adaptive Calculations – All distance measurements use 14-period Average True Range ensuring consistent function across any instrument, timeframe, or volatility regime without manual recalibration
Dynamic Age Filtering – Automatically removes liquidity levels and FVGs older than configurable thresholds preventing chart clutter while maintaining relevant levels
Multi-Timeframe Confluence Integration – Analyzes higher timeframe bias with customizable multipliers (2-10x) and incorporates HTF trend direction into Smart Money Score for institutional alignment
🔧Core Components
Order Block Engine – Detects institutional supply/demand zones using characteristic patterns (down-move-then-strong-up for bullish, up-move-then-strong-down for bearish) with minimum volume threshold validation, tracks mitigation when price closes through zones
Fair Value Gap Scanner – Identifies price imbalances where current candle's low/high leaves gap with two-candle-prior high/low, filters by minimum size percentage, monitors 50% fill for mitigation status
Liquidity Zone Mapper – Uses pivot high/low detection with configurable lookback to mark swing points where stop losses cluster, extends horizontal lines to visualize sweep targets, manages lifecycle through age-based removal
Market Structure Analyzer – Tracks pivot progression to identify trend through higher-highs/higher-lows (bullish) or lower-highs/lower-lows (bearish), detects Break of Structure and Change of Character for trend/reversal confirmation
Scoring Calculation Engine – Evaluates proximity to nearest Order Blocks using ATR-normalized distance, assesses FVG recency and distance, calculates liquidity proximity with age weighting, combines structure bias and MTF trend into smoothed final score
🔥Key Features
Customizable Display Limits – Control maximum Order Blocks (1-10), Liquidity Zones (1-10), and FVG age (10-200 bars) to maintain clean charts focused on most relevant institutional levels
Gradient Strength Visualization – All zones render with transparency-adjustable coloring where stronger/newer zones appear more solid and weaker/older zones fade progressively providing instant visual hierarchy
Educational Label System – Optional labels identify each zone type (Bullish OB, Bearish OB, Bullish FVG, Bearish FVG, BOS) with color-coded text helping traders learn SMC concepts through practical application
Real-Time Smart Money Score Dashboard – Top-right table displays current score (0-100) with color coding (green >70, yellow 30-70, red <30) plus trend arrow for at-a-glance confidence assessment
Comprehensive Alert Suite – Configurable notifications for Order Block formation, Fair Value Gap detection, Break of Structure events, Change of Character signals, and high Smart Money Score readings (>70)
Buy/Sell Signal Integration – Automatically plots triangle markers when Smart Money Score exceeds 70 with aligned market structure and fresh Order Block detection providing clear entry signals
🎨Visualization
Order Block Boxes – Shaded rectangles extend from formation bar spanning high-to-low of institutional candle, bullish zones in green, bearish in red, with customizable transparency (80-98%)
Fair Value Gap Zones – Rectangular areas marking imbalances, active FVGs display in bright colors with adjustable transparency, mitigated FVGs switch to gray preventing trades on filled zones
Liquidity Level Lines – Dashed horizontal lines extend from pivot creation points, swing highs in bearish color (short targets above), swing lows in bullish color (long targets below), opacity decreases with age
Structure Labels – "BOS" labels appear above/below price when Break of Structure confirmed, colored by direction (green bullish, red bearish), positioned at 1% beyond highs/lows for visibility
Educational Info Panel – Bottom-right table explains key terminology (OB, FVG, BOS, CHoCH) and score interpretation (>70 high probability) with semi-transparent background for readability
📖Usage Guidelines
General Settings
Show Order Blocks – Default: On, toggles visibility of institutional supply/demand zones, disable when focusing solely on FVGs or Liquidity
Show Fair Value Gaps – Default: On, controls FVG zone display including active and mitigated imbalances
Show Liquidity Zones – Default: On, manages liquidity line visibility, disable on lower timeframes to reduce clutter
Show Market Structure – Default: On, toggles BOS/CHoCH label display
Show Smart Money Score – Default: On, controls score dashboard visibility
Order Block Settings
OB Lookback Period – Default: 20, Range: 5-100, controls bars scanned for Order Block patterns, lower values detect recent activity, higher values find older blocks
Min Volume Multiplier – Default: 1.5, Range: 1.0-5.0, sets minimum volume threshold as multiple of 20-period average, higher values (2.0+) filter for strongest institutional candles
Max Order Blocks to Display – Default: 3, Range: 1-10, limits simultaneous Order Blocks shown, lower settings (1-3) maintain focus on most recent zones
Fair Value Gap Settings
Min FVG Size (%) – Default: 0.3, Range: 0.1-2.0, defines minimum gap size as percentage of close price, lower values detect micro-imbalances, higher values focus on significant gaps
Max FVG Age (bars) – Default: 50, Range: 10-200, removes FVGs older than specified bars, lower settings (10-30) for scalping, higher (100-200) for swing trading
Show FVG Mitigation – Default: On, displays filled FVGs in gray providing visual history, disable to show only active untouched imbalances
Liquidity Zone Settings
Liquidity Lookback – Default: 50, Range: 20-200, sets pivot detection period for swing highs/lows, lower values (20-50) mark shorter-term liquidity, higher (100-200) identify major swings
Max Liquidity Age (bars) – Default: 100, Range: 20-500, removes liquidity lines older than specified bars, adjust based on timeframe
Liquidity Sensitivity – Default: 0.5, Range: 0.1-1.0, controls pivot detection sensitivity, lower values mark only major swings, higher values identify minor swings
Max Liquidity Zones to Display – Default: 3, Range: 1-10, limits total liquidity levels shown maintaining chart clarity
Market Structure Settings
Pivot Length – Default: 5, Range: 3-15, defines bars to left/right for pivot validation, lower values (3-5) create sensitive structure breaks, higher (10-15) filter for major shifts
Min Structure Move (%) – Default: 1.0, Range: 0.1-5.0, sets minimum percentage move required between pivots to confirm structure change
Multi-Timeframe Settings
Enable MTF Analysis – Default: On, activates higher timeframe trend analysis incorporation into Smart Money Score
Higher Timeframe Multiplier – Default: 4, Range: 2-10, multiplies current timeframe to determine analysis timeframe (4x on 15min = 1hour)
Visual Settings
Bullish Color – Default: Green (#089981), sets color for bullish Order Blocks, FVGs, and structure elements
Bearish Color – Default: Red (#f23645), defines color for bearish elements
Neutral Color – Default: Gray (#787b86), controls color of mitigated zones and neutral elements
Show Educational Labels – Default: On, displays text labels on zones identifying type (OB, FVG, BOS), disable once familiar with patterns
Order Block Transparency – Default: 92, Range: 80-98, controls Order Block box transparency
FVG Transparency – Default: 92, Range: 80-98, sets Fair Value Gap zone transparency independently from Order Blocks
Alert Settings
Alert on Order Block Formation – Default: On, triggers notification when new volume-validated Order Block detected
Alert on FVG Formation – Default: On, sends alert when Fair Value Gap appears enabling quick response to imbalances
Alert on Break of Structure – Default: On, notifies when BOS or CHoCH confirmed
Alert on High Smart Money Score – Default: On, alerts when Smart Money Score crosses above 70 threshold indicating high-probability setup
✅Best Use Cases
Order Block Retest Entries – After Break of Structure, wait for price retrace into fresh bullish Order Block with Smart Money Score >70, enter long on zone reaction targeting next liquidity level
Fair Value Gap Retracement Trading – When price creates FVG during strong move then retraces, enter as price approaches unfilled gap expecting institutional orders to continue trend
Liquidity Sweep Reversals – Monitor price approaching swing high/low liquidity zones against prevailing Smart Money Score trend, after stop hunt sweep watch for rejection into premium Order Block/FVG
Multi-Timeframe Confluence Setups – Identify alignment when current timeframe Order Block coincides with higher timeframe FVG plus MTF analysis showing matching trend bias
Break of Structure Continuations – After BOS confirms trend direction, trade pullbacks to nearest Order Block or FVG in direction of structure break using Smart Money Score >70 as entry filter
Change of Character Reversal Plays – When CHoCH detected indicating potential reversal, look for Smart Money Score pivot with opposing Order Block formation then enter on structure confirmation
⚠️Limitations
Lagging Pivot Calculations – Pivot-based features (Liquidity Zones, Market Structure) require bars to right of pivot for confirmation, meaning these elements identify levels retrospectively with delay equal to lookback period
Whipsaw in Ranging Markets – During choppy conditions, Order Blocks fail frequently and structure breaks produce false signals as Smart Money Score fluctuates without clear institutional bias, best used in trending markets
Volume Data Dependency – Order Block volume validation requires accurate volume data which may be incomplete on Forex pairs or limited in crypto exchange feeds
Subjectivity in Scoring Weights – Proprietary 25-20-20-20-15 weighting reflects general institutional behavior but may not optimize for specific instruments or market regimes, user cannot adjust factor weights
Visual Complexity on Lower Timeframes – Sub-hour timeframes generate excessive zones creating cluttered charts, requires aggressive display limit reduction and higher minimum thresholds
No Fundamental Integration – Indicator analyzes purely technical price action and volume without incorporating economic events, news catalysts, or fundamental shifts that override technical levels
💡What Makes This Unique
Unified SMC Ecosystem – Unlike indicators displaying Order Blocks OR FVGs OR Liquidity separately, SMFI combines all three institutional concepts plus market structure into single cohesive system
Proprietary Confidence Scoring – Rather than manual setup assessment, automated Smart Money Score quantifies probability by weighting five institutional dimensions into actionable 0-100 rating
Volume-Filtered Quality – Eliminates weak Order Blocks forming without institutional volume confirmation, ensuring displayed zones represent genuine accumulation/distribution
Adaptive Lifecycle Management – Automatically updates mitigation status and removes aged zones preventing trades on dead levels through continuous validity and age monitoring
Educational Integration – Built-in tooltips, labeled zones, and reference panel make indicator functional for both learning Smart Money Concepts and executing strategies
🔬How It Works
Order Block Detection – Scans for patterns where strong directional move follows counter-move creating last down-candle before rally (bullish OB) or last up-candle before sell-off (bearish OB), validates formations only when candle exhibits volume exceeding configurable multiple (default 1.5x) of 20-bar average volume
Fair Value Gap Identification – Compares current candle’s high/low against two-candles-prior low/high to detect price imbalances, calculates gap size as percentage of close and filters micro-gaps below minimum threshold (default 0.3%), monitors whether subsequent price fills 50% triggering mitigation status
Liquidity Zone Mapping – Employs pivot detection using configurable lookback (default 50 bars) to identify swing highs/lows where retail stops cluster, extends horizontal reference lines from pivot creation and applies age-based filtering to remove stale zones
Market Structure Analysis – Tracks pivot progression using structure-specific lookback (default 5 bars) to determine trend, confirms uptrend when new pivot high exceeds previous by minimum move percentage, detects Break of Structure when price breaks recent pivot level, flags Change of Character for potential reversals
Multi-Timeframe Confluence – When enabled, requests security data from higher timeframe (current TF × HTF multiplier, default 4x), compares HTF close against HTF 20-period MA to determine bias, contributes ±50 points to score ensuring alignment with institutional positioning on superior timeframe
Smart Money Score Calculation – Evaluates Order Block component via ATR-normalized distance producing max 100-point contribution weighted at 25%, assesses FVG factor through age penalty and distance at 20% weight, calculates Liquidity proximity at 20%, incorporates structure bias (±50-100 points) at 20%, adds MTF component at 15%, applies 3-period smoothing to reduce volatility
Visual Rendering and Lifecycle – Draws Order Block boxes, Fair Value Gap rectangles with color coding (green/red active, gray mitigated), extends liquidity dashed lines with fade-by-age opacity, plots BOS labels, displays Smart Money Score dashboard, continuously updates checking mitigation conditions and removing elements exceeding age/display limits
💡Note:
The Smart Money Flow Index combines multiple Smart Money Concepts into unified institutional order flow analysis. For optimal results, use the Smart Money Score as confluence filter rather than standalone entry signal – scores above 70 indicate high-probability setups but should be combined with risk management, higher timeframe bias, and market regime understanding.

NQ YM Correlogram Meter TypeOverview
This indicator provides a real-time, visual "meter" of the correlation between the Nasdaq 100 (NQ) and the Dow Jones (YM) futures. It is designed as a clean, non-intrusive dashboard panel that displays only the current correlation value, making it an ideal companion for pairs traders who need to see the live relationship at a glance.
Unlike a traditional oscillator that plots historical data, this tool focuses exclusively on the "right now" to aid in immediate trade decisions.
Key Features
Real-Time Correlation Meter: A single vertical bar displays the current correlation, visually mapping the -1.0 to +1.0 range.
Clear Visual Cues: The bar's color gradient (from red for negative correlation to green for positive correlation) and fill level provide an instant understanding of the market relationship.
Precise Value Display: The exact numerical correlation (e.g., 0.85 or -0.50) is shown clearly at the bottom of the meter.
Contextual Y-Axis: Static labels (+1.0, +0.5, 0.0, -0.5) provide quick reference points for the meter's reading.
Dashboard Panel: Renders cleanly as an overlay table on the right side of your chart, saving screen real estate.
How to Use
This indicator is best used as a confirmation tool alongside a primary pairs trading strategy or a historical correlation oscillator.
High Green Bar (near +1.0): Indicates a strong positive correlation. NQ and YM are moving in sync.
Bar near 0.0: Indicates little to no linear relationship.
Low Red Bar (near -1.0): Indicates a strong negative (inverse) correlation. NQ and YM are moving in opposite directions.
For a pairs trader, this meter provides an instant check to confirm if the two assets are in their expected state of correlation at the moment of execution.
Settings & Customization
Correlation Period: Set the lookback length for the correlation calculation.
Symbols: Fully customizable, though it defaults to YM1! and NQ1!.
Panel Appearance: Adjust the Table Size (Small/Large) and Chart Theme (Light/Dark).
Text Size: Independently control the font size for the numerical Value Text and the Y-Axis Labels to perfectly fit your display.

Structure Pro by MurshidfxInspired by the 'mentfx Structure' indicator created by Anton (mentfx) on TradingView,
## Overview
Structure Pro tracks market structure by maintaining an adaptive dealing range and its midpoint. Swing highs and lows become structural boundaries, and the script responds to confirmed breakouts by recalculating the active range. Labels highlight the latest trend flip so the chart stays readable while the range evolves.
## Core Logic
- Detects swing highs/lows using a configurable pivot strength and promotes confirmed pivots to structural levels.
- Applies a percentage buffer to decide when price truly breaks structure; once triggered, the opposite boundary is recalculated with an anchor search that looks back through historical bars.
- Computes equilibrium as the midpoint between the current structural high and low so you can gauge premium versus discount zones.
- Emits a single BULL or BEAR label when the trend state changes, keeping only the most recent signal on the chart.
## How to Use
1. Open a clean chart and apply only this script.
2. Select a swing strength that matches the scale you want to monitor (lower values for responsive intraday swings, higher values for broader moves).
3. Tune the structure sensitivity percentage if you prefer tighter or looser confirmation before declaring a breakout.
4. Track DRH/DRL for the current dealing range, use the equilibrium line as a mean-reversion guide, and look to the BULL/BEAR label for structure confirmation.
5. Combine the levels with your own execution, risk, and position rules—this script does not manage orders.
## Inputs
- Swing Point Strength: bars required on both sides to confirm a pivot.
- Structure Break Sensitivity: percentage buffer applied to the range before calling a breakout.
- Dealing Range display: toggles for visibility, line width/color, label text, and label size.
- Equilibrium display: line style, width, and color controls.
- Trend Signals: enable/disable labels, adjust text size, and pick label colors.
## Notes
- Designed for live structure tracking; the script relies on confirmed pivots and does not peek into future data.
- Built to be chart-agnostic for standard candles; non-standard chart types can distort the measurements.
- Published open-source so traders can review and verify the implementation details.

Time & Session Dividers### indicator Summary
This indicator is a powerful utility designed to help you visualize time-based market structure by drawing customizable vertical lines on your chart. It allows you to clearly mark the beginning of new timeframes (like hours, days, or weeks) and highlight specific trading sessions or time slots (like the London open or a news event).
It comes with **6 independent dividers** that you can configure to your exact needs:
* **3 Timeframe Dividers**
* **3 Custom Time Slot Dividers**
### Key Features
* **Timeframe Separators:** Set up to 3 different higher timeframes (e.g., 1H, 4H, 1D). The indicator will automatically draw a vertical line at the start of each new bar for that timeframe, helping you easily see hourly, daily, or weekly boundaries.
* **Custom Time Slots (Sessions):** Define up to 3 specific time windows (e.g., "09:30-16:00" for the New York session). The indicator will draw a line at the **start** of this session and another line at the **end**, allowing you to isolate specific periods of market activity.
* **Full Customization:** Each of the 6 dividers is fully independent and can be customized with:
* A simple toggle to turn it on or off.
* A unique color.
* A line style (Solid, Dotted, or Dashed).
* A toggle to show or hide its text label.
* **Smart Labels:** Labels for timeframe dividers display the timeframe (e.g., "4H"), while labels for time slots automatically format to show the precise start or end time (e.g., "09:30" and "16:00").
### How to Use
1. Add the "Timeframe Vertical Lines" indicator to your chart.
2. Open the indicator's **Settings** panel.
3. **To add a timeframe line (e.g., Daily):**
* Go to the "Timeframe Divider 1" group.
* Check the "Show Divider 1" box.
* Set the "Timeframe 1" to "1D".
* Adjust the color, style, and text visibility to your liking.
4. **To add a session line (e.g., London Session):**
* Go to the "Time Slot Divider 1" group.
* Check the "Show Time Slot Divider 1" box.
* Set the "Time Slot 1" to your desired session, e.g., "0800-1700".
* Adjust the color and style. The script will now draw lines at 08:00 and 17:00 (based on the chart's timezone).
5. Repeat the process using the other available divider slots to build a complete temporal map of your chart.

Sunmool's NY Lunch Model BacktestingICT NY Lunch Model Backtesting (12:00–13:00 NY) 🗽🍔
This research indicator tests an ICT narrative using the New York lunch window (12:00–13:00 America/New_York). It records that hour’s high/low and measures, during the post-lunch session (default 13:00–16:00), how often:
⬆️ If the afternoon trends up, the Lunch Low gets swept first.
⬇️ If the afternoon trends down, the Lunch High gets swept first.
It reports these as conditional probabilities, not trade signals. 📈
👀 What it shows
🟦 Lunch Range box (toggle): high/low from 12:00–13:00 NY
🔻🔺 Sweep signals (bar-anchored)
Low sweep: triangle below bar + optional “L”
High sweep: triangle above bar + optional “H”
🧱 Optional small box wrapping the swept candle
📊 Stats table (top-right)
P(L-swept | Up) — % of Up-days where Lunch Low was swept
P(H-swept | Down) — % of Down-days where Lunch High was swept
🔁 Contradictions + sample sizes (Up-days / Down-days)
🎯 Direction logic (Up/Down)
Anchor: 13:00 open (pmOpen) ⏰
Threshold: ATR × multiple or % from 13:00
Close ≥ pmOpen + threshold → Up-day
Close ≤ pmOpen − threshold → Down-day
Tiny moves under the threshold are ignored to reduce noise 🧹
⚙️ Inputs
🌐 Timezone: America/New_York (DST handled)
🍽️ Lunch window: 1200–1300
🕓 Post-lunch window: default 1300–1600 (try 17:00/20:00 for sensitivity)
📐 Trend threshold: ATR / Percent (with length/multiple or % level)
📅 Weekdays-only toggle (FX/Equities style)
👁️ Display toggles: Lunch box / sweep arrows / sweep text / sweep candle box / stats table
🔔 TF hint when chart TF > 15m
🧭 How to use
Use 5–15m charts for accurate lunch range capture.
Scroll ~1 year for meaningful samples.
Run sensitivity checks: vary ATR/% thresholds and the post-lunch end time.
For crypto, compare with vs without weekends. 🚀
🧠 Reading the results
High P(L-swept | Up) with a solid Up-day count ⇒ on up afternoons, lunch low is often swept.
High P(H-swept | Down) ⇒ on down afternoons, lunch high is often swept.
Lower Contradictions = cleaner tendency.
Remember: this is a probabilistic tendency, not a rule. 🎲
📝 Notes & limits
All markers (arrows, text, sweep boxes) are bar-anchored; the lunch range box is a research overlay you can toggle.
Real-time vs historical bar building can differ—interpret on bar close. 🔒

チャットGPTimport yfinance as yf
import pandas as pd
import requests
from bs4 import BeautifulSoup
# 株たんのスクリーニング結果URL(例:200日線以下)
url = "https://kabutan.jp/warning/?mode=3_1"
r = requests.get(url)
soup = BeautifulSoup(r.text, "html.parser")
# 銘柄コードと企業名を抽出
stocks =
for link in soup.select("td a "):
code = link .split('=')
name = link.text.strip()
if code.isdigit():
stocks.append({"code": code, "name": name})
results =
for stock in stocks : # ←テスト用に10銘柄まで
ticker = f"{stock }.T"
df = yf.download(ticker, period="1y", interval="1d")
# EMA200
df = df .ewm(span=200, adjust=False).mean()
below_ema200 = df .iloc < df .iloc
# 株たんの個別ページからPER・成長率を取得
stock_url = f"https://kabutan.jp/stock/?code={stock }"
res = requests.get(stock_url)
s = BeautifulSoup(res.text, "html.parser")
try:
per = s.find(text="PER").find_next("td").text
growth = s.find(text="売上高増減率").find_next("td").text
except:
per, growth = "N/A", "N/A"
results.append({
"銘柄コード": stock ,
"企業名": stock ,
"200EMA以下": below_ema200,
"PER": per,
"売上成長率": growth
})
# 結果をCSV出力
df_result = pd.DataFrame(results)
df_result.to_csv("割安EMA200以下銘柄.csv", index=False, encoding="utf-8-sig")
print(df_result)

Advanced Psychological Levels with Dynamic Spacing═══════════════════════════════════════
ADVANCED PSYCHOLOGICAL LEVELS WITH DYNAMIC SPACING
═══════════════════════════════════════
A comprehensive psychological price level indicator that automatically identifies and displays round number levels across multiple timeframes. Features dynamic ATR-based spacing, smart crypto detection, distance tracking, and customizable alert system.
───────────────────────────────────────
WHAT THIS INDICATOR DOES
───────────────────────────────────────
This indicator automatically draws psychological price levels (round numbers) that often act as support and resistance:
- Dynamic ATR-Based Spacing - Adapts level spacing to market volatility
- Multiple Level Types - Major (250 pip), Standard (100 pip), Mid, and Intraday levels
- Smart Asset Detection - Automatically adjusts for Forex, Crypto, Indices, and CFDs
- Crypto Price Adaptation - Intelligent level spacing based on cryptocurrency price magnitude
- Distance Information Table - Real-time percentage distance to nearest levels
- Combined Level Labels - Clear identification when multiple level types coincide
- Performance Optimized - Configurable visible range and label limits
- Comprehensive Alerts - Notifications when price crosses any level type
───────────────────────────────────────
HOW IT WORKS
───────────────────────────────────────
PSYCHOLOGICAL LEVELS CONCEPT:
Psychological levels are round numbers where traders tend to place orders, creating natural support and resistance zones. These include:
- Forex: 1.0000, 1.0100, 1.0050 (pips)
- Crypto: $100, $1,000, $10,000 (whole numbers)
- Indices: 10,000, 10,500, 11,000 (points)
Why They Matter:
- Traders naturally gravitate to round numbers
- Stop losses cluster at these levels
- Take profit orders concentrate here
- Institutional algorithmic trading often targets these levels
DYNAMIC ATR-BASED SPACING:
Traditional Method:
- Fixed spacing regardless of volatility
- May be too tight in volatile markets
- May be too wide in quiet markets
Dynamic Method (Recommended):
- Uses ATR (Average True Range) to measure volatility
- Automatically adjusts level spacing
- Tighter levels in low volatility
- Wider levels in high volatility
Calculation:
1. Calculate ATR over specified period (default: 14)
2. Multiply by ATR multiplier (default: 2.0)
3. Round to nearest psychological level
4. Generate levels at dynamic intervals
Benefits:
- Adapts to market conditions
- More relevant levels in all volatility regimes
- Reduces clutter in trending markets
- Provides more detail in ranging markets
LEVEL TYPES:
Major Levels (250 pip/point):
- Highest significance
- Primary support/resistance zones
- Color: Red (default)
- Style: Solid lines
- Spacing: 2.5x standard step
Standard Levels (100 pip/point):
- Secondary importance
- Common psychological barriers
- Color: Blue (default)
- Style: Dashed lines
- Spacing: Standard step
Mid Levels (50% between major):
- Optional intermediate levels
- Halfway between major levels
- Color: Gray (default)
- Style: Dotted lines
- Usage: Additional confluence points
Intraday Levels (sub-100 pip):
- For intraday traders
- Fine-grained precision
- Color: Yellow (default)
- Style: Dotted lines
- Only shown on intraday timeframes
SMART ASSET DETECTION:
Forex Pairs:
- Detects major currency pairs automatically
- Uses pip-based calculations
- Standard: 100 pips (0.0100)
- Major: 250 pips (0.0250)
- Intraday: 20, 50, 80 pip subdivisions
Cryptocurrencies:
- Automatic price magnitude detection
- Adaptive spacing based on price:
* Under $0.10: Levels at $0.01, $0.05
* $0.10-$1: Levels at $0.10, $0.50
* $1-$10: Levels at $1, $5
* $10-$100: Levels at $10, $50
* $100-$1,000: Levels at $100, $500
* $1,000-$10,000: Levels at $1,000, $5,000
* Over $10,000: Levels at $5,000, $10,000
Indices & CFDs:
- Fixed point-based system
- Major: 500 point intervals (with 250 sub-levels)
- Standard: 100 point intervals
- Suitable for stock indices like SPX, NASDAQ
COMBINED LEVEL LABELS:
When multiple level types coincide at the same price:
- Single line drawn (highest priority color)
- Combined label shows all types
- Priority: Major > Standard > Mid > Intraday
Example Label Formats:
- "1.1000 Major" - Major level only
- "1.1000 Std + Major" - Both standard and major
- "50000 Intra + Mid + Std" - Three levels coincide
Benefits:
- Cleaner chart appearance
- Clear identification of confluence
- Reduced visual clutter
- Easy to spot high-importance levels
DISTANCE INFORMATION TABLE:
Real-time tracking of nearest levels:
Table Contents:
- Nearest major level above (price and % distance)
- Nearest standard level above (price and % distance)
- Nearest standard level below (price and % distance)
Display:
- Top right corner (configurable)
- Color-coded by level type
- Real-time percentage calculations
- Helpful for position management
Usage:
- Identify proximity to key levels
- Set realistic profit targets
- Gauge potential move magnitude
- Monitor approaching resistance/support
ALERT SYSTEM:
Comprehensive crossing alerts:
Alert Types:
- Major Level Crosses
- Standard Level Crosses
- Intraday Level Crosses
Alert Modes:
- First Cross Only: Alert once when level is crossed
- All Crosses: Alert every time level is crossed
Alert Information:
- Level type crossed
- Specific price level
- Direction (above/below)
- One alert per bar to prevent spam
Configuration:
- Enable/disable by level type
- Choose alert frequency
- Customize for your trading style
───────────────────────────────────────
HOW TO USE
───────────────────────────────────────
INITIAL SETUP:
General Settings:
1. Enable "Use Dynamic ATR-Based Spacing" (recommended)
2. Set ATR Period (14 is standard)
3. Adjust ATR Multiplier (2.0 is balanced)
Visibility Settings:
1. Set Visible Range % (10% recommended for clarity)
2. Adjust Label Offset for readability
3. Configure performance limits if needed
Level Selection:
1. Enable/disable level types based on trading style
2. Adjust line counts for each type
3. Choose line styles and colors for visibility
TRADING STRATEGIES:
Breakout Trading:
1. Wait for price to approach major or standard level
2. Monitor for consolidation near level
3. Enter on confirmed break above/beyond level
4. Stop loss just beyond the broken level
5. Target: Next major or standard level
Rejection Trading:
1. Identify major psychological level
2. Wait for price to test the level
3. Look for rejection signals (wicks, bearish/bullish candles)
4. Enter in direction of rejection
5. Stop beyond the level
6. Target: Previous level or mid-level
Range Trading:
1. Identify range between two major levels
2. Buy at lower psychological level
3. Sell at upper psychological level
4. Use standard and mid-levels for position management
5. Exit if major level breaks with volume
Confluence Trading:
1. Look for combined levels (Std + Major)
2. These represent high-probability zones
3. Use as primary support/resistance
4. Increase position size at confluence
5. Expect stronger reactions at these levels
Session-Based Trading:
1. Note opening level at session start (Asian/London/NY)
2. Trade breakouts of major levels during high-volume sessions
3. London/NY sessions: More likely to break levels
4. Asian session: More likely to respect levels (range trading)
RISK MANAGEMENT WITH PSYCHOLOGICAL LEVELS:
Stop Loss Placement:
- Place stops just beyond psychological levels
- Add buffer (5-10 pips for forex)
- Avoid exact round numbers (stop hunting risk)
- Use previous major level as maximum stop
Take Profit Strategy:
- First target: Next standard level (partial profit)
- Second target: Next major level (remaining position)
- Trail stops to breakeven at first target
- Use distance table to calculate risk/reward
Position Sizing:
- Larger positions at major levels (higher probability)
- Smaller positions at intraday levels (lower probability)
- Scale in at standard levels between major levels
- Reduce size when multiple levels are close together
TIMEFRAME CONSIDERATIONS:
Higher Timeframes (4H, Daily, Weekly):
- Focus on Major and Standard levels only
- Disable Intraday and Mid levels
- Wider level spacing expected
- Use for swing trading and position trading
Lower Timeframes (5m, 15m, 1H):
- Enable all level types
- Use Intraday levels for precision
- Tighter level spacing acceptable
- Good for day trading and scalping
Multi-Timeframe Approach:
- Identify major levels on Daily/4H charts
- Refine entries using 15m/1H intraday levels
- Trade in direction of higher timeframe bias
- Use lower timeframe levels for position management
───────────────────────────────────────
CONFIGURATION GUIDE
───────────────────────────────────────
GENERAL SETTINGS:
Dynamic ATR-Based Spacing:
- Enabled: Recommended for most markets
- Disabled: Fixed psychological levels
- ATR Period: 14 (standard), 10 (responsive), 20 (smooth)
- ATR Multiplier: 1.0-5.0 (2.0 is balanced)
VISIBILITY SETTINGS:
Visible Range %:
- 5%: Very tight range, minimal clutter
- 10%: Balanced view (recommended)
- 20%: Wide range, more context
- 50%: Maximum range, all levels visible
Label Offset:
- 10-20 bars: Close to current price
- 30-50 bars: Moderate distance
- 50-100 bars: Far from price action
Performance Limits:
- Max Historical Bars: Reduce if indicator loads slowly
- Max Labels: Reduce for cleaner chart (20-30 recommended)
LEVEL CUSTOMIZATION:
Line Count:
- Lower (1-3): Cleaner chart, fewer levels
- Medium (4-6): Balanced view
- Higher (7-10): More context, busier chart
Line Styles:
- Solid: High importance, easy to see
- Dashed: Medium importance, clear but subtle
- Dotted: Low importance, minimal visual weight
Colors:
- Use contrasting colors for different level types
- Red/Blue/Yellow default works well
- Adjust based on chart background and personal preference
DISTANCE TABLE:
Position:
- Top Right: Doesn't interfere with price action
- Top Left: Good for right-side price scale
- Bottom positions: Less common but available
Colors:
- Default (white text, dark background) works for most charts
- Match your chart theme for consistency
- Ensure text is readable against background
ALERT CONFIGURATION:
Alert by Level Type:
- Major: Most important, fewer false signals
- Standard: Balance of frequency and importance
- Intraday: Many signals, best for active traders
Alert Frequency:
- First Cross Only: Cleaner, less noise (recommended for swing trading)
- All Crosses: Every touch, good for scalping
Alert Setup in TradingView:
1. Configure desired alert types in indicator settings
2. Right-click chart → Add Alert
3. Select this indicator
4. Choose "Any alert() function call"
5. Set delivery method (mobile, email, webhook)
───────────────────────────────────────
ASSET-SPECIFIC TIPS
───────────────────────────────────────
FOREX (EUR/USD, GBP/USD, etc.):
- Major levels at x.x000, x.x500
- Standard levels at x.xx00
- Intraday levels at 20/50/80 pips
- Most effective during London/NY sessions
- Watch for "figure" levels (1.0000, 1.1000)
CRYPTOCURRENCIES (BTC, ETH, etc.):
- Enable dynamic spacing for volatile markets
- Levels adjust automatically based on price
- Watch major $1,000 increments for BTC
- $100 levels important for ETH
- Smaller caps: Use standard levels
- High volatility: Increase ATR multiplier to 3.0
STOCK INDICES (SPX, NASDAQ, etc.):
- 100-point levels most important
- 500-point levels for major S/R
- 50-point mid-levels for refinement
- Watch end-of-day for level reactions
- Futures often lead spot on level breaks
GOLD/COMMODITIES:
- Major levels at $50 increments ($1,900, $1,950)
- Standard levels at $10 increments
- Very reactive to psychological levels
- Watch for false breaks during low volume
- Best reactions during active trading hours
───────────────────────────────────────
BEST PRACTICES
───────────────────────────────────────
Chart Setup:
- Use clean price action charts
- Avoid too many indicators
- Ensure psychological levels are clearly visible
- Match colors to your chart theme
Level Selection:
- Start with Major and Standard levels only
- Add Mid and Intraday as needed
- Less is more - avoid chart clutter
- Adjust based on timeframe
Combining with Other Tools:
- Volume profile for confluence
- Trendlines intersecting psychological levels
- Moving averages near round numbers
- Fibonacci levels coinciding with psychological levels
Common Mistakes to Avoid:
- Trading every level touch (be selective)
- Ignoring volume confirmation
- Setting stops exactly at levels (stop hunting)
- Forgetting to adjust for different assets
- Over-relying on levels without price action confirmation
Performance Optimization:
- Reduce visible range for faster loading
- Lower max historical bars on lower timeframes
- Limit labels to 30-50 for clarity
- Disable unused level types
───────────────────────────────────────
EDUCATIONAL DISCLAIMER
───────────────────────────────────────
This indicator identifies psychological price levels based on round numbers that tend to act as support and resistance. The methodology includes:
- Round number detection algorithms
- ATR-based dynamic spacing calculations
- Asset-specific level determination
- Distance percentage calculations
Psychological levels are a recognized concept in technical analysis, studied by traders and institutions. However, they do not guarantee price reactions and should be used as part of a comprehensive trading strategy including proper risk management, volume analysis, and price action confirmation.
───────────────────────────────────────
USAGE DISCLAIMER
───────────────────────────────────────
This tool is for educational and analytical purposes. Psychological levels can act as support or resistance but price reactions are not guaranteed. Dynamic spacing may generate different levels in different market conditions. Always conduct independent analysis, use proper risk management, and never risk capital you cannot afford to lose. Past performance does not indicate future results.
───────────────────────────────────────
CREDITS & ATTRIBUTION
───────────────────────────────────────
Original Concept: Sonar Lab

Info Box⚙️ Purpose
Shows useful trade and event-related data such as:
% Distance from stop levels (D, DH)
Earnings countdown in bars
All displayed in a single floating info box (table) on the chart.
📋 Key Features
Customizable Display
Choose table position (Top Right, Bottom Center, etc.)
Choose table size (Auto, Large, Tiny, etc.)
Custom text and background colors
Metrics Shown
D: % Distance from stop (difference between close and low/high)
DH: % Distance from midpoint of the candle
Earnings Countdown: Number of bars until next earnings event
Conditional Styling
If earnings are within 3 bars, text color turns red as a warning.
Execution Conditions
Runs only on daily timeframe
Updates on last bar only (no historical clutter)
Output
Displays all selected metrics in one line, separated by “×”
e.g. → D: -2.1% × 5 × DH: 1.4%
🧩 Overall Function
Creates a clean, customizable “info box” showing trade distances and upcoming earnings countdown for quick decision-making directly on your TradingView chart.

Volume Sentiment Breakout Channels [AlgoAlpha]🟠 OVERVIEW
This tool visualizes breakout zones based on volume sentiment within dynamic price channels . It identifies high-impact consolidation areas, quantifies buy/sell dominance inside those zones, and then displays real-time shifts in sentiment strength. When the market breaks above or below these sentiment-weighted channels, traders can interpret the event as a change in conviction, not just a technical breakout.
🟠 CONCEPTS
The script builds on two layers of logic:
Channel Detection : A volatility-based algorithm locates price compression areas using normalized highs and lows over a defined lookback. These “boxes” mark accumulation or distribution ranges.
Volume Sentiment Profiling : Each channel is internally divided into small bins, where volume is aggregated and signed by candle direction. This produces a granular sentiment map showing which levels are dominated by buyers or sellers.
When a breakout occurs, the script clears the previous box and forms a new one, letting traders visually track transitions between phases of control. The colored gradients and text updates continuously reflect the internal bias—green for net-buying, red for net-selling—so you can see conviction strength at a glance.
🟠 FEATURES
Volume-weighted sentiment map inside each box, with gradient color intensity proportional to participation.
Dynamic text display of current and overall sentiment within each channel.
Real-time trail lines to show active bullish/bearish trend extensions after breakout.
🟠 USAGE
Setup : Add the script to your chart and enable Strong Closes Only if you prefer cleaner breakouts. Use shorter normalization length (e.g., 50–80) for fast markets; longer (100–200) for smoother transitions.
Read Signals : Transparent boxes mark active sentiment channels. Green gradients show buy-side dominance, red shows sell-side. The middle dashed line is the equilibrium of the channel. “▲” appears when price breaks upward, “▼” when it breaks downward.
Understanding Sentiment : The sentiment profile can be used to show the probability of the price moving up or down at respective price levels.

Ticker Info & Look-Ahead Lines (W/D)This versatile Pine Script indicator for trading views clearly displays current chart information and predicts and plots important future timeframe boundaries (next week, the day after tomorrow, etc.).
Key Features of the Indicator 📈
This indicator is divided into three main sections:
1. Ticker/Timeframe Display
Clearly displays the current ticker and timeframe on the chart.
Customization: You can set the display position (top/middle/bottom, left/center/right), font size, default text color, and background color.
Auto Color by Timeframe: The text color automatically changes depending on the timeframe, allowing you to quickly visually grasp the current timeframe.
2. Weekly Look-Ahead Lines
Predicts the start times of the next week and the week after from the time the current bar is determined, and plots them as vertical lines on the chart.
Display Control: You can toggle the visibility of individual lines.
Style: You can set the line color and style (dotted, dashed, solid).
Maximum Number of Lines Displayed: You can control the number of previously drawn lines to retain (consumes two lines per set).
💡 Daily Chart Specific Filter
When viewing a daily chart, this filter hides all past weekly lines and displays only the most recent two (the lines for the following week and the week after). This significantly reduces the visual noise on the daily chart.
3. Daily Look-Ahead Lines
These lines predict the start times of the next and the day after tomorrow from the time the current bar is determined, and are drawn as vertical lines on the chart.
Display Control/Style: As with weekly lines, you can set the visibility, color, and style of lines.
Maximum Number of Lines Displayed: You can control the number of previously drawn lines to retain (consumes two lines per set).
4. Master Timeframe Filter
This is a master ON/OFF switch that centrally manages the automatic hiding of both weekly and daily lines except for the appropriate timeframe.
Auto-hide Daily Lines: When displaying a chart with a timeframe greater than the line's base timeframe, such as a daily, weekly, or monthly chart, the daily lines will be automatically hidden.
Auto-hide Weekly Lines: When displaying a weekly or monthly chart, the weekly lines will be automatically hidden.
This feature allows you to clearly see the leading lines when analyzing shorter timeframes, while preventing the chart from becoming cluttered with lines when switching to longer timeframes (daily or longer).
このインジケーターは、現在のチャート情報を明確に表示し、さらに将来の重要な時間軸の区切り(翌週、明後日など)を予測して描画する機能を持つ、トレーディングビュー用の多機能な Pine Script インジケーターです。
インジケーターの主要機能 (Key Features) 📈
このインジケーターは、以下の3つの主要なセクションに分かれています。
1. 銘柄・時間足情報表示 (Ticker/Timeframe Display)
チャート上に現在の銘柄名 (Ticker) と時間足 (Timeframe) を分かりやすく表示します。
カスタマイズ: 表示位置(上/中/下、左/中央/右)、文字サイズ、デフォルトの文字色、背景色を設定できます。
時間足別自動カラー: 時間足に応じて文字色が自動的に変わるオプションがあり、現在の時間足を視覚的に素早く把握できます。
2. 週足先行ライン (Weekly Look-Ahead Lines)
現在の足が確定した時点から見た、翌週と再来週の開始時刻を予測し、チャートに垂直線として描画します。
表示制御: ラインの表示/非表示を個別に切り替えられます。
スタイル: ラインの色とスタイル(点線、破線、実線)を設定できます。
最大表示本数: 過去に描画されたラインを何本まで保持するかを制御できます(1組あたり2本消費)。
💡 日足チャート限定フィルター (Daily Chart Specific Filter)
特に日足チャートを表示しているときに、過去の週足ラインをすべて非表示にし、直近の2本(翌週と再来週のライン)のみを表示するフィルター機能があります。これにより、日足チャートの視覚的なノイズを大幅に減らせます。
3. 日足先行ライン (Daily Look-Ahead Lines)
現在の足が確定した時点から見た、翌日と明後日の開始時刻を予測し、チャートに垂直線として描画します。
表示制御・スタイル: 週足ラインと同様に、ラインの表示/非表示、色、スタイルを設定できます。
最大表示本数: 過去のライン保持数を制御できます(1組あたり2本消費)。
4. 時間足フィルター一括制御 (Master Timeframe Filter)
週足ラインと日足ラインの両方に対し、適切な時間足以外での自動非表示を一括で管理するマスターON/OFFスイッチです。
日足ラインの自動非表示: 日足、週足、月足チャートなど、ラインの元となる時間足以上のチャートを表示している場合、日足ラインを自動で非表示にします。
週足ラインの自動非表示: 週足、月足チャートを表示している場合、週足ラインを自動で非表示にします。
この機能は、短期足での分析時には先行ラインを明確に見せつつ、長期足(日足以上)に切り替えた際にチャートが線で cluttered になるのを防ぎます。

saodisengxiaoyu-lianghua-2.1- This indicator is a modular, signal-building framework designed to generate long and short signals by combining a chosen leading indicator with selectable confirmation filters. It runs on Pine Script version 5, overlays directly on price, and is built to be highly configurable so traders can tailor the signal logic to their market, timeframe, and trading style. It includes a dashboard to visualize which conditions are active and whether they validate a signal, and it outputs clear buy/sell labels and alert conditions so you can automate or monitor trades with confidence.
Core Design
- Leading Indicator: You choose one primary signal generator from a broad list (for example, Range Filter, Supertrend, MACD, RSI, Ichimoku, and many others). This serves as the anchor of the system and determines when a preliminary long or short setup exists.
- Confirmation Filters: You can enable additional filters that validate the leading signal before it becomes actionable. Each “respect…” input toggles a filter on or off. These filters include popular tools like EMA, 2/3 EMA crosses, RQK (Nadaraya Watson), ADX/DMI, Bollinger-based oscillators, MACD variations, QQE, Hull, VWAP, Choppiness Index, Damiani Volatility, and more.
- Signal Expiry: To avoid waiting indefinitely for confirmations, the indicator counts how many consecutive bars the leading condition holds. If confirmations do not align within a defined number of bars, the setup expires. This controls latency and helps reduce late or stale entries.
- Alternating Signals: An optional mode enforces alternation (long must follow short and vice versa), helping avoid repeated entries in the same direction without a meaningful reset.
- Aggregation Logic: The final long/short conditions are formed by combining the leading condition with all selected confirmation filters through logical conjunction. Only if all enabled filters validate the signal (within expiry constraints) does the indicator consider it a confirmed long or short.
- Visualization and Alerts: The script plots buy/sell labels at signal points, provides alert conditions for automation, and displays a compact dashboard summarizing the leading indicator’s status and each confirmation’s pass/fail result using checkmarks.
Leading Indicator Options
- The indicator includes a very large menu of leading tools, each with its own logic to determine uptrend or downtrend impulses. Highlights include:
- Range Filter: Uses a dynamic centerline and bands computed via conditional EMA/SMA and range sizing to define directional movement. It can operate in a default mode or an alternative “DW” mode.
- Rational Quadratic Kernel (RQK): Applies a kernel smoothing model (Nadaraya Watson) to detect uptrends and downtrends with a focus on noise reduction.
- Supertrend, Half Trend, SSL Channel: Classic trend-following tools that derive direction from ATR-based bands or moving average channels.
- Ichimoku Cloud and SuperIchi: Multi-component systems validating trend via cloud position, conversion/base line relationships, projected cloud, and lagging span.
- TSI (True Strength Index), DPO (Detrended Price Oscillator), AO (Awesome Oscillator), MACD, STC (Schaff Trend Cycle), QQE Mod: Momentum and cycle tools that parse direction from crossovers, zero-line behavior, and momentum shifts.
- Donchian Trend Ribbon, Chandelier Exit: Trend and exit tools that can validate breakouts or sustained trend strength.
- ADX/DMI: Measures trend strength and directional movement via +DI/-DI relationships and minimum ADX thresholds.
- RSI and Stochastic: Use crossovers, level exits, or threshold filters to gate entries based on overbought/oversold dynamics or relative strength trends.
- Vortex, Chaikin Money Flow, VWAP, Bull Bear Power, ROC, Wolfpack Id, Hull Suite: A diverse set of directional, momentum, and volume-based indicators to suit different markets and styles.
- Trendline Breakout and Range Detector: Price-behavior filters that confirm signals during breakouts or within defined ranges.
Confirmation Filters
- Each filter is optional. When enabled, it must validate the leading condition for a signal to pass. Examples:
- EMA Filter: Requires price to be above a specified EMA for longs and below for shorts, filtering signals that contradict broader trend or baseline levels.
- 2 EMA Cross and 3 EMA Cross: Enforce moving average cross conditions (fast above slow for long, the reverse for short) or a three-line stacking logic for more stringent trend alignment.
- RQK, Supertrend, Half Trend, Donchian, QQE, Hull, MACD (crossover vs. zero-line), AO (zero line or AC momentum variants), SSL: Each adds its characteristic validation pattern.
- RSI family (MA cross, exits OB/OS zones, threshold levels) plus RSI MA direction and RSI/RSI MA limits: Multiple ways to constrain signals via relative strength behavior and trajectories.
- Choppiness Index and Damiani Volatility: Prevent entries during ranging conditions or insufficient volatility; choppiness thresholds and volatility states gate the trade.
- VWAP, Volume modes (above MA, simple up/down, delta), Chaikin Money Flow: Volume and flow conditions that ensure signals happen in supportive liquidity or accumulation/distribution contexts.
- ADX/DMI thresholds: Demand a minimum trend strength and directional DI alignment to reduce whipsaw trades.
- Trendline Breakout and Range Detector: Confirm that the price is breaking structure or remains within active range consistent with the leading setup.
- By combining several filters you can create strict, conservative entries or looser setups depending on your goals.
Range Filter Engine
- A core building block, the Range Filter uses conditional EMA and SMA functions to compute adaptive bands around a dynamic centerline. It supports two types:
- Type 1: The centerline updates when price exceeds the band thresholds; bands define acceptable drift ranges.
- Type 2: Uses quantized steps (via floor operations) relative to the previous centerline to handle larger moves in discrete increments.
- The engine offers smoothing for range values using a secondary EMA and can switch between raw and averaged outputs. Its hi/lo bands and centerline compose a corridor that defines directional movement and potential breakout confirmation.
Signal Construction
- The script computes:
- leadinglongcond and leadingshortcond : The primary directional signals from the chosen leading indicator.
- longCond and shortCond : Final signals formed by combining the leading conditions with all enabled confirmations. Each confirmation contributes a boolean gate. If a filter is disabled, it contributes a neutral pass-through, keeping the logic intact without enforcing that condition.
- Expiry Logic: The code counts consecutive bars where the leading condition remains true. If confirmations do not line up within the user-defined “Signal Expiry Candle Count,” the setup is abandoned and the signal does not trigger.
- Alternation: An optional state ensures that long and short signals alternate. This can reduce repeated entries in the same direction without a clear reset.
- Finally, longCondition and shortCondition represent the actionable signals after expiry and alternation logic. These drive the label plotting and alert conditions.
Visualization
- Buy and Sell Labels: When longCondition or shortCondition confirm, the script plots annotated labels directly on the chart, making entries easy to see at a glance. The labels use color coding and clear text tags (“long” vs. “short”).
- Dashboard: A table summarizes the status of the leading indicator and all confirmations. Each row shows the indicator label and whether it passed (✔️) or failed (❌) on the current bar. This intensely practical UI helps you diagnose why a signal did or did not trigger, empowering faster strategy iteration and parameter tuning.
- Failed Confirmation Markers: If a setup expires (count exceeds the limit) and confirmations failed to align, the script can mark the chart with a small label and provide a tooltip listing which confirmations did not pass. It’s a helpful audit trail to understand missed trades or prevent “chasing” invalid signals.
- Data Window Values: The script outputs signal states to the data window, which can be useful for debugging or building composite conditions in multi-indicator templates.
Inputs and Parameters
- You control the indicator from a comprehensive input panel:
- Setup: Signal expiry count, whether to enforce alternating signals, and whether to display labels and the dashboard (including position and size).
- Leading Indicator: Choose the primary signal generator from the large list.
- Per-Filter Toggles: For each confirmation, a respect... toggle enables or disables it. Many include sub-options (like MACD type, Stochastic mode, RSI mode, ADX variants, thresholds for choppiness/volatility, etc.) to fine-tune behavior.
- Range Filter Settings: Choose type and behavior; select default vs. DW mode and smoothing. The underlying functions adjust band sizes using ATR, average change, standard deviation, or user-defined scales.
- Because everything is customizable, you can adapt the indicator to different assets, volatility regimes, and timeframes.
Alerts and Automation
- The script defines alert conditions tied to longCondition and shortCondition . You can set these alerts in your chart to trigger notifications or webhook calls for automated execution in external bots. The alert text is simple, and you can configure your own message template when creating alerts in the chart, including JSON payloads for algorithmic integration.
Typical Workflow
- Select a Leading Indicator aligned with your style. For trend following, Supertrend or SSL may be appropriate; for momentum, MACD or TSI; for range/trend-change detection, Range Filter, RQK, or Donchian.
- Add a few key Confirmation Filters that complement the leading signal. For example:
- Pair Supertrend with EMA Filter and RSI MA Direction to ensure trend alignment and positive momentum.
- Combine MACD Crossover with ADX/DMI and Volume Above MA to avoid signals in low-trend or low-liquidity conditions.
- Use RQK with Choppiness Index and Damiani Volatility to only act when the market is trending and volatile enough.
- Set a sensible Signal Expiry Candle Count. Shorter expiry keeps entries timely and reduces lag; longer expiry captures setups that mature slowly.
- Observe the Dashboard during live markets to see which filters pass or fail, then iterate. Tighten or loosen thresholds and filter combinations as needed.
- For automation, turn on alerts for the final conditions and use webhook payloads to notify your trading robot.
Strengths and Practical Notes
- Flexibility: The indicator is a toolkit rather than a single rigid model. It lets you test different combinations rapidly and visualize outcomes immediately.
- Clarity: Labels, dashboard, and failed-confirmation markers make it easy to audit behavior and refine settings without digging into code.
- Robustness: The expiry and alternation options add discipline, avoiding the temptation to enter late or repeatedly in one direction without a reset.
- Modular Design: The logical gates (“respect…”) make the behavior transparent: if a filter is on, it must pass; if it’s off, the signal ignores it. This keeps reasoning clean.
- Avoiding Overfitting: Because you can stack many filters, it’s tempting to over-constrain signals. Start simple (one leading indicator and one or two confirmations). Add complexity only if it demonstrably improves your edge across varied market regimes.
Limitations and Recommendations
- No single configuration is universally optimal. Markets change; tune filters for the instrument and timeframe you trade and revisit settings periodically.
- Trend filters can underperform in choppy markets; likewise, momentum filters can false-trigger in quiet periods. Consider using Choppiness Index or Damiani to gate signals by regime.
- Use expiry wisely. Too short may miss good setups that need a few bars to confirm; too long may cause late entries. Balance responsiveness and accuracy.
- Always consider risk management externally (position sizing, stops, profit targets). The indicator focuses on signal quality; combining it with robust trade management methods will improve results.
Example Configurations
- Trend-Following Setup:
- Leading: Supertrend uptrend for longs and downtrend for shorts.
- Confirmations: EMA Filter (price above 200 EMA for long, below for short), ADX/DMI (trend strength above threshold with +DI/-DI alignment), Volume Above MA.
- Expiry: 3–4 bars to keep entries timely.
- Result: Strong bias toward sustained moves while avoiding weak trends and thin liquidity.
- Mean-Reversion to Momentum Crossover:
- Leading: RSI exits from OB/OS zones (e.g., RSI leaves oversold for long and leaves overbought for short).
- Confirmations: 2 EMA Cross (fast crossing slow in the same direction), MACD zero-line behavior for added momentum validation.
- Expiry: 2–3 bars for responsive re-entry.
- Result: Captures momentum transitions after short-term extremes, with extra confirmation to reduce head-fakes.
- Range Breakout Focus:
- Leading: Range Filter Type 2 or Donchian Trend Ribbon to detect breakouts.
- Confirmations: Damiani Volatility (avoid low-volatility false breaks), Choppiness Index (prefer trend-ready states), ROC positive/negative threshold.
- Expiry: 1–3 bars to act on breakout windows.
- Result: Better alignment to breakout dynamics, gating trades by volatility and regime.
Conclusion
- This indicator is a comprehensive, configurable framework that merges a chosen leading signal with an array of corroborating filters, disciplined expiry handling, and intuitive visualization. It’s designed to help you build high-quality entry signals tailored to your approach, whether that’s trend-following, breakout trading, momentum capturing, or a hybrid. By surfacing pass/fail states in a dashboard and allowing alert-based automation, it bridges the gap between discretionary analysis and systematic execution. With sensible parameter tuning and thoughtful filter selection, it can serve as a robust backbone for signal generation across diverse instruments and timeframes.
