Historical & Periodic Key LevelsHistorical & Periodic Key Levels
This indicator automatically plots historical key levels (ATH/ATL) and periodic closing levels (Daily, Weekly, Monthly, Yearly). It highlights major price zones frequently used in technical and institutional trading.
Key Features:
Dynamic ATH/ATL: tracks all-time high/low with date annotation.
Periodic Closes: previous D/W/M/Y closes with directional coloring.
Adaptive Colors: green/red based on bullish or bearish close.
Full Customization: toggle visibility, colors, line width, text alignment, and label text.
Smart Label Management: prevents overlap by cycling through label styles automatically.
Usage:
Identify strong support/resistance levels.
Monitor key closing prices across multiple timeframes.
Enhance swing trading and long-term analysis with institutional reference levels.
Inputs:
Levels Visibility: show/hide ATH, ATL, and periodic closes.
ATH/ATL Style Settings: line colors, label prefix, width, and text alignment.
Periodic Levels Style: label text (D/W/M/Y), line width, alignment, and bullish/bearish colors.
Notes:
Levels adjust automatically to the active chart timeframe.
Lower timeframe levels are hidden when redundant (e.g., daily close on daily chart).
在脚本中搜索"text"

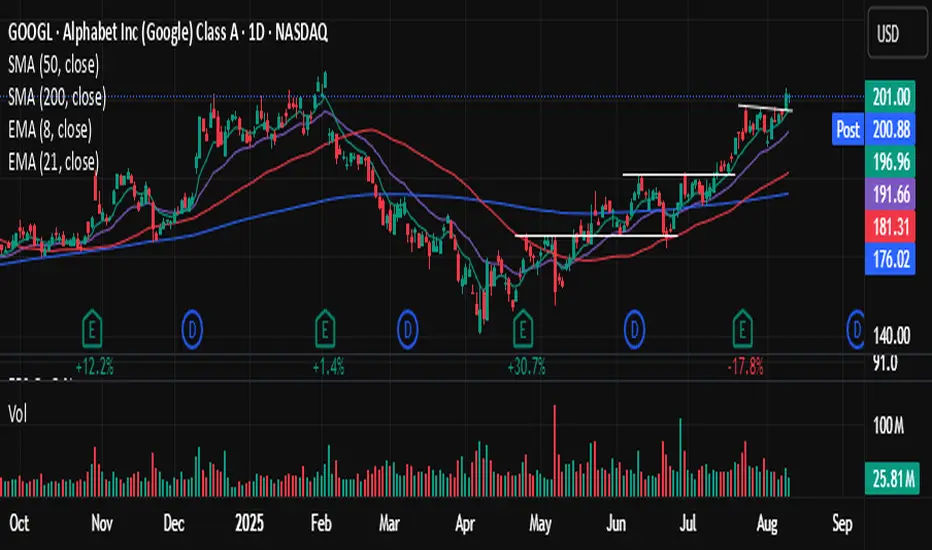
EPS QoQ % ChangeThis indicator calculates and displays the quarter-over-quarter (QoQ) percentage change in earnings per share (EPS) directly on your chart, aligned with each earnings event.
It is designed to quickly highlight EPS growth or decline without the need to open an earnings report, providing traders and investors with instant, visual performance context.
Features :
- Automatic Earnings Detection: Identifies earnings bars and calculates QoQ % change.
- Color-Coded Text: Positive changes are shown in your chosen “up” color, declines in your “down” color, and flat results in a neutral color.
- Customizable Appearance: Choose text size and colors to match your chart style.
- Tooltip Support: Optional detailed tooltip showing reported EPS, previous EPS, and calculated QoQ change.
- Compact Layout: Displays in its own pane to avoid cluttering price action.
Use Cases :
- Quickly assess EPS growth trends over time.
- Spot significant earnings beats or misses without reading earnings transcripts.
- Use alongside other technical or fundamental tools for better decision-making.
Watermark Clarity V33🌟 Introducing Watermark Clarity V33 – Banner 🌟
Watermark Clarity V33 is a visual utility tool designed to enhance chart awareness, focus, and clean aesthetics without adding market noise. Unlike traditional indicators, this script does not generate buy/sell signals or perform technical analysis. Instead, it provides a customizable on-chart watermark banner that clearly communicates your current mindset, risk awareness, or trading bias directly on the chart — helping traders stay aligned with their pre-defined plans and reducing impulsive behavior.
Whether you’re a discretionary trader, scalper, or swing trader, Watermark Clarity V33 offers an adaptive display that blends clarity with minimalism, keeping your chart clean while remaining informative.
🛠 Customizable Parameters
• Dual Text Banners: Configure two independent headers to reflect trading goals, risk posture, or emotional cues.
• Smart Animation Toggle: Optionally animate between messages to help reinforce shifting market awareness or draw attention during high-alert periods.
• Size, Color & Positioning: Adjust the info box’s text size, banner dimensions, background color, transparency, and placement (top/middle/bottom – left/center/right).
• Transparent Mode: Switch to semi-transparent mode for cleaner overlays during live sessions or screen recording.
🚀 New Feature – Custom Alerts & Smart Animation Control
• Market-Aware Animation Logic:
When Enable Animation is turned on and both Heading 1 and Heading 2 are filled:
• 📈 During Market Hours → The banner alternates smoothly between both headings, helping maintain awareness and visual engagement.
• 💤 Outside Market Hours → The banner remains fixed on Heading 1. This acts as a subtle visual cue that markets are currently closed — giving you peace of mind and a cleaner screen.
✨ Visual Utility Use Cases
• Accountability Layer: Keep yourself accountable to your trading rules or session checklist.
• Mindset Anchor: Display motivational or tactical reminders that guide your trading behavior.
• Multi-Timeframe Syncing: Use different watermarks across charts to stay aligned across timeframes or instruments.
📘 How to Use
1. Add the Indicator: Apply “Watermark Clarity V33 – Banner” to your chart.
2. Configure Inputs: Adjust the banner texts, size, color scheme, and screen position to your liking.
4. Focus & Trade: Let the visual cue support your decision-making environment without interfering with price action.
❗ Important Notes
• This indicator does not analyze price data or generate signals. It is designed solely for visual clarity and trader discipline support.
• All display logic runs in real-time and responds to your settings only, no repainting or lookahead bias.

High Low Levels by JZCustom High Low Levels Indicator - features
Clearly plotted high and low levels for specific trading sessions. This indicator provides visual representations of key price levels during various trading periods. Below are the main features and benefits of this indicator:
1. Display high and low levels for each session
- previous day high/low: display the high and low from the previous day, giving you a better understanding of how the price moves compared to the prior day.
- asia, london, and custom sessions: track the high and low levels for the major trading sessions (asian and london) and two custom user-defined sessions.
2. Complete line and label customization
- custom line appearance: choose the color, line style (solid, dashed, dotted), and line thickness for each trading session. you can also decide if the lines should extend beyond the current price action.
- custom labels: define your own label texts for each custom session. this way, you can label the levels precisely and easily track price movements.
3. Define your own trading sessions
- add up to two custom sessions (custom and custom 2), which can be defined using precise start and end times (hour and minute).
- each custom session allows you to specify the label text for the high and low levels, enabling you to easily differentiate different parts of the day on the chart.
4. Clear and intuitive design
- grouped settings: all settings are grouped based on trading sessions, so you can easily customize every aspect of the visual representation.
- simple toggle on/off: you can easily enable or disable each line (previous day, asia, london, custom 1, custom 2). this allows you to keep your chart clean and focus only on the important levels you need at any moment.
5. Flexible time zones
- time zone settings: set the time zone (utc, europe/london, america/new_york, asia/tokyo) to properly align the timeframes for each level depending on the market you're focusing on.
6. Automatic cleanup of old lines and labels
- old levels removal: automatically remove old lines and labels to prevent clutter on your chart. this ensures that only current, relevant levels for each trading day or session are displayed.
7. Precise plotting and line extension
- accurate level markings: the indicator calculates the precise times when the high and low levels were reached and plots lines that visually represent these levels.
- line extension options: you have the option to extend the high/low lines beyond their point of calculation, which helps with identifying price action trends beyond the current period.
Dec 7, 2024
Release Notes
Changes and Improvements for Users:
1. Customizable Offset for Lines and Labels:
- A new input, `Line and Label Offset`, allows users to control how far the lines and their associated text labels extend. This ensures the labels and lines remain aligned and can be adjusted as needed.
2. Unified Offset Control:
- The same offset value is applied to all types of lines and labels (e.g., Previous Day High/Low, Asia High/Low, London High/Low, and custom sessions). Users can change this in one place to affect the entire script consistently.
3. Enhanced Flexibility:
- Users now have more control over the appearance and position of their lines and labels, making the indicator adaptable to different chart setups and personal preferences.
These updates aim to enhance user convenience and customization, ensuring a more tailored charting experience.

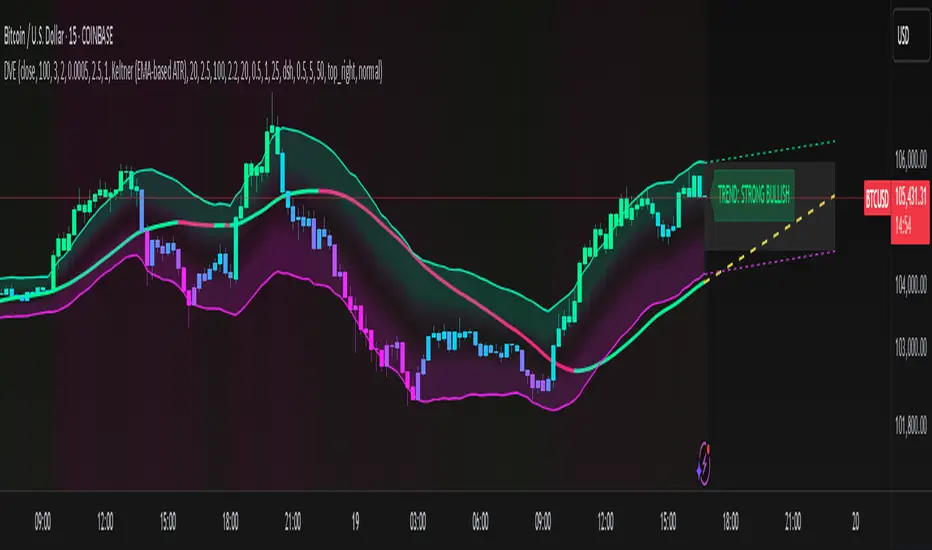
Dynamic Volatility EnvelopeDynamic Volatility Envelope: Indicator Overview
The Dynamic Volatility Envelope is an advanced, multi-faceted technical indicator designed to provide a comprehensive view of market trends, volatility, and potential future price movements. It centers around a customizable linear regression line, enveloped by dynamically adjusting volatility bands. The indicator offers rich visual feedback through gradient coloring, candle heatmaps, a background volatility pulse, and an on-chart trend strength meter.
Core Calculation Mechanism
Linear Regression Core :
-A central linear regression line is calculated based on a user-defined source (e.g., close, hl2) and lookback period.
-The regression line can be optionally smoothed using an Exponential Moving Average (EMA) to reduce noise.
-The slope of this regression line is continuously calculated to determine the current trend direction and strength.
Volatility Channel :
-Dynamic bands are plotted above and below a central basis line. This basis is typically the calculated regression line but shifts to an EMA in Keltner mode.
-The width of these bands is determined by market volatility, using one of three user-selectable modes:
ATR Mode : Bandwidth is a multiple of the Average True Range (ATR).
Standard Deviation Mode : Bandwidth is a multiple of the Standard Deviation of the source data.
Keltner Mode (EMA-based ATR) : ATR-based bands are plotted around a central Keltner EMA line, offering a smoother channel.
The channel helps identify dynamic support and resistance levels and assess market volatility.
Future Projection :
The indicator can project the current regression line and its associated volatility bands into the future for a user-defined number of bars. This provides a visual guide for potential future price pathways based on current trend and volatility characteristics.
Candle Heatmap Coloring :
-Candle bodies and/or wicks/borders can be colored based on the price's position within the upper and lower volatility bands.
-Colors transition in a gradient from bearish (when price is near the lower band) through neutral (mid-channel) to bullish (when price is near the upper band), providing an intuitive visual cue of price action relative to the dynamic envelope.
Background Volatility Pulse :
The chart background color can be set to dynamically shift based on a ratio of short-term to long-term ATR. This creates a "pulse" effect, where the background subtly changes color to indicate rising or falling market volatility.
Trend Strength Meter :
An on-chart text label displays the current trend status (e.g., "Strong Bullish", "Neutral", "Bearish") based on the calculated slope of the regression line relative to user-defined thresholds for normal and strong trends.
Key Features & Components
-Dynamic Linear Regression Line: Core trend indicator with optional smoothing and slope-based gradient coloring.
-Multi-Mode Volatility Channel: Choose between ATR, Standard Deviation, or Keltner (EMA-based ATR) calculations for band width.
-Customizable Vertical Gradient Channel Fills: Visually distinct fills for upper and lower channel segments with user-defined top/bottom colors and gradient spread.
-Future Projection: Extrapolates regression line and volatility bands to forecast potential price paths.
-Price-Action Based Candle Heatmap: Intuitive candle coloring based on position within the volatility channel, with adjustable gradient midpoint.
-Volatility-Reactive Background Gradient: Subtle background color shifts to reflect changes in market volatility.
-On-Chart Trend Strength Meter: Clear textual display of current trend direction and strength.
-Extensive Visual Customization: Fine-tune colors, line styles, widths, and gradient aggressiveness for most visual elements.
-Comprehensive Tooltips: Detailed explanations for every input setting, ensuring ease of use and understanding.
Visual Elements Explained
Regression Line : The primary trend line. Its color dynamically changes (e.g., green for uptrend, red-pink for downtrend, neutral for flat) based on its slope, with smooth gradient transitions.
Volatility Channel :
Upper & Lower Bands : These lines form the outer boundaries of the envelope, acting as dynamic support and resistance levels.
Channel Fill : The area between the band center and the outer bands is filled with a vertical gradient. For example, the upper band fill might transition from a darker green near the center to a lighter green at the upper band.
Band Borders : The lines outlining the upper and lower bands, with customizable color and width.
Future Projection Lines & Fill :
Projected Regression Line : An extension of the current regression line into the future, typically styled differently (e.g., dashed).
Projected Channel Bands : Extensions of the upper and lower volatility bands.
Projected Area Fill : A semi-transparent fill between the projected upper and lower bands.
Candle Heatmap Coloring : When enabled, candles are colored based on their closing price's relative position within the channel. Bullish colors appear when price is in the upper part of the channel, bearish in the lower, and neutral in the middle. Users can choose to color the entire candle body or just the wicks and borders.
Background Volatility Pulse : The chart's background color subtly shifts (e.g., between a calm green and an agitated red-pink) to reflect the current volatility regime.
Trend Strength Meter : A text label (e.g., "TREND: STRONG BULLISH") positioned on the chart, providing an at-a-glance summary of the trend.
Configuration Options
Users can tailor the indicator extensively via the settings panel, with options logically grouped:
Core Analysis Engine : Adjust regression source data, lookback period, and EMA smoothing for the regression line.
Regression Line Visuals : Control visibility, line width, trend-based colors (uptrend, downtrend, flat), slope thresholds for trend definition, strong slope multiplier (for Trend Meter), and color gradient sharpness.
Volatility Channel Configuration : Select band calculation mode (ATR, StdDev, Keltner), set relevant periods and multipliers. Customize colors for vertical gradient fills (upper/lower, top/bottom), border line colors, widths, and the gradient spread factor for fills.
Future Projection Configuration : Toggle visibility, set projection length (number of bars), line style, and colors for projected regression and band areas.
Appearance & Candle Theme : Set default bull/bear candle colors, enable/disable candle heatmap, choose if body color matches heatmap, and configure heatmap gradient target colors (bull, neutral, bear) and the gradient's midpoint.
Background Volatility Pulse : Enable/disable the background effect and configure short/long ATR periods for the volatility calculation.
Trend Strength Meter : Enable/disable the meter, and choose its on-chart position and text size.
Interpretation Notes
-The Regression Line is the primary indicator of trend direction. Its slope and color provide immediate insight.
-The Volatility Bands serve as dynamic support and resistance zones. Price approaching or touching these bands may indicate potential turning points or breakouts. The width of the channel itself reflects market volatility – widening suggests increasing volatility, while narrowing suggests consolidation.
Future Projections are not predictions but rather an extension of current conditions. They can help visualize potential areas where price might interact with projected support/resistance if the current trend and volatility persist.
Candle Heatmap Coloring offers a quick visual assessment of where price is trading within the dynamic envelope, highlighting strength or weakness relative to the channel.
The Background Volatility Pulse gives a contextual feel for overall market agitation or calmness.
This indicator is designed to be a comprehensive analytical tool. Its signals and visualizations are best used in conjunction with other technical analysis techniques, price action study, and robust risk management practices. It is not intended as a standalone trading system.
Risk Disclaimer
Trading and investing in financial markets involve substantial risk of loss and is not suitable for every investor. The Dynamic Volatility Envelope indicator is provided for analytical and educational purposes only and does not constitute financial advice or a recommendation to buy or sell any security. Past performance is not indicative of future results. Always use sound risk management practices and never trade with capital you cannot afford to lose. The developers assume no liability for any financial losses incurred based on the use of this indicator.
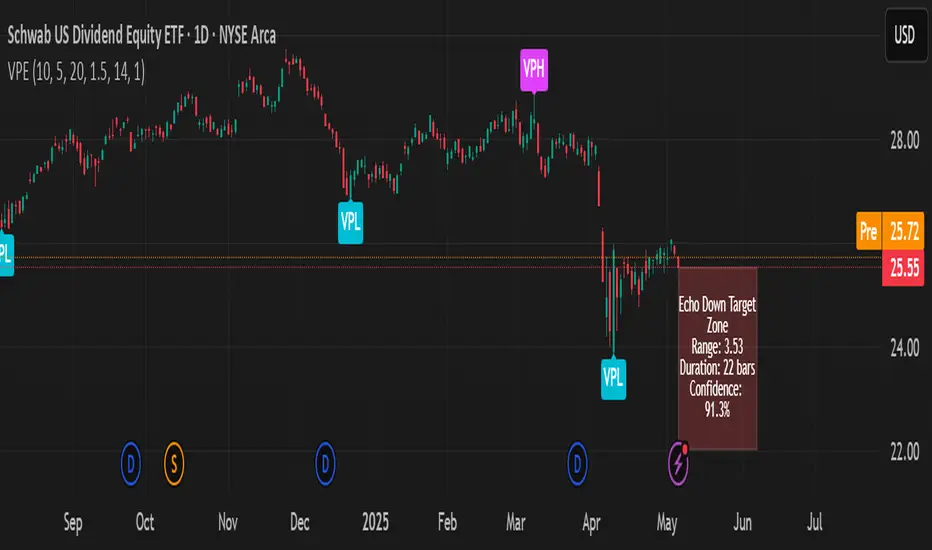
Volumetric Pivot Echo🔮 Volumetric Pivot Echo (VPE)
Future Price Projection Zones with Confidence Scoring
📘 Overview
The Volumetric Pivot Echo (VPE) is a next-generation leading indicator that identifies high-volume reversal points and echoes their price + time behavior into the future — giving you a visual forecast box that includes a confidence score, price range, and duration estimate.
It’s designed for swing and options traders who want forward guidance based on real structure, not just reactive signals.
⚙️ How It Works
Pivot Detection – Finds pivot highs/lows based on configurable bar structure.
Volume Confirmation – Only confirms pivots backed by strong volume (e.g., 1.5× average).
Echo Logic – Measures the price move and time it took to reach the pivot.
ATR Scaling – Adjusts projections based on current market volatility.
Confidence Score – Rates each projection (0–100%) based on structure match, volatility, and direction alignment.
📦 What Appears on Chart
Projection Box:
A forward-drawn rectangle from the current bar to the estimated future zone. The box's size and duration mirror the last valid momentum leg.
Box Label Text:
🔹 Range (projected move size)
⏱️ Duration (bars expected)
✅ Confidence %
VPH/VPL Markers:
Pivot highs and lows confirmed by volume, marked with “VPH” or “VPL”.
🎯 How to Trade with It
Use the box as a target zone for directional trades.
If price enters a box with >85% confidence, consider it a high-quality path projection.
Use with support/resistance confluence or entry systems.
Works especially well for swing trading, breakout setups, or options targeting.
🛠️ Recommended Settings
Box Transparency: Set Projection Up/Down Color to 90 (10% visible).
Text Color: Set to white for readability.
Volume Multiplier: Default 1.5x, increase in choppy markets.
Projection Duration: Start with 1.0x echo multiplier and fine-tune.
⏳ Timeframes & Accuracy
Timeframe Confidence Zones Most Reliable
15m – 1h Use 70–85% confidence scores
1h – 4h Sweet spot for balanced signals
1D – 1W Strongest historical echo tracking (>85% ideal)
✅ Key Features
Forward-looking, non-repainting logic
Clear visual projections — no guesswork
Confidence scoring built-in
ATR-adjusted — adapts to volatility
Works on any asset (stocks, crypto, FX)
🧠 Why It’s Unique
This is not a lagging oscillator or classic trend-following tool.
It’s a leading structure projection model — combining pivot behavior, volume intensity, and market volatility to sketch forward “echo zones” based on the past.
Aggressive Predictor+ (Last Bar, Vol, Wick)# Aggressive Predictor+ Pine Script Indicator
**Version:** Based on the script incorporating Last Bar analysis, Volume Confirmation, and Wick Rejection.
## Overview
This TradingView Pine Script indicator aims to predict the likely directional bias of the **next** candle based on an aggressive analysis of the **last closed candle's** price action, volume, and wick characteristics relative to recent market volatility (ATR).
It is designed to be **highly reactive** to the most recent bar's information. The prediction is visualized directly on the chart through shapes, a projected line, a text label, and an information table.
**Please Note:** Predicting the next candle is inherently speculative. This indicator provides a probability assessment based on its specific logic and should be used as a supplementary tool within a broader trading strategy, not as a standalone signal. Its performance heavily depends on market conditions and the chosen settings.
## Core Logic Explained
The indicator follows these steps for each new bar, looking back at the **last closed bar** (` `):
1. **Calculate Recent Volatility:** Determines the Average True Range (ATR) over the specified `ATR Lookback Period` (`atr_len`). This provides context for how volatile the market has been recently.
2. **Analyze Last Bar's Body:** Calculates the price change from open to close (`close - open `) of the last completed bar.
3. **Compare Body to Volatility:** Compares the absolute size of the last bar's body to the calculated ATR (`prev_atr`) multiplied by a sensitivity threshold (`threshold_atr_mult`).
* If the body size (positive) exceeds the threshold, the initial prediction is "Upward".
* If the body size (negative) exceeds the negative threshold, the initial prediction is "Downward".
* Otherwise, the initial prediction is "Neutral".
4. **Check Volume Confirmation:** Compares the volume of the last bar (`volume `) to its recent average volume (`ta.sma(volume, vol_avg_len) `). If the volume is significantly higher (based on `vol_confirm_mult`), it adds context ("High Vol") to directional predictions.
5. **Check for Wick Rejection:** Analyzes the wicks of the last bar.
* If the initial prediction was "Upward" but there was a large upper wick (relative to the body size, defined by `wick_rejection_mult`), it indicates potential selling pressure rejecting higher prices. The prediction is **overridden to "Neutral"**.
* If the initial prediction was "Downward" but there was a large lower wick, it indicates potential buying pressure supporting lower prices. The prediction is **overridden to "Neutral"**.
6. **Determine Final Prediction:** The final state ("Upward", "Downward", or "Neutral") is determined after considering potential wick rejection overrides. Context about volume or wick rejection is added to the display text.
## Visual Elements
* **Prediction Shapes:**
* Green Up Triangle: Below the bar for an "Upward" prediction (without wick rejection).
* Red Down Triangle: Above the bar for a "Downward" prediction (without wick rejection).
* Gray Diamond: Above/Below the bar if a directional move was predicted but then neutralized due to Wick Rejection.
* **Prediction Line:**
* Extends forward from the current bar's close for `line_length` bars (Default: 20).
* Color indicates the final predicted state (Green: Upward, Red: Downward, Gray: Neutral).
* Style is solid for directional predictions, dotted for Neutral.
* The *slope/magnitude* of the line is based on recent volatility (ATR) and the `projection_mult` setting, representing a *potential* magnitude if the predicted direction holds, scaled by recent volatility. **This is purely a visual projection, not a precise price forecast.**
* **Prediction Label:**
* Appears at the end of the Prediction Line.
* Displays the final prediction state (e.g., "Upward (High Vol)", "Neutral (Wick Rej)").
* Shows the raw price change of the last bar's body and its size relative to ATR (e.g., "Last Body: 1.50 (120.5% ATR)").
* Tooltip provides more detailed calculation info.
* **Info Table:**
* Displays the prediction state, color-coded.
* Shows details about the last bar's body size relative to ATR.
* Dynamically positioned near the latest bar (offsets configurable).
## Configuration Settings (Inputs)
These settings allow you to customize the indicator's behavior and appearance. Access them by clicking the "Settings" gear icon on the indicator name on your chart.
### Price Action & ATR
* **`ATR Lookback Period` (`atr_len`):**
* *Default:* 14
* *Purpose:* Number of bars used to calculate the Average True Range (ATR), which measures recent volatility.
* **`Body Threshold (ATR Multiplier)` (`threshold_atr_mult`):**
* *Default:* 0.5
* *Purpose:* Key setting for **aggression**. The last bar's body size (`close - open`) must be greater than `ATR * this_multiplier` to be initially classified as "Upward" or "Downward".
* *Effect:* **Lower values** make the indicator **more aggressive** (easier to predict direction). Higher values require a stronger price move relative to volatility and result in more "Neutral" predictions.
### Volume Confirmation
* **`Volume Avg Lookback` (`vol_avg_len`):**
* *Default:* 20
* *Purpose:* Number of bars used to calculate the simple moving average of volume.
* **`Volume Confirmation Multiplier` (`vol_confirm_mult`):**
* *Default:* 1.5
* *Purpose:* Volume on the last bar is considered "High" if it's greater than `Average Volume * this_multiplier`.
* *Effect:* Primarily adds context "(High Vol)" or "(Low Vol)" to the display text for directional predictions. Doesn't change the core prediction state itself.
### Wick Rejection
* **`Wick Rejection Multiplier` (`wick_rejection_mult`):**
* *Default:* 1.0
* *Purpose:* If an opposing wick (upper wick on an up-candle, lower wick on a down-candle) is larger than `body size * this_multiplier`, the directional prediction is overridden to "Neutral".
* *Effect:* Higher values require a much larger opposing wick to cause a rejection override. Lower values make wick rejection more likely.
### Projection Settings
* **`Projection Multiplier (ATR based)` (`projection_mult`):**
* *Default:* 1.0
* *Purpose:* Scales the projected *magnitude* of the prediction line. The projected price change shown by the line is `+/- ATR * this_multiplier`.
* *Effect:* Adjusts how far up or down the prediction line visually slopes. Does not affect the predicted direction.
* **`Prediction Line Length (Bars)` (`line_length`):**
* *Default:* 20
* *Purpose:* Controls how many bars forward the **visual** prediction line extends.
* *Effect:* Purely visual length adjustment.
### Visuals
* **`Upward Color` (`bullish_color`):** Color for Upward predictions.
* **`Downward Color` (`bearish_color`):** Color for Downward predictions.
* **`Neutral Color` (`neutral_color`):** Color for Neutral predictions (including Wick Rejections).
* **`Show Prediction Shapes` (`show_shapes`):** Toggle visibility of the triangles/diamonds on the chart.
* **`Show Prediction Line` (`show_line`):** Toggle visibility of the projected line.
* **`Show Prediction Label` (`show_label`):** Toggle visibility of the text label at the end of the line.
* **`Show Info Table` (`show_table`):** Toggle visibility of the information table.
### Table Positioning
* **`Table X Offset (Bars)` (`table_x_offset`):**
* *Default:* 3
* *Purpose:* How many bars to the right of the current bar the info table should appear.
* **`Table Y Offset (ATR Multiplier)` (`table_y_offset_atr`):**
* *Default:* 0.5
* *Purpose:* How far above the high of the last bar the info table should appear, measured in multiples of ATR.
## How to Use
1. Open the Pine Editor in TradingView.
2. Paste the complete script code.
3. Click "Add to Chart".
4. Adjust the input settings (especially `threshold_atr_mult`) to tune the indicator's aggressiveness and visual preferences.
5. Observe the prediction elements alongside your other analysis methods.
## Disclaimer
**This indicator is for informational and educational purposes only. It does not constitute financial advice or a recommendation to buy or sell any asset.** Trading financial markets involves significant risk, and you could lose money. Predictions about future price movements are inherently uncertain. The performance of this indicator depends heavily on market conditions and the settings used. Always perform your own due diligence and consider multiple factors before making any trading decisions. Use this indicator at your own risk.

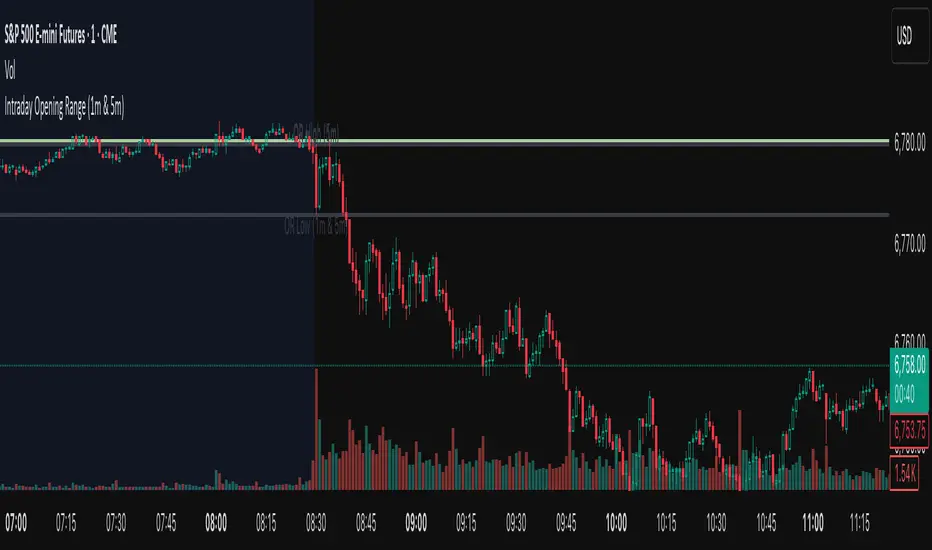
First 1-Minute Candle High/Low After Specific TimeDescription:
This indicator captures and marks the high and low of the first 1-minute candle after a specified time (default: 9:30 AM) and tracks the highs and lows of the first five candles. The levels marked by these initial candles are often critical in determining early session support and resistance, providing a visual guide for traders monitoring price action in the opening minutes of a trading session.
Key Features and Usage
1-Minute Candle High/Low: The indicator captures the high and low of the first 1-minute candle after the specified session start time. This level is marked with horizontal lines and labels, providing traders with an immediate reference for early-session price extremes.
5-Candle Range High/Low: After the first five candles, the indicator also highlights the highest and lowest levels within this range, offering additional support/resistance lines to aid in understanding early price movements.
Custom Labels and Dynamic Line Extension:
Labels update dynamically and display whether the 1-minute high/low coincides with the 5-minute range high/low, combining these labels if they match.
Horizontal lines extend to the current bar to remain visible throughout the session for consistent reference.
Customization Options
Colors and Label Text: Users can adjust colors for the 1-minute and 5-minute high/low lines and the label text for optimal readability.
Label Position Offset: Labels are placed slightly above or below their respective lines to avoid overlap with price action, maintaining clarity on the chart.
Intended Use
This indicator is especially useful for intraday traders focusing on opening range breakout strategies, scalping, or short-term trend analysis. It is intended for use on intraday charts (such as 1-minute or 5-minute intervals) and provides straightforward levels to assess early market structure.
Technical Details
Customization of Start Time: Users can change the default start time to any desired session opening time, adapting it to various markets or trading sessions.
Dynamic Line and Label Updates: Both lines and labels dynamically extend with the chart, while labels remain easy to read as they shift based on recent price action.
This script is designed to be simple yet powerful, offering key insights into session open levels without relying on predictive or lookahead features. It is useful for real-time analysis and adds value by helping traders identify critical levels in the market's early stages.
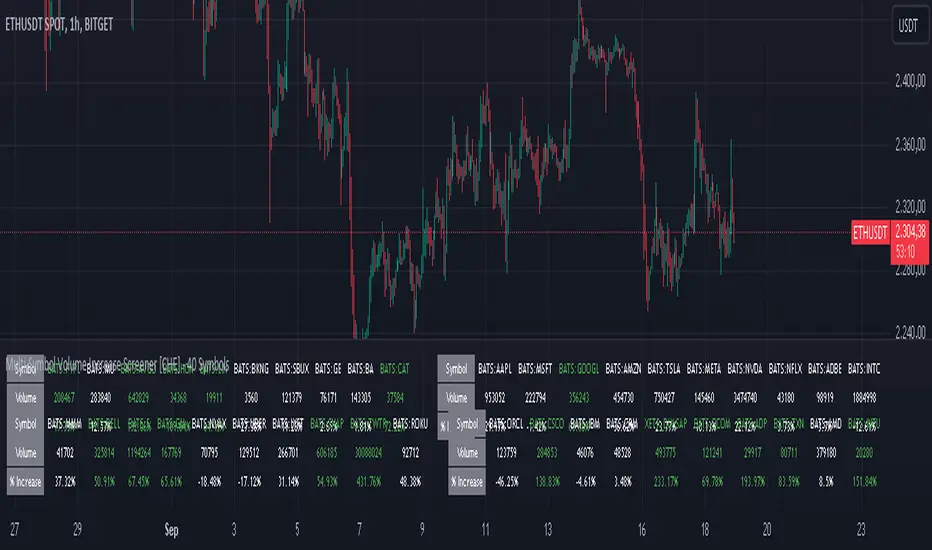
Multi-Symbol Volume Increase Screener [CHE] MultiSymbol Volume Increase Screener
Designed for TradingView
Presented by Chervolino
Introduction
Welcome to the presentation of the MultiSymbol Volume Increase Screener—a powerful tool designed to enhance your trading strategy on TradingView. Developed at the request of jscott143, this screener provides traders with realtime insights into significant volume movements across multiple symbols, enabling more informed and timely trading decisions.
Purpose and Objectives
Identify HighVolume Opportunities: Detect symbols experiencing a significant increase in volume compared to their historical average.
Monitor Multiple Symbols Simultaneously: Efficiently track up to five symbols in one view.
RealTime Alerts: Receive instant notifications when predefined volume conditions are met.
Comprehensive Overview: Display volume data and percentage increases in an organized table for easy analysis.
Key Features
1. MultiSymbol Monitoring
Track up to five different symbols simultaneously.
Customize the list of symbols based on your trading portfolio.
2. Volume Analysis
Compare current candle volume against the average volume over a specified period.
Calculate and display the percentage increase in volume.
3. RealTime Alerts
Set a volume increase multiplier (e.g., 1.5x) to trigger alerts.
Receive alerts via email, popup, or SMS when conditions are met.
4. UserFriendly Table Display
View symbols, their current volume, and percentage increase in a clear, concise table.
Colorcoded indicators highlight significant volume changes.
5. Customizable Parameters
Adjust the average volume period to suit different trading strategies.
Set your preferred volume increase multiplier for alerts.
How It Works
1. User Inputs:
Symbols Selection: Choose up to five symbols you wish to monitor.
Average Volume Period: Define the number of bars over which the average volume is calculated (default is 20).
Volume Increase Multiplier: Set the threshold for volume increase to trigger alerts (default is 1.5x).
2. Volume Calculation:
The screener fetches the current volume and calculates the simple moving average (SMA) of volume over the defined period for each symbol.
It then determines if the current volume exceeds the average volume by the specified multiplier.
3. Data Display:
A table is generated on the chart displaying each symbol, its current volume, and the percentage increase.
Green text indicates that the volume increase condition has been met.
4. Alert Generation:
When a symbol's current volume surpasses the average volume by the set multiplier, an alert is triggered.
Alerts are customizable and can be set to notify you through various channels.
Benefits
Enhanced DecisionMaking: Quickly identify highvolume trading opportunities across multiple assets.
Time Efficiency: Monitor several symbols without the need to switch between charts.
Proactive Trading: Stay informed with realtime alerts, allowing for timely trading actions.
Customization: Tailor the screener settings to align with your unique trading strategies and preferences.
Setup Instructions
1. Add the Screener to TradingView:
Navigate to TradingView and open the Pine Editor.
Add the MultiSymbol Volume Increase Screener indicator to your chart.
Save and apply the indicator.
2. Configure User Inputs:
Select up to five symbols you wish to monitor in the input fields "Symbol 1" to "Symbol 5".
Adjust the "Average Volume Period" and "Volume Increase Multiplier" as needed.
3. Set Up Alerts:
Click on the Alarm icon (🔔) in the TradingView toolbar.
In the "Condition" dropdown, select the "MultiSymbol Volume Increase Screener".
Choose the specific alert condition for each symbol (e.g., "Volume Increase Alert for Symbol 1").
Configure the alert actions (e.g., email, popup, SMS) and click "Create".
Repeat this process for each symbol you wish to monitor.
Visual Demonstration
Table Display Example:
| Symbol | Volume | % Increase |
| AAPL | 150,000 | 50.00% |
| MSFT | 120,000 | 20.00% |
| GOOGL | 180,000 | 80.00% |
| AMZN | 130,000 | 30.00% |
| TSLA | 160,000 | 60.00% |
Green Text: Indicates that the volume increase condition has been met for that symbol.
Alert Notification Example:
```
🚀 Symbol 1 shows a volume increase!
```
Note: Replace "Symbol 1" with the actual symbol as per your configuration.
Customization Options
Increase the Number of Symbols:
While the current screener monitors five symbols, it can be extended to monitor more by adding additional input fields and corresponding calculations. However, be mindful of TradingView's Pine Script limitations and potential performance impacts.
Adjust Volume Period and Multiplier:
Tailor the "Average Volume Period" and "Volume Increase Multiplier" to align with your specific trading strategies and market conditions.
Enhance Table Information:
Incorporate additional data points such as current price, price change percentage, or other technical indicators to enrich your analysis.
Benefits of Using the Screener
Efficiency: Saves time by providing a consolidated view of multiple symbols' volume activity.
Proactive Trading: Enables you to act swiftly on significant volume movements, which often precede price changes.
DataDriven Decisions: Facilitates informed trading decisions based on realtime volume analysis.
Customization: Offers flexibility to adapt the screener to various trading styles and preferences.
Conclusion
The MultiSymbol Volume Increase Screener is an invaluable tool for traders looking to capitalize on significant volume movements across multiple assets. Developed at the request of jscott143, this screener integrates seamlessly with TradingView, providing realtime insights and alerts to enhance your trading strategy.
Q&A
Feel free to ask any questions or request further customization to better suit your trading needs.
Contact Information
Created for: jscott143
Thank you for your attention!
Auto Volume Spread Analysis (VSA) [TANHEF]Auto Volume Spread Analysis (visible volume and spread bars auto-scaled): Understanding Market Intentions through the Interpretation of Volume and Price Movements.
All the sections below contain the same descriptions as my other indicator "Volume Spread Analysis" with the exception of 'Auto Scaling'.
█ Auto-Scaling
This indicator auto-scales spread bars to match the visible volume bars, unlike the previous "Volume Spread Analysis " version which limited the number of visible spread bars to a fixed count. The auto-scaling feature allows for easier navigation through historical data, enabling both more historical spread bars to be viewed and more historical VSA pattern labels being displayed without requiring using the bar replay tool. Please note that this indicator’s auto-scaling feature recalculates the visible bars on the chart, causing the indicator to reload whenever the chart is moved.
Auto-scaled spread bars have two display options (set via 'Spread Bars Method' setting):
Lines: a bar lookback limit of 500 bars.
Polylines: no bar lookback limit as only plotted on visible bars on chart, which uses multiple polylines are used.
█ Simple Explanation:
The Volume Spread Analysis (VSA) indicator is a comprehensive tool that helps traders identify key market patterns and trends based on volume and spread data. This indicator highlights significant VSA patterns and provides insights into market behavior through color-coded volume/spread bars and identification of bars indicating strength, weakness, and neutrality between buyers and sellers. It also includes powerful volume and spread forecasting capabilities.
█ Laws of Volume Spread Analysis (VSA):
The origin of VSA begins with Richard Wyckoff, a pivotal figure in its development. Wyckoff made significant contributions to trading theory, including the formulation of three basic laws:
The Law of Supply and Demand: This fundamental law states that supply and demand balance each other over time. High demand and low supply lead to rising prices until demand falls to a level where supply can meet it. Conversely, low demand and high supply cause prices to fall until demand increases enough to absorb the excess supply.
The Law of Cause and Effect: This law assumes that a 'cause' will result in an 'effect' proportional to the 'cause'. A strong 'cause' will lead to a strong trend (effect), while a weak 'cause' will lead to a weak trend.
The Law of Effort vs. Result: This law asserts that the result should reflect the effort exerted. In trading terms, a large volume should result in a significant price move (spread). If the spread is small, the volume should also be small. Any deviation from this pattern is considered an anomaly.
█ Volume and Spread Analysis Bars:
Display: Volume and spread bars that consist of color coded levels, with the spread bars scaled to match the volume bars. A displayable table (Legend) of bar colors and levels can give context and clarify to each volume/spread bar.
Calculation: Levels are calculated using multipliers applied to moving averages to represent key levels based on historical data: low, normal, high, ultra. This method smooths out short-term fluctuations and focuses on longer-term trends.
Low Level: Indicates reduced volatility and market interest.
Normal Level: Reflects typical market activity and volatility.
High Level: Indicates increased activity and volatility.
Ultra Level: Identifies extreme levels of activity and volatility.
This illustrates the appearance of Volume and Spread bars when scaled and plotted together:
█ Forecasting Capabilities:
Display: Forecasted volume and spread levels using predictive models.
Calculation: Volume and Spread prediction calculations differ as volume is linear and spread is non-linear.
Volume Forecast (Linear Forecasting): Predicts future volume based on current volume rate and bar time till close.
Spread Forecast (Non-Linear Dynamic Forecasting): Predicts future spread using a dynamic multiplier, less near midpoint (consolidation) and more near low or high (trending), reflecting non-linear expansion.
Moving Averages: In forecasting, moving averages utilize forecasted levels instead of actual levels to ensure the correct level is forecasted (low, normal, high, or ultra).
The following compares forecasted volume with actual resulting volume, highlighting the power of early identifying increased volume through forecasted levels:
█ VSA Patterns:
Criteria and descriptions for each VSA pattern are available as tooltips beside them within the indicator’s settings. These tooltips provide explanations of potential developments based on the volume and spread data.
Signs of Strength (🟢): Patterns indicating strong buying pressure and potential market upturns.
Down Thrust
Selling Climax
No Effort ➤ Bearish Result
Bearish Effort ➤ No Result
Inverse Down Thrust
Failed Selling Climax
Bull Outside Reversal
End of Falling Market (Bag Holder)
Pseudo Down Thrust
No Supply
Signs of Weakness (🔴): Patterns indicating strong selling pressure and potential market downturns.
Up Thrust
Buying Climax
No Effort ➤ Bullish Result
Bullish Effort ➤ No Result
Inverse Up Thrust
Failed Buying Climax
Bear Outside Reversal
End of Rising Market (Bag Seller)
Pseudo Up Thrust
No Demand
Neutral Patterns (🔵): Patterns indicating market indecision and potential for continuation or reversal.
Quiet Doji
Balanced Doji
Strong Doji
Quiet Spinning Top
Balanced Spinning Top
Strong Spinning Top
Quiet High Wave
Balanced High Wave
Strong High Wave
Consolidation
Bar Patterns (🟡): Common candlestick patterns that offer insights into market sentiment. These are required in some VSA patterns and can also be displayed independently.
Bull Pin Bar
Bear Pin Bar
Doji
Spinning Top
High Wave
Consolidation
This demonstrates the acronym and descriptive options for displaying bar patterns, with the ability to hover over text to reveal the descriptive text along with what type of pattern:
█ Alerts:
VSA Pattern Alerts: Notifications for identified VSA patterns at bar close.
Volume and Spread Alerts: Alerts for confirmed and forecasted volume/spread levels (Low, High, Ultra).
Forecasted Volume and Spread Alerts: Alerts for forecasted volume/spread levels (High, Ultra) include a minimum percent time elapsed input to reduce false early signals by ensuring sufficient bar time has passed.
█ Inputs and Settings:
Indicator Bar Color: Select color schemes for bars (Normal, Detail, Levels).
Indicator Moving Average Color: Select schemes for bars (Fill, Lines, None).
Price Bar Colors: Options to color price bars based on VSA patterns and volume levels.
Legend: Display a table of bar colors and levels for context and clarity of volume/spread bars.
Forecast: Configure forecast display and prediction details for volume and spread.
Average Multipliers: Define multipliers for different levels (Low, High, Ultra) to refine the analysis.
Moving Average: Set volume and spread moving average settings.
VSA: Select the VSA patterns to be calculated and displayed (Strength, Weakness, Neutral).
Bar Patterns: Criteria for bar patterns used in VSA (Doji, Bull Pin Bar, Bear Pin Bar, Spinning Top, Consolidation, High Wave).
Colors: Set exact colors used for indicator bars, indicator moving averages, and price bars.
More Display Options: Specify how VSA pattern text is displayed (Acronym, Descriptive), positioning, and sizes.
Alerts: Configure alerts for VSA patterns, volume, and spread levels, including forecasted levels.
█ Usage:
The Volume Spread Analysis indicator is a helpful tool for leveraging volume spread analysis to make informed trading decisions. It offers comprehensive visual and textual cues on the chart, making it easier to identify market conditions, potential reversals, and continuations. Whether analyzing historical data or forecasting future trends, this indicator provides insights into the underlying factors driving market movements.

Volume Spread Analysis [TANHEF]Volume Spread Analysis: Understanding Market Intentions through the Interpretation of Volume and Price Movements.
█ Simple Explanation:
The Volume Spread Analysis (VSA) indicator is a comprehensive tool that helps traders identify key market patterns and trends based on volume and spread data. This indicator highlights significant VSA patterns and provides insights into market behavior through color-coded volume/spread bars and identification of bars indicating strength, weakness, and neutrality between buyers and sellers. It also includes powerful volume and spread forecasting capabilities.
█ Laws of Volume Spread Analysis (VSA):
The origin of VSA begins with Richard Wyckoff, a pivotal figure in its development. Wyckoff made significant contributions to trading theory, including the formulation of three basic laws:
The Law of Supply and Demand: This fundamental law states that supply and demand balance each other over time. High demand and low supply lead to rising prices until demand falls to a level where supply can meet it. Conversely, low demand and high supply cause prices to fall until demand increases enough to absorb the excess supply.
The Law of Cause and Effect: This law assumes that a 'cause' will result in an 'effect' proportional to the 'cause'. A strong 'cause' will lead to a strong trend (effect), while a weak 'cause' will lead to a weak trend.
The Law of Effort vs. Result: This law asserts that the result should reflect the effort exerted. In trading terms, a large volume should result in a significant price move (spread). If the spread is small, the volume should also be small. Any deviation from this pattern is considered an anomaly.
█ Volume and Spread Analysis Bars:
Display: Volume and/or spread bars that consist of color coded levels. If both of these are displayed, the number of spread bars can be limited for visual appeal and understanding, with the spread bars scaled to match the volume bars. While automatic calculation of the number of visual bars for auto scaling is possible, it is avoided to prevent the indicator from reloading whenever the number of visual price bars on the chart is adjusted, ensuring uninterrupted analysis. A displayable table (Legend) of bar colors and levels can give context and clarify to each volume/spread bar.
Calculation: Levels are calculated using multipliers applied to moving averages to represent key levels based on historical data: low, normal, high, ultra. This method smooths out short-term fluctuations and focuses on longer-term trends.
Low Level: Indicates reduced volatility and market interest.
Normal Level: Reflects typical market activity and volatility.
High Level: Indicates increased activity and volatility.
Ultra Level: Identifies extreme levels of activity and volatility.
This illustrates the appearance of Volume and Spread bars when scaled and plotted together:
█ Forecasting Capabilities:
Display: Forecasted volume and spread levels using predictive models.
Calculation: Volume and Spread prediction calculations differ as volume is linear and spread is non-linear.
Volume Forecast (Linear Forecasting): Predicts future volume based on current volume rate and bar time till close.
Spread Forecast (Non-Linear Dynamic Forecasting): Predicts future spread using a dynamic multiplier, less near midpoint (consolidation) and more near low or high (trending), reflecting non-linear expansion.
Moving Averages: In forecasting, moving averages utilize forecasted levels instead of actual levels to ensure the correct level is forecasted (low, normal, high, or ultra).
The following compares forecasted volume with actual resulting volume, highlighting the power of early identifying increased volume through forecasted levels:
█ VSA Patterns:
Criteria and descriptions for each VSA pattern are available as tooltips beside them within the indicator’s settings. These tooltips provide explanations of potential developments based on the volume and spread data.
Signs of Strength (🟢): Patterns indicating strong buying pressure and potential market upturns.
Down Thrust
Selling Climax
No Effort → Bearish Result
Bearish Effort → No Result
Inverse Down Thrust
Failed Selling Climax
Bull Outside Reversal
End of Falling Market (Bag Holder)
Pseudo Down Thrust
No Supply
Signs of Weakness (🔴): Patterns indicating strong selling pressure and potential market downturns.
Up Thrust
Buying Climax
No Effort → Bullish Result
Bullish Effort → No Result
Inverse Up Thrust
Failed Buying Climax
Bear Outside Reversal
End of Rising Market (Bag Seller)
Pseudo Up Thrust
No Demand
Neutral Patterns (🔵): Patterns indicating market indecision and potential for continuation or reversal.
Quiet Doji
Balanced Doji
Strong Doji
Quiet Spinning Top
Balanced Spinning Top
Strong Spinning Top
Quiet High Wave
Balanced High Wave
Strong High Wave
Consolidation
Bar Patterns (🟡): Common candlestick patterns that offer insights into market sentiment. These are required in some VSA patterns and can also be displayed independently.
Bull Pin Bar
Bear Pin Bar
Doji
Spinning Top
High Wave
Consolidation
This demonstrates the acronym and descriptive options for displaying bar patterns, with the ability to hover over text to reveal the descriptive text along with what type of pattern:
█ Alerts:
VSA Pattern Alerts: Notifications for identified VSA patterns at bar close.
Volume and Spread Alerts: Alerts for confirmed and forecasted volume/spread levels (Low, High, Ultra).
Forecasted Volume and Spread Alerts: Alerts for forecasted volume/spread levels (High, Ultra) include a minimum percent time elapsed input to reduce false early signals by ensuring sufficient bar time has passed.
█ Inputs and Settings:
Display Volume and/or Spread: Choose between displaying volume bars, spread bars, or both with different lookback periods.
Indicator Bar Color: Select color schemes for bars (Normal, Detail, Levels).
Indicator Moving Average Color: Select schemes for bars (Fill, Lines, None).
Price Bar Colors: Options to color price bars based on VSA patterns and volume levels.
Legend: Display a table of bar colors and levels for context and clarity of volume/spread bars.
Forecast: Configure forecast display and prediction details for volume and spread.
Average Multipliers: Define multipliers for different levels (Low, High, Ultra) to refine the analysis.
Moving Average: Set volume and spread moving average settings.
VSA: Select the VSA patterns to be calculated and displayed (Strength, Weakness, Neutral).
Bar Patterns: Criteria for bar patterns used in VSA (Doji, Bull Pin Bar, Bear Pin Bar, Spinning Top, Consolidation, High Wave).
Colors: Set exact colors used for indicator bars, indicator moving averages, and price bars.
More Display Options: Specify how VSA pattern text is displayed (Acronym, Descriptive), positioning, and sizes.
Alerts: Configure alerts for VSA patterns, volume, and spread levels, including forecasted levels.
█ Usage:
The Volume Spread Analysis indicator is a helpful tool for leveraging volume spread analysis to make informed trading decisions. It offers comprehensive visual and textual cues on the chart, making it easier to identify market conditions, potential reversals, and continuations. Whether analyzing historical data or forecasting future trends, this indicator provides insights into the underlying factors driving market movements.

Alert Sender Library [TradingFinder]Library "AlertSenderLibrary_TradingFinder"
🔵 Introduction
The "Alert Sender Library" is a management and production program for "Alert Messages" that enables the creation of unique messages for any type of signal generated by indicators or strategies.
These messages include the direction of the signal, symbol, time frame, the date and time the condition was triggered, prices related to the signal, and a personal message from you. To make better and more optimal use of this "library", you should carefully study " Key Features" and "How to Use".
🔵 Key Features
Automatic Detection of Appropriate Type :
Using two parameters, "AlertType" and "DetectionType", which you must enter at the beginning into the "AlertSender" function, the type of the alert message is determined.
For example, if you select one of the "DetectionType"s such as "Order Block Signal", "Signal", and "Setup", your alert type will be chosen based on "Long" and "Short". Whether it's "Long" or "Short" depends on the "AlertType" you have set to either "Bullish" or "Bearish".
Automatic Symbol Detection :
Whenever you add an alert for a specific symbol, if you want the name of that symbol to be in your message text, you must manually write the name of the symbol in your message. One of the capabilities of the "Alert Sender" is the automatic detection of the symbol and adding it to the message text.
Automatic Time Frame Detection :
When adding your alert, the "Alert Sender" detects the time frame of the symbol you intend to add the alert for and adds it to the text. This feature is very practical and can prevent traders from making mistakes.
For example, a trader might add alerts for a specific symbol using a specific indicator in different time frames, taking the main signal in the 1-hour time frame and only a confirmation signal in the 15-minute time frame. This feature helps to identify in which time frame the signal is set.
Detection of Date and Time When the Signal is Triggered :
You can have the date and time at the moment the message is sent. This feature has various uses. For example, if you use the Webhook URL feature to send messages to a Telegram channel, there might be issues with alert delivery on your server, causing delays, and you might receive the message when it has lost its validity.
With this feature, you can match the sending time of the message from TradingView with the receipt time in your messenger and detect if there is a delay in message delivery.
Important :
You can also set the Time Zone you wish to receive the date and time based on.
Display of "Key Prices" :
Key prices can vary based on the type of signals. For example, when the "DetectionType" is in "Order Block Signal" mode, the key prices are the "Distal" and "Proximal" prices. Or if the "DetectionType" is in "Setup" mode, the key prices are "Entry", "Stop Loss", and "Take Profit".
Receipt of Personal "Messages" :
You can enter your personal message using "input.string" or "input.text_area" in addition to the messages that are automatically created.
Beautiful and Functional Display of Messages :
The titles of messages sent by "AlertSender" are displayed using related emojis to prevent mistakes due to visual errors, enhancing beauty.
🔵 How to Use
🟣 Familiarity with Function and Parameters
AlertSender(Condition, Alert, AlertName, AlertType, DetectionType, SetupData, Frequency, UTC, MoreInfo, Message, o, h, l, c, Entry, TP, SL, Distal, Proximal)
Parameters:
- Condition (bool)
- Alert (string)
- AlertName (string)
- AlertType (string)
- DetectionType (string)
- SetupData (string)
- Frequency (string)
- UTC (string)
- MoreInfo (string)
- Message (string)
- o (float)
- h (float)
- l (float)
- c (float)
- Entry (float)
- TP (float)
- SL (float)
- Distal (float)
- Proximal (float)
To add "Alert Sender Library", you must first add the following code to your script.
import TFlab/AlertSenderLibrary_TradingFinder/1
🟣 Parameters
"Condition" : This parameter is a Boolean. You need to set it based on the condition that, when met (or fired), you want to receive an alert. The output should be either "true" or "false".
"Alert" : This parameter accepts one of two inputs, "On" or "Off". If set to "On", the alarm is active; if "Off", the alarm is deactivated. This input is useful when you have numerous alerts in an indicator or strategy and need to activate only a few of them. "Alert" is a string parameter.
Alert = input.string('On', 'Alert', , 'If you turn on the Alert, you can receive alerts and notifications after setting the "Alert".', group = 'Alert')
"AlertName" : This is a string parameter where you can enter the name you choose for your alert.
AlertName = input.string('Order Blocks Finder ', 'Alert Name', group = 'Alert')
"AlertType" : The inputs for this parameter are "Bullish" or "Bearish". If the condition selected in the "Condition" parameter is of a bullish bias, you should set this parameter to "Bullish", and if the condition is of a bearish bias, it should be set to "Bearish". "AlertType" is a string parameter.
"DetectionType" : This parameter's predefined inputs include "Order Block Signal", "Signal", "Setup", and "Analysis". You may provide other inputs, but some functionalities, like "Key Price", might be lost. "DetectionType" is a string parameter.
"SetupData" :
If "DetectionType" is set to "Setup", you must specify "SetupData" as either "Basic" or "Full". In "Basic" mode, only the "Entry" price needs to be defined in the function, and "TP" (Take Profit) and "SL" (Stop Loss) can be any number or NA. In "Full" mode, you need to define "Entry", "SL", and "TP". "Setup" is a string parameter.
"Frequency" : This string parameter defines the announcement frequency. Choices include: "All" (activates the alert every time the function is called), "Once Per Bar" (activates the alert only on the first call within the bar), and "Once Per Bar Close" (the alert is activated only by a call at the last script execution of the real-time bar upon closing). The default setting is "Once per Bar".
Frequency = input.string('Once Per Bar', 'Message Frequency', , 'The triggering frequency. Possible values are: All (all function calls trigger the alert), Once Per Bar (the first function call during the bar triggers the alert), Per Bar Close (the function call triggers the alert only when it occurs during the last script iteration of the real-time bar, when it closes). The default is alert.freq_once_per_bar.', group = 'Alert')
"UTC" : With this parameter, you can set the Time Zone for the date and time of the alert's dispatch. "UTC" is a string parameter and can be set as "UTC-4", "UTC+1", "UTC+9", or any other Time Zone.
UTC = input.string('UTC', 'Show Alert time by Time Zone', group = 'Alert')
"MoreInfo" : This parameter can take one of two inputs, "On" or "Off", which are strings. Additional information, including "Time" and "Key Price", is included. If set to "On", this information is received; if "Off", it is not displayed in the sent message.
MoreInfo = input.string('On', 'Display More Info', , group = 'Alert')
"Message" : This parameter captures the user's personal message through an input and displays it at the end of the sent message. It is a string input.
MessageBull = input.text_area('Long Position', 'Long Signal Message', group = 'Alert') MessageBear = input.text_area('Short Position', 'Short Signal Message', group = 'Alert')
"o" (Open Price): A floating-point number representing the opening price of the candle. This input is necessary when the "DetectionType" is set to "Signal". Otherwise, it can be any number or "na".
"h" (High Price): A float variable for the highest price of the candle. Required when "DetectionType" is "Signal"; in other cases, any number or "na" is acceptable.
"l" (Low Price): A float representing the lowest price of the candle. This field must be filled if "DetectionType" is "Signal". If not, it can be any number or "na".
"c" (Close Price): A floating-point variable indicating the closing price of the candle. Needed for "Signal" type detections; otherwise, it can take any value or "na".
"Entry" : A float variable indicating the entry price into a trading setup. This is relevant when "DetectionType" is in "Setup" mode. In other scenarios, it can be any number or "na". It denotes the price at which the trade setup is entered.
"TP" (Take Profit): A float that is necessary when "DetectionType" is "Setup" and "SetupData" is "Full". Otherwise, it can be any number or "na". It signifies the price target for taking profits in a trading setup.
"SL" (Stop Loss): A float required when "DetectionType" is "Setup" and "SetupData" is "Full". It can be any number or "na" in other cases. This value represents the price at which a stop loss is set to limit losses.
"Distal" : A float important for "Order Block Signal" detection. It can be any number or "na" if not in use. This variable indicates the price reaching the distal line of an order block.
"Proximal" : A float needed for "Order Block Signal" detection mode. It can take any value or "na" otherwise. It marks the price reaching the proximal line of an order block.

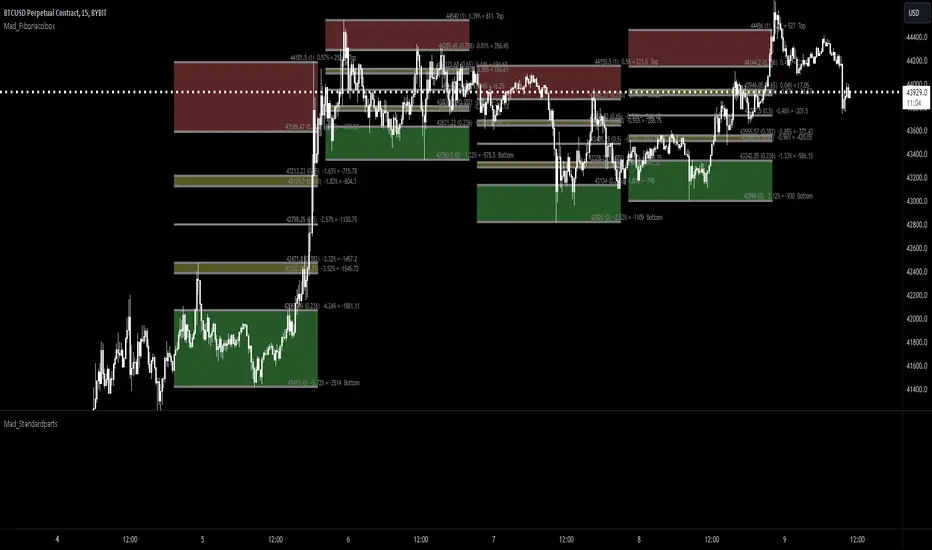
Mad_FibonacciboxLibrary "Mad_Fibonaccibox"
This library is designed to create and manage multiple Fibonacci boxes, which are graphical representations based on the inputs.
-----------------
exports:
f_fib_calc(_Fibonacci_box, _itemnumber)
fibonacci calc.
@description This function block uses the levels and paramters set into the type_fibonacci_box(levels) and fills the corresponding array of prices.
Parameters:
_Fibonacci_box (type_Fibonacci_box )
_itemnumber (int)
Returns: returns a type_Fibonacci_box with the filled data
f_fib_draw(_Fibonacci_box, _itemnumber)
fibonacci draw.
@description This function block uses the levels, prices and paramters set into the type_fibonacci_box(levels) and draws the fib on the chart
Parameters:
_Fibonacci_box (type_Fibonacci_box )
_itemnumber (int)
Returns: returns lines labels and fills on the chart, no data returns
type_level
s for defining a lines and texts of a fibonacci box
Fields:
level (series float)
price (series float)
drawline (series bool)
linewidth (series int)
linetype (series string)
fiblinecolor (series color)
drawlabel (series string)
labeltext (series string)
textshift (series int)
fibtextcolor (series color)
fibtextsize (series string)
transp (series int)
type_fill
s for defining the fills of a fibonaccibox
Fields:
partner_A (series int)
partner_B (series int)
fill_color (series color)
transp (series int)
type_Fibonacci_box
s for defining a fibonacci box
Fields:
bottom_price (series float)
top_price (series float)
StartBar (series int)
StopBar (series int)
levels (type_level )
fills (type_fill )
ChartisLog (series bool)
fibreverse (series bool)
fibdrawreverse (series bool)
decimals_price (series int)
decimals_percent (series int)
drawlines (series bool)
drawlabels (series bool)
drawfills (series bool)
draw_biginfo (series bool)
biginfo_textshift (series int)
rangeinfo_location (series int)
rangeinfo_color (series color)
rangeinfo_textsize (series string)
line_array (line )
linefill_array (linefill )
label_array (label )
YD_Divergence_RSI+CMFThe ‘YD_Divergence_RSI+CMF’ indicator can find divergence using RSI (Relative Strength Index) and CMF (Chaikin Money Flow) indicators.
📌 Key functions
1. Search pivot high and pivot low points in a certain length of price.
2. Connect pivot high to pivot high , pivot low to pivot low , forming two standards for divergence in result.
The marker then plots only the higher high, lower low lines.
(higher low and lower high in prices are referred to hidden divergence, which are not considered in this indicator)
3. Compare the two standards with RSI and CMF indicators, send an alert if there is a divergence. As a result, the indicator will find four combination of divergence.
A. Higher high price / Lower RSI (Bearish RSI Divergence)
B. Lower low price / Higher RSI (Bullish RSI Divergence)
C. Higher high price / Lower CMF (Bearish CMF Divergence)
D. Lower low price / Higher CMF (Bullish CMF Divergence)
📌 Details
Developing the indicators, we put a lot of effort in making a customizable and user-friendly interface.
#1. Pivot Setting
Users can set the length to find the pivot high / pivot low in ‘Pivot Settings – Pivot Length.’
Increased pivot Length takes more candles to interpret the chart but reduce false signals since the it uses only the most certain pivot high / pivot low values. Obviously, decreased pivot length will act the opposite.
Users can choose whether to use ‘High/Low’ or ‘Close’ in ‘Pivot Reference’ to set the swing point of prices.
Users can also choose whether to display the pivot high / pivot low marker on the chart.
#2 RSI & CMF Settings
Users can adjust the length of RSI & CMF separately. (The default values are set to 14 and 20 each.)
#3 Label Setting
Users can adjust the text displayed on the chart label. (The default values is set to ‘Bullish / Bearish’, ‘RSI/CMF’, ‘Divergence’.)
Users can reduce the length of text label or simply turn the label off. Just click the ‘Bull/Bear’ or ‘None’ button. ‘Divergence’ works the same.
Users can decide whether to display the ‘Divergence Line and Label’, set custom settings for the label and line. (color, thickness, style, etc)
📌 Alert
Alert are provided as a combination of the chart's symbol and the set label text. For example,
‘BINANCE:BTCUSDT.P, Bullish RSI Divergence’
====================================================
"YD_Divergence_RSI+CMF" 지표 는 RSI와 CMF 지표를 이용해서 Divergence 를 찾아낼 수 있습니다.
📌 주요 기능
1. 정해진 가격 움직임 안에서 pivot high와 pivot low 포인트 를 찾아냅니다.
2. Pivot high로만 이어진 라인과, Pivot low로만 이어진 두 라인을 작도한 뒤 divergence의 기준으로 삼습니다.
이 지표에서는 normal divergence만 사용하기 때문에 차트에 higher high와 lower low만 표기 합니다.
(higher low와 lower high는 hidden divergence로 정의되며, 이 지표에서는 다루지 않습니다.
3. 두 기준선과 RSI, CMF 지표를 각각 비교하고, 결과적으로 4개의 조합을 구할 수 있습니다.
A. Higher high price / Lower RSI (Bearish RSI Divergence)
B. Lower low price / Higher RSI (Bullish RSI Divergence)
C. Higher high price / Lower CMF (Bearish CMF Divergence)
D. Lower low price / Higher CMF (Bullish CMF Divergence)
📌 세부 사항
지표를 개발하며 사용자들이 원하는 방향으로 지표를 설정할 수 있게 작업에 많은 공을 들였습니다. 굉장히 다양한 옵션을 선택할 수 있으며, 원하는 방식으로 지표를 사용할 수 있습니다.
#1 Pivot Setting
Pivot setting에서는 Pivot Length를 변경할 수 있습니다.
Pivot Length를 늘릴 경우, 보다 확실한 Swing High와 Swing Low만을 사용하게 되므로, False signal이 줄어들 수 있습니다. 하지만 Swing High/ Low를 판정하는 데에 더 긴 시간이 걸리게 되므로, Signal이 다소 늦게 발생하는 단점이 생기게 됩니다.
Pivot Length를 줄일 경우, 반대로 Swing High/Low의 판정이 더 빨리 일어나기 때문에, Signal을 거래에 이용하기는 좋을 수 있습니다. 다만, Swing High와 Low가 훨씬 더 잦은 빈도로 발생하기 때문에 False Signal을 줄 가능성이 높아집니다.
Pivot Reference에서는 가격의 Swing Point를 설정함에 있어, High/Low(고가/저가)를 이용할 지 Close (종가)를 이용할 지 선택할 수 있습니다.
Pivot High/Low Marker를 선택할 경우 Pivot High/ Low에 Marker가 찍히게 됩니다.
#2 RSI와 CMF Setting
RSI와 CMF Setting에서는 RSI와 CMF의 길이를 각각 설정할 수 있습니다. 기본값은 14와 20으로 설정되어 있습니다.
#3 Label Setting
Label Setting에서는 Label에 표시되는 글자를 선택할 수 있습니다.
기본값은 "Bullish / Bearish", "RSI/CMF", "Divergence"로 선택되어 있으며, 너무 길다고 느껴질 경우 "Bull/Bear" 혹은 "None"을 클릭하여 길이를 줄일 수 있습니다. 마찬가지로 Divergence의 경우도 생략이 가능합니다.
하단에서는 Divergence Line과 Label을 켜고 끌 수 있으며, 선의 색깔, 굵기, 종류, 그리고 Label의 색깔, 크기, 종류를 선택할 수 있습니다. Label의 Text 색 역시 변경이 가능합니다.
📌 얼러트
얼러트는 자신이 설정한 차트의 심볼과 Label의 문구의 조합으로 제공되며 예를 들면 다음과 같습니다.
"BINANCE:BTCUSDT.P, Bullish RSI Divergence"

ICT Macros [LuxAlgo]The ICT Macros indicator aims to highlight & classify ICT Macros, which are time intervals where algorithmic trading takes place to interact with existing liquidity or to create new liquidity.
🔶 SETTINGS
🔹 Macros
Macro Time options (such as '09:50 AM 10:10'): Enable specific macro display.
Top Line , Mid Line , Bottom Line and Extending Lines options: Controls the lines for the specific macro.
🔹 Macro Classification
Length : A length to detect Market Structure Brakes and classify macro type based on detection.
Swing Area : Swing or Liquidity Area selection, highest/lowest of the wick or the candle bodies.
Accumulation , Manipulation and Expansion color options for the classified macros.
🔹 Others
Macro Texts : Controls both the size and the visibility of the macro text.
Alert Macro Times in Advance (Minutes) : This option will plot a vertical line presenting the start of the next macro time. The line will not appear all the time, but it will be there based on remaining minutes specified in the option.
Daylight Saving Time (DST) : Adjust time appropriate to Daylight Saving Time of the specific region.
🔶 USAGE
A macro is a way to automate a task or procedure which you perform on a regular basis.
In the context of ICT's teachings, a macro is a small program or set of instructions that unfolds within an algorithm, which influences price movements in the market. These macros operate at specific times and can be related to price runs from one level to another or certain market behaviors during specific time intervals. They help traders anticipate market movements and potential setups during specific time intervals.
To trade these effectively, it is important to understand the time of day when certain macros come into play, and it is strongly advised to introduce the concept of liquidity in your analysis.
Macros can be classified into three categories where the Macro classification is calculated based on the Market Structure prior to macro and the Market Structure during the macro duration:
Manipulation Macro
Manipulation macros are characterized by liquidity being swept both on the buyside and sellside.
Expansion Macro
Expansion macros are characterized by liquidity being swept only on the buyside or sellside. Prices within these macros are highly correlated with the overall trend.
Accumulation Macro
Accumulation macros are characterized by an accumulation of liquidity. Prices within these macros tend to range.
The script returns the maximum/minimum price values reached during the macro interval alongside the average between the maximum/minimum and extends them until a new macro starts. These levels can act as supports and resistances.
🔶 DETAILS
All required data for the macro detection and classification is retrieved using 1 minute data sets, this includes candles as well as pivot/swing highs and lows. This approach guarantees the visually presented objects are same (same highs/lows) on higher timeframes as well as the macro classification remain same as it is in 1 min charts.
8 Macros can be displayed by the script (4 are enabled by default):
02:33 AM 03:00 London Macro
04:03 AM 04:30 London Macro
08:50 AM 09:10 New York Macro
09:50 AM 10:10 New York Macro
10:50 AM 11:10 New York Macro
11:50 AM 12:10 New York Launch Macro
13:10 PM 13:40 New York Macro
15:15 PM 15:45 New York Macro
🔶 ALERTS
When an alert is configured, the user will have the ability to be notified in advance of the next Macro time, where the value specified in 'Alert Macro Times in Advance (Minutes)' option indicates how early to be notified.
🔶 LIMITATIONS
The script is supported on 1 min, 3 mins and 5 mins charts.
🔶 RELATED SCRIPTS

Correlation prix [SP500, TESLA, BTCBefore you see this post I want to thank all the TradingView team. Every day that passes I learn better and better to use Pine script and I owe this to all those who publish and to the philosophy of TradingView. Thanks from Amos
This trading indicator compares the prices of the S&P 500 Index (SP500), Tesla (TSLA), and Bitcoin (BTC) to find correlations between them. To make the prices of SP500 and Tesla comparable to the price of Bitcoin, the indicator multiplies the closing price of Tesla by 114 and the closing price of the S&P 500 Index by 5.6.
In this way we can superimpose the prices on the BTC chart and see what happens.
Average BTC price/ tesla price = 114, so if we multiply the tesla price by 114 times we can superimpose it on the BTC price
At average BTC/SPX price = 5.6, also in this case we multiply the price of SPX by 5.6 to overlay the graph and see any correlations.
The indicator then calculates the average price between SP500 and Tesla, using the formula (SP500 + Tesla) / 2. This calculation creates a new line on the chart that represents the average price between these two assets.
The BTC_SP_TE variable is then calculated as the average of the closing price of Bitcoin and the previously calculated average price of SP500 and Tesla, using the formula (Btc + SP_TE) / 2. This calculation creates another line on the chart that represents the average price between Bitcoin and the previously calculated average between SP500 and Tesla.
The idea behind calculating these averages is to find correlations and patterns between the prices of these assets, which can help identify potential trading opportunities. By comparing the average prices of different assets, the trader can look for trends and patterns that might not be apparent when looking at each asset individually.
The indicator plots these prices on a chart and fills the area between them with either green or fuchsia, depending on which one is higher. The strategy suggests buying Bitcoin when the average price of SP500 and Tesla is higher than the current price of Bitcoin, and selling when it is lower.
To add visual cues to the trading strategy, the indicator uses the plotchar function to display a small triangle below the chart when it detects a potential buying opportunity. This is done with the following parameters:
Value: BTC_SP_TE < Btc and Btc > Btc1 and Btc1 > Btc , which is a logical expression that checks whether the average price of SP500 and Tesla is less than the current price of Bitcoin (BTC_SP_TE < Btc), and whether the current price of Bitcoin is higher than the price 10 bars ago (Btc > Btc1 ) and higher than the price on the previous bar (Btc1 > Btc ).
Text: "Moyen BTC_SP_Te", which is the text to display inside the marker.
Symbol: "▲", which is the symbol to use for the marker. In this case, it is a small triangle pointing upwards.
Location: location.belowbar, which specifies that the marker should be placed below the bar.
I hope this is an example of how to create an indicator on TradingView, remember that correlations do not always last, it is possible that when you see the graph this correspondence no longer exists, do your studies and get inspired.

Liquidation_linesLibrary "Liquidationline"
f_calculateLeverage(_leverage, _maintainance, _value, _direction)
Parameters:
_leverage
_maintainance
_value
_direction
f_liqline_update(_Liqui_Line, _killonlowhigh)
Parameters:
_Liqui_Line
_killonlowhigh
f_liqline_draw(_Liqui_Line, _priceorliq)
Parameters:
_Liqui_Line
_priceorliq
f_liqline_add(_Liqui_Line, linetoadd, _limit)
Parameters:
_Liqui_Line
linetoadd
_limit
Liquidationline
Fields:
creationtime
stoptime
price
leverage
maintainance
line_active
line_color
line_thickness
line_style
line_direction
line_finished
text_active
text_size
text_color
this library can draw typical liquidation lines, which can be called e.g. by indicator signals
You can see the default implementation in the lower part of the code, starting with RUNTIME
Don't forget to increase max lines to 500 in your script.
It can look like this screenshot here, with only minor changes to your executing script.
The base is the same

Nifty36ScannerThis code is written for traders to be able to automatically scan 36 stocks of their choice for MACD , EMA200 + SuperTrend and Half Trend . Traders can be on any chart, and if they keep this scanner/indicator on , it will start displaying stocks meeting scanning criteria on the same window without having to go to Screener section and running it again and again. It will save time for traders and give them real time signals.
Indicators for scanning stocks are:
MACD
EMA200
Supertrend
HalfTrend - originally developed by EVERGET
Combination of EMA200 crossover/under and MACD crossover/under has worked well for me for long time, so using this combination as one of the criteria to
Scan the stocks. Using Everget's Half Trend method confirms the signal given by MACD , EMA200 and Supertrend Crossover.
I have added 36 of my favourite stocks from Nifty 50 lot. Users of this script can use the same stocks or change it by going into the settings of this scanner.
The Code is divided into 3 Sections
Section 1: Accepting input from users as boolean so that they can scan on the basis of one of the criteria or any combination of the criteria.
Section 2: "Screener function" to calculate Buy/ Sell on the basis of scanning criteria selected y the user.
screener=>
= ta.supertrend(2.5,10)
Buy/Sell on the basis of Supertrend crossing Close of the candle
//using ta.macd function to calculate MACD and Signal
= ta.macd(close, 12, 26, 9)
using HalfTrend indicator to calculate Buy/Sell signals , removed all the plotting functions from the code of Half Trend
Bringing Stock Symbols in S series variables
s1=input.symbol('NSE:NIFTY1!', title='Symbol1', group="Nifty50List", inline='0')
Assigning Bull/Bear ( Buy/Sell) signals to each stocks selected
=request.security(s1, tf, screener())
Assign BUY to all the stocks showing Buy signals using
buy_label1:= c1?buy_label1+str.tostring(s1)+'\n': buy_label1
Follow the same process for SELL Signals
Section 3: Plotting labels for the BUY/SELL result on the in terms of label for any stocks meeting the criteria with deletion of any previous signals to avoid clutter on the chart with so many signals generated in each candle
Display Buy siganaling stocks in teh form of label using Label.new function with parameters as follows:
barindex
close as series
color
textcolor
style as label_up,
yloc =price
textalign=left
Delete all the previous labels
label.delete(lab_buy )
STOCKS SELECTION
We have given range f 36 stocks from NIFTY 50 that can be selected at anytime,. User can chose their own 36 stocks using setting button.
INDICATORS SELECTION
1. MACD: It i sone of the most reliable trading strategy with 39.3% Success rate with 1.187 as profit factor for NIFTY Index on Daily time frame
2. EAM200 + Super trend : Combination of EMA200 crossover and Super trend removes any false positives and considered a very reliable way of scanning for Buy/Sell signals
3. HALF TREND: Originally developed as an indicator by Everget and modified as strategy by AlgoMojo, it generates Buy/Sell signals with 40.2% success rate with 1.469 as profit faction, on 15 minutes timeframe.

High Impact NewsDo you have a difficult time remembering high-impact news events throughout the trading week? Now there is an indicator that allows the user to put labels directly on their charts at specific times in the future so news events won’t sneak up on the user.
Description
The “High Impact News” TradingView indicator by Infinity Trading gives the user complete control of three labels that can be set to any time and day of the trading week, even in the future. Each label can be displayed at a specific time, on a unique day of the week, and with custom text. Also, each label has a choice of over 20 emojis to display on the chart along with user-defined text. The text color and size can be independently adjusted.
The position of the labels on the chart can be easily moved up or down with 5 built-in presents: Current Week High, Current Day High, Current Price, Current Day Low, and Current Week Low. Additionally, each label has a separate buffer that allows the users to move the label up or down in increments of five. All of these user-controls ensure the labels are exactly where the user wants them on their charts.
Limitations
This indicator displays labels in the future. TradingView sets a limit of 500 bars/candles in the future you can interact on. This TradingView limit means that labels can only be drawn 500 candles in the future on any timeframe. On larger timeframes this is not a problem and one trading week can easily display any labels. But on smaller timeframes labels multiple days in the future will exceed the 500 candle limit. When a label exceeds the 500 candle limit the indicator will have a temporary error. THIS IS NOT A PROBLEM. Simply go back to a higher timeframe or wait until the label is within 500 candles. All of your Settings will be saved! This is just a limit placed by TradingView that cannot be overwritten.
Important Notice
As stated above, this indicator draws labels in the future on your charts. To achieve future labels, this indicator draws labels in the present and shifts them to the right (which is the future) certain number of bars. Please be aware of the following characteristics of this indicator:
Labels will not appear until after midnight EST on Monday of each trading week
Labels will not appear over the weekends
Labels set to “Monday” won’t appear until midnight EST on Monday (or later)
Labels set to “Tuesday” through “Friday” won’t appear until the time specified in the Settings on Monday. For example, a FOMC label set to 2pm EST on Wednesday will not appear on the chart until 2pm EST on Monday
On 1-Hour or 2-Hour charts, please note that labels with a non-hour time will be shifted slightly so they appear on the chart. For example, a label at 8:15 am on the 5-min chart will be adjusted to 8:00 am on the 1-Hour chart so the label will appear
The above characteristics are a result of having to draw the labels at a specified time (of the trading week) and then calculating how many bars it takes to get the label to the correct time in the future.

MakeLoveNotWarLibrary "MakeLoveNotWar"
Make Love Not War, place a flag of support on your chart!
flag(pos, text_size) Make Love Not War function.
Parameters:
pos : string, position.
text_size : string, text size.
Returns: table.
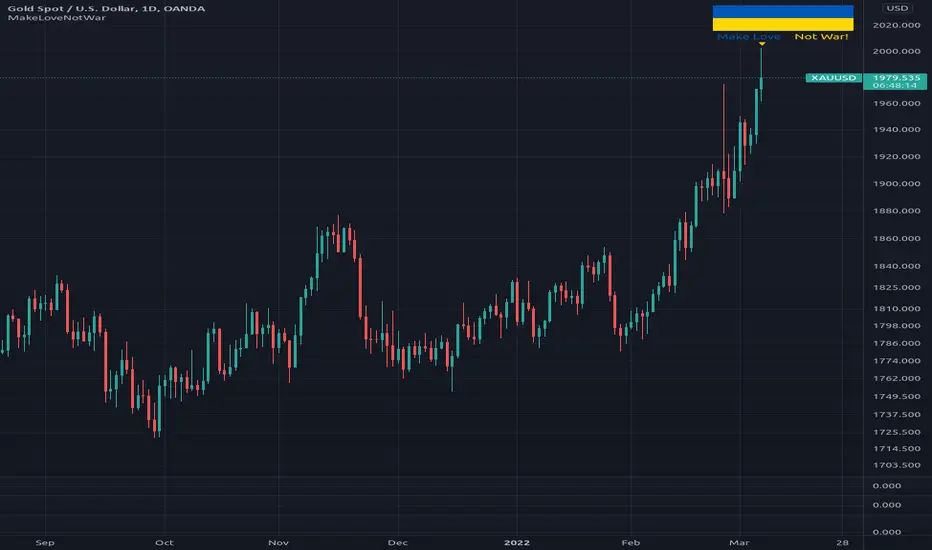
Double SupertrendThis strategy is based on a custom indicator that was created based on the Supertrend indicator. At its core, there are always 2 super trend indicators with different factors to reduce market noise (false signals).
The strategy/indicator has some parameters to improve the signals and filters.
TECHNICAL ANALYSIS
☑ Show Indicators
This option will enable/disable the Supertrend indicators on the chart.
☑ Length
The length will be used on the Supertrend Indicator to calculate its values.
☑ Dev Fast
The fast deviation or factor from one of the super trend indicators. This will be the leading indicator for entry signals, as well as for the exit signals.
☑ Dev Slow
The slow deviation or factor from one of the super trend indicators. This will be the confirmation indicator for entry and exit signals.
☑ Exit Type
It's possible to select from 4 options for the exit signals. Exit signals always take profit target.
☑ ⥹ Reversals
This option will make the strategy/indicator calculate the exit signals based on the difference between the given period's highest and lowest candle value (see Period on this list). It's displayed on the chart with the cross. As it's possible to verify in the image below, there are multiple exit spots for every entry.
☑ ⥹ ATR
Using ATR as a base indicator for exit signals will make the strategy/indicator place limit/stop orders. Candle High + ATR for longs, Candle Low - ATR for shorts. The strategy will show the ATR level for take profit and stick with it until the next signal. This way, the take profit value remains based on the candle of the entry signal.
☑ ⥹ Fast Supertrend
With this option selected, the exit signals will be based on the Fast Supertsignal value, mirrored to make a profit.
☑ ⥹ Slow Supertrend
With this option selected, the exit signals will be based on the Slow Supertsignal value, which is mirrored to take profit.
☑ Period
This will represent the number of candles used on the exit signals when Reversals is selected as Exit Type. It's also used to calculate the gradient used on the Fills and Supertrend signals.
☑ Multiplier
It's used on the take profit when the ATR option is selected on the Exit Type.
STRATEGY
☑ Use The Strategy
This will enable/disable the strategy to show the trades calculations.
☑ Show Use Long/Short Entries
Option to make the strategy show/use Long or Short signals. Available only if Use The Strategy is enabled
☑ Show Use Exit Long/Short
Option to make the strategy show/use Exit Long or Short signals (valid when Reversals option is selected on the Exit Type). Available only if Use The Strategy is enabled
☑ Show Use Add Long/Short
Option to make the strategy show/use Add Long or Short signals. With this option enabled, the strategy will place multiple trades in the same direction, almost the same concept as a pyramiding parameter. It's based on the Fast Supersignal when the candle fails to cross and reverses. Available only if Use The Strategy is enabled
☑ Trades Date Start/End
The date range that the strategy will check the market data and make the trades
HOW TO USE
It's very straightforward. A long signal will appear as a green arrow with a text Long below it. A short signal will appear as a red arrow with a text Short above it. It's ideal to wait for the candle to finish to validate the signal.
The exit signals are optional but give a good idea of the configuration used when backtesting. Each market and timeframe will have its own configuration for the best results. On average, sticking to ATR as an exit signal will have less risk than the other options.
☑ Entry Signals
Follow the arrows with Long/Short texts on them. Wait for the signal candle to close to validate the entry.
☑ Exit Signals
Use them to close your position or to trail stop your orders and maximize profits. Select the exit type suitable for each timeframe and market
☑ Add Entries
It's possible to increase the position following the add margin/contracts based on the Add signals. Not mandatory, but may work as reentries or late entries using the same signal.
☑ What about Stop Loss?
The stop-loss levels were not included as a separated signal because it's already in the chart. There are some possible ideas for the stop loss:
☑⥹ Candle High/Low (2nd recommend option)
When it's a Long signal from the entry signal candle, the stop loss can be the Low value of the same candle. Very tight stop loss in some cases, depending on the candle range
☑⥹ Local Top/Bottom
Selecting the local top/bottom as stop loss will give the strategy more room for false breakouts or reversals, keeping the trade open and minimizing noises. Increases the risk
☑⥹ Fast Supertrend (1st recommend option)
The fast supertrend can be used as stop-loss as well. making it a moving level and working close to trail stop management
☑⥹ Fixed Percentage
It's possible to use a fixed risk percentage for the trades, making the risk easier to control and project. Since the market volatility is not fixed, this may affect the accuracy of the trades
☑⥹ Based on the ATR (3rd recommend option)
When the exit type option ATR is selected, it will display the take profit level for that entry. Just mirror that value and put it as stop-loss, or multiply that amount by 1.5 to have more room for market noise.
EXAMPLE CONFIGURATIONS
Here are some configuration ideas for some markets (all of them are from crypto, especially futures markets)
BTCUSDT 15min - Default configuration
BTCUSDT 1h - Length 10 | Dev Fast 3 | Dev Slow 4 | Exit Type ATR | Period 50 | Multiplier 1
BTCUSDT 4h - Length 10 | Dev Fast 2 | Dev Slow 4 | Exit Type ATR | Period 50 | Multiplier 1
ETHUSDT 15min - Length 20 | Dev Fast 1 | Dev Slow 3 | Exit Type Fast Supertrend | Period 50 | Multiplier 1
IOTAUSDT 15min - Length 10 | Dev Fast 1 | Dev Slow 2 | Exit Type Slow Supertrend | Period 50 | Multiplier 1
OMGUSDT 15min - Length 10 | Dev Fast 1 | Dev Slow 4 | Exit Type Slow Supertrend | Period 50 | Multiplier 1
VETUSDT 15min - Length 10 | Dev Fast 3 | Dev Slow 4 | Exit Type Slow Supertrend | Period 50 | Multiplier 1
HOW TO FIND OTHER CONFIGURATIONS
Here are some steps to find suitable configurations
select a market and time frame
enable the Use This Strategy option on the strategy
open the strategy tester panel and select the performance summary
open the strategy configuration and go to properties
change the balance to the same price of the symbol (example: BTCUSDT 60.000, use 60.000 as balance)
go back to the inputs tab and keep changing the parameters until you see the net profit be positive and bigger than the absolute value of the drawdown
in case you can't find a suitable configuration, try other timeframes
Since the tester reflects what happened in the past candles, it's not guaranteed to give the same results. However, this indicator/Strategy can be used with other indicators as a leading signal or confirmation signal.

benchLibrary "bench"
A simple banchmark library to analyse script performance and bottlenecks.
Very useful if you are developing an overly complex application in Pine Script, or trying to optimise a library / function / algorithm...
Supports artificial looping benchmarks (of fast functions)
Supports integrated linear benchmarks (of expensive scripts)
One important thing to note is that the Pine Script compiler will completely ignore any calculations that do not eventually produce chart output. Therefore, if you are performing an artificial benchmark you will need to use the bench.reference(value) function to ensure the calculations are executed.
Please check the examples towards the bottom of the script.
Quick Reference
(Be warned this uses non-standard space characters to get the line indentation to work in the description!)
```
// Looping benchmark style
benchmark = bench.new(samples = 500, loops = 5000)
data = array.new_int()
if bench.start(benchmark)
while bench.loop(benchmark)
array.unshift(data, timenow)
bench.mark(benchmark)
while bench.loop(benchmark)
array.unshift(data, timenow)
bench.mark(benchmark)
while bench.loop(benchmark)
array.unshift(data, timenow)
bench.stop(benchmark)
bench.reference(array.get(data, 0))
bench.report(benchmark, '1x array.unshift()')
// Linear benchmark style
benchmark = bench.new()
data = array.new_int()
bench.start(benchmark)
for i = 0 to 1000
array.unshift(data, timenow)
bench.mark(benchmark)
for i = 0 to 1000
array.unshift(data, timenow)
bench.stop(benchmark)
bench.reference(array.get(data, 0))
bench.report(benchmark,'1000x array.unshift()')
```
Detailed Interface
new(samples, loops) Initialises a new benchmark array
Parameters:
samples : int, the number of bars in which to collect samples
loops : int, the number of loops to execute within each sample
Returns: int , the benchmark array
active(benchmark) Determing if the benchmarks state is active
Parameters:
benchmark : int , the benchmark array
Returns: bool, true only if the state is active
start(benchmark) Start recording a benchmark from this point
Parameters:
benchmark : int , the benchmark array
Returns: bool, true only if the benchmark is unfinished
loop(benchmark) Returns true until call count exceeds bench.new(loop) variable
Parameters:
benchmark : int , the benchmark array
Returns: bool, true while looping
reference(number, string) Add a compiler reference to the chart so the calculations don't get optimised away
Parameters:
number : float, a numeric value to reference
string : string, a string value to reference
mark(benchmark, number, string) Marks the end of one recorded interval and the start of the next
Parameters:
benchmark : int , the benchmark array
number : float, a numeric value to reference
string : string, a string value to reference
stop(benchmark, number, string) Stop the benchmark, ending the final interval
Parameters:
benchmark : int , the benchmark array
number : float, a numeric value to reference
string : string, a string value to reference
report(Prints, benchmark, title, text_size, position)
Parameters:
Prints : the benchmarks results to the screen
benchmark : int , the benchmark array
title : string, add a custom title to the report
text_size : string, the text size of the log console (global size vars)
position : string, the position of the log console (global position vars)
unittest_bench(case) Cache module unit tests, for inclusion in parent script test suite. Usage: bench.unittest_bench(__ASSERTS)
Parameters:
case : string , the current test case and array of previous unit tests (__ASSERTS)
unittest(verbose) Run the bench module unit tests as a stand alone. Usage: bench.unittest()
Parameters:
verbose : bool, optionally disable the full report to only display failures

LabelHelperLibrary "LabelHelper"
Utility for managing active labels on the chart.
add(level, txt, labelColor, textColor) For displaying a lable at the last bar.
Parameters:
level : The value to display the label at.
txt : The text to show on the label.
labelColor : The color of the label.
textColor : The text color of the label.
Returns: The label being managed.
