"The Stocashi" - Stochastic RSI + Heikin-AshiWhat up guys and welcome to the coffee shop. I have a special little tool for you today to throw in your toolbox. This one is a freebie.
This is the Stochastic RS-Heiken-Ashi "The Stocashi"
This is the stochastic RSI built to look like Heikin-Ashi candles.
a lot of people have trouble using the stochastic indicator because of its ability to look very choppy at its edges instead of having nice curves or arcs to its form when you use it on scalping time frames it ends up being very pointed and you can't really tell when the bands turn over if you're using a stochastic Ribbon or you can't tell when it's actually moving in a particular direction if you're just using the K and the D line.
This new format of Presentation seeks to get you to have a better visual representation of what the stochastic is actually doing.
It's long been noted that Heikin-Ashi do a very good job of representing momentum in a price so using it on something that is erratic as the stochastic indicator seems like a plausible idea.
The strategy is simple because you use it exactly the same way you've always used the stochastic indicator except now you can look for the full color of the candle.
this one uses a gradient color setup for the candle so when the candle is fully red then you have a confirmed downtrend and when the candle is fully green you have a confirmed up trend of the stochastic however if, you a combination of the two colors inside of one candle then you do not have a confirmed direction of the stochastic.
the strategy is simple for the stochastic and that you need to know your overall trend. if you are in an uptrend you are waiting for the stochastic to reach bottom and start curving up.
if you are in a downtrend you are waiting for the stochastic to reach its top or its peak and curve down.
In an uptrend you want to make sure that the stochastic is making consistently higher lows just like price should be. if at any moment it makes a lower low then you know you have a problem with your Trend and you should consider exiting.
The opposite is true for a downtrend. In a downtrend you want to make sure you have lower highs. if at any given moment you end up with a higher high than you know you have a problem with your Trend and it's probably ending so you should consider exiting.
The stochastic indicator done as he can actually candles also does a very good job of telling you when there is a change of character. In that moment when the change of character shows up you simply wait until your trend and your price start to match up.
You can also use the stochastic indicator in this format to find divergences the same way you would on the relative strength index against your price highs and price lows so Divergence trading is visually a little bit easier with this tool.
The settings for the K percent D percent RSI length and stochastic length can be adjusted at will so be sure to study the history of the stochastic and find the good settings for your trading strategy.
在脚本中搜索"the strat"

Setup Max e Min Larry WilliansLarry Williams used this system to win the trading championship
Hello friends, I bring a script with a trading strategy to be used in futures such as Index, Forex and Commodities. Developed by famous trader Larry Williams.
In them we use two 3-period Simple Moving Averages (Arithmetic) (one with the high price, the other with the low price), and a 21-period Moving Average (Arithmetic) to determine the trend. This will form an average channel with the prices of the maximums and minimums of the last three candles.
Best time charts use the strategy: from 5 minutes to 60 minutes.
This strategy is quite simple. The 21 Moving Average will color according to the trend (Green for bullish, Red for bearish and Gray for transitions). The Script will signal the entry according to the trend by the colors of the candles and also by the signal:
When green, the buy will be on the crossing of the lower Moving Average crossing the candlestick, and the exit will be on the crossing of the candlestick on the next Upper Moving Average.
When red, the sell will be at the crossing of the Upper Moving Average crossing the candlestick, and the exit will be at the crossing of the candlestick on the next Lower Moving Average.
When the Script signals the candle with a purple X, it means that the trend is changing and the entire open operation must be closed.
This system has no Stop, so be careful when using it.
Na linguagem do autor:
Larry Williams usou esse sistema ganhar campeonato de trade
Olá amigos, trago um script com uma estratégia de trade pra ser usada em futuros como Índice, Forex e Commodities. Desenvolvido pelo famoso trader Larry Willians.
Neles usamos duas Médias Móveis Simples (Aritmética) de 3 períodos (uma com o preço da máxima, outra com o preço da mínima), e uma Média Móvel (Aritmética) de 21 períodos para determinar a tendência. Nisso vai formar uma canal de médias com os preços das máximas e mínimas dos últimos três candles.
Melhores tempos gráficos usar a estratégia: de 5 minutos até 60 minutos.
Essa estratégia é bem simples. A Média Móvel de 21 irá colorir de acordo com a tendência (Green pra alta, Red para baixa e Gray para transições). O Script irá sinalizar a entrada de acordo com a tendência pela cores dos candles e também pela sinalização:
Quando green, a compra será no cruzamento da Média Móvel inferior cruzando o candle, e a saida será no cruzamento do candle na Média Móvel Superior seguinte.
Quando red, a venda será no cruzamento da Média Móvel Superior cruzando o candle, e a saida será no cruzamento do candle na Média Móvel Inferior seguinte.
Quando o Script sinaliza o candle com X purple, significa que a tendência está em mudança e deve ser fechada toda a operação em aberto.
Este sistema não possui Stop, portando cuidado quanto a seu uso.

Simple STRAT Tool by nnamWhat this Indicator Does
This indicator is a very simple tool created specifically for experienced Straters. It was created for those Straters who fully understand the 1-2-3 Strat Scenarios, are in need of an easy to use tool, and do not want or need a lot of messy markings on their chart.
The indicator simply allows the user to color code the Strat 1, 2 ,3 (Inside /Outside /Up / Down) Bars as desired and by default extends lines to the right of the chart from the Highs and Lows of the previous 2 Bars giving the user a simple reference for Strat scenario structure breaks.
As shown above, the bars are color coded, but the original bar color is maintained via the border and wick.
If a bar is an Outside Bar or an Inside Bar, it is still easy to identify whether or not the bar was a Bullish or Bearish 1 or 3.
The same goes for 2UP and 2Down Bars - It is easy to identify Bullish or Bearish UP or DOWN Bars.
Optionally, as show in the screenshot below, the user can extend the lines in both directions to get an "at a glance" better understanding of where price is currently vs previous support and resistance areas.
For Straters that prefer to trade only INSIDE BAR BREAKOUTS there is an optional input setting labeled "Trade Inside Bars ONLY".
This setting turns OFF the lines that extend from the 2nd previous bar back and only displays and extend lines from the previous bar IF and ONLY IF the current bar is an INSIDE (one) bar. .
The User Input settings allow for the following customizations:
1. Custom Outside Bar Color
2. Custom Inside Bar Color
3. Custom 2 Up Bar Color
4. Custom 2 Down Bar Color
5. Turn ON or OFF color coded bars
6. Trade only INSIDE Bar Breakouts
7. Extend Lines Both Directions
8. Hide all Lines
The customizable settings above allow the user to hide all lines and turn OFF color coding without having to fully remove the indicator from the chart. This is convenient when the user has another indicator that uses color coded bars or the lines conflict with another indicator and they need to be temporarily disabled.
If you have any questions regarding this indicator please let me know. If you have any suggestions for minor tweaks to the indicator do not hesitate to ask for them.
I hope you enjoy this indicator and get some usefulness from it... HAPPY TRADING!!
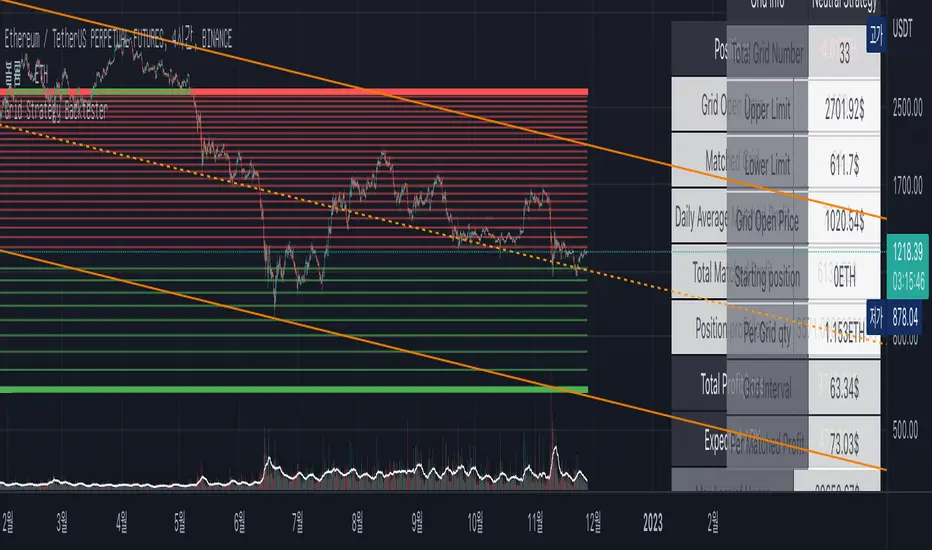
Grid Strategy Back Tester (Long/Short/Neutral)Preface
I'd like to send a thank you to @xxattaxx-DisDev.
The 'Line' Code, which was the most difficult to plan the Grid Indicator, was solved through the 'Grid Bot Simulator' script of @xxattaxx-DisDev.
A brief description of the indicators
These indicators are designed for backtesting of grid trading that can be opened on various exchanges.
Grid trading is a method of selling at particular intervals as prices rise and fall for gird interval price range.
This indicator is actually designed to see what the Long / Short / Neutral grid has achieved and how much it has achieved over a given period of time.
How to use
1. Lower Limit and Upper Limit are required when putting indicators on the chart.
After that, choose the 'Time' when to open the grid.
Also, select Long / Short / Neutral direction if necessary.
2. Statistics Table
Matched Grid shows how many grid pairs were engaged during the backtesting period.
The Daily Average Matching Profit is calculated based on the number of these closed grids.
Total Matching Profit is calculated as Matching Grid * Per Matching Profit.
Position Profit/Loss shows the benefits and losses from your current position.
Total Profit/Loss is sum of Total Matching Profit and Position Profit/Loss.
The Expanded APY shows the benefits of running the strategy on these terms for a year.
Max Loss of Upper is the maximum loss assumed to be directly at the top of the grid range.
BEP days (Upper) show how many days of maintenance relative to Average Matching Profit can result in greater profit than maximum loss if the grid continues to move within range.
(In the case of Long Strategy, it appears to be 'Min Profit', which shows minimal benefit if it reaches the top.)
Max Loss of Lower and BEP days (Lower) shows the opposite.
(In the case of Short Strategy, it is also referred to as 'Min Profit', which shows minimal benefit if it reaches the bottom.)
3. Grid Info
Total Grid Number, Upper Limit, and Lower Limit show the values you set in INPUT.
Grid Open Price shows the price for the period you decide to open.
Starting Position shows the number of positions that were initially held in the case of a Long / Short Strategy.
(0 for Neutral Strategy)
Per Grid qty shows how many positions are allocated to one grid
Grid Interval shows the spacing of each grid.
Per Matched Profit shows how much profit is generated when a single grid is matched.
Caution
Backtesting results for these indicators may vary depending on the time frame.
Therefore, I recommend that you use it only to compare Profit/Loss over time.
*In addition, there is a problem that all lines in the grid are not implemented, but it is independent of the backtest results.
--------------------------------------
서문
지표를 기획함에 있어서 가장 어려웠던 line 코드를 @xxattaxx-DisDev의 'Grid Bot Simulator' 스크립트를 통해 해결할 수 있었습니다.
이에 감사의 말씀을 드립니다.
해당 지표에 대한 간단한 설명
해당 지표는 다양한 거래소에서 오픈할 수 있는 그리드 매매에 대한 백테스팅을 위해 만들어졌습니다.
그리드매매는, 특정 가격 구간에 대해 가격이 오르고 내림에 따라 일정 간격에 맞춰 매매를 하는 방식입니다.
이 지표는 실질적으로 롱/숏/중립 그리드가 어떠한 성과를, 특정 기간동안 얼마나 냈는지를 확인하고자 만들어졌습니다.
사용방법
1. 인풋
지표를 차트위에 넣을 때, Lower Limit과 Upper Limit이 필요합니다.
그 후 그리드를 언제부터 오픈할 것인지를 선택하세요.
또, 필요하다면 Long / Short / Neutral의 방향을 선택하세요.
2. 그리드 통계
Matched Grid는, 백테스팅 기간동안 체결된 그리드 쌍이 몇개인지를 보여줍니다.
이 체결된 그리드의 갯수를 바탕으로 Daily Average Matched Profit이 계산됩니다.
Total Matched Profit은, Matched Grid * Per Matched Profit으로 계산됩니다.
Position Profit/Loss는, 현재 갖고 있는 포지션으로 인한 이익과 손실을 보여줍니다.
Total Matched Profit과 Position Profit/Loss를 합친 금액이 Total Profit/Loss가 됩니다.
Expcted APY는, 이러한 조건으로 전략을 1년동안 운영했을 때의 이익을 보여줍니다.
Max Loss of Upper는, 그리드 범위의 최상단에 바로 도달했을 경우를 가정한 최대 손실입니다.
BEP days(Upper)는, 그리드가 범위 내에서 계속 움직일 경우, Average Matched Profit을 기준으로 며칠동안 유지되어야 최대손실보다 더 큰 이익이 발생할 수 있는지를 보여줍니다.
(Long Strategy의 경우, ‘Min Profit’이라고 나타나는데, 최상단에 도달했을 경우 최소한의 이익을 보여줍니다)
Max Loss of Lower는 그 반대의 경우를 보여줍니다.
(Short Strategy의 경우, 역시 ‘Min Profit’이라고 나타나는데, 최하단에 도착했을 경우 최소한의 이익을 보여줍니다)
3. 그리드 정보
그리드 갯수, Upper Limt, Lower Limt은 자신이 설정한 값을 보여줍니다.
Grid Open Price는, 자신이 오픈하기로 정했던 기간의 가격을 보여줍니다.
Starting Position은, 롱/숏 그리드의 경우에 처음에 들고 시작했던 포지션의 갯수를 보여줍니다.
Neutral Strategy의 경우 0입니다.
Per Grid qty는, 하나의 그리드에 얼마만큼의 포지션이 배분되었는지를 보여주며
Grid Interval은 각 그리드의 간격을 보여줍니다.
또, Per Matched Profit은 하나의 그리드가 체결될 때 얼마만큼의 이익이 발생하는 지를 보여줍니다.
이러한 지표에 대한 역테스트 결과는 시간 프레임에 따라 달라질 수 있습니다.
따라서 시간 경과에 따른 손익을 비교할 때만 사용하는 것이 좋습니다.
*추가로, 그리드의 라인이 모두 구현되지 않는 문제가 있지만, 백테스팅 결과와는 무관합니다.
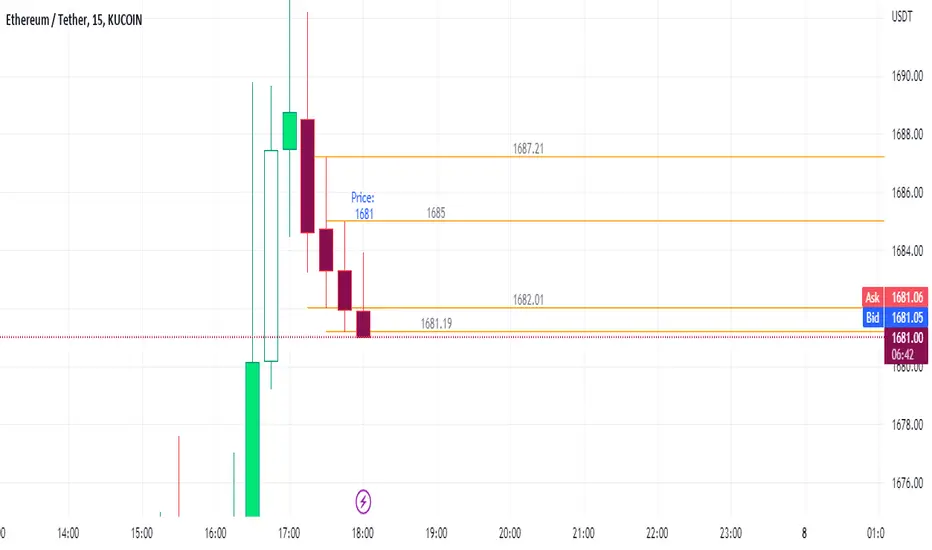
Chrtpnk LTF Pullback ScalperINTRODUCTION
I am happy to present the system which I am using for intraday scalps. I have developed this system for my own using, and it has started out as a mere productivity tool. Since I am using more timeframes for the calibration of my scalp entries, I needed a clean, color-based chart tool that relieves me from watching several timeframes simultaneously.
The system has been optimized for entries on the 15-minute chart, providing calibration by following the 1-hour and 4-hour charts in the background.
In this trend following momentum pullback scalping system we are following the trend structure, the multi-timeframe momentum, and we can also add the Stochastic RSI to properly time our entries. Below please find details.
TREND STRUCTURE
The overall trend on our trading timeframe is shown with the assistance of three weighted moving average levels. In line with general MA trading principles, we are looking for the proper alignment of the MA levels, and a correlating price action with our trade. Whenever the short MA is above the middle MA and both of them are above the long MA, the trend is long. Whenever the short MA is below the middle MA and both of them are below the long MA, the trend is short.
MOMENTUM (Multi Timeframe!)
Further to the general trend structure, I am using market momentum to confirm my entries and exits. The most important market indicators to me in this respect are the RSI , DMI and Momentum Oscillator values. A bullish confluence of these momentum indicators are a confirmation for me on a long entry, and a bearish confluence may confirm a short entry.
This aspect is where I believe my indicator is a huge help. Instead of having to check for confluence separately, the indicator is simply signaling confluence by painting the bars, thus providing an easy and quick reading of current momentum.
Even further, the indicator is able to analyize the underlying indicators on three timeframes simultaneously, and paint the candles only in case of total confluence. This has been a huge help in my trading, as it provides me with an immediate MTF momentum reading upon opening a chart.
MY PREFERRED USE OF THIS INDICATOR
I am using this indicator on the 15-minute chart, and I am basically trying to perform trend following momentum pullback scalps. In order to properly time your sniper entries, you may add the Stochastic RSI to the indicator. Here is the strategy:
Long scalp: You are looking for a bullish moving average structure, and you are looking for green candles printed by the Chartpunk Indicator. Green candles mean bullish momentum confluence on the 15m, 1h and 4h timeframes. When you have the bullish ma structure and the green candles, you are waiting for a pullback to the short (yellow) moving average, or to the middle (orange) moving average. The shallower the pullback the stronger the odds. When you see a bounce (trend continuation) and you get also confirmation from the Stochastic RSI, you enter a long scalp.
Short scalp: You are looking for a bearish moving average structure, and you are looking for red candles printed by the Chartpunk Indicator. Red candles mean bearish momentum confluence on the 15m, 1h and 4h timeframes. When you have the bearish ma structure and the red candles, you are waiting for a pullback to the short (yellow) moving average, or to the middle (orange) moving average. The shallower the pullback the stronger the odds. When you see a bounce (trend continuation) and you get also confirmation from the Stochastic RSI, you enter a short scalp.
SUMMARY
This indicator is providing a very clean and quick-to-read outlook of an otherwise rather time and focus intensive study. Instead of checking for confluence of three momentum indicators on three timeframes, you immediately see confluence with the candle paint. The moving average structure is promptly there to confirm the read. The indicator is both a huge productivity help in scouting the market, and an asset to properly time your entries.

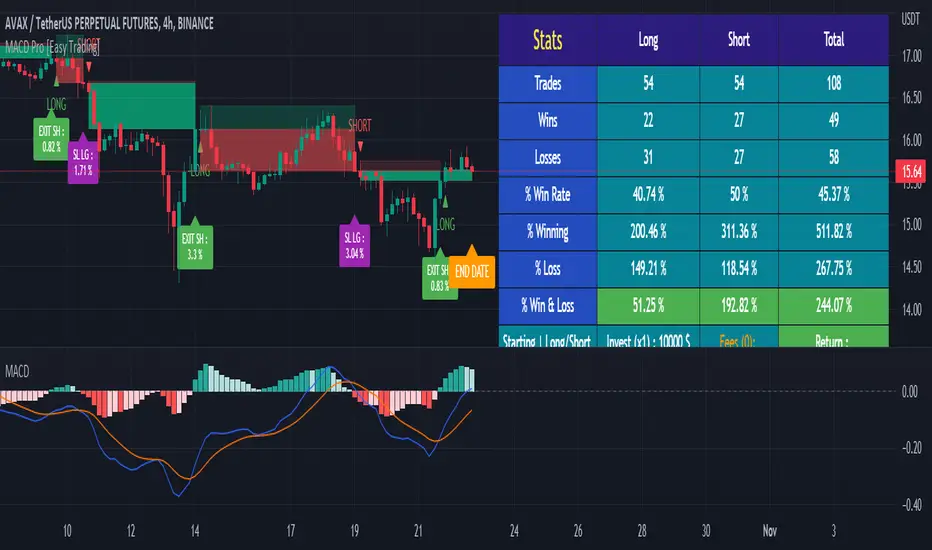
MACD Strategy - Backtest [AlgoRider]█ OVERVIEW
Hello dear Tradingviewers !
We are excited to share with you this new indicator which simulates a trading strategy based solely on the well-known technical indicator MACD . We designed it for the sole educational and analytical purposes of showing novice traders and new investors that basing a trading strategy only on one such technical indicator is not necessarily a good thing to do. We do not recommend to apply this strategy for real.
Thanks to this indicator redesigned in our own way by incorporating our simple and easy-to-use Backtest functionality, you will be able to see and report on the performance and results that such a strategy has produced in the past.
The configuration window has also been designed to be easily readable and simple to use. Our goal is to make parameter customization as easy as possible.
█ HOW THE STRATEGY WORKS
• The script will simply trigger Long entries when bullish MACD crossings appear (the Macd line crosses the Signal line upwards) and Short entries when bearish MACD crossings appear (the Macd line crosses below the signal line).
• A Short signal ends a Long trade, a Long signal ends a Short trade.
• The script also allows setting up custom TP and SL.
• An option allows you to trigger early crossings, which will influence entries and exits.
• There is no repaint, once an entry/exit symbol or drawing is displayed it doesn't change anymore. The Short and Long signals appear at the open of the candles, just after the signal was confirmed at the close of the previous candle. The custom TP and custom SL signals can appear when a candle is not yet finished, but once displayed they don't change.
█ HOW TO PROCEED
1 — Once the script is applied to your chart, it already works with its default settings. You can already see the performance of the strategy in the data table directly on the chart (in the top right corner by default).
2 — You can customize the strategy and influence the results/performance by modifying its parameters. 3 types of parameters are present and can be modified.
3 — You can use this indicator in all types of markets.
4 — You can apply the script in every timeframe.
█ PARAMETERS
• Settings For Backtesting
- Strategy : Choose from a drop-down list if the strategy should execute only Long trades or only Short trades or both. Default Both.
- Invest. : Choose the amount you want to invest in the simulation. Default 10000.
- Position : Choose the amount of the position (Size order) that will be used during the simulation. This will be the $ amount staked/involved for each trade entry.
Ex: If you put 20000 in position and 10000 in Invest. We consider that you use at least a leverage x2. Default 10000.
- Slipp. TP : Choose the amount in percentage of average slippage for Take Profits. This parameter makes it possible to predict a potential gap between the theoretical exit price for each TP (On the graph) and the real exit price on an exchange when implementing the strategy for real (slippage may be due to a time lag of a few seconds from execution time of the order on the exchange and/or due to the execution of a market order).
Ex: If a TP exit order of a Long trade, with entry $19000 (on BTCUSDT ), is carried out in theory on the chart at $20000, in practice on the exchange the script have indeed sent an exit order at 20000 , but if the true exit price is 20050, the TP slippage is then +0.25%. Default 0.
- Slipp. SL : Choose the amount in percentage of average slippage for Stop Losses. This parameter makes it possible to predict a potential gap between the theoretical exit price for each SL (On the graph) and the real exit price on an exchange when implementing the strategy for real.
Ex: If an SL exit order of a Long trade, entry $19000 (on BTCUSDT ), is carried out in theory on the chart at $18000, in practice on the exchange the script have indeed sent an exit order at 18000 $, but if the true exit price is 17950, the slippage SL is then +0.278%. Default 0.
- Fees % : Choose the percentage amount of fees applied to each trade to simulate the application of the strategy on the exchange of your choice. Applies to the entry and exit of each trade. Ex: For Binance Futures: 0.04; For Bybit futures: 0.06; For Ftx Futures: 0.075. Default 0.
- Cumulate Trades : If you check this, the Backtest will use 100% of the balance as Order Size (Position) for All or in the next X consecutive trades. Default not checked.
⚠️ Be Careful please, this option is available to show the full extent and possibilities of the algorithm when pushed to its limits thanks to the accumulation of profits (cumulative earnings ), but it is a strategy that involves great risk. If a bad trade suffers a -50% loss, 50% of the account balance is lost, if the position is liquidated, the entire account balance is lost.
- All : If you check this All trades will be accumulated. Default not checked.
- Consecutive Trades : Choose the number of trades to accumulate. After X consecutive trades, the algorithm reassigns the initial order size to the current one and starts again for X consecutive trades. Minimum Value 2, Default 2.
• Settings To Optimize Performances and Risk Management
- Fast_MA : Choose the length of the Fast Moving Average. Default 12.
- Slow_MA : Choose the length of the Slow Moving Average. Default 26.
- Enable Early Crossings : If you check this, when the algorithm will detect an early crossing wethere bullish or bearish , it will trigger the Long or Short entries. Default not checked.
- Oscillator MA Type : Choose if the Macd line should be an Exponential Moving Average or a Simple Moving Average . Default Expo.
- Signal Line MA Type : Choose if the Signal line should be an Exponential Moving Average or a Simple Moving Average . Default Expo.
- Use TP / Use SL : If you check these, the algorithm will trigger personalized trade exit signals when the price evolution has reached the amounts indicated since the trade entry. Default not Checked.
- % TP - SL : Indicate here the personalized amount in percentage that you want for your Take Profit and Stop Loss of each trade. Default 15-5.
• Settings For Appearances
- Small-size Data Table : If you check this, the data table will become smaller to free up more space on the chart to make it visually more pleasing. Default not checked.
Hide Table /
- Hide Labels / : You can check these to get a cleaner chart and focus only on what interests you in the indicator. Default not checked.
Hide Risk-Reward Areas
█ LIMITATIONS
• ⚠️ We repeat it once again, this strategy is not intended to be reproduced in real conditions, we have designed it for educational and analytical purposes only.
• Even if you see good performances when you backtest the strategy, you must take into account that these results are performed in the past and that in no case does this guarantee that these same performances will be repeated again in the future.
• When you run for real a trading strategy you must be aware of the fact that you are solely responsible for the results that you will be able to obtain and you must be aware of the possibility at all times of partial or even total losses of your invested capital.
• Keep in mind that generating profits in trading is difficult. A strategy can perform very well at one time in the past during a period that is favorable to it, then from one day to the next it can give really bad results for several months or years.
• When backtesting a trading strategy, there are many factors to consider, not just trade entries to which you add a Take Profit and sometimes a Stop Loss. You must at least take into account the size of the position in relation to the capital you want to invest, the trading fees, the slippages (which can be really important depending on the exchange on which you are trading and depending on the asset you are trading), trading frequency, risk management, momentum, volumes and even more.
The information published here on TradingView is not prohibited, doesn't constitute investment advice, and isn't created solely for qualified investors.
═════════════════════════════════════════════════════════════════════════
Important to note : our indicators with the same backtesting system are published in separate publications, because putting them together in a single script would considerably slow down the execution of the script. In addition each indicator, even when it is based on a simple technical indicator, has several options, parameters and entry/exit conditions specific to the underlying technical indicator. Finally, we want to keep the simplicity of use, configuration and understanding of our indicator by not mixing strategies that have nothing to do with each other.
TARVIS Labs - Bitcoin Macro Bottom/Top SignalsSCRIPT DESCRIPTION
This is a script specifically written to help provide indicators from a macro view. This script is best run on the 1 day interval on Bitstamp's $BTCUSD chart. It helps indicate when to accumulate bitcoin, and when its in a bull run when there are local tops, strong top warnings, and a signal to exit a bull run. This is described further below.
If you don't have interest in trading on the way to the top I suggest turning off the following indicators in the settings of the indicator:
- Opportunity To Buy Back In Indicator
- Local Top Near Bull Run Top Indicator
ACCUMULATION ZONE INDICATOR - LIGHT GREEN
Description
When we look at the history of Bitcoin every bottom has crossed below the 100 week EMA. Once it does its accompanied by hash ribbon cross with miner capitulation. After that is the prime time to accumulate as theres a clearer signal the bottom is in. Specifically, a signal to look for is the 14 day MACD/signal cross and the 14 day MACD continuing to stay above the signal until the price returns above the 100 week EMA. This is prime accumulation territory.
Strategy for Usage
A good strategy to use when accumulating the bottom is dollar-cost averaging over a 30 day period. The accumulation zone can last longer than 30 days but 30 days is a good range of time to DCA.
STRONG BUY IN ACCUMULATION ZONE INDICATOR - DARK GREEN
Description
We can add to the bottoming signal by looking for post-downtrend reversals inside the bottoming signal. We do this by using a 9/19 daily cross.
Strategy for Usage
These post-downtrend reversals can potentially provide better targeted days for accumulation than the broader bottoming signal and can be used to add more on that day than on an average day for the dollar cost average strategy. Say for example, use 1/3 of funds on these days rather than 1/30th.
OPPORTUNITY TO BUY BACK IN INDICATOR - BLUE
Description
When the 1d 18 EMA > 1d 63 EMA and the 12/52 1d crosses. These together provide good buy opportunities to buy bitcoin.
Strategy for Usage
If you happen to find yourself out of the market from your own TA or a trade, this signal can provide a buy opportunity to reenter the market if you're out of it.
BULL RUN LOCAL TOP INDICATOR - ORANGE
Description
We will similarly use the 100 week EMA to determine trend reversal into a bull run. When we see the 100 week EMA uptrending, we can begin to look for local tops using the 9/19 daily MACD/signal bearish cross along with the 12 EMA having a negative slope, which could be the beginning signal for a local top.
Strategy for Usage
This is a rather light indicator, but can be used in tandem with your own technical analysis to determine if you want to reenter after you exit from its signal.
LOCAL TOP NEAR BULL RUN TOP INDICATOR - RED
Description
When the 100 week EMA is in an uptrend we can look for significant loss of momentum in order to determine if a local top is in near a bull run top. Similar to the Bull Run Local Top Indicator, this strategy uses a MACD/signal cross but instead uses the 30/65 day EMAs.
Strategy for Usage
Ideally the right strategy to use here is to exit the market when this indicator starts. When the indicator ends if the "End of Bull Run Indicator" is not showing on the chart you can buy back into the market.
TOP IS LIKELY IN INDICATOR
Description
When the 100 week EMA is in a very strong uptrend and the 9/19 weekly MACD/signal bearish cross occurs, and the 63 EMA begins to downtrend.
Strategy for Usage
This signal typically accompanies the "Local Top Near Bull Run Top Indicator" therefore if you're following the strategy you would likely already be out of the market, but if you're not and this signal fires its a strong signal the top is in and we're likely going to start seeing a strong retrace. This is typically right before we see the "End of Bull Run Indicator". There is only one occurrence where it wasn't followed by a large drop & the "End of Bull Run Indicator" and that was in the 2017 bull run where there were many strong retracements post local top. The likelihood we see that again is low, but if it were to happen you can buy back into the market when the "Top is Likely In Indicator" and the "Local Top Near Bull Run Top Indicator" are not firing.
TOP IS LIKELY IN INDICATOR
Description
When the 100 week EMA is in a strong uptrend and the 9/19 weekly MACD/signal bearish cross occurs, and the 63 EMA begins to downtrend.
Strategy for Usage
This signal typically accompanies the "Local Top Near Bull Run Top Indicator" therefore if you're following the strategy you would likely already be out of the market, but if you're not and this signal fires its a strong signal the top is in and we're likely going to start seeing a strong retrace. This is typically right before we see the "End of Bull Run Indicator". There is only one occurrence where it wasn't followed by a large drop & the "End of Bull Run Indicator" and that was in the 2017 bull run where there were many strong retracements post local top. The likelihood we see that again is low, but if it were to happen you can buy back into the market when the "Top is Likely In Indicator" and the "Local Top Near Bull Run Top Indicator" are not firing.
END OF BULL RUN INDICATOR
Description
When the 100 week EMA is in an uptrend and the 1d 18 EMA crosses the 1d 63 EMA.
Strategy for Usage
When the 100 week EMA is a strong uptrend and the 18/63 cross occurs the top is very likely in. It has occurred in every bull run top leading to the bear market.

2 Ema Pullback StrategyHi everyone!
CAUTION... This is only an indicator. Do not rely 100% on it.
I made this indicator hoping to help everyone with this specific Pull Back Scalping Strategy.
RULES:
Time Chart of 5minuts
LONG Condition - "EMA Red Line" below the "EMA Blue Line" and wait for a green long signal.
SHORT Condition - "EMA Red Line" below the "EMA Blue Line" and wait for a red short signal
Feel free to add any adjustments or give feedback so we can improve.
The strategy idea and guidelines came from "The Master" Juan Luis.
Autor: © Germangroa

AveragerStrategy:
The indicator builds horizontal channels to help you make a buying decision.
Rules:
1. First purchase:
1.1 If the price is in the green channel (3): feel free to buy in the amount of 3 lots.
1.2 If the price is in the blue channel, then we look for moving averages to be closer to the corresponding channel lines.
1.2.1 In channel 2, the blue MA is closer to the blue channel line (above the green one), the green MA is closer to the green channel line (below the blue one).
1.2.2 In channel 4, the blue moving average is closer to the blue channel line (below the green one), the green moving average is closer to the green channel line (above the blue one). If the conditions are met, we make a purchase in the number of lots indicated in the channel label (2 or 4 lots).
1.3 We do not make the first purchase in the red channels (1, 2, 5).
2. Subsequent purchases/sales:
2.1 When the price moves from one channel to another, we keep the number of lots in accordance with the channel labels. If the price went into the lower channel, we buy 1 more lot, if it goes into the upper channel, we sell 1 lot.
3. Suitable timeframes: from 1H to 1W. Best of all shows the result on the 1D timeframe.
Labels (except 0) contain information about the number of lots and the average price of the channel for placing pending orders ONLY for sale. We always buy manually.
The strategy is not an individual recommendation.
-----
Стратегия:
Индикатор строит горизонтальные каналы, помогающие принять решение о покупке.
Правила:
1. Первая покупка:
1.1 Если цена находится в зеленом канале (3): смело покупаем в количестве 3 лота.
1.2 Если цена в синем канале, то смотрим, чтобы скользящие средние были ближе к соответствующим линиям канала.
1.2.1 В канале 2 синяя скользящая - ближе к синей линии канала (выше зеленой), зеленая скользящая - ближе к зеленой линии канала (ниже синей).
1.2.2 В канале 4 синяя скользящая - ближе к синей линии канала (ниже зеленой), зеленая скользящая - ближе к зеленой линии канала (выше синей). Если условия соблюдены, делаем покупку в количестве лотов, указанному в лейбле канала (2 или 4 лота).
1.3 В красных каналах (1, 2, 5) первую покупку не совершаем.
2. Последующие покупки/продажи:
2.1 При переходе цены из одного канала в другой держим количество лотов в соответствии с лейблами канала. Если цена ушла в нижний канал - докупаем 1 лот, если в верхний - продаем 1 лот.
3. Подходящие таймфреймы: от 1Ч до 1Н. Лучше всего показывает результат на 1Д таймфрейме.
Лейблы (кроме 0) содержат информацию о количестве лотов и среднюю цену канала для выставления отложенных ордеров ТОЛЬКО на продажу. Докупаем всегда вручную.
Стратегия не является индивидуальной рекомендацией.

CrossFire -=[ CryptDollar ]=-FEATURES
DO NOT USE WITHOUT READING ALL OF THIS!
Intended to be USED AGAINST Heikin Ashi Averaging Trend Candles for LEGITIMATE ‘AVERAGING’ Trend Recognition and analysis and it is a legitimate mathematical protocol using averages.
NOTE:
THIS IS NOT A simple “ENTER / EXIT" Type Indicator!!! BE CLEAR ABOUT THAT!!
THIS IS A AVERAGE TREND ANALYSIS and Support & Resistance type of indicator
ADDITIONAL NOTE:
This EMA CROSSING signal indicator DOES NOT REPRINT after the EMA CROSS CONFIRMATION, (Candle Close)!!
It may flicker during the confirmation process, which ALL indicator formulas do.
PROOF OF THIS is that the Yellow and Light Blue EMAs are IN FULL VIEW where the indications occur.
What is a Moving Average Crossover Confirmation??
It is when the selected Moving Averages fully cross each other upon candle close.
It is also important to note:
The LOWER the Timeframe, the more 'NOISE to signal' ratio you will get with this and ANY other indicator.
The HIGHER the Timeframe, the more 'SIGNAL to noise' ratio you will get with this and ANY other indicator.
To attain more reliable Trade Planning signals; simply look for signals on the higher TFs, and THEN use the lower, faster-pivoting TFs to limit into position.
You should only execute moves AFTER you 'APPROPRIATELY PLAN YOUR TRADE' and decide to 'TRADE YOUR PLAN!'
------------------------------------------
What is included with this EMA Crossing Indicator:
Dynamic SR (Horizontal lines of Support and Resistance (which is analyzed against recent average price action). An optional VWAP is included as well
ALL of these pop-up indication features can be turned Off or On in settings panel:
Also, it is very important to select the dots next to the indicator name on your chart; scroll the drop menu go to "Visibility" > "Bring to Front." so you can see the 2 and 6 EMAs on top of the Heikin Ashi AVERAGING candles.
AGAIN, this indicator is based off a known and well established Heikin Ashi EMA Crossing Swing Trading Strategy and is optimized with the use of Heikin Ashi AVERAGING Candles.
This contains all of the EMAs related a 2-6-13 Heikin Ashi AVERAGE Trading Strategy. The original strategy for traditional markets used the 17 EMA. But in crypto, I've found that the 13 EMA at least 'seems' to be more relative and consequential as a trend change 'strength' indication.
- Includes alerts with "CROSS" indications for the 2 & 6 EMA crossover points.*
- ALWAYS check for Trend & Price Support or Resistance (SR) ALONG YOUR TRADE PATH, BEFORE planning your Trade.
- DO NOT simply enter trades based on the Cross signals, as these are mere indications of directional change, and make sure you have at least a single candle close confirmation before taking it seriously.
- Along with that, there are certain sets of SMAs (21, 50, & 200) that are universally used by famed rock star traders, for both scalping and swing trades, which can be enabled and disabled in the Style Panel Settings.
- The optional ARROWS are additional indications for when the 13 EMA , 21 SMA , 50 SMA , and 200 SMA are crossed up or down.
Each EMA and SMA has its own alert that you can individually set, along with the primary "CROSS" indication alerts.
* Special note regarding the visual indications of the 13 EMA and the 21 SMA
If an arrow appears with "13-21" above or below it, that is because these moving averages are so close that
for visual notification purposes there was a visual layering issue whenever both of these MAs triggered on same candle.
This compensation for the visual indication has no effect on the individual MA's Alert settings.
- ALL EMAs and SMAs are customizable if the defaults are not to your liking, BUT understand that any EMA and SMA assignment changes will divert away from the strategy for which this indicator was designed.
If you change from the default moving average assignments in the input settings, your changes will unfortunately not be reflected in the "labeling" on the chart or in alerts)!!
- All optional are in the settings panel, and all setting listings are easily understandable as to what they are
- I was finally able to edit the script to where the labels are not obnoxious on the chart!!!
- As with all my indicators so far; I like to include the optional light-white Daily VWAP plot line to save adding an extra indicator if you like to follow the VWAP , as I do.
- If your chart seems noisy with everything turned on, you can always disable any of these features that you find yourself not using as a visual reference and then "Save as default"
Best Applied to Higher Timeframes
With ALL Default “Noisy” Visual Indications Enabled:
With Only the Visible Primary Cross Indications Enabled:
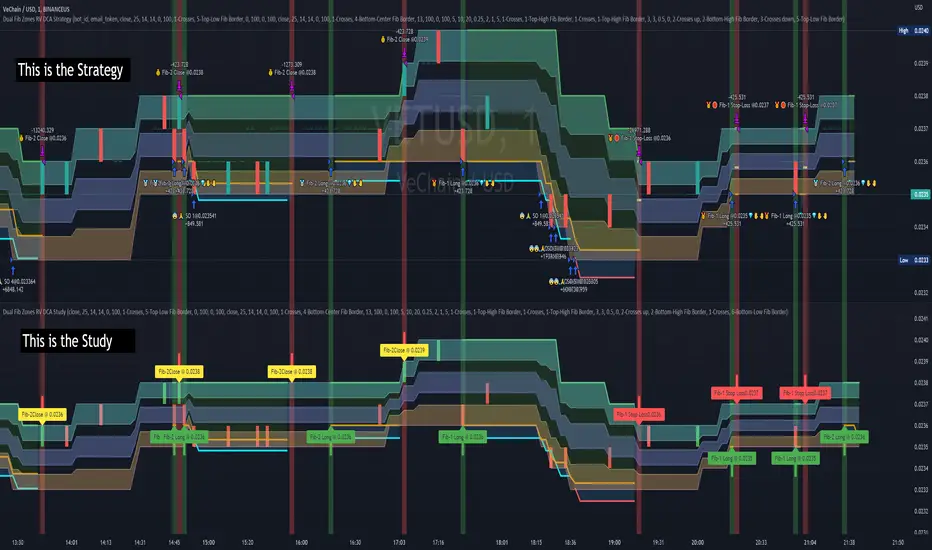
Dual Fibonacci Zones & Ranged Vol DCA Study - R3c0nTraderWhat does this do?
This signal script (aka Study) was created so it could be used with the corresponding strategy "Dual Fibonacci Zone & Ranged Vol DCA Strategy - R3c0nTrader" to create the buy and sell signals for 3Commas bots.
How to Use
Configure the study to match your settings you have set in the strategy. This script comes with an buy and sell alert conditions built-in. Just click to add alert and select Buy or Sell and paste in your bot messages.
Credits:
Thank you "EvoCrypto" for granting me permission to use "Ranged Volume" to create this study
Thank you "eykpunter" for granting me permission to use "Fibonacci Zones" to create this study
SSS50 StatusSSS50 Status Box with Auto Chart Levels and Labels
I made this indicator due to receiving a lot of messages on how to use my other SSS50% indicators. This indicator helps you learn and understand the Sara Strat Snipers 50 Percent Rule. Remember this indicator does not tell you when to buy or sell this is a guide on the setup ONLY.
You Must Use Rob Smith's The Strat Principles and Remember we need TIME in our favour. Ideally we want to see setups go In-Force early on during the candles lifespan (Timeframe).
Using the indicator logic, the SSS50% Rule has FOUR Conditions:
1. SSS50 INVALID = No Trade = The Candle is currently an Inside Bar OR a Green 2UP OR a Red 2DOWN.
2. SSS50 STANDBY = Failed 2* = The Candle is currently a Failed 2UP (Red 2UP) OR a Failed 2DOWN (Green 2DOWN).
3. SSS50 ACTIVE = Outside Bar Possible = The Candle is currently a Failed 2 and has crossed over the Previous Candles 50% level.
4. SSS50 COMPLETE = Outside Bar Complete = The Candle is now an Outside Bar.
How to Use this Indicator?
Add Indicator to your chart and open up the Indicator's Settings.
1. Select Indicators Timeframe.
- Chart = SSS50% rules will be applied to whichever timeframe chart you open.
- Single Timeframe = SSS50% rules will be only applied to one fixed timeframe when viewing on other timeframe charts. For Example: if you select Weekly. The Indicator's Status and Levels/Labels will only be displayed on your chart if the Weekly Candle has a SSS50 Standby, Active or Complete condition.
2. Select Status Box On/Off. If ON - Select View Type.
- Normal View = Detailed View with Price Targets.
- Compact View = Condensed View to reduce chart clutter.
3. Select AUTO or MANUAL Chart Levels/Labels. Select ONE type only or leave both off for no level/label display.
- AUTO = When an SSS50 STANDBY, ACTIVE or COMPLETE Condition occurs the related High, Low and 50% Levels will be displayed.
- MANUAL = When AUTO is OFF, MANUAL will display High, Low and 50% Levels always regardless of SSS50 Conditions.
4. Select AUTO Features.
- Display High/Low and/or 50% Price Labels when using AUTO Chart Mode.
4.1 Select AUTO Colors if required. Default to Traffic Light System.
- INVALID = Red
- STANDBY = Orange
- ACTIVE or COMPLETE = GREEN
5. Select MANUAL Features if AUTO Chart Mode is OFF.
- Display High/Low and/or 50% Price Labels when using MANUAL Chart Mode.
5.1 Select MANUAL Colors if required.
6. Additional Features. Title OR Timeframe available is Normal View. Title AND Timeframe BOTH available in Compact View.
- Show SSS50 Title next to Status Box.
- Show the indicators selected Timeframe next to Status Box. Timeframe will be displayed next to Status Box Only when ONE Individual Timeframe is selected.
7. Color Settings.
- Match your chart's current Background Color to this color.
8. Additional Settings
- Customise Label Offset Locations, Line Types and Line Types.
- Any issues let me know.
- Note I removed the price tags (used in my previous SSS50 indicators) from the right of the line to avoid clutter. Now you can see the current price move through the High, Low and 50% level lines.
- No alerts setup within script, just manually click the plus sign on each level if you wish to add alerts.

Fibonacci Zone Study w/Candles - R3c0nTraderCredits:
Thank you "eykpunter" for granting me permission to use "Fibonacci Zones" to create this study
What does this do? How is it different?
This study was created so it can be used with the strategy 'Fibonacci Zone DCA Strategy - R3c0nTrader' in order to generate buy/sell signals for a 3Commas bot.
I was not able to use "eykpunter's" "Fibonacci Zones" to create these signals as it was missing the code for this. To create the buy or sell signal you need to be able to create an alert for when the price moves through the Fib levels. Unfortunately, the "price" is not available to be selected when creating an alert with the original study. Hence the need to create this new study and to resolve the issue.
This study has overlay turned off by default so it will appear in a separate pane below your active chart. I did this so I can clearly view and separate the strategy from the study.
Steps Overview:
Add the study to your chart
Configure the study to match the Fib length you used in the strategy.
Create Alerts from the study to generate the buy or sell signals to 3Commas
The below steps for creating signals are just examples! Since there are numerous ways you can open or close a trade from a signal, please do your own testing. This cannot be understated.
Example of how to generate buy signals:
After adding the study, select the three dots for this study and click on "Add an alert on Fibonacci Zone Study /w Candles…"
Setup the condition to trigger the alert. If you want to initiate a buy when the price crosses over the top of the lower Fib zone (downtrend zone), then use the following:
Condition>Fibonacci Zone Study>Price High>Crossing Up>Fibonacci Zone Study>Top-Low Fib Border
Options>Once per bar
Expiration>Open-ended
Alert actions>Webhook URL (use the 3Commas webhook URL)
Alert name>Enter a name, "BUY Paper-Fib-Bot"
Message>Use the 3Commas message from the paper bot to open the trade
Example of how to generate sell signals:
After adding the study, select the three dots for this study and click on "Add an alert on Fibonacci Zone Study /w Candles…"
Setup the condition to trigger the alert. If you want to initiate a sell when the price reaches the top of the High Fib zone (uptrend zone), then try the following:
Condition>Fibonacci Zone Study>Price High>Crossing Up>Fibonacci Zone Study>Top-High Fib Border
(Note: I used "Crossing Up" but "Crossing" is another option; I just haven't tested it yet with a paper bot)
Options>Once per bar
Expiration>Open-ended
Alert actions>Webhook URL (use the 3Commas webhook URL)
Alert name>Enter a name, "SELL Paper-Fib-Bot"
Message>Use the 3Commas message from the paper bot to close the trade

[BM] HTF Candle Evolution█ OVERVIEW
This script shows how a higher timeframe candle evolves over time.
It was created as a visual aid to #TheStrat and provides a new way of looking at Timeframe Continuity.
█ FEATURES
General
HTF: Higher Timeframe selection with dropdown and ability to manually input a timeframe that is not present in the dropdown.
Label: Show a label with the selected higher timeframe.
Marker: Shows a marker symbol at the start of each new higher timeframe.
Align: Aligns the candles around a selected center line.
The Strat
Multi-timeframe analysis is used extensively in #TheStrat (created by Rob Smith), so the ability to add #TheStrat coloring has been made available.
Scenario: Define the colors for the strat scenario's.
Coloring of: Choose which part of the candles you want the selected strat scenario colors to be applied to.
Band: Display a band that shows the active strat scenario color of the selected higher timeframe.
All features are completely customizable.

JVC_scalp_v1How to use this strategie :
Usable and optimised on a 5-minute chart.
Red background color for short.
Green background color for long.
JVC_SCALP_V1 is a strategy based on the strategy posted by 5mScalpingStrat.
This script uses the following indicators
- L2 Perry Kaufman Adaptative MA ( KAMA )
- Willy 21e13 fixed tsmmob
- EMA 200
- Supertrend M15 to filter false positives
Red background color (sell signal) when the following conditions are met:
- Sell signal blackcat
- Sell zone supertrend M15
- Price < EMA 200 (2 candle close)
- Willy 21e13 output < -90 ou Willy 21e13 EMA < -80
Green background color (buy signal) when the following conditions are met:
- Buy signal blackcat
- Buy zone supertrend M15
- Price > EMA 200 (2 candle close)
- Willy 21e13 output > -10 ou Willy 21e13 EMA > -20
Two levels of colour are proposed according to the value of the output and the EMA.
You can change the settings in the script parameters.
If you find more relevant settings, don't hesitate to contact me so that I can apply an update in the code.

Accelerating Dual Momentum ScoreThis is a score metric used by the Accelerating Dual Momentum strategy.
According to the website you referenced when you created, the strategy is as follows:
Strategy Rules
This strategy allocates 100% of of the portfolio to one asset each month.
1. On the last trading day of each month, calculate the “momentum score” for the S&P 500 ( SPY ) and the international small cap equities (SCZ). The momentum score is the average of the 1, 3, and 6-month total return for each asset.
2. If the momentum score of SCZ > SPY and is greater than 0, invest in SCZ.
3. If the momentum score of SPY > SCZ and is greater than 0, invest in SPY .
4. If neither momentum score is greater than 0, calculate the 1-month total return for long-term US Treasuries ( TLT ) and US TIPS (TIP). Invest in whichever has the higher return.
Source: portfoliodb.co

Template Signal IndicatorThis script is an example on how to create a custom indicator that produce start/end long/short deal signals based on configurable conditions from internal and external indicators.
This indicator can be used as an external indicator to other strategies like "Template Trailing Strategy" that will execute the deals and enter the desired positions based on the signals produced by this script.
Combining this script with the aforementioned strategy (or any other compatible) has the advantage that you can backrest the results of your custom deal conditions. Also additional functionality that is provided by the strategy can be utilized (e.g. Take Profit Targets, Trailing Stop Loss etc.).
In this particular example I combined the RSI and Stoch RSI indicators (internal) with the "Trend Explorer" indicator (external) so it produces buy and sell signals based on the logic I defined in the input tab of this indicator. To combine "indicators on indicators" you need Pro+ TV subscription.
The convention I use to communicate the signals is the following (2 -> enter long, 1 -> exit long, -2 -> enter short, -1 ->exit short). However, this convention is also configurable in the consumer/strategy script "Template Trailing Strategy" so make sure that both script "speak the same language" before procced.

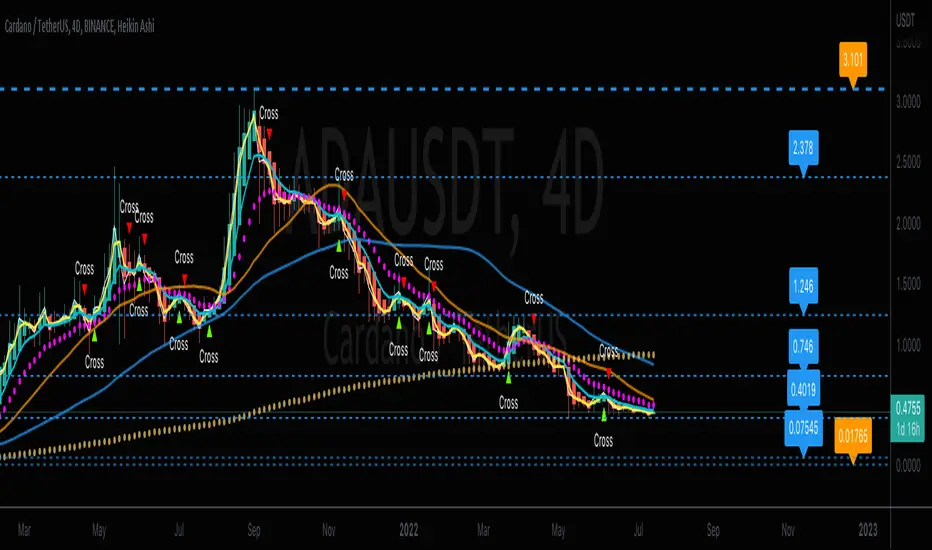
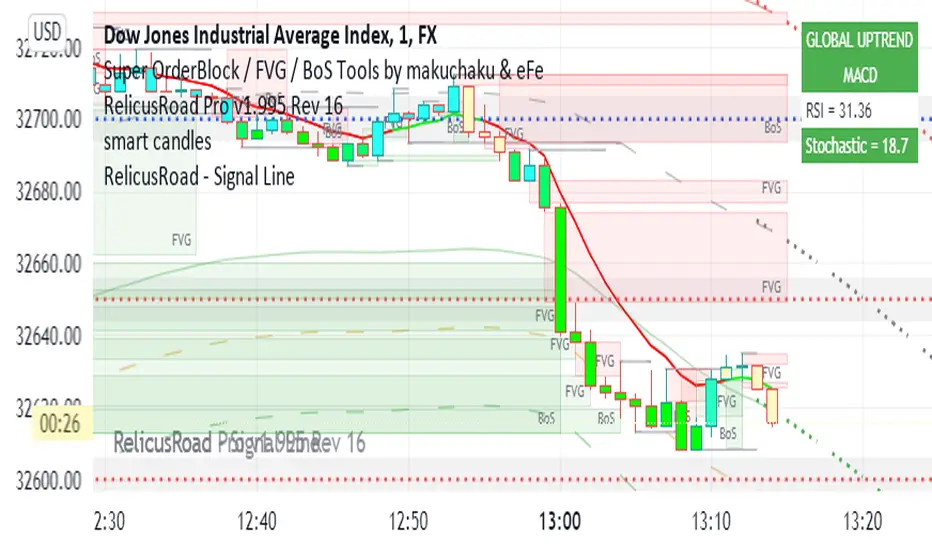
RelicusRoad - Signal LineWhen you have charts full of too many indicators, it can mess up with your analysis and cause analysis paralysis. Use RelicusRoad Signal Line to simply your charts with a beautiful color changing moving average line as per the strategies selected.
4 different strategies to choose from:
1) MACD
2) PMACD (Price Action + MACD)
3) Parabolic SAR
4) Momentum
GREEN: BUY ZONE
RED: SELL ZONE
FUNCTIONS OVERVIEW
MACD: Moving average convergence divergence ( MACD ) is a trend-following momentum indicator that shows the relationship between two moving averages of a security’s price. The MACD is calculated by subtracting the 26-period exponential moving average ( EMA ) from the 12-period EMA .
The result of that calculation is the MACD line. A 9 EMA of the MACD called the "signal line," is then plotted on top of the MACD line, which can function as a trigger for buy and sell signals. Traders may buy the security when the MACD crosses above its signal line and sell—or short—the security when the MACD crosses below the signal line. Moving average convergence divergence ( MACD ) indicators can be interpreted in several ways, but the more common methods are crossovers, divergences, and rapid rises/falls.
Moving average convergence divergence ( MACD ) is calculated by subtracting the 26-period exponential moving average ( EMA ) from the 12-period EMA .
MACD triggers technical signals when it crosses above (to buy) or below (to sell) its signal line.
The speed of crossovers is also taken as a signal of a market is overbought or oversold.
MACD helps investors understand whether the bullish or bearish movement in the price is strengthening or weakening.
PMACD: It's an improvement to MACD that you can use the Red/Green indications to make better decisions.
Parabolic SAR: The parabolic SAR indicator, developed by J. Wells Wilder, is used by traders to determine trend direction and potential reversals in price. The indicator uses a trailing stop and reverse method called "SAR," or stop and reverse, to identify suitable exit and entry points. Traders also refer to the indicator as the parabolic stop and reverse , parabolic SAR , or PSAR.
The parabolic SAR indicator appears on a chart as a series of dots, either above or below an asset's price, depending on the direction the price is moving. A dot is placed below the price when it is trending upward, and above the price when it is trending downward.
The parabolic SAR (stop and reverse) indicator is used by technical traders to spot trends and reversals.
The indicator utilizes a system of dots superimposed onto a price chart.
A reversal occurs when these dots flip, but a reversal signal in the SAR does not necessarily mean a reversal in the price. A PSAR reversal only means that the price and indicator have crossed.
Momentum: On paper, momentum investing seems less like an investing strategy and more like a knee-jerk reaction to market information. The idea of selling losers and buying winners is seductive, but it flies in the face of the tried and true Wall Street adage, "buy low, sell high."
Momentum investing is a trading strategy in which investors buy securities that are rising and sell them when they look to have peaked.
The goal is to work with volatility by finding buying opportunities in short-term uptrends and then sell when the securities start to lose momentum.
Then, the investor takes the cash and looks for the next short-term uptrend, or buying opportunity, and repeats the process.
Skilled traders understand when to enter into a position, how long to hold it for, and when to exit; they can also react to short-term, news-driven spikes or selloffs.
Risks of momentum trading include moving into a position too early, closing out too late, and getting distracted and missing key trends and technical deviations.
Divergence + EMAS' + VolumeHi,
This strategy takes in consideration multiple factors: includes RSI divergence, plus cross of EMAs and volume
STRATEGY:
you can change the EMAs input best use for daily charts
BUY: ALERT:
WHEN RSI divergence ABOVE 0 AND EMA 5 CROSS-OVER EMA 12
AND THE CANDLE NEED TO CLOSE ABOVE BOTH MOVING AVERAGE
And THE VOLUME BAR NEED TO BE HIGHER THAN THE PREVIOUS ONE
Then a buy signal will appear
SELL ALERT:
WHEN RSI divergence BELOW 0 AND MA 5 CROSS-UNDER EMA 12
AND THE CANDLE NEED TO CLOSE below BOTH MOVING AVERAGE
THE VOLUME BAR NEED TO BE HIGHER THAN THE PREVIOUS ONE
Then a sell signal will appear
Ema 200 FILTER. :::
When this box is activated, all trades under the EMA 200 will not appear on the chart,, when deactivated, trades will appear. On the chart.
that way u prevent wrong trades. obviously u will need to use support and resistance to find re entry point or the lowest point when under the 200 EMA.
No strategy is perfect but this one get close to it.
VOLUME: the volume box is turn off , only to display or not display in the chart, but is considered on the math within the strategy so by turning off you are only turning off the visual part
any questions feel free to ask, thanks!

Previous High/Low LevelsPrevious High/Low Levels
Select 5 Custom Timeframes to display the previous High and Low levels on your chart.
NOTE: For Levels to work correctly and for price labels to be displayed, Right-click chart background -> select Settings -> select Scales -> tick “Indicator Last Value Label".
Once indicator has been added open settings and select timeframe, color, labels, offset parameters and line style as desired then SAVE.
Handy when using The Strat.

DMT TEMPELTON PECKIntroduction
Bring your A-game to the market in A-Team style with DMT Templeton Peck – you’ll love it when this plan comes together!
Using customized standard deviations between historic price action ranges and volume metrics, DMT Templeton Peck enables traders to never miss a change in trend.
In its default state, the DMT Templeton Peck indicator displays key information, such as:
• Small trend line
• Large trend line
• Position entry prices
• Take profit levels
• Stop levels
• Buy and sell trend signals
In addition to providing core functionality for the indicator’s strategy signals, traders can use this data to enter or exit trades.
When price crosses both trend lines and consolidates there is a high probability that price will continue to move in the same direction. The most profitable results are achieved when trading in the direction of the current large time frame trend.
When small and large trend lines cross a trading signal is generated which can be used to automate trades. Please see the ‘TradingView Alerts’ section of this document for further details.
The Small & Large trend line’s display can be toggled, and their colors modified in the indicator’s style options as shown below.
Basic Strategy
In its simplest form, the strategy is to buy when the price crosses and consolidates above both trend lines and sell when the price crosses and consolidates below both trend lines.
How to Trade
Confident traders may choose to enter a long position at the point
#1 when the price passes above both trend lines and begins to consolidate.
However, the safer trade is to wait for the trend lines to cross at a point
#2 and then look for an entry in the direction of the local trend.
One price action begins to reverse to the downside the strategy reverses. Confident traders may choose to enter point
#3 when the price passes both trend lines and begins to consolidate once again under the previous price action structure that is now acting as resistance.
A sell signal is generated at the point
#4 which produced a small profit; however, a new short position could have been opened when the price retraced to resistance at a point
#5 and experienced a repeated number of strong rejections.
Do not worry if you miss a trade as there is often more than a single opportunity to enter – like at position #5 when price action retests the previous local price structure as resistance.
The indicator can be used on smaller time frames to scalp or find an entry after a larger time frame has signaled, however smaller time frames will also be “choppy” and should only be traded with a paper-tested strategy.
Traders should take profit on positions at resistance & support levels and look to have fully exited the trade by the time the price crosses back over both trend lines and/or loses a previously established price level.
Indicator Tuning
In its default state the indicator is tuned for swing trades using 30 minute & 1 hour time frames, however, you are encouraged to experiment with the indicator options.
Large & Small Length options define how many historic candles are used for the calculation of the relevant trend line.
As a rule of thumb, larger time frames would use smaller values and smaller time frames would use larger values, ie. On a daily chart, a large and small length could be defined as 400 and 100 respectively.
Please be aware that there are limits to the amount of historical data for any intraday level based on your TradingView subscription level:
• Basic – 5000 bars/candles
• Pro & Pro+ - 10000 bars/candles
• Premium – 20000 bars/cables
TradingView Alerts
By utilizing TradingView alerts DMT Templeton Peck's long and short signals can be used to trigger a trading bot.
To trigger a long position, set the TradingView Alert Condition to the DMT Templeton Peck indicator and select the ‘Long’ trigger condition with the ‘Once Per Bar Close’ option for best results.
To trigger a short position, set the TradingView Alert Condition to the DMT Templeton Peck indicator and select the ‘Short’ trigger condition with the ‘Once Per Bar Close’ option for best results.
Take profit options ‘Long_TP_1’ / ‘Short_TP_1’ and Stop options ‘Stop_long’ / ‘Stop_Short’ can also be configured in the same manner to conditionally trigger a trading bot and can be configured in the indicators Input options.

Tweak Strat Candle ColorThis script allows traders to customize candlestick colors based on The Strat trading system developed by Rob Smith.
The script determines if the current candle is an inside bar (1), outside bar (3), directional up (2u) , or directional down (2d).
An inside bar is a candle that trades fully within the previous candle.
An outside bar breaks both the high and the low of the previous candle.
A directional up bar breaks the high of the previous candle but NOT the low of the previous candle.
A directional down bar breaks the low of the previous candle but NOT the high of the previous candle.
The trader can modify the colors they wish to use in the settings menu.
NOTE: You must select "Visual order - Bring to front"
If you do not, the custom colors will disappear when you click the chart window.

Bitcoin BanditIntroducing "Bitcoin Bandit".
The market beating trading algorithm for Bitcoin .
"Bitcoin Bandit" buys and sells based on three proprietary indicators:
• Futures contract data
• Accumulation areas and various moving averages.
• Bitcoin hash rate
The indicator is unique because it doesn't give significant weight to historical price to predict future price action; instead it uses BTC hash rate momentum and futures contract data from BTCUSDPERP (transformed through various internal processes) as proxies for sentiment to look for buy and sell zones, then uses accumulation of moving averages as supporting data for signal delivery.
The strategy was built on two years of Binance data and and backtested on five years of Bitcoin data (Coinbase: BTCUSD ).
Finally, the strategy was validated over multiple investment time frames (5 years, 2 years, 1 year) without prior parameter adjustment.
Strategy backtesting checks include:
• 0.60% trading commission fees (the highest possible).
• No Heiken-Ashi candles (to preserve accuracy)
• No Stop-Losses
• Market orders only
The results speak for themselves.
See the positive excess return from the “Bitcoin Bandit” strategy returns versus a simple Bitcoin “Buy-and-Hold” strategy. "Bitcoin Bandit" is designed to function only on the Daily time frame of the BTCUSD trading pair.
Does it Repaint?
• Our indicator does NOT repaint. Although while setting an alert it may pop up the repaint alert, please take into consideration that once a signal is fired on a "CLOSED BAR", the signals will never disappear, they do not repaint.
What Markets is it usable with?
• BTCUSD on the Daily timeframe .
• Bitcoin Bandit can be applied to any chart or altcoin, but results will be unpredictable as this indicator is designed specifically for Bitcoin trading.
How to use:
• Simply plug and play it to your chart. You can also connect TV alerts with a bot and let it run. Please be aware that SLIPPAGE time is important, If you run a bot on this indicator you HAVE to know that the buy/sell price will be on the bar AFTER the Candle close (For example: the BUY/SELL alert is on a candle, the buy/sell your bot or you will execute WILL be in the following candle depending on your trading system. Bitcoin Bandit only works on the Daily timeframe on the BTCUSD trading pair. Please contact us if you do not understand how to use it.
Disclaimer: Nothing stated is financial advice, and is purely for education purposes. We do not promise all trades are profitable, the use of this indicator is up to your own judgement and liability.
